mega bills finance co., ltd. annual report · 6 consumer price index (cpi) made a year-on-year...
TRANSCRIPT

1 MEGA BILLS FINANCE CO., LTD.
Stock Code: 5842
Website:
Market Observation Post System
http://newmops.tse.com.tw/
Mega Bills Web Site:
http://www.megabills.com.tw
MEGA BILLS FINANCE
CO., LTD.
Annual Report
2016
Mega Holdings

2 MEGA BILLS FINANCE CO., LTD.
Spokesman and Deputy Spokesman for the Corporation Spokesman: Chin-Tsan Wei
Job title: Senior Executive Vice President
Tel. No.: (02)2389-3399
Email: [email protected]
Deputy spokesman: Chih-Hsiung Chiu
Job title: General Manager, Treasury Dept.
Tel. No.: (02)2382-6660
Email: [email protected]
Addresses and Telephone Numbers of the Head Office and Branches Head Office Address:
Tel. No.:
Fax No.:
2-5F, No. 91 Hengyang Road, Taipei City
(02) 2383-1616 (Representative)
(02) 2382-2878 (Administration Department)
Kaohsiung Branch
Address:
Tel. No.:
Fax No.:
3F, No. 420, Cheng Kung 1st Road, Kaohsiung City
(07) 282-5171(5 Lines)
(07) 215-1887
Tainan Branch
Address:
Tel. No.:
Fax No.:
14F-1, No. 307, Sec. 2, Minsheng Road, Tainan City
(07) 228-3131(5 Lines)
(06) 229-3654
Taichung Branch
Address:
Tel. No.:
Fax No.:
4F-1, No.268, Sec. 1, Taiwan Blvd., Taichung City
(04) 2220-2176(5 Lines)
(04) 2222-5424
Hsinchu Branch Address:
Tel. No.:
Fax No.:
3F, No. 307 Peida Road, Hsinchu City
(05) 526-6022(5 Lines)
(03) 524-5544
Taoyuan Branch Address:
Tel. No.:
Fax No.:
3F, No. 32, Sec. 1, Cheng Kung Road, Taoyuan City
(05) 335-8877(5 Lines)
(03) 333-6137
Panchiao Branch
Address:
Tel. No.:
Fax No.:
3F, No. 69, Zhongzhen Road, Panchiao District, New Taipei City
(05) 2965-2836(5 Lines)
(02) 2965-2819
Sanchong Branch Address:
Tel. No.:
Fax No.:
4F, No. 192, Sec. 3, Chongyang Road, Sanchong District, New Taipei City
(05) 2981-1931(5 Lines)
(02) 2980-0374
Taipei Branch Address:
Tel. No.:
Fax No.:
6F, No.123, Sec 2, Zhongxiao East Road, Taipei
(02) 2356-9696(5Lines)
(02) 2391-1717
Organization Handling Stock Transfer Affairs Name: Yuanta Securities Co., Ltd.
Address: B1, No. 210, Sec. 3, Chengde Rd., Taipei City
Website: http://www.yuanta.com.tw/
Tel. No.: (02)2586-3117
Credit Rating Organization Name: Taiwan Ratings Co., Ltd.
Address: 49F, No. 7, Sec. 5, Hsin Yi Road, Taipei (101 Building)
Website: http://www.taiwanratings.com/tw/
Tel. No.: (02)8722-5800
CPA Certifying Financial Statements of Most Recent Year Name: Shu-Mei Ji, CPA Chien-Hung Chou, CPA, and
Firm Name: PricewaterhouseCoopers, Certified Public Accountants
Address: 27F, No. 333, Sec. 1, Keelung Road, Taipei City
Website: http://www.pwc.com/tw/
Tel. No.: (02)2729-6666
Web Site: http://www.megabills.com.tw/

3 MEGA BILLS FINANCE CO., LTD.
Table of Contents
4 Message to Shareholders
15 Profile of the Corporation
18 Corporate Governance Report
50 Capital Overview
55 Overview of Business Operation
71 Financial Information
160 Analysis of Financial Condition and
Financial Performance, and Risk
Management
182 Special Recorded Items

4
Message to Shareholders

5
One. Business Report 2016
I. Global and Local Financial Environment, 2016
During the first half of 2016, the global
economy was undermined by a number of
factors including weak performance from the
world’s advance economies, lack of momentum
in the emerging markets, geopolitical conflicts,
and UK’s vote to exit the European Union (EU)
in June. Financial and trade activities in other
parts of the world were affected as a result,
which contributed to the weak recovery of the
global economy. However, the U.S. economic
indicators picked up in the second half,
showing improvements particularly in terms of
private spending and the employment, while the other major economies also showed
signs of improvement. There are still many uncertainties, such as the U.S. monetary
policy, Trump’s new trade approach, slowing growth of the emerging economies
including China, UK’s exit from EU, geopolitical risks, movement of international oil
and commodity prices, etc., as to whether the global economy is able to continue its
recovery into 2017.
Owing to the recovery of the global economy, the domestic economy began to
stabilize in the second half of 2016, with the Industrial Production Index increasing by
6.25% year-on-year by December 2016, registering an increase for the 5th consecutive
month. Meanwhile, the export growth rate has turned positive since July 2016,
increasing by as much as 14.0% year-on-year in December 2016. Export orders also
turned favorable, reaching a 6.3% growth (in USD terms) year-on-year by December
2016 and registering an increase for the 4th consecutive month. Economic monitoring
indicators published in December 2016 showed a “Green” status for the 6th consecutive
month with the overall score increasing by 2 points to a total of 28. Both leading and
coincident indicators continued to rise, which indicated that the domestic economy is
gradually recovering its lost momentum. With regard to domestic price levels, the

6
consumer price index (CPI) made a year-on-year increase of 1.70% in December 2016,
and is expected to increase further by 1.08% in 2017 to reflect a moderate price pressure.
In the first quarter of 2017, the Directorate-General of Budget, Accounting and
Statistics (DGBAS) estimated Taiwan’s 2016 economic growth rate at 1.50% and the
2017 growth rate at 1.92%. However, given the likelihood of the U.S. adopting
protectionism and the growing tension between China and Taiwan, there remain
uncertainties to the nation’s foreign trade performance, which may adversely affect
economic growth.
In terms of the domestic monetary policy, the Central Bank had decided to remain
the rediscount rate, rate on accommodations with collateral and rate on accommodations
without collateral at 1.375%, 1.75% and 3.625%, respectively, during the 4th quarter
board meeting held on December 22, 2016. The Central Bank chose not to raise interest
rates as the Fed did, because even the domestic economy had shown signs of recovery,
there remain significant uncertainties in Taiwan’s economic performance in 2017.
However, if the Fed decides on a rate hike for the 3rd time in 2017, the Central Bank
may follow and begin raising interest rates in 2017.
II. Organizational changes: None.
III. Results of Implementation of Business Plan and Strategy
Unit: NT$ million
Item Final Accounting
Figure, 2016
Final Accounting
Figure, 2015
Increase/
Decrease (%)
Underwriting and purchasing
bills 2,457,301 2,334,321 5.27
CP2 issued amounts 2,165,844 2,050,131 5.64
Trading volume of bills 8,427,016 8,177,922 3.05
Trading volume of bonds 5,646,907 5,592,022 0.98
Guaranteed issued of CP2
average outstanding balance 152,160 148,882 2.20
Overdue credit amounts 0 0 -
Percentage of overdue credits
(%) 0 0 -

7
IV. Budget Implementation
Unit: NT$ million
Item Final Accounting
Figure, 2016
Budget Figure,
2016
Achievement
rate (%)
Underwriting and purchasing
bills 2,457,301 2,355,944 104.30
CP2 issued amounts 2,165,844 2,089,904 103.63
Trading volume of bills 8,427,016 8,244,313 102.22
Trading volume of bonds 5,646,907 5,599,264 100.85
RP outstanding balance of bills
and bonds 210,810 173,785 121.31
Guaranteed issued of CP2
average outstanding balance 152,160 152,500 99.78
Overdue credit amounts 0 0 -
Percentage of overdue credits
(%) 0 0 -
Net income 2,980 2,630 113.31
V. Financial Income and Expenditure, and Analysis of Profitability
Unit: NT$ million
Item Final Accounting
Figure, 2016 Item
Final Accounting
Figure, 2016
Net revenue 4,322 EPS (NT$) 2.27
Income before tax 3,571 ROA (%) 1.22
Net income 2,980 ROE (%) 8.74
VI. Research and Development
(I) Management
1. Continue perfecting the Company’s paperless conference system and
paperless report management system.
2. Continue making adjustments to the internal performance evaluation
system.

8
(II) Product and Business
1. Studied the feasibility of undertaking RP
transaction of US dollar bonds with life
insurance companies.
2. Applied to the competent authority for
relaxing derivatives transaction scope of
bills finance companies.
(III) Risk Control
1. Planned Basel III system framework and
introduction practice.
2. Continuously enhanced self-assessment system of operational risks and
strengthened risk management regarding various business risk categories.
3. Enhanced implementation and risk monitoring of AML/CFT.

9
Two. Summary of Business Plan 2017
I. Operating Guidelines
(I) Strengthen organization management to improve performance efficiency and
maintain company ranking as market leader.
(II) Implement performance evaluation and strengthen the production efficiency of
human resources.
(III) Implement internal control system and strengthen corporate governance.
(IV) Strengthen risk management and maintain the strong financial condition and
quality of assets.
II. Projection of Business Goals
Unit: NT$ million
Item Budget Figure, 2017
Underwriting and purchasing bills 2,207,630
CP2 issued amounts 1,944,681
Trading volume of bills 7,398,596
Trading volume of bonds 4,500,460
RP outstanding balance of bills and bonds 208,129
Guaranteed issued of CP2 average
outstanding balance 152,000
Projection ground: Projection is based upon current market competition and market
environment, as well as in accordance with the goals set up by parent financial
holding company.
III. Major Business Policies
(I) Capital source and cost reduction: Engaged credit customers in secondary
deals of foreign currency bonds; secured source of foreign currency capital
from domestic financial institutions by engaging them in interbank funding,
currency swaps and repurchase agreements; reduce cost of capital and
increase returns on holding positions without liquidity risks.

10
(II) Expand bills issuance and margin: Monitor the Central Bank’s monetary
policy and movements of the financial market to enable flexible adjustment
of primary and secondary deal rates; manage and expand bills portfolio with
increased margins to maintain leading position in the market.
(III) Deliberate on credit assessment and quality: Pay close attention to
customers’ business/financial performance, industry prospects, and funding
capacity for more robust credit decisions.
(IV) Develop portfolio size and gains: Actively explore opportunities in
syndicated lending, underwriting of non-guarantee commercial papers, NCD,
acquisition of guaranteed or non-guarantee bills underwriting for portfolio
growth and higher gains; build position in foreign currency bonds; diversify
country risk and increase portfolio weight in foreign currency corporate
bonds for higher overall gains and mitigation of U.S. interest rate hike.
(V) Trade frequently and consolidate market position: Secure leading position in
the bills/bonds market through frequent transactions.
(VI) Manage portfolio duration and risk: Manage duration of NTD and foreign
currency bonds for risk avoidance and higher gains; allocate capital for
greater efficiency and enhance the current risk management system.
(VII) Apply technology and improve efficiency: Assist business units in exploring
new customers and potential business opportunities by adopting new
database analysis technologies and integrating external data sources;
continue enhancement of internal information system and operating
efficiency; create a standardized reporting and accounting platform and
improve efficiency of credit investigation, credit extension, credit review
and back-end operations.
(VIII) Introduce innovation and fulfill corporate social responsibility: Expand
business scope by exploring new service types; research and develop big
data applications; promote the use of paperless conference system and

11
paperless report management system as a means to cut back resource usage
and fulfill corporate social responsibilities.
IV. Future Development Strategies
(I) Strengthen the position as market leader of the bills and bonds business.
(II) Build a profitable bonds portfolio. Expand trading of repurchase agreements
and secure profitability with the use of derivatives.
(III) Enhance operation efficiency by reducing cost of funding and expanding
interest spread.
(IV) Ensure regulatory compliance through enhanced internal controls and
internal audit systems.
(V) Make efficient allocation of capital; strengthen existing risk management
and systems.
(VI) Continue efforts in talent development and nurturing.
(VII) Introduce new services and expand service reach.
(VIII) Work with Mega Financial Holding Company to integrate the information
system and share information services.
(IX) To integrate the group resources and explore the synergy of cross-selling.
V. Effect of external competitive environment, regulatory environment and
overall operating environment.
(I) The United States is expected to continue raising interest rates in the next year,
which may cause the USD to strengthen and motivate some primary market
customers to borrow NTD to repay USD debts, thus increases demand for
NTD capital. Furthermore, corporate customers will be more willing to hold
U.S. dollars as it strengthens, which presents the opportunity of channeling
customers’ USD capital into the Company’s foreign currency bonds position.
(II) The authority has relaxed restrictions with regards to the range and limit of
foreign currency bonds that can be traded by bills finance companies. This
development will provide the Company with greater flexibility in building up

12
and profiting from foreign currency bond positions.
(III) The authority has permitted general investors to trade in NTD-denominated
corporate bonds and bank debentures listed on the professional board, and
repurchase agreements listed on the foreign board. It provides bills finance
companies with broader access to capital, which helps grow bonds services.
(IV) The lack of investor confidence and economic momentum in Taiwan
combined with the growth of the Chinese supply chain and protectionism in
the U.S. have made the business environment all the more difficult.
Furthermore, globalization has made credit customers’ business performance
and financial position more susceptible to market changes, causing an overall
reduction in profit margins and increased credit risks.
(V) Increasing variety of funding channels are being introduced into the financial
market, while banks continue to expand the domestic credit portfolio at a low
interest rate, particularly when the Chinese market and wealth management
segment no longer contributes the level of profitability they are used to, some
of which have even attained the bills financing license to underwrite
non-guarantee commercial papers in the primary market, which posed direct
competition against specialized bills finance companies.
(VI) Due to limitations by capital adequacy and liquidity coverage ratios, the
banking system has been conservative about long-term interbank funding and
transactions in the secondary market, which affect the market’s capital supply
and cause higher interest rate volatility in short-term instruments completed at
month-end and quarter-end.
(VII) Out of expectations that the Central Bank may follow the Feds in raising the
interest, both long-term and short-term market interest rates have already
begun to rise, which signify the beginning of a series of interest rate hikes to
come. This development has the worst effect on a bills finance company not
only because of the tightened money supply, but the increase in RP cost and
interbank funding cost would also erode much of the Company’s margins.
(VIII) Although the global economy is showing signs of recovery, there are still

13
many factors that need to be monitored closely, particularly those that involve
uncertainties in Trump’s decisions, as increased volatility will undermine the
Company’s trade performance in the domestic equity and bonds markets.
Three. Most Recent Credit Rating and Date of Rating
Credit Rating
Organization
Long-Term Credit
Rating
Rating
Outlook
Short- Term Credit
Rating
Date of
Announcement
Taiwan Ratings Corp. twAA Stable twA-1+ 2016.10.13
Four. Appreciation and Prospect
Last year, the Company had been able to maintain its market leadership and surpass
not only its annual earnings target, but also the profitability of its peers as well. This was
largely attributed to the efforts of our employees and the guidance and support of our
directors, supervisors and parent holding company.
In the future, the Company and its employees shall remain committed to the values of
“integrity, stability, innovation, growth, efficiency and sustainability”, and contribute to
society, environment, economy and shareholders of the financial group by directing attention
towards corporate social responsibilities, sustainable business, internal control, risk
management and compliance.
Best wishes for all of you
Health and Happiness,
Chairman of the Board President and CEO
Chang-Ruey Shiau Chi-Fu Lin

14
Chairman of the Board, President and Headquarter Management Team Photography
Mega Bills Finance Co., Ltd. received Outstanding Prize of the “Best Bills Finance Company Award”
in the “8th Taiwan Banking and Finance Best Practice Awards”

15
Profile of the Corporation

16
I. Founded: May 3, 1976
II. Company History
(I) May 20, 1976, started business, with paid-in capital of NT$200 million.
(II) January 5, 1981, relocated the head office to an acquired property at Section 2,
Nanjing East Road, Taipei City.
(III) June 26, 1990, completed an initial public offering that increased paid-in capital
to NT$2.88 billion.
(IV) February 28, 2000, relocated the head office to “Chung Hsing Bills Tower” at
Section 2, Zhongxiao East Road, Taipei City; share capital was increased to
NT$28.11 billion later in May.
(V) June 12, 2002, a resolution was passed during the regular meeting of shareholders
to have the Company merged into Chiao Tung Financial Holding Company
through a share exchange arrangement. The exchange of shares took place on
August 22 later in that year.
(VI) December 31, 2002, Chiao Tung Financial Holding Company, the parent
company, was renamed Mega Financial Holding Company.
(VII) September 1, 2004, share capital was reduced by $3 billion to NT$25.11 billion.
(VIII) May 3, 2005, share capital was reduced by $5 billion to NT$20.11 billion.
(IX) May 2, 2006, relocated the head office to 2F~5F, 9F and 10F, No. 91 Hengyang
Road, Taipei City.
(X) June 26, 2006, the Company was renamed Mega Bills Finance Co., Ltd. in
alignment with other subsidiaries of Mega Financial Holding Company.
(XI) July 2, 2007, share capital was reduced by $5 billion to NT$15.11 billion.
(XII) August 3, 2009, share capital was reduced by $2 billion to NT$13.11 billion.
(XIII) November 1, 2012, received “Best Bills Finance Company Award” in the “6th
Annual Taiwan Excellent Financial Elite Award” directed by the Financial
Supervisory Commission and organized by the Taiwan Academy of Banking and
Finance.
(XIV) October 31, 2014, received “Best Bills Finance Company Award” in the “7th

17
Annual Taiwan Excellent Financial Elite Award” directed by the Financial
Supervisory Commission and organized by the Taiwan Academy of Banking and
Finance.
(XV) November 1, 2016, received Outstanding Prize of the “Best Bills Finance
Company Award” in the “8th Taiwan Banking and Finance Best Practice
Awards” directed by the Financial Supervisory Commission and organized by the
Taiwan Academy of Banking and Finance.

18
Corporate Governance Report

19
I. Organizational Structure
Risk Control Department
(Risk Management)
(Credit Examination)
Credit Department
(Credit investigation)
(Planning)
Branches
(Business Promotion)
(Kaohsiung, Tainan, Taichung,
Hsinchu, Taoyuan, Banqiao,
Sanchong, Taipei)
Administration Department
(Affairs of the Board of
Directors)
(Personnel Management)
(General Affairs &
Administration)
Electronic Data Processing
Department
(Computer & Information
Management)
Bills Department
(Primary market and secondary
market businesses)
(Allocation of fund)
(Loan Business Development
and Promotion)
Bonds Department
(Primary market and secondary
market businesses)
(Equity Commodity Tradings)
(Derivative tradings)
(Derivative Instrument
Transactions)
Treasury Department
(Accounting & Cashier)
(Settlement Operation)
Audit Office of Board of
Directors
(Internal Auditing System)
Board of
Directors
Chairman of
the Board
Chairman of
the Board
General Shareholders
Meeting
General Auditor
Personnel Evaluation
Committee
Risk Management Committee
Credit Assessment Committee
Senior
Executive Vice President
Personal Data File
Security Maintenance
Committee
Senior
Executive
Vice President
Legal Affairs and Compliance
Department
(Legal Affairs)
(Compliance)
President and
CEO
Supervisors
Meeting

20
II. Information about the Directors, Supervisors, President and CEO, Senior Executive Vice
Presidents, Executive Vice Presidents, and Executives of each Department and Branch-
Office
(I) Directors and Supervisors
1. Information about directors and supervisors (1)
March 31, 2017
Job Title
(Note 1)
Country or
place of
registration
Name Gender
Date of
Election
(Appointment
)
Term of
Office
(Note 2)
Date of
First
Election
(Appoint
ment)
Current
Share
Holding
Main Educational and Professional
Background
Current Posts Held at
Other Companies
Concurrent to MBF Post
Other
Executive
Officers,
Directors or
Supervisors
Within Two
Degrees of
Kinship of
Self or
Spouse
Education Experience
Chairman of
the Board
Republic of
China
Chang-Ru
ey Shiau
(Note 3)
Male 2016.08.31 2018.03
.01 2016.08.31
(Note 1)
Department of
Law, National
Chung Hsing
University
President of Taiwan
Financial Holding Co.,
Ltd.; Acting President of
Bank of Taiwan Co.,
Ltd.; Head of Fiscal,
Statistical and Financial
Affairs, Executive Yuan;
Counselor of Executive
Yuan and 4th Division
Chief; Chief Secretaryof
the Financial
Supervisory
Commission; Deputy
Director General of the
Banking Bureau;
Member of Petition
Reviewing Commission,
Executive Yuan; Director
of Taiwan Cooperative
Financial Holding Co.,
Ltd.; Director of Taiwan
Cooperative Bank Co.,
Ltd.
None
None
Director and
President
Republic of
China
Chi-Fu
Lin Male 2015.03.02
2018.03
.01 2015.03.02
Department of
Public Finance,
National Chung
Hsing University
Vice President, MBF,
Assistant Vice President
and manager of Bills
Department
None
Independent
Director
Republic of
China
Tsai-Chih
Chen Female 2015.03.02
2018.03
.01 2010.02.26
PHD of
Insurance,
Wharton School,
University of
Pennsylvania
Associate professor of
Dept. of Risk
Management and
Insurance of National
Chengchi University
(NCCU);Dean of Dept.
of Risk Management
and Insurance of
NCCU; President of
Graduate Institute of
Risk Management and
Insurance of NCCU
Professor of Dept. of
Risk Management and
Insurance, NCCU
Independent
Director
Republic of
China
Yi-Jui
Huang
(Note 4)
Male 2016.10.26 2018.03
.01 2016.10.26
Ph.D., Jinan
University
Certified CPA of
Solomon & Co.;
Chairman of Kaohsiung
City CPA Association;
Standing Director of
Taiwan CPA
Association; Director of
Neoflex Technology
Co., Ltd.
Owner of Solomon &
Co.; Chairman of Taiwan
CPA Association;
Supervisor of Huaku
Development Co., Ltd.;
Director of Ma Kuang
Healthcare Holding
Limited; Chairman of
Weidu Investment Co.,
Ltd.; Supervisor of
i-Kiddo Co., Ltd.;
Supervisor of Ma Kuang
International
Development Co., Ltd.;
Director of e-Family Co.,
Ltd.; Supervisor of
PChome Online Inc.

21
Director Republic of
China
Jui-Yun
Lin Female 2015.03.02
2018.03
.01 2006.04.06
Master, Graduate
Institute of Public
Finance, NCCU
Ministry of Finance -
Auditor of National
Treasury
Administration,
Ministry of Finance;
Section Chief of
Taxation
Administration; Head
of Accounting Division,
Chiao Tung Bank;
Executive Vice
President of Treasury
Department, Mega
Holdings; Director of
Mega Holdings;
Supervisor of Mega
Bank; Standing
Director and Standing
Supervisor of Taiwan
Business Bank;
Chairman of Chung
Kuo Insurance Co.,
Ltd.; Chairman of
Nuclear Energy
Insurance Pool of the
Republic of China
Senior Executive Vice
President of Mega
Holdings; Chairman and
President of Mega
Venture Capital Co.,
Ltd.; Director of Mega
Charity Foundation;
Director of Taipei
Financial Center
Corporation; Standing
Director of Non-life
Insurance Association of
the Republic of China
Director Republic of
China
Ruey-Yuan
Fu
(Note 5)
Female 2017.03.29 2018.03
.01 2017.03.29
EMBA, National
Chengchi
University
Yonghe Branch
Manager, Nanking East
Road Branch Manager,
and Central Branch
Manager of Mega Bank;
Chairman of ICBC
Assets Management &
Consulting Co., Ltd.;
Chairman of
SmartVision Co., Ltd.
Vice President of Mega
Bank; Director of
EXCEL Chemical Corp;
Director of Taiwan
Asset Management Co.,
Ltd.
Director Republic of
China
Zong-Ming
Yen Male 2015.03.02
2018.03
.01 2014.06.24
Master of
Economics,
Soochow
University
Head of National
Science Council Science
Park Administration,
part-time associate
professor-grade
technician of National
Chiao Tung University,
Executive Director of
Asian Science Parks
Association, Director of
International association
of Science Parks, and
head of Industrial and
Commercial Section,
head of Investment
Section, and deputy head
of Science Park
Administration,
part-time lecturer of
Chung Hua University
Department of
Technology
Management, and
advisor for Hsinchu City
Government
Director of Wind Online
Corporation, Vice
Chairman of Wholetech
System Hitech Limited,
Supervisor of Ablerex
Electronics Co., Ltd.,
visiting professor of
Hsuan Chuang
University postgraduate
business administration
program, Consultant of
Chinese Professional
Management
Association of Hsinchu
Director Republic of
China
Chun-Hsi
ang Lee Female 2015.03.02
2018.03
.01 2015.03.02
Master of
Accounting,
University of
Illinois
Executive Vice
President, Manager and
Deputy Manager of
Finance Department,
Mega Bank; President of
Cathay Investment &
Development
Corporation (Bahamas)
Vice President of Mega
Bank; Supervisor of
Chung Kuo Insurance
Co., Ltd.; Director of
China Products
Company; Director of
ICBC Assets
Management &
Consulting Co., Ltd.;
Director of Taipei Forex
Inc.; Director of Cathay
Investment &
Development
Corporation (Bahamas);
Director of Overseas
Investment &
Development Corp.;
Director of Global
Venture Investment Co.,
Ltd.; Chairman of Win
Card Co., Ltd.

22
Supervisor Republic of
China
Fu-Jung
Chen
(Note 6)
Female 2016.09.30 2018.03
.01 2016.09.30
Department of
Agricultural
Economics,
National Taiwan
University
Minsheng Branch
Manager, Sydney
Branch Manager,
Xindian Branch
Manager, Lanya Branch
Manager, and Executive
Vice President/Head of
Wealth Management
Division, Mega Bank;
Director of Win Card
Co., Ltd.; Director of
Synmax Biochemical
Co., Ltd.; Director of
Hua Sheng Venture
Capital Co., Ltd.
Chief Auditor of Mega
Bank; Supervisor of
Mega International
Investment Trust Co.,
Ltd.
Supervisor Republic of
China
Chun-Ke
Su
(Note 6)
Male 2016.09.30 2018.03
.01 2016.09.30
Department of
International
Trade, College of
Commerce,
National Taiwan
University
Datong Branch Manager,
Osaka Branch Manager,
Tokyo Branch Manager,
Head of Credit Analysis,
and COO of 1st
Northern Operations
Center, Mega Bank
Executive Vice President
and Head of Credit
Control, Mega Bank;
Director of China
Products Company;
Director of JADS Comm.
Co., Ltd.; Director of
ShineMore Technology
Materials Corporation.;
Director of Mega Asset
Management Co., Ltd.
Supervisor Republic of
China
Jin-Cun
Chen
(Note 7)
Male 2015.09.01 2018.03
.01 2015.09.01
Ph.D. of
Engineering
(Finance Major),
National Taiwan
University of
Science and
Technology
Dean of College of
Finance, Takming
University of Science
and Technology;
Standing Supervisor of
Mega Bank; Supervisor
of Hua Nan Financial
Holdings; Director and
Standing Director of
First Commercial Bank
Ltd; Director and
Independent Director of
Chunghwa Telecom Co.,
Ltd.; Supervisor of Joint
Credit Information
Center; Head of
Management Center,
Head of General Affairs,
Acting President and
Professor of National
Central University;
member of Consultative
Committee, Central
Deposit Insurance
Corporation
Supervisor of Mega
Securities; Supervisor of
Taipei Rapid Transit
Corporation; Consultant,
Sector Chief Editor and
Deputy General Editor of
Taiwan Academy of
Banking and Finance;
Ombudsman Officer of
Financial Ombudsman
Institution; Professor of
College of Finance,
Takming University of
Science and Technology
Note:
1. The Company’s total number of shares is 1,311,441,084 shares. The Company is a wholly owned subsidiary of Mega Financial Holding Co., Ltd and
its directors and supervisors are all appointed by the representative of Mega Holdings.
2. The Company’s 14th board of directors and supervisors were appointed by Mega Holdings on 2015.2.24 to serve a term from 2015.3.2 until 2018.3.1.
The 14th board of directors (including independent directors) and supervisors is comprised of: Chairman Feng-Chi Ker, Director/President Chi-Fu Lin,
Independent Director Tsai-Chih Chen, Independent Director Tai-Lung Chen, Director Zong-Ming Yen, Director Jui-Yun Lin, Director To-Ching Hu,
Director Chun-Hsiang Lee, Supervisor Dan-Hun Lu, Supervisor Ching-Lung Hung, and Supervisor Jia-Min Hung.
3. Chairman Feng-Chi Ker retired on 2016.08.31, while Mr. Chang-Ruey Shiau was appointed director by Mega Holdings on 2016.8.31. During the 23rd
meeting of the 14th board of directors held on 2016.8.31, Director Chang-Ruey Shiau was elected Chairman of the Company.
4. Independent Director Tai-Lung Chen resigned from position on 2016.10.01, and Mr. Yi-Jui Huang was appointed independent director by Mega
Holdings later on 2016.10.26.
5. On 2017.3.29, Mega Holdings appointed Madam Ruey-Yuan Fu to replace Director To-Ching Hu.
6. On 2016.9.30, Mega Holdings appointed Madam Fu-Jung Chen and Mr. Chun-Ke Su to replace Supervisors Dan-Hun Lu and Ching-Lung Hung.
7. On 2015.9.01, Mega Holdings appointed Mr. Jin-Cun Chen to replace Supervisor Jia-Min Hung.

23
2. Major shareholders of corporate shareholders
Book closure date: December 31, 2016
Name of Corporate
shareholder
Major shareholders of Corporate shareholders (with shareholding among the top 10)
Shareholding
Mega Financial
Holding Co., Ltd.
Ministry of Finance 8.40%
National Development Fund, Executive Yuan 6.11%
Chunghwa Post Co., Ltd. 3.50%
Fubon Life Insurance Co., Ltd. 3.47%
Cathay Life Insurance Co., Ltd. 2.98%
Bank of Taiwan Co., Ltd. 2.46%
Nan Shan Life Insurance Company Ltd. 1.80%
China Life Insurance Company Limited 1.69%
Pou Chen Corporation 1.41%
Government of Singapore 1.29%
3. Major Shareholders of Major Corporate Shareholders
Shares transfers suspended on: December 31, 2016
Name of corporate entity Key shareholders of corporate entity (Note) Shareholding
Ministry of Finance Government
National Development Fund,
Executive Yuan Government
Chunghwa Post Co., Ltd. Ministry of Transportation and Communications 100.00%
Fubon Life Insurance Co.,
Ltd. Fubon Financial Holding Co., Ltd. 100.00%
Cathay Life Insurance Co., Ltd. Cathay Financial Holding Co., Ltd. 100.00%
Bank of Taiwan Co., Ltd. Taiwan Financial Holding Co., Ltd. 100.00%
Nan Shan Life Insurance
Company Ltd.
First Bank in its Capacity as Trustee of Ruen Chen
Investment Holding
Ruen Chen Investment Holding
Ying-Zong Du
Ruen Hua Dyeing & Weaving Co., Ltd.
Ruentex Leasing Co., Ltd.
Wen-Te Kuo
Jipin Investment Co., Ltd.
Bao Chi Investment Co., Ltd.
Bao Yi Investment Co., Ltd.
Bao Hui Investment Co., Ltd.
Bao Huang Investment Co., Ltd.
76.46%
14.16%
3.24%
0.27%
0.14%
0.10%
0.10%
0.05%
0.05%
0.05%
0.05%

24
China Life Insurance Company Limited
KGI Securities Co., Ltd.
Cathay Life Insurance Co., Ltd.
Government of Singapore
City of New York Group Trust
JPMorgan Chase Bank N.A. Taipei Branch in
custody for Saudi Arabian Monetary Agency
Videoland Inc.
HSBC Bank (Taiwan) Limited in its Capacity as
Master Custodian for Investment Account of
Invesco Asia Equity Fund
Citibank Taiwan in its Capacity as Master
Custodian for Investment account of the Central
Bank of Norway
Hermes Investment Funds Public Limited
JPMorgan Chase Bank N.A. Taipei Branch in
custody for ABU DHABI Investment Authority
9.64%
2.99%
2.78%
2.69%
2.52%
2.35%
1.43%
1.32%
1.31%
1.29%
Pou Chen Corporation
PC Brothers Corporation
Quan Mao Investment Co., Ltd.
Red Magnet Developments (BVI) Ltd.
Kai Tai Investment Co., Ltd.
Taishin International Bank in its Capacity as
Trustee for Property Account of Chi-Jui Tsai
Fubon Life Insurance Co., Ltd.
Bank of Taiwan entrusted with Investment
Account of UOB Kay Hian Private Company
Mega International Commercial Bank in its
Capacity as Master Custodian for Investment
Account of Mega Securities (Hong Kong) Co.,
Ltd.
Standard Chartered Bank in its Capacity as Master
Custodian for Development Bank of Singapore -
0600049662
Government of Singapore
7.24%
5.55%
4.60%
4.55%
3.46%
3.22%
2.51%
1.86%
1.82%
1.73%
Note: Top 10 shareholders

25
4. Information about directors and supervisors (2)
March 31, 2017
Criteria
Name
Meet one of the following professional qualification
requirements,
together with at least five years work experience Independence criteria (Note)
Number of
other public
companies in
which the
director/supervi
sor serves as
independent
directors
concurrently
Lecturer or
higher senior
post at public
or private
junior college
in fields related
to business,
law, finance,
accounting or
other fields that
the company’s
businesses
might require
Judges, prosecutors,
lawyers, accountants
or other specialist
professional and
technical staff
possessing
certificates national
examinations in
other fields required
by the company’s
businesses
Work
experience
required for
business,
law, finance,
accounting
or
corporation
business
1 2 3 4 5 6 7 8 9 10
Chang-Ruey
Shiau ˅ ˅ ˅ ˅ ˅ ˅ ˅ ˅ 0
Chi-Fu Lin ˅ ˅ ˅ ˅ ˅ ˅ ˅ ˅ ˅ 0
Tsai-Chih
Chen ˅ ˅ ˅ ˅ ˅ ˅ ˅ ˅ ˅ ˅ ˅ ˅ 0
Yi-Jui Huang ˅ ˅ ˅ ˅ ˅ ˅ ˅ ˅ ˅ ˅ ˅ 0
Jui-Yun Lin ˅ ˅ ˅ ˅ ˅ ˅ ˅ 0
Ruey-Yuan
Fu ˅ ˅ ˅ ˅ ˅ ˅ ˅ ˅ 0
Zong-Ming
Yen ˅ ˅ ˅ ˅ ˅ ˅ ˅ ˅ ˅ ˅ ˅ 0
Chun-Hsiang
Lee ˅ ˅ ˅ ˅ ˅ ˅ ˅ ˅ 0
Fu-Jung Chen ˅ ˅ ˅ ˅ ˅ ˅ ˅ 0
Chun-Ke Su ˅ ˅ ˅ ˅ ˅ ˅ ˅ 0
Jin-Cun Chen ˅ ˅ ˅ ˅ ˅ ˅ ˅ ˅ ˅ ˅ 0
Note: Requirements to be met by each director and supervisor two years before their selection and appointment and for the duration of their
tenure of the post.
1. Not employed by the Company or any of its affiliated companies.
2. Not a director or supervisor of the Company or any of its affiliated companies (unless he/she is an independent director of the
Company or its parent company or any subsidiary companies in which the Company directly or indirectly holds more than 50% of the
shares with voting right).
3. Neither himself, his spouse, nor any non-adult male or female child of himself, either in his own or anybody else’s name holds more
than one percent of the Company’s shares, or serves as one of the Company’s top-ten natural person shareholders.
4. Not a spouse, a relative to the second degree or closer, or a direct kin to the third degree or closer to anyone listed in the three
preceding criteria.
5. Not a director, supervisor or employee of corporate shareholders directly holding more than five percent of issued shares of the
Company or ranking among the first five corporate shareholders.
6. Not a director, supervisor, or manager of a specific company or organization with financial or business dealings with the Company, or
a shareholder of such a specific company or organization holding more than five percent of the shares.
7. Not a professional, business owner, partner, director, supervisor, or manager of any sole-proprietorship, partnership, company, or
institution providing commercial, legal, financial or accounting services or consultation to the bills finance company or any of its
affiliated companies; nor a spouse to anyone listed herein. However, this shall not apply to the remuneration committee members who
exercise their powers in accordance with Article 7 of the Regulations on the Establishment of Remuneration Committees by
TWSE/GTSM Listed Companies and their Exercise of Powers.
8. Not a spouse of, or related within the second degree of consanguinity to, any other director.
9. Free from any circumstances referred to in Article 30 of the Company Act.
10. Not have been elected by government, a juridical person or representatives thereof as stipulated by Article 27 of the Company Act.

26
(II) Information about President and CEO, Senior Executive Vice Presidents, Executive Vice Presidents, and Executives of each Department
and Branch Office
March 31, 2017
Title Nationality Name Gender Date of Election
(Appointment)
Shareholdings Shareholdings of
spouse and underage children
Shares held by proxy Main Educational and
Professional Background
Current post held
concurrently in other
companies
Other General Managers within two degrees of
kinship of self or spouse
Quantity Shareholdings Quantity Shareholdings Quantity Shareholdings Education Experience Job Title
Name Relationship
President and CEO Republic of
China Chi-Fu Lin Male 2015.03.02 - - - - - -
Department of Public Finance, National Chung Hsing University
Senior Executive Vice President, Executive Vice President and General Manager of the Bills Department, MBF
- - - -
Senior Executive Vice President
Republic of China
Chin-Tsan Wei
Male 2006.09.08 - - - - - - Dept. of Accounting, Fu Jen University
Executive Vice President, Mega Holdings
- - - -
Senior Executive Vice President
Republic of China
Ching-Wen Wu
Male 2009.01.05 - - - - - -
Department of Business Administration, Feng Chia University
Executive Vice President , MBF and General Manager, Bills Dept., MBF
- - - -
Senior Executive Vice President and General
Auditor
Republic of China
Yi-Sheng Wang
Male 2013.07.01 - - - - - -
Dept. of Banking, Tamkang University
Executive Vice President and General Manager, Risk Control Dept.
- - - -
Executive Vice President
and General Manager, Risk Control Department
Republic of China
Yao-Kuang Tsai
Male 2016.07.04 - - - - - -
Dept. of Banking, Tamkang University
Executive Vice President and Kaohsiung Branch Manager of the Company
- - - -
Executive Vice President
and General Manager, Bills Department
Republic of China
Chin-Sheng Huang
Male 2016.07.04 - - - - - -
Master, Graduate Institute of Engineering, National Taiwan University of Science and Technology
Executive Vice President and General Manager, Risk Control Dept.
- - - -
Executive Vice President
and General Manager, Bonds Department
Republic of China
Chun-Chang Lee
Male 2015.02.02 - - - - - -
Master of Commerce, National Taiwan
Executive Vice President and General Manager,
- - - -

27
University Administration Department, MBF
Executive Vice President
and General Manager, Electronic Data
Processing Department
Republic of China
Hsi-Bin Yo Male 2014.05.16 - - - - - -
Master, Graduate Institute of Engineering, National Taiwan University of Science and Technology
General Manager, Electronic Data Processing Department, MBF
- - - -
General Manager, Treasury Department
Republic of China
Chih-Hsiung Chiu
Male 2011.03.01 - - - - - -
Master, Graduate Institute of Accounting, Tamkang University
Deputy General Manager, Treasury Dept. MBF
- - - -
General Manager, Credit Department
Republic of China
Shuo-Cheng Lee
Male 2013.03.08 - - - - - -
Master, Graduate Institute of Economics, National Taiwan University
Deputy General Manager, Risk Control Dept. MBF
Director, Core Pacific
City Co., Ltd.
- - -
General Manager, Administration
Department
Republic of China
Ming-Pao Wang
Male 2016.03.01 - - - - - -
Master, Graduate Institute of Accounting and Taxation, Feng Chia University
Acting manager of Administration Department
- - - -
Legal Affairs and Compliance Department
General Manager
Republic of China
Cheng-Bi Dai
Female 2017.01.03 - - - - - -
Department of Agriculture Promotion, National Taiwan University
Acting Manager of Legal Affairs and Compliance Department of the Company
- - - -
Executive Vice President
and General Manager, Kaohsiung Branch
Republic of China
Tsung-Chung Lin
Male 2016.07.04 - - - - - -
Dept. of Business Administration, Chung Yuan Christian University
Executive Vice President and Tainan Branch Manager of the Company
- - - -
Executive Vice President
and General Manager, Tainan Branch
Republic of China
Jung-Kun Wu
Male 2016.07.04 - - - - - - Department of Banking, NCCU
Executive Vice President and Taichung Branch Manager of the Company
- - - -
Executive Vice President
and General Manager, Taichung Branch
Republic of China
Ming-Chih Cheng
Male 2016.07.04 - - - - - -
Ph.D. in International Relations, Jinan
Executive Vice President, and General Manager,
- - - -

28
University Banqiao Branch, MBF
General Manager, Hsinchu Branch
Republic of China
Kun-Shui Lin
Male 2013.03.08 - - - - - -
Master of Business Administration, I-Shou University
General Manager, Chiayi Branch, MBF
- - - -
General Manager, Taoyuan Branch
Republic of China
Shih-Ming Wang
Male 2014.07.01 - - - - - -
Master of Finance, Tamkang University
Deputy General Manager, Risk Control Dept. MBF
- - - -
General Manager, Sanchong Branch
Republic of China
Shih-Yi Chen
Male 2014.07.01 - - - - - -
MBA, Katholieke Universiteit Leuven
General Manager, Taoyuan Branch, MBF
- - - -
Executive Vice President
and Banqiao Branch manager
Republic of China
Jung-Chieh Cheng
Male 2016.07.04 - - - - - -
Master of Commercial Automation and Administration, National Taipei University of Technology
Executive Vice President , MBF and General Manager, Bills Dept., MBF
- - - -
General Manager, Taipei Branch
Republic of China
Jia-Chi Shao Male 2015.06.01 - - - - - -
Department of Accounting and Statistics, Shih Chien College of Design (3-year program)
Mega Bills Finance - Senior Officer of Taipei Branch
- - - -

29
III. Remuneration paid to directors, supervisors, President and CEO, and Senior Executive Vice Presidents in the most recent year
(I) Remuneration to directors (including independent directors)
December 31, 2016; unit: NT$ thousands
Title Name
Remuneration to Director Total of (A),
(B), (C) and
(D) in
Post-Tax Profit
Ratio
Remuneration Drawn by Employees Holding Concurrent Posts Total of
(A), (B),
(C), (D),
(E), (F) and
(G) in
Post-Tax
Profit Ratio
Whether
remuneration is
also drawn from
non-subsidiary
companies in
which the
company has
invested
Remuneration
(A) Pension (B)
Remuneration
(C)
Professional
practice
expenses (D)
Salaries,
bonuses and
special
allowances (E)
Pension (F) Employee remuneration (G)
The
Company
All
companies
included in
the financial
statements
The
Company
All
companies
included in
the financial
statements
The
Company
All
companies
included in
the financial
statements
The
Company
All
companies
included in
the financial
statements
The
Company
All
companies
included in
the financial
statements
The Company
All
companies
included in
the financial
statements
The
Company
All companies
included in the
financial
statements
The Company
All companies
included in the
financial statements The
Company
All
companies
included
in the
financial
statements
Amount
paid in cash
Amount
paid in
shares
Amount
paid in cash
Amount
paid in
shares
Chairman
of the
Board
Chang-Ruey
Shiau (Note 1)
Director Chi-Fu Lin
Independent
Director Tsai-Chih Chen
Independent
Director
Yi-Jui Huang
(Note 2)
Director Jui-Yun Lin
Director Zong-Ming Yen
Director Chun-Hsiang Lee
Former
Director
Feng-Chi Ker
(Note 1)
Former
Director To-Ching Hu
Former
Independent
Director
Tai-Lung Chen
(Note 2)
Total 7,718 7,718 - - - - 2,071 2,071 0.33 0.33 6,754 6,754 - - - - - - 0.55 0.55 NONE
Note:
1. Chairman Feng-Chi Ker retired on 2016.08.31, while Mr. Chang-Ruey Shiau was appointed director by Mega Holdings on 2016.8.31. During the 23rd meeting of the 14th board of directors held on 2016.8.31, Director

30
Chang-Ruey Shiau was elected Chairman of the Company.
2. Independent Director Tai-Lung Chen resigned from his position on 2016.10.01, and Mr. Yi-Jui Huang was appointed independent director by Mega Holdings later on 2016.10.26.
3. Directors’ remuneration (including independent directors) was accurate as at 2016.12.31.
4. Housing and vehicle lease payments were included in “professional practice expenses (D)”. For relevant information, please refer to Schedules A and B on page 33.
5. Performance bonus to senior management and employees’ remuneration were estimated figures. The actual amount is subject to parent company’s approval.
6. Compensation received by directors for providing service to any company included in the financial statements (e.g. consultancy service without the title of an employee) in the last year, except those disclosed in the above table:
NT$0.
Scales of Remuneration
Directors’ remuneration bracket
Director’s Name
Total of A+B+C+D Total of A+B+C+D+E+F+G
The Company All companies included in the financial
statements The Company
All companies included in the financial
statements
Below NT$ 2,000,000
Chi-Fu Lin, Jui-Yun Lin, To-Ching
Hu, Zong-Ming Yen, Chun-Hsiang
Lee, Tsai-Chih Chen, Yi-Jui
Huang, Tai-Lung Chen
Chi-Fu Lin, Jui-Yun Lin, To-Ching
Hu, Zong-Ming Yen, Chun-Hsiang
Lee, Tsai-Chih Chen, Yi-Jui
Huang, Tai-Lung Chen
Jui-Yun Lin, To-Ching Hu,
Zong-Ming Yen, Chun-Hsiang Lee,
Tsai-Chih Chen, Yi-Jui Huang,
Tai-Lung Chen
Jui-Yun Lin, To-Ching Hu,
Zong-Ming Yen, Chun-Hsiang Lee,
Tsai-Chih Chen, Yi-Jui Huang,
Tai-Lung Chen
NT$2,000,000 ~ NT$5,000,000 Chang-Ruey Shiau, Feng-Chi Ker Chang-Ruey Shiau, Feng-Chi Ker Chang-Ruey Shiau, Feng-Chi Ker Chang-Ruey Shiau, Feng-Chi Ker
NT$5,000,000 ~ NT$10,000,000 Chi-Fu Lin Chi-Fu Lin
NT$10,000,000 ~ NT$15,000,000
NT$15,000,000 ~ NT$30,000,000
NT$30,000,000 ~ NT$50,000,000
NT$50,000,000 ~ NT$100,000,000
NT$ 100,000,000 and above
Total (NT$ Thousands) 9,789 9,789 16,543 16,543
Note: This remuneration bracket table is accurate as at 2016.12.31

31
(II) Remuneration to Supervisors
December 31, 2016; unit: NT$ thousands
Title Name
Supervisors’ remuneration Sum of A, B, C, and D as a
percentage of after-tax profits
Remuneration is also drawn from
non-subsidiary
companies in which the company has
invested businesses
other than the subsidiaries
Remuneration (A) Pension (B) Remuneration (C) Professional practice expenses (D)
The
Company
All
companies
included in the financial
statements
The
Company
All
companies
included in the financial
statements
The
Company
All
companies
included in the financial
statements
The
Company
All companies included in the
financial
statements
The
Company
All
companies
included in the financial
statements
Supervisor Jin-Cun Chen
Supervisor Fu-Jung Chen
(Note)
Supervisor Chun-Ke Su
(Note)
Former Supervisor Dan-Hun Lu
(Note)
Former Supervisor Ching-Lung
Hung (Note)
Total - - - - - - 843 843 0.03 0.03 NONE
Note: On 2016.9.30, Mega Holdings appointed Madam Fu-Jung Chen and Mr. Chun-Ke Su to replace Supervisors Tan-Hun Lu and Ching-Lung Hung.
Scales of Remuneration
Supervisor’ remuneration bracket
Supervisor’s Name
Total of A+B+C+D
The Company All companies included in the financial statements (E)
Below NT$ 2,000,000 Jin-Cun Chen, Fu-Jung Chen, Chun-Ke Su, Dan-Hun Lu, Ching-Lung Hung Jin-Cun Chen, Fu-Jung Chen, Chun-Ke Su, Dan-Hun Lu, Ching-Lung Hung
NT$2,000,000 ~ NT$5,000,000
NT$5,000,000 ~ NT$10,000,000
NT$10,000,000 ~ NT$15,000,000
NT$15,000,000 ~ NT$30,000,000
NT$30,000,000 ~ NT$50,000,000
NT$50,000,000 ~ NT$100,000,000
NT$ 100,000,000 and above
Total (NT$ Thousands) 843 843
Note: This remuneration bracket table is accurate as at 2016.12.31

32
(III) Remuneration to the President and CEO and Senior Executive Vice Presidents
December 31, 2016; unit: NT$ thousands
Title Name
Salary (A) Pension (B) Bonus and allowance etc.
(C) Employee remuneration (D)
Total of (A), (B), (C) and (D) in Post-Tax
Profit Ratio (%)
Whether remuneration
is also drawn
from non-subsidiary
companies in
which the company has
invested
The
Company
All companies
included
in the financial
statements
The
Company
All companies
included
in the financial
statements
The
Company
All companies
included in
the financial
statements
The Company All companies included
in the financial
statements The
Company
All companies
included
in the financial
statements
Amount
paid in cash
Amount
paid in shares
Amount
paid in cash
Amount
paid in shares
President and
CEO Chi-Fu Lin
Senior Executive
Vice President Chin-Tsan Wei
Senior Executive
Vice President Ching-Wen Wu
Senior Executive
Vice President
And General
Auditor
Yi-Sheng Wang
Total Total 9,772 9,772 - - 9,082 9,082 3,717 - 3,717 - 0.76 0.76 None
Note:
1. President and Senior Executive Vice Presidents’ remuneration were accurate as at 2016.12.31.
2. Performance bonus and employees’ remuneration were estimated figures. The actual amount is subject to parent company’s approval.
3. Refer to Schedules A and B on page 33 for details relating to company vehicles, gas and housing subsidies.
Scales of Remuneration
President and CEO and Senior Executive Vice Presidents’ remuneration brackets Names of President and CEO and Senior Executive Vice Presidents
The Company All companies included in the financial statements
Below NT$ 2,000,000
NT$2,000,000 ~ NT$5,000,000
NT$5,000,000 ~ NT$10,000,000 Chi-Fu Lin, Chin-Tsan Wei, Ching-Wen Wu, Yi-Sheng Wang Chi-Fu Lin, Chin-Tsan Wei, Ching-Wen Wu, Yi-Sheng Wang
NT$10,000,000 ~ NT$15,000,000
NT$15,000,000 ~ NT$30,000,000
NT$30,000,000 ~ NT$50,000,000
NT$50,000,000 ~ NT$100,000,000
NT$ 100,000,000 and above
Total (NT$ Thousands) 22,571 22,571

33
Schedule A. Vehicles provided to Chairman of the Board, Presidents and CEO, and
Senior Executive Vice Presidents, and imputed annual rent thereof in 2016
December 31, 2016; unit: NT$ thousands
Title User Purchase of
Vehicle Imputed
Annual Rent Fuel
Expense Remarks
Chairman of the Board
Chang-Ruey Shiau
- 2,134 135 Rental
President and CEO
Chi-Fu Lin
Senior Executive Vice
President Chin-Tsan Wei
Senior Executive Vice
President Ching-Wen Wu
Senior Executive Vice President And
General Auditor
Yi-Sheng Wang
Former Director
Feng-Chi Ker
Note:
Drivers’ salary and overtime pay totaling NT$1,454,000 were paid in 2016 as
compensation for the Chairman’s and President’s services.
Schedule B. Housing allowance provided for the Chairman, the President, and Senior
Executive Vice Presidents in 2016
December 31, 2016; unit: NT$ thousands
Title User Cost Imputed Annual Rent Remarks
Chairman of the Board
Chang-Ruey Shiau -
733.5
President and CEO
Chi-Fu Lin -
Former Chairman
Feng-Chi Ker -

34
(IV) Names of managers entitled to employee remuneration and amount entitled
December 31, 2016; unit: NT$ thousands
Title Name Amount paid in
shares
Amount paid in
cash Total
As a percentage of
after-tax profit (%)
Senior Executive
Vice President
Chin-Tsan Wei
Senior Executive
Vice President
Ching-Wen Wu
Senior Executive
Vice President and
General Auditor
Yi-Sheng Wang
Executive Vice
President
Yao-Kuang Tsai
Executive Vice
President
Chin-Sheng
Huang
Executive Vice
President
Chun-Chang
Lee
Executive Vice
President
Tsung-Chung
Lin
Executive Vice
President
Jung-Chieh
Cheng
Executive Vice
President
Hsi-Bin Yo
Executive Vice
President
Jung-Kun Wu
Executive Vice
President
Ming-Chih
Cheng
General Manager Chih-Hsiung
Chiu
General Manager Kun-Shui Lin
General Manager Shuo-Cheng
Lee
General Manager Ming-Pao
Wang
General Manager Shih-Yi Chen
General Manager Shih-Ming
Wang
General Manager Cheng-Bi Dai
General Manager Jia-Ji Shao
Total - 14,843 14,843 0.5
(V) Analysis of remuneration paid to directors, supervisors, the President and Vice
Presidents
1. Remuneration to directors, supervisors, the President and Senior Executive Vice
Presidents as a percentage of net income.
The sum of remuneration paid to the Company’s directors, supervisors, President
and Vice Presidents represented 1.11% of net income in 2015 and 2016.
2. Remuneration policies, standards, packages and procedures, and relevance to risks
and future business performance.
The Company’s directors and supervisors have been entirely appointed by the sole
shareholder - Mega Financial Holding Co., Ltd. The Chairman and the director
who co-heads the President position are remunerated according to the policies of

35
the Company and its parent company for services rendered; independent directors
are remunerated within limits set by the parent company; all other directors and
supervisors are given compensation and travel allowances only for meetings
attended. Senior Executive Vice Presidents are remunerated based on performance,
subject to the Company’s policies.
IV. Corporate governance:
(I) Functionality of the board of directors:
15(A) Board of directors meetings were held last year; attendance records are shown below:
Title Name
Attendance
in Person
(B)
Attendance
by Proxy
Actual Attendance
Rate (%) 【B/A】 Remarks
Chairman of the
Board
Chang-Ruey
Shiau
5 1 83 Elected on 2016.8.31
Director and
President Chi-Fu Lin 15 0 100
Independent
Director
Tsai-Chih
Chen 15 0 100
Independent
Director Yi-Jui Huang 3 0 100
On board since
2016.10.26
Director Jui-Yun Lin 15 0 100
Director To-Ching Hu 15 0 100
Director Zong-Ming
Yen 15 0 100
Director Chun-Hsiang
Lee 12 3 80
Former Chairman Feng-Chi Ker 9 0 100 Retired on 2016.8.31
Former
Independent
Director
Tai-Lung
Chen
11 0 100 Discharged on
2016.10.01
Former Director To-Ching Hu 15 0 100 Discharged on
2017.3.29
Other notes to be specified:
I. Any board meeting that exhibits the conditions listed in Article 14-3 of the Securities and Exchange Act, or any
documented objections or qualified opinions raised by the independent director against board resolutions in
relation to matters other than those described above: None.
II. Avoidance of conflicting-interest agendas by directors:
(I) 14th meeting of the 14th board held on January 26, 2016: Motion to underwrite non-guarantee
commercial paper of Mega Asset Management Co., Ltd.; Chairman Feng-Chi Ker had abstained from
voting and the discussion.
(II) 15th meeting of the 14th board held on February 23, 2016: 1. Motion to fund charity activities of “Mega
Charity Foundation” by way of a donation, for which Director Jui-Yun Lin had abstained from all
discussions and voting in relation to the agenda. 2. Motion to underwrite non-guarantee commercial
papers of Mega Financial Holding Co., Ltd.; Director Jui-Yun Lin abstained from voting and the
discussion.
(III) 16th meeting of the 14th board held on March 22, 2016: Proposal to grant Shin Ruenn development Co.,
Ltd. and Hsi Hua Construction Co., Ltd. the credit limit to issue guaranteed commercial paper to.;

36
Independent Director Tai-Lung Chen and Director Chun-Hsiang Lee had abstained from the discussions
and voting on this agenda.
(IV) 20th meeting of the 14th board held on June 28, 2016: Proposal to grant Yue Ma Investment No. 2 Co.,
Ltd. the credit limit to issue guaranteed commercial paper; Independent Director Tai-Lung Chen and
Director Chun-Hsiang Lee had abstained from the discussions and voting on this agenda.
(V) 21st meeting of the 14th board held on July 26, 2016: Proposal to grant Jun Tai Development and
Construction Co., Ltd. and Gogoro Energy Network (Cayman) Taiwan Branch the credit limit to issue
guaranteed commercial paper; Independent Director Tai-Lung Chen and Director Chun-Hsiang Lee had
abstained from the discussions and voting on this agenda.
(VI) 22nd meeting of the 14th board held on August 23, 2016: Proposal to grant Chan Cheng Development
Co., Ltd., Te Shuo Construction Co., Ltd., and Hsin Yuan Enterprise Co., Ltd. the credit limit to issue
guaranteed commercial paper; Director Chun-Hsiang Lee and Independent Director Tai-Lung Chen had
abstained from the discussions and voting of this agenda.
(VII) 24th meeting of the 14th board held on September 29, 2016: Proposal to grant YeaShin International
Development Co., Ltd. and SinoPac Leasing Co. the credit limit to issue guaranteed commercial paper ;
Director Chun-Hsiang Lee (absent) and Independent Director Tai-Lung Chen had abstained from the
discussions and voting on this agenda.
(VIII) 25th meeting of the 14th board held on October 25, 2016: Proposal to underwrite (or purchase)
non-guarantee commercial papers of Mega Securities Co., Ltd.; Supervisor Jin-Cun Chen had abstained
from the discussions and voting on this agenda.
(IX) 27th meeting of the 14th board held on November 22, 2016: Proposal to engage National Chengchi
University in an industry-academia collaboration agreement and pay academia compensations;
Independent Director Tsai-Chih Chen had abstained from the discussions and voting on this agenda.
III. Enhancements to the functionality of board of directors in the current and the most recent year (e.g.
establishment of an Audit Committee, improvement of information transparency, etc.), and the progress of such
enhancements: None.

37
(II) Supervisors’ involvements in board of directors meetings:
15 (A) Board of directors meetings were held last year; attendance records are shown below:
Title Name Attendance in Person (B) Actual Attendance Rate (%)
【B/A】 Remarks
Supervisor Fu-Jung Chen 4 100 On board since
2016.09.30
Supervisor Chun-Ke Su 3 75 On board since
2016.09.30
Supervisor Jin-Cun Chen 15 100
Former
Supervisor Dan-Hun Lu 11 100
Discharged on
2016.09.30
Former
Supervisor
Ching-Lung
Hung 11 100
Discharged on
2016.09.30
Other notes to be specified:
I. Constitution and obligations of supervisors:
(I) Supervisors’ communication with employees and shareholders (e.g. communication channels and
methods): supervisors are able to communicate with the Company’s employees and shareholders via
written correspondence, telephone, fax and other appropriate means.
TEL: (02)2563-3156/FAX: (02)2356-9801/Address: 5F, No. 123, Section 2, Zhongxiao East Road, Taipei
City 100
(II) Supervisors’ communication with Chief Auditor and external auditors (e.g. the details, means and outcomes
of discussion regarding the Company’s financial position and business performance): the Company’s
internal audit reports and financial statements are submitted regularly for review by supervisors.
Supervisors may also initiate communication with the Chief Auditor and external auditors via meetings,
written correspondence, telephone, fax or other appropriate means. In addition, supervisors may be invited
to participate in board of directors meeting to gain more insight on the agendas discussed as well as the
Company’s financial position and business performance.
II. Opinions expressed by supervisors in board meetings; state the date and term of the meeting held, the agenda,
the board’s resolution, and how the company has responded to supervisors’ opinions: None.
(III) Corporate governance information: please refer to the “Statutory Disclosure” section
on the Company’s website (http://www.megabills.com.tw/)

38
(IV) Corporate governance execution status and deviation from “Corporate Governance
Best-Practice Principles for Bills Finance Companies”
Item
Status Non-compliance with Corporate
Governance Practice Regulations for
Bills Finance Companies, and reasons
for such non-compliance Yes No Summary description
1. Shareholding structure and
shareholders’ interests
(1) Are shareholders’ suggestions,
queries, disputes and litigations
handled properly?
V
1. The Company is a 100%-owned subsidiary of Mega
Holdings. All above matters are handled according to the
policies of Mega Holdings.
2. Mega Holdings is the Company’s sole shareholder; the
identity of the Company’s ultimate controller can be
established via the parent company.
3. The Company is entirely independent from affiliated
entities in terms of personnel, assets, and financial
decisions. The parent company’s “Mega Group Risk
Management Policy and Guidelines” and “Mega Holdings
and Subsidiaries Firewall Policy” govern dealings with
affiliated entities.
(1) Information security: the Company has established the
transaction authority and file access rights as means of
control.
(2) Confidentiality of customers’ information: accesses to
customers’ information are subject to proper
authorization before proceeding. Customers’ consents
are obtained before their information can be used and
shared for joint marketing purposes. The Company has
established confidentiality agreements with other
subsidiaries of the group to ensure the secrecy of
customers’ information.
(3) Related party transactions: the Company maintains a
list of related parties and reports transactions regularly
to the parent company - Mega Holdings, through which
related party disclosures are made to the authority.
Compliant with “Corporate
Governance Practice Principles for
Bills Finance Companies”.
(2) Is the company constantly
informed of the identities of its
major shareholders and the
ultimate controller?
V
(3) Has the company established and
implemented risk management
practices and firewalls for
companies it is affiliated with?
V
2. Constitution and obligations of
the board of directors
1. The Company has 8 directors, 2 of whom are independent
directors. All directors are appointed by the parent company
- Mega Holdings.
Compliant with “Corporate
Governance Best-Practice Principles
for Bills Finance Companies”. (1) Does the company have
independent directors in place?
Has the company assembled
other functional committees?
V
2. The Company is a 100%-owned subsidiary of Mega
Holdings. Its directors and supervisors are entirely
appointed by Mega Holdings, while all major decisions are
referred to the board of directors. The Company currently
does not have other functional committees in place.
3. The Company evaluates independence of its external
auditors at the time of appointment.
(2) Are external auditors’
independence assessed on a
regular basis?
V
3. Whether the company is a
TWSE/TPEx listed company, has
the company designated a
department or personnel that
specializes (or is involved) in
corporate governance affairs
(including but not limited to
providing directors/supervisors
with the information needed to
perform their duties, convention
of board meetings and
shareholder meetings, company
registration and changes,
preparation of board meeting and
shareholder meeting minutes,
etc.)?
V The Company is not listed on TWSE or TPEx, and hence does
not have any department or personnel that specializes (or is
involved) in corporate governance affairs.
Compliant with “Corporate
Governance Best-Practice Principles
for Bills Finance Companies”.
4. Does the company have means
of communication with its
stakeholders (including but not
limited to shareholders,
employees and customers)?
V The Company adopts an open policy that facilitates
communication with stakeholders at any time.
Compliant with “Corporate
Governance Best-Practice Principles
for Bills Finance Companies”
5. Information disclosure 1. The Company has made a Statutory Disclosures section on
its website to disclose important information such as
financial reports, business performance, interest rate
quotations, corporate governance, and credit rating.
Compliant with “Corporate
Governance Best-Practice Principles
for Bills Finance Companies” (1) Has the company established a
website that discloses financial,
business, and corporate
governance-related information?
V

39
(2) Has the company adopted other
means to disclose information
(e.g. English website, assignment
of specific personnel to collect
and disclose corporate
information, implementation of a
spokesperson system,
broadcasting of investor
conferences via the company
website)?
V 2. Other means of information disclosure
(1) The Company has published an English version of the
annual report on its website.
(2) The Company has assigned dedicated personnel to
gather, maintain and update information published in
various sections of its website.
(3) The Company has “Spokesperson and Acting
Spokesperson Policy” in place to prohibit employees
from speaking for the Company, thereby making sure
that information is disseminated according to proper
procedures.
(4) The Company is not listed on TWSE or TPEx; its
information is disclosed via the parent company - Mega
Holdings.
6. Other information relevant to corporate governance practices:
(1) Employee welfare: enforced in accordance with Labor Standards Act and the Company’s work rules.
(2) Employee care: the Company has an Employee Welfare Committee in place to handle matters such as labor insurance, national health insurance,
group insurance, workers’ health and safety, health checks, wedding and funeral subsidies etc.
(3) Investor relations: the Company is a 100%-owned subsidiary of Mega Holdings, which is the sole investor.
(4) Stakeholders’ interests: the Company adopts an open policy that enables employees, customers and vendors to reflect opinions via telephone,
physical mail, email, or the customer complaint hotline.
(5) Directors’ and supervisors’ education: Courses completed by directors/supervisors include: “Sound Corporate Governance through Protection of
Business Secrets and Prevention of Fraud”, “Protection of Business Secrets”, “Corporate Governance Framework and Board of Directors’
Responsibilities”, “Risk Management, Internal Control and Information Management Practice”, “Audit Committee and Remuneration Committee
Practice”, “Detecting Fraud in Financial Statements”, “Insight to Corporate M&A Laws”, “Corporate M&A - A Director’s/Supervisor’s
Perspective”, “Fiduciary Duty - Implications of Directors’ and Supervisors’ Obligations”, “Board Functionality and Effect of Resolution”,
“Prevention of Insider Trading and Case Studies”, and “Opportunities and Risks of the Digital Trend” organized by Taiwan Corporate Governance
Association; “Advance to New Generation - Digital Banking Transformation”, “Unveiling Secrets to Corporate Financial Statements”, “The 45th
Audit Manager Workshop”, “2016 Financial Management Conference”, and “U.S. Bank Secrecy Act and Money Laundering Control Act
Conference (Session 1)” organized by Taiwan Academy of Banking and Finance; “Introduction to U.S. Anti-money Laundering Laws” organized by
Mega Bank; and “Tax Impact Analysis on New Real Estate Tax System and Joint Construction/Partial Sale Project (Tainan)”, “Application and
Challenges of Fiscal Big Data (Kaohsiung)”, “2016 Company Act and Company Registration Seminar”, and “Useful Business Accounting
Principles and New Tax Perspectives (Part 2)” organized by the Taiwan CPA Association. .
(6) Meeting attendance by directors and supervisors: all directors and supervisors have attended board meetings as required by policy.
(7) Risk management policies and risk assessment standards: the Company has been assessing business risks in accordance with the authority’s
instructions and rules of the parent company - Mega Holdings. It has set risk limits on the various types of activities it performs and monitors to
ensure that necessary measures are taken for the safety and performance of the Company. Credit review meetings, Risk Management Committee
meetings and various other meetings are held regularly to ensure the effectiveness of risk management policies and evaluate strengths and
weaknesses of existing risk practices. This enables the Company to flexibly adjust its control measures in line with the changing circumstances.
(8) Consumer and customer protection: based upon the “Financial Consumer Protection Act” developed by Financial Supervisory Commission and the
“Derivative Self-discipline for Bills Finance Companies” developed by Bills Finance Association, the Company has implemented a set of “Bills on
Transaction Disputes and Customer Grievance” that outlines the rules the Company is bound to comply with respect to consumers’ and customers’
interests. The “Bill/Bond Repurchase Master Agreement” has made a comprehensive description of the Company’s obligations and claims that
consumers and customers are entitled to enforce. An opinion mailbox has been provided on the Company’s website while service hotlines are made
available as means of contact for consumers and customers.
(9) Directors and supervisors’ liability insurance: coverage has been procured according to policies.
(10) Social responsibilities: refer to the section titled “Fulfillment of Social Responsibilities”.
7. Please explain the improvements made, based on the latest Corporate Governance Evaluation results published by TWSE Corporate Governance Center,
and propose enhancement measures for any issues that are yet to be rectified. (Not required as the Company is not subject to evaluation)
The Company is not listed on TWSE or TPEx; it is not subject to evaluation and hence this does not apply.

40
(V) Fulfillment of Social Responsibilities
Item Status
Yes No Summary description
1. Sound corporate governance 1. The Company is a 100%-owned subsidiary of Mega Holdings; its CSR report is
prepared collectively by the parent company on a group level. The Company has
not implemented any CSR policy or system, but it conducts daily business activities
in accordance with the group’s “Corporate Social Responsibilities Policy” and the
Company’s “Governance Code of Conduct”. Some of the initiatives taken by the
Company to fulfill corporate social responsibilities include implementing sound
corporate governance, complying with laws, providing employees with healthy
work environment and reasonable compensation, adopting environmental friendly
solutions, and participating in charitable activities.
2. The Company organizes at least 3 internal training sessions per year on a wide
range of topics including enhancement of professional skills, regulatory
compliance, workplace health and safety, employer’s and employees’ rights, and
corporate responsibilities.
3. All CSR matters are managed by the Company’s Administration Department, from
corporate governance, human resources, charity activities, environmental policy, to
complying with government regulations.
4. The Company’s “Work Rules” and “Performance Appraisal Guidelines” have
outlined a reasonable compensation scheme, which is communicated to employees
via internal meetings and training programs. The Work Rules and Performance
Appraisal Guidelines have conformed to the Company’s corporate social
responsibility policy in terms of employee welfare, performance assessment, reward
and discipline, regulatory compliance, work ethics and business integrity.
(1) Does the company have a corporate
social responsibility policy or system in
place? Is progress reviewed on a regular
basis?
V
(2) Does the company organize social
responsibility training on a regular
basis?
V
(3) Does the company have a unit that
specializes (or is involved) in CSR
practices? Is the CSR unit run by senior
management and reports its progress to
the board of directors?
(4) Has the company implemented a
reasonable remuneration system that
associates employees’ performance
appraisals with CSR? Is the
remuneration system supported by an
effective reward/discipline system?
V
V
2. Fostering a sustainable environment 1. Guided by the parent company’s “Corporate Social Responsibility Principles”, the
Company has pledged itself to obeying regulations and international standards for
the protection of natural environment. It aims to achieve the most efficient use of
resources and is committed to using reusable materials for the sustainability of
Earth’s resources. The Company’s environmental protection policies were set out to
achieve the following: (1) Reduce use of water, electricity and petrol. (2) Replace
use of paper with digital process. (3) Make green procurements and use products
with environmental certifications. (4) Recycle or dispose of waste properly.
2. As a financial service provider, paper accounts for the majority of resources used
by the Company and presents the largest impact on the environment. To reduce the
volume of paper consumed, the Company has been adopting new practices from
electronic forms, paper-less conferences, to reusing paper. Gas, water, electricity
and petrol are the main sources of energy used by the Company, for which a variety
of volume controls has been imposed on elevators, corridor lighting, air
conditioning and water supply during off-peak hours, while company vehicles are
subjected to regular maintenance to minimize the impacts they have on the
environment.
3. Environmental affairs are managed collectively by the Administration Department
and individually at branch level. Each unit is bound to comply strictly with energy
policies set forth by their building administrators. In 2016, the Company used
1.40% lesser power and 3.45% lesser fuel.
(1) Is the company committed to achieving
efficient use of resources, and using
renewable materials that produce less
impact on the environment?
V
(2) Has the company developed an
appropriate environmental management
system, given its distinctive
characteristics?
V
(3) Is the company aware of how climate
changes affect its business activities?
Are there any actions taken to measure
and reduce greenhouse gas emission
and energy use?
V
3. Enforcement of public welfare
(1) Has the company developed its policies
and procedures in accordance with laws
and International Bill of Human
Rights?
(2) Does the company have means through
which employees may raise
complaints? Are employee complaints
being handled properly?
(3) Does the company provide employees
with a safe and healthy work
environment? Are employees trained
regularly on safety and health issues?
V
V
V
1. Compliance with labor laws and internationally-recognized workers’ rights; the
measures and procedures adopted to protect employees’ legal rights and to ensure
equality in employment; and how these measures are implemented:
(1) Reasonable compensation and bonus/remuneration scheme for employees.
(2) Employee training programs.
(3) Insurance and leave policy.
(4) Pension contributions.
(5) The Company makes no gender distinctions when hiring staff, and is
committed to ensuring equal employment opportunities for both genders. The
Company hires disabled persons in compliance with the law and has
implemented internal policies to facilitate sexual harassment complaints and
investigations.
2. The Company’s “Bills on Employee Suggestions and Complaints” has outlined the

41
Item Status
Yes No Summary description
(4) Does the company have means to
communicate with employees on a
regular basis, and inform them of
operational changes that may be of
significant impact?
(5) Has the company implemented an
effective training program that helps
employees develop skills over their
career?
(6) Has the company implemented
consumer protection and grievance
policies concerning its research,
development, procurement, production,
operating and service activities?
(7) Has the company complied with laws
and international standards with regards
to the marketing and labeling of
products and services?
(8) Does the company evaluate suppliers’
environmental and social conducts
before commencing business
relationships?
(9) Is the company entitled to terminate
supply agreement at any time with a
major supplier, if the supplier is found
to have violated its corporate social
responsibilities and caused significant
impacts against the environment or the
society?
V
V
V
V
V
V
appropriate procedures for making complaints; the confidentiality measures are in
place to protect employees from retaliation; and the scope and subjects against
which complaints or suggestions can be raised.
3. The following initiatives have been taken to ensure workplace health and safety:
(1) Annual employee health checks.
(2) Implementation of “Bills on Prevention of Sexual Harassment” as a
complaint channel and a means to maintain order in the workplace.
(3) Accidental insurance and health insurance for employees and family
members.
(4) Implementation of safety protocols and emergency responses, which are
rehearsed on a yearly basis and revised in regular meetings.
4. Presence of a communication channel between the company and its employees, and
the means through which employees are notified of material changes in the
company’s operations:
(1) The Company communicates regularly with its employees through
daily/weekly/monthly meetings and reporting sessions, during which the
senior management exchanges opinions with unit managers and staff about
where the Company is progressing. Proceedings of these meetings are
recorded in the NOTES system to serve as reference for future decisions.
(2) Any changes of internal policy, employment terms or organization that are
material to employees’ interests will be discussed during employer-employee
meetings and implemented with consensus from both sides. Details of such
meetings are also recorded in the NOTES system.
(3) Furthermore, the Company has established “Bills on Employee Suggestions
and Complaints” to introduce broader means of communication.
5. The Company’s “Work Rules” and “Staff Promotion Review Principles” provide
detailed job descriptions, skills criteria, education, promotion opportunities and
other information relevant to the employees’ career development.
6. Pursuant to FSC Letter No. Jin-Kuan-Fa-Zi-1040054727 dated May 25, 2015,
financial institutions are required to develop consumer dispute resolution systems
and implement them with the approval of the board of directors. To ensure fair and
efficient resolution of customers’ disputes involving financial transactions while at
the same time protect financial consumers’ interests, the Company has revised its
“Notes on Transaction Disputes and Customer Grievance” based on FSC’s
“Financial Consumer Protection Act” and later renamed the policy as “Financial
Consumer Dispute Resolution Rules”. The Rules outline the Company’s duty to
abide to the contractual terms agreed with customers, as well as standardized
procedures for handling consumer disputes. Consumers can hold the Company
liable for violation against the rules. An opinion mailbox has been provided on the
Company’s website while service hotlines are made available as a means to express
grievances. All complaints are handled by the Company’s Administration
Department.
7. All marketing, labeling, advertising, solicitation and promotional activities relating
to products and services are conducted in accordance with the “Regulations
Governing Advertising, Business Solicitation and Promotion” and in conformity
with common ethical standards and integrity.
8. The Company requires all renovation works to be carried out using as many
environmental friendly materials and construction methods as possible, and all
office equipment to be certified by the Environmental Protection Administration.
When making future procurement of office equipment and supplies, the Company
will take into account suppliers’ commitment to environmental protection, energy
conservation, carbon reduction, mitigation of environmental impacts, and
fulfillment of corporate social responsibilities.
9. The Company follows the practices of its parent company by demanding all
contractors to sign a “Declaration of Corporate Social Responsibility” as a
commitment to: (1) Comply with labor regulations and globally recognized
workers’ rights, and to protect employees’ rightful interests (including freedom of

42
Item Status
Yes No Summary description
association and collective bargaining) without discrimination in terms of gender,
race, age, marital and family status. (2) Implement and strictly enforce workplace
health and safety policies. (3) Prohibit use of child labor (under 16 years of age) and
forced labor of any kind. (4) Adopt energy-saving solutions while continually
improve and innovate to minimize impacts on the environment. (5) Comply with
minimum legal requirements on waste disposal, handling of hazardous materials,
and discharge of waste. All suppliers are required to issue declarations of
commitment to the above. Furthermore, to enforce suppliers’ corporate social
responsibilities, all procurement contracts are drafted with a clause that reads: “If
the supplier is proven to have committed any violation against the terms of the
corporate social responsibility policy that results in significant impact against the
environment or the community from which the supply is originated, the Company
shall be entitled to terminate or cancel the contract at any time”.
10. Involvements in community development and charitable activities:
(1) The Company has collaborated with several universities to offer internships
for students.
(2) Financially sponsored Mega Charity Foundation.
(3) Sponsored charity event: “Loving Financial Institutions – Food (Kind) Bank”
by making the 3rd and 4th donations.
(4) Sponsored Economic Daily News in hosting “2016 Masters Forum”, and
invited Angus Deaton, who won the Nobel Memorial Prize in Economic
Sciences in 2015, to deliver a speech.
(5) Sponsored Mega Holdings and National Tax Bureau of the Central Area in
hosting “2016 MOF Run - Changhua” at Lukang Stadium, Changhua County.
(6) Made donations to “Taitung County Government Social Aid Account” to
assist Taitung County Government in the reconstruction work from the
aftermath of Typhoon Nepartak.
4. Enhanced information disclosure
Has the company disclosed relevant and
reliable CSR information on its website
and at the Market Observation Post
System?
V
The Company’s social responsibility activities are disclosed in annual reports and on the
Company’s website.
5. If the company has established code of conducts in accordance with “Corporate Social Responsibility Best-Practice Principles for
TWSE/GTSM-Listed Companies”, please describe its current practices and any deviations from the Best-Practice Principles: None
6. Other information relevant to the understanding of corporate social responsibilities: None
7. Describe the criteria undertaken by any institution to certify the company’s CSR report: None
(VI) Fulfillment of Ethical Corporate Management
Item
Actual governance
Yes No Summary description
1. Formulate integrity policies and solutions
(1) Has the company stated in its Articles of
Incorporation or external correspondence about the
policies and practices it has to maintain business
integrity? Are the board of directors and the
management committed to fulfilling this
commitment?
V
1. The Company has based its business philosophy upon “integrity,
pragmatism, service, efficiency, innovation and growth”. It adopts
principles of the parent company’s “Integrity Manual” and places
integrity ahead of all business strategies. Meanwhile, the
Company implements sound corporate governance and risk
management practices to create a sustainable business
environment.
2. According to the Work Rules, employees who are found to have
violated laws or committed acts of fraud, embezzlement, etc. will
be subject to disciplinary actions such as warning, demotion or
involuntary dismissal; misconducts may even be referred to the
(2) Does the company have any policies against
dishonest conducts? Are these policies enforced by
proper procedures, behavioral guidelines, disciplinary
actions and complaint systems?
V

43
Item
Actual governance
Yes No Summary description
(3) Has the company taken steps to prevent occurrences
listed in Article 7, Paragraph 2 of “Ethical Corporate
Management Best-Practice Principles for
TWSE/TPEx-Listed Companies” or business
conducts that are prone to integrity risks?
V justice system if they involve criminal liabilities. “Bills on
Employee Suggestions and Complaints” have clearly outlined the
scope and procedures through which employees may raise their
complaints.
3. According to the Work Rules and parent company’s “Integrity
Manual”, directors, managers and employees are prohibited from
accepting treatments, gifts, kickbacks or illegal benefits of any
kind in relation to their duties and neither are they permitted to
exploit their positions for personal gains or gains of others, or to
engage in private financial arrangements with customers of the
Company.
2. Fulfillment of Ethical Corporate Management
(1) Does the company evaluate the integrity of all
counterparties it has business relationships with? Are
there any integrity clauses in the agreements it signs
with business partners?
V
1. All daily business activities are carried out in a fair and
transparent manner. The Company checks credit records such as
returned check history to avoid dealing with less-credible
counterparties; furthermore, the Company may terminate
agreements at any time if a counterpart is found to have been
involved in dishonest behaviors.
2. The Company has taken steps to improve corporate governance by
developing compliance systems, internal controls, audit practices
and risk management measures, and by enhancing board of
directors’ functionalities, supervisors’ authorities, information
transparency, and dedication to stakeholder interests.
3. The Company has developed a compliance system based on
“Implementation Rules of Internal Audit and Internal Control
System of Financial Holding Companies and Banking Industries”
to institute business integrity. Meanwhile, directors, supervisors,
managers and employees are encouraged to raise suggestions
regarding conducts of integrity.
4. The Company has developed its accounting system based on the
authority’s policies, and prepared financial reports in accordance
with generally accepted accounting principles and Financial
Statement Preparation for Public Listed Bills Finance Companies.
No secret accounts are kept outside of those reported in the
financial statements. For proper internal controls, the Company
has explicitly required cash disbursements and bookkeeping
activities to be performed by different persons, whereas trading
and settlement responsibilities need to be clearly separated. To
reduce chances of dishonest behaviors in high-risk activities, the
Company’s “Leave Policy” requires all employees to take a leave
of absence for at least three consecutive days in a year, while
internal auditors have been assigned to perform regular audits on
employees’ compliance with the above requirement.
5. Courses on regulatory compliance, internal controls and business
integrity have been included as part of the training program.
(2) Does the company have a unit that specializes (or is
involved) in business integrity? Does this unit report
its progress to the board of directors on a regular
basis?
V
(3) Does the company have any policy that prevents
conflict of interest, and channels that facilitate the
reporting of conflicting interests?
(4) Has the company implemented effective accounting
and internal control systems for maintaining
business integrity? Are these systems reviewed by
internal or external auditors on a regular basis?
(5) Does the company organize internal or external
training on a regular basis to maintain business
integrity?
V
V
V
3. Reporting malpractice 1. The Company’s “Bills on Employee Suggestions and Complaints”
has outlined the appropriate procedures for making complaints,
the confidentiality measures are in place to protect employees
from retaliation and the scope and subjects against which
complaints or suggestions can be raised. Employees may raise
suggestions and complaints verbally or in writing, telephone,
email or other appropriate means to the head of Administration
Department or any trusted manager.
2. Bills on Employee Suggestions and Complaints have clearly
outlined the scope of which suggestions and complaints can be
made, including but not limited to: business development, lack of
management, operational defects, regulatory or policy violations,
fraud, corruption, bribery, blackmailing, mistreatment, health and
(1) Does the company provide incentives and means for
employees to report malpractices? Does the
company assign dedicated personnel to investigate
the reported malpractices?
V
(2) Has the company implemented any standard
procedures or confidentiality measures for handling
reported malpractices?
V
(3) Does the company assure malpractice reporters that
they will not be mistreated for making such reports?
V

44
Item
Actual governance
Yes No Summary description
safety issues, concealment or misstatement of facts, etc.
Suggestions and complaints are reported to the President
immediately upon knowledge and are handled by specialized
personnel. All parties are required to maintain secrecy and ensure
timely processing of the complaints they receive.
3. Suggestions and complaints are subject to independent
investigation and are handled in a fair manner according to laws
and the Company’s policies. In the event that a complaint leads to
the discovery of inappropriate or illegal conducts, the Company
will impose disciplinary actions and legal actions, if applicable,
against those who are responsible. In the meantime, the identity of
the informer will be kept secret.
4. Enhanced information disclosure
Has the company disclosed its integrity principles and
progress onto its website and MOPS?
V
The Company’s integrity activities are disclosed in annual reports and
on the Company’s website.
5. If the company has established business integrity policies in accordance with “Ethical Corporate Management Best-Practice Principles for
TWSE/TPEx-Listed Companies”, please describe its current practices and any deviations from the Best-Practice Principles: None
6. Other information relevant to understanding the company’s business integrity (e.g. revision of business integrity principles): None

45
(VII) State of the internal control system to be disclosed:
1. Internal Control Declaration
Internal Control Declaration of Mega Bills Finance Co., Ltd.
Representing the declaration by Mega Bills, the Company, from January 1, 2016
to December 31, 2016 has truly abided by the “Implementation Rules of Internal Audit
and Internal Control System of Financial Holding Companies and Banking Industries”.
The company has established an internal control system, implemented risk
management, and undertook inspection by an impartial and independent audit
department, periodically reporting to the Board of Directors and supervisors. While
conducting bills business, and in accordance with the determinants of effectiveness of
internal control systems stipulated in the “Standards for Establishment of Internal
Control Systems in Securities and Future Systems”, drafted and decreed by the
Securities and Futures Bureau under the Financial Supervisory Commission,
determined whether the design and implementation of the internal control system were
effective. Careful evaluation has shown that each department’s internal control and
legal and regulatory compliance, apart from the items listed in the accompanying chart,
can all be accurately and effectively enforced. This Declaration will constitute the
main content of the Company’s annual report and prospectus, and will be open to
external scrutiny. The illegal inclusion of falsehoods or the illegal concealment of
information in the above public data, will incur legal liability in relation to Articles 20,
32, 171 and 174 of the Securities and Exchange Act.
Respectful to
Financial Supervisory Commission, Executive Yuan
Declarers
Chairman of the Board: Chang-Ruey Shiau
President and CEO: Chi-Fu Lin
General Auditor: Yi-Sheng Wang
Legal Compliance Officer,
Head Office: Cheng-Bi Dai
Date: January 24, 2017

46
Required Internal Control System Improvement and Corrective Action Plan of Mega Bills
Finance Co., Ltd.
Date: December 31, 2016
Required Improvement Corrective Action When Improvement
Scheduled to be Completed
None
2. Disclosure of the audit report where a CPA has been entrusted to audit the
Company’s internal control system: None
(VIII) Penalties imposed against the company in the last 2 years due to violation; describe
the weaknesses found, the improvements made, and provide the following disclosures:
1. Prosecution against company representatives or staff for criminal conducts: None.
2. Fines imposed by Financial Supervisory Commission (FSC) for violations: None.
3. Penalties imposed by FSC in accordance with Article 51 of Act Governing Bills
Finance Business and Article 61-1 of the Banking Act: None.
4. Disclosure of losses exceeding NT$50 million incurred during the year, whether
in one event or aggregately over several events, as a result of extraordinary
non-recurring incidents (such as fraud, theft, embezzlement, fictitious transactions,
forgery of documents and securities, kickbacks, natural disasters, external forces,
hackers’ attacks, theft and leakage of confidential information, disclosure of
customers’ details or other material occurrences), or accidents arising due to
failure on safety measures: None.
5. Other disclosures mandated by FSC: None.
(IX) Significant resolutions made in shareholder meetings and board of directors meetings
in the last financial year, up to the publication date of this annual report
1. Resolutions passed on behalf of shareholders during the 16th meeting of the 14th
board held on March 22, 2016:
Amendments “Mega Bills Finance Articles of Incorporation”.
2. Resolutions passed during the 16th meeting of the 14th board held on March 22,
2016:
(1) Passed 2015 year-end accounts and 2015 earnings appropriation, which
included dividends totaling NT$2,077,322,677 (NT$1.584 per share), to be
paid entirely in cash. This resolution was later acknowledged by the board of
directors on behalf of shareholders during the 17th meeting of the 14th board
held on April 26, 2016; the ex-dividend date was set at May 9, 2016.
(2) 2015 employee remuneration totaling NT$62,175,114, to be paid in cash.
3. Resolutions passed on behalf of shareholders during the 27th meeting of the 14th
board held on November 22, 2016:
Amendments to “Mega Bills Finance Derivative Trading Procedures”.
4. Resolutions passed on behalf of shareholders during the 28th meeting of the 14th

47
board held on December 27, 2016:
Amendments to “Mega Bills Finance Asset Acquisition and Disposal Procedures”.
5. Resolutions passed on behalf of shareholders during the 32nd meeting of the 14th
board held on March 21, 2017:
Establishment of “Mega Bills Finance Integrity Principles”.
(X) Documented opinions or declarations made by directors or supervisors against the
board’s resolutions in the most recent year up till the publication date of this annual
report: None.
(XI) Summarization of resignation, discharge and appointment of persons related to
financial report (including the Chairman of Board, President and CEO, chief
accountants and chief internal auditors, et al.) in the most recent year and until the date
of publication of this annual report:
Title Name Date of
Appointment
Date
Discharged
Cause of Resignation or
Discharge
Chairman of
the Board Feng-Chi Ker 2015.03.02 2016.08.31 Retired
V. Information about professional fees paid to CPA:
Name of accounting firm CPA’s Name Audit period Remarks
PricewaterhouseCoopers,
Certified Public
Accountants
Shu-Mei
Ji
Chien-Hung
Chou 2016/1/1-2016/12/31
Unit: NT$ thousands
Fee category
Range Audit Fees
Non-Audit
Fees Total
1 Below NT$ 2,000,000 1,336 77 1,413
2 NT$2,000,000 ~ NT$4,000,000
3 NT$4,000,000~ NT$6,000,000
4 NT$6,000,000 ~ NT$8,000,000
5 NT$8,000,000 ~ NT$10,000,000
6 NT$10,000,000 and above
(I) Non-audit fees to external auditors, accounting firms and related businesses that
amount to one-quarter or higher of audit fees: None.
(II) Any replacement of accounting firm and reduction in audit fees paid compared with
the previous year: None.
(III) Any reduction in audit fees by more than 15% compared with the previous year:
None.

48
VI. Information about change of CPA:
(I) About former CPA:
Date of Change Ratified at Board Meeting on September 22, 2015
Cause of Change and
Explanation Thereof
Following a reorganization within PriceWaterhouseCoopers
Taiwan, the Company’s financial statements have been audited by
CPA Chien-Hung Chou and CPA Shu-Mei Ji since 2015 third
quarter, instead of CPA Chien-Hung Chou and CPA Po-Ju Kuo.
Was the termination of audit
services initiated by the
client or by the auditor
Parties
Situation Auditor Principal
Service terminated by Chien-Hung Chou,
Po-Ju Kuo
Service no longer
accepted (continued)
by
Reasons for issuing opinions
other than unqualified
opinions in the recent 2
years
None
Disagreements with the
Company
Yes
Accounting policy or practice
Financial statement disclosure
Audit coverage or procedures
Others
None
Description
Other disclosures
(Disclosures deemed
necessary under Item 1-4,
Subparagraph 6, Article 10
of the Guidelines)
None
(II) About new CPA:
Firm Name PricewaterhouseCoopers, Certified Public Accountants
CPA’s Name Chien-Hung Chou, Shu-Mei Ji
Date of Appointment Ratified at Board Meeting on September 22, 2015
Inquiries and replies relating to the
accounting practices or accounting
principles of certain transactions, or
any audit opinions the auditors were
likely to issue on the financial reports
None

49
prior to reappointment
Written disagreements from the
succeeding auditor against opinions of
the former auditor
None
(III) Former CPA’s response relating to Item 1 and Item 2-3, Subparagraph 6, Article 10
of the Guidelines: Not applicable.
VII. Any of the company’s Chairman, President, or accounting/finance managers
employed by the auditing firm or any of its affiliated business in the recent year;
disclose their names, job titles, and duration of employment at auditing firm or any
of its affiliated company: None.
VIII. Transfer or pledge of shares by directors, supervisors or managers in the last year
up till the publication date of this annual report that is subject to reporting under
Article 10 of Act Governing Bills Finance Business: None.
IX. Relationships characterized as spouse or second degree relatives or closer among
top-ten shareholders: None.
X. Investments jointly held by the company, the company’s directors, supervisors,
president, vice presidents, assistant vice presidents, department heads, branch
managers, and directly/indirectly controlled entities:
December 31, 2016; unit: shares; %
Investee The Company
Directors, supervisors,
President and CEO, senior
executive vice presidents,
executive vice presidents
and heads of departments
and branches and the
business directly or
indirectly controlled by
the Company
Combined Investment
Quantity Shareholding Quantity Shareholding Quantity Shareholding
Core Pacific City Corporation 60,000,000 3.130 - - 60,000,000 3.130
Taiwan Financial Asset Services
Co., Ltd. 5,000,000 2.941 - - 5,000,000 2.941
Taiwan Depository and Clearing
Co., Ltd. 2,213,813 0.628 - - 2,213,813 0.628
Taiwan Asset Management Co.,
Ltd. 7,500,000 0.568 - - 7,500,000 0.568
Taiwan Futures Exchange Co., Ltd. 1,568,249 0.512 - - 1,568,249 0.512
Agora Garden Co., Ltd. 21,090 0.030 - - 21,090 0.030

50
Capital Overview

51
One. Information on share capital and dividends:
I. Source of capital stock as the publication date of annual report
Unit: NT$ thousands; shares
Year/
month
Issue
price
Authorized capital Paid-in capital Remarks
Shares Amount Shares Amount Source of
share capital Others
2017.3 10 1,311,441,084 13,114,410,840 1,311,441,084 13,114,410,840 Public offering -
Unit: shares
Category of Shares
Authorized Capital
Remarks Outstanding shares Unissued shares Total
Common stocks 1,311,441,084 0 1,311,441,084
Publicly offered but
not listed on
TWSE/TPEx
II. Shareholder structure
March 31, 2017
Shareholder
Quantity
Government Financial
institutions
Other
corporations
Natural
persons
Foreign
institutions
and
foreigners
Total
Number of person 0 1 0 0 0 1
Shares held (shares) 0 1,311,441,084 0 0 0 1,311,441,084
Percentage 0 100% 0 0 0 100%
III. Diversification of Shareholdings
Face value: NT$10 per share; as March 31, 2017
Shareholding range Number of shareholders Quantity of Shares Held Percentage
1 to 1,000,000 - - -
1,000,001 and above 1 1,311,441,084 shares 100%
Total 1 1,311,441,084 shares 100%
IV. Major Shareholders
Shares
Name of Major Shareholders Quantity of Shares Held Percentage
Mega Financial Holding Co., Ltd. 1,311,441,084 shares 100%
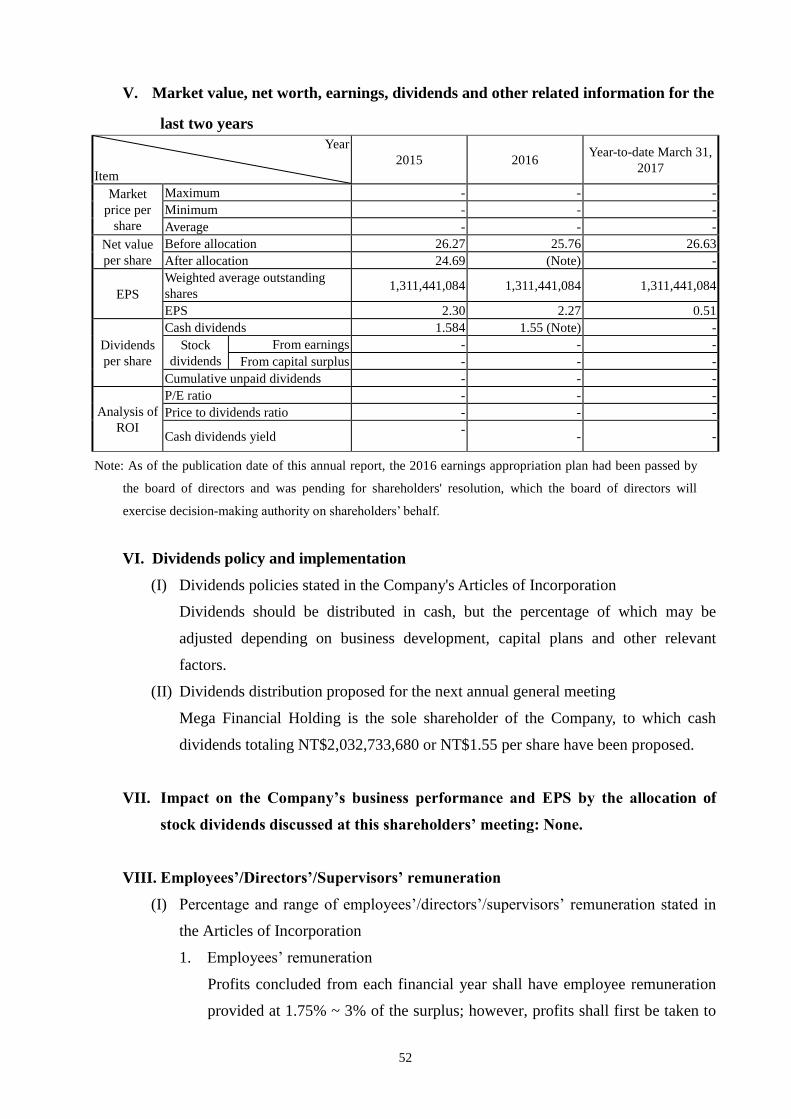
52
V. Market value, net worth, earnings, dividends and other related information for the
last two years
Year
Item
2015 2016 Year-to-date March 31,
2017
Market
price per
share
Maximum - - -
Minimum - - -
Average - - -
Net value
per share
Before allocation 26.27 25.76 26.63
After allocation 24.69 (Note) -
EPS
Weighted average outstanding
shares 1,311,441,084 1,311,441,084 1,311,441,084
EPS 2.30 2.27 0.51
Dividends
per share
Cash dividends 1.584 1.55 (Note) -
Stock
dividends
From earnings - - -
From capital surplus - - -
Cumulative unpaid dividends - - -
Analysis of
ROI
P/E ratio - - -
Price to dividends ratio - - -
Cash dividends yield -
- -
Note: As of the publication date of this annual report, the 2016 earnings appropriation plan had been passed by
the board of directors and was pending for shareholders' resolution, which the board of directors will
exercise decision-making authority on shareholders’ behalf.
VI. Dividends policy and implementation
(I) Dividends policies stated in the Company's Articles of Incorporation
Dividends should be distributed in cash, but the percentage of which may be
adjusted depending on business development, capital plans and other relevant
factors.
(II) Dividends distribution proposed for the next annual general meeting
Mega Financial Holding is the sole shareholder of the Company, to which cash
dividends totaling NT$2,032,733,680 or NT$1.55 per share have been proposed.
VII. Impact on the Company’s business performance and EPS by the allocation of
stock dividends discussed at this shareholders’ meeting: None.
VIII. Employees’/Directors’/Supervisors’ remuneration
(I) Percentage and range of employees’/directors’/supervisors’ remuneration stated in
the Articles of Incorporation
1. Employees’ remuneration
Profits concluded from each financial year shall have employee remuneration
provided at 1.75% ~ 3% of the surplus; however, profits shall first be taken to

53
offset accumulated losses if any.
The above employee remuneration shall be approved in a board meeting with
at least two-thirds of directors present, and with the consent of more than half
of attending directors. Payments can be made upon approval and reported
during a shareholders’ meeting afterwards.
2. Directors and supervisors' remuneration: None.
(II) Basis of calculation for employees'/directors'/supervisors' remuneration and
share-based compensations; and accounting treatments for any discrepancies
between the amounts estimated and the amounts paid
1. Basis of calculation for employees'/directors'/supervisors' remuneration and
share-based compensations
The Company had estimated its 2016 employee remuneration at
NT$86,459,341. This estimate was made based on the amount of current
pre-tax profits before employee remuneration, and the percentage stipulated in
the Articles of Incorporation. The Company did not recognize
directors’/supervisors’ remuneration or propose to pay employee remuneration
in shares for 2016.
2. Accounting treatments for any discrepancies between the amount of employee
remuneration estimated and the amount paid
Any differences between the amount resolved by board of directors and the
amount actually paid will be treated as a change of accounting estimate.
(III) Remuneration passed by the board of directors
1. Cash or share payment of employees’/directors’/supervisors’ remuneration
Pursuant to the Articles of Incorporation and resolution of the 32nd meeting of
the 14th board of directors held on March 21, 2017, the 2016 employee
remuneration was determined at NT$63,706,883, to be distributed in cash. The
Company did not propose any share payment for
employees’/directors’/supervisors’ remuneration. The NT$63,706,883 cash
payment of 2016 employee remuneration resolved by the board of directors
was different from the NT$86,459,341 previously recognized in the 2016
financial statements, by a discrepancy of NT$22,752,458. This discrepancy
was attributable to a change of employee remuneration percentage and has
been adjusted into 2017 profit and loss.
2. Percentage of employees’ remuneration paid in shares, relative to after-tax
profit and total employees’ remuneration of the current period: None.

54
(IV) Employees’/directors’/supervisors’ remuneration paid in the previous year
1. Actual payment of employee remuneration
Pursuant to the Articles of Incorporation and resolution of the 16th meeting of
the 14th board of directors held on March 22, 2016, the 2015 employee
remuneration was determined at NT$62,175,114, to be distributed in cash. The
actual cash payment of 2015 employee remuneration, NT$62,175,114, was
different from the NT$88,821,591 previously recognized in 2015 financial
statements, by a discrepancy of NT$26,646,477. This discrepancy was
attributable to a change of employee remuneration percentage, and has been
adjusted into 2016 profit and loss.
2. Actual payment of directors’/supervisors’ remuneration: None.
IX. Buyback of the Company's shares: None.
Two. Corporate Bond, Preferred Stock, Employee Stock Option, Merger and
Acquisition or Assignment to Other Financial Institutions: None.
Three. Execution of Funding Utilization Plan: None.

55
Overview of Business Operation

56
One. Business Scope
I. Main business
(I) Major business activities by segment
1. Bills Business
(1) Acting as a certifier, underwriter, broker and proprietary trader with
respect to short-term bills (including USD-denominated instruments)
(2) Acting as a guarantor or endorser of CP2.
2. Bonds Business
(1) Proprietary trading of government bonds
(2) Acting as a certifier, underwriter, broker and proprietary trader with
respect to bank debentures
(3) Proprietary trading of corporate bonds
(4) Proprietary trading and investment of fixed income securities
(5) Proprietary trading and investment of foreign bonds
3. Equity investment business
4. Others
(II) Each business assets and income as a proportion of total assets and income, and
growth and changes therein.
1. Assets Unit: NT$ thousands
Year
Item
2016 2015
Amount
As a
proportion of
total assets (%)
Amount
As a
proportion of
total assets (%)
Bills
Business 120,027,368 45.41 109,132,348 48.92
Bonds
Business 137,576,623 52.05 107,575,093 48.22
Equity
investment
business
910,683 0.35 993,890 0.45
Others 5,787,527 2.19 5,396,394 2.41
Total assets 264,302,201 100.00 223,097,725 100.00

57
2. Revenues Unit: NT$ thousands
Year
Item
2016 2015
Amount Percentage (%) Amount Percentage (%)
Bills Business 2,660,680 49.97 2,676,826 51.99
Bonds Business 2,377,473 44.65 1,751,888 34.03
Equity
investment
business
134,026 2.52 444,193 8.63
Others 152,358 2.86 275,901 5.35
Total Revenue 5,324,537 100.00 5,148,808 100.00
II. Business plan of the year
(I) Bills Business
1. Pay close attention to customers’ business/financial performance, industry
prospects, and funding capacity for more robust credit decisions.
2. Proactively leap at opportunities to lead-arrange syndicated loans and
underwriting of non-guarantee commercial papers; hence stabilize CP sources
and increase fee income.
3. Actively explore opportunities in NCD, acquisition of guaranteed or
non-guarantee bills underwriting for portfolio growth and higher gains.
4. Monitor the Central Bank’s monetary policy and movements of the financial
market to enable flexible adjustment of primary and secondary deal rates;
manage and expand bills portfolio with increased margin to maintain leading
position in the market.
(II) Bonds Business
1. Improve trade performance by executing outright purchases/sells in line with
NTD bond maturity.
2. Build position in foreign currency bonds; diversify country risk and increase
portfolio weight in foreign currency corporate bonds for higher overall gains
and mitigation of U.S. interest rate hike.
3. Engage credit customers in secondary deals of foreign currency bonds; secure
source of foreign currency capital from domestic financial institutions by
engaging them in interbank funding, currency swaps and repurchase

58
agreements; reduce cost of capital and increase returns on holding positions
without liquidity risks.
4. Long convertible bonds and CBAS issued by companies with good credit
ratings, in order to increase profits.
5. Manage duration of NTD and foreign currency bonds for risk avoidance and
higher gains.
(III) Equity investment business
1. Aim to profit from equity investments by gaining insight into corporate
fundamentals and timing share price movements.
2. Build position in shares with good credit and high dividend yields to replace
corporate bonds that offer low returns.
III. Market analysis
(I) Regions of business operations, future supply and demand in market, and the
market potential for growth.
1. Regions of business operations
Apart from the Taipei head office, the Company has 8 branches nationwide
to conduct credit, bills and bond-related services.
2. Future market supply, demand and growth
(1) Market changes
1) Permission for banks to issue AUD-denominated NCDs: On September 20,
2016, the Central Bank amended “Notes on Issuance of Foreign
Currency-denominated Negotiable Certificate of Deposit by Banks” and
allow banks to issue AUD-denominated NCDs. Enhanced system has gone
live since the end of December 2016, thereby enabling the Company to
trade NCDs and make DVP settlement over the foreign currency clearing
platform.
2) A securities dealer that trades any 5-year and 10-year central government
bond announced by the TPEx may not have a cumulative net trading
position in that bond exceeding one-third of the total issued amount in the
quarterly plan: On November 16, 2015, Taipei Exchange amended its

59
“Taipei Exchange Rules Governing Securities Trading on the TPEx” to
introduce a new rule that, starting from 2016, no single securities dealer
may hold more than one-third of any of the 5-year and 10-year central
government bonds announced by the TPEx at any time between the period
from the date of its when-issued trading to 6 months after the bond
issuance or reopening. This restriction will help eliminate monopolistic
competition in bonds market and bring trade activities to stimulate market
interest rate movements.
3) Starting from January 1, 2016, banks are required to maintain the liquidity
coverage ratio above 70%, and this minimum requirement will be raised
progressively to 100% by January 1, 2019: On December 29, 2014, the
Financial Supervisory Commission announced the “Liquidity Coverage
Ratio (LCR) Implementation Standards” (referred to as the
Implementation Standards below)and implemented from January 1, 2015.
From January 1, 2016 onwards, banks are required to maintain LCR above
70%, and the minimum LCR requirement will be raised progressively to
100% by January 1, 2019. Under the Implementation Standards, some
large banks will have to adjust asset quality, and bills finance companies
may encounter some difficulties with funding.
(2) Market conditions
1) Bills market
Following the recovery of local and global economic activities, the
Central Bank had ceased cutting interest rates since the end of September
2016. Later in mid-November, Trump’s victory in the U.S. presidential
election gave market investors reasons to expect further rate hikes from the
FED, causing a significant rise in U.S. bond yields. The series of events led
to a tightening of liquidity in the money market towards the end of 2016,
with short-term note interest rate rising significantly higher than the first
half year. 364-day NCD and 273-day treasury bills were auctioned on

60
December 5, 2016 and January 6, 2017, respectively; each average rate of
the winning bids were concluded at 0.583% and 0.483%, which were 21.2
b.p. and 18.3 b.p., respectively higher than the previous tender of identical
instruments. This shows that the market is eagerly expecting a rise in
short-term interest rates. In 2016, the value of CP2 underwritten by all bills
finance companies in the primary market amounted to NT$7,598.3 billion,
up NT$839.9 billion (or 12.43%) from2015, in which the Company
represented a market share of 28.50%. The value of transactions completed
by all bills finance companies in the secondary market amounted to
NT$25,282.4 billion in 2016, up NT$1,827.5 billion (or 7.79%) from 2015,
in which the Company represented a market share of 33.33%. The
Company has secured its position as the top performer in the bills finance
industry. The FED has officially begun a cycle of interest rate hikes, and
given the likelihood of the Central Bank to follow the FED’s footsteps,
short-term bill interest rates are very likely to rise in 2017. However,
overall money supply should remain neutral and relatively abundant.
2) Bonds market
Recap of Taiwan’s bond market in 2016: Following the negative
interest rate policies introduced in Europe and Japan, the postponement of
interest rate hike in the U.S., and after seeing export volume decline for the
17th consecutive month, the Central Bank of Taiwan made two interest rate
cuts in the first half of 2016, reducing local bond yields to a historical low.
However, after Trump’s victory in the U.S. presidential election in
November, international capital shifted back to the United States with the
expectation that Trump may introduce expansionary fiscal policies such as
tax cuts and infrastructure spending to create domestic demands. As a
result, the USD strengthened, U.S. bond yields rose by more than 100
points, while Taiwan’s 5-year and 10-year government bond yields also set
a new high for recent year. In 2016, bond transactions by all bills finance
companies amounted to NT$18,486.2 billion; NT$5,642.1 billion of which
was contributed by the Company, representing 30.55% market share that

61
secured its No. 1 place in the bills finance industry. In forecasts, Fed
officials have signaled another small rate increase is coming in 2017,
meaning that a rise in NTD and foreign currency short-term interest rate is
expected. It is reasonable to predict that the Company’s current holding
position will incur additional funding costs and significantly reduce the
spread on NTD and foreign currency bonds.
3) Equity investment business
Back at the time when Europe, USA and Japan were still maintaining
expansionary monetary policies, Taiwan’s equity market managed to attract
foreign capital with its consistent and high dividend yields since the
beginning of 2016. Although the equity market encountered temporary
setbacks at the time when UK voted to exit EU and when Trump won the
U.S. presidential election, TAIEX managed to overcome investors’ doubts
for the most part of 2016 and reached as high as 9,430 points. The FED’s
interest rate hike in the end of 2016 may somewhat disrupt the inflow of
foreign capital into Taiwan’s equity market, and whether or not TAIEX
continues to gain will depend largely on the speed and extent at which
capital is redirected into the United States. Also, competition between
China and USA, two of the world’s largest economies, may give rise to
political and economic uncertainties throughout 2017 and high volatility in
Taiwan’s equity market that may increase trading difficulty.
(II) Competitive advantages, opportunities, threats, and responsive strategies
1. Opportunities
(1) The United States is expected to continue raising interest rates in the next year,
which may cause the USD to strengthen and motivate some primary market
customers to borrow NTD to repay USD debts, thus increases demand for
NTD capital.
(2) The authority has relaxed restrictions with regards to the range and limit of
foreign currency bonds that can be traded by bills finance companies. This
development will provide the Company with greater flexibility in building up

62
and profiting from foreign currency bond positions.
(3) The authority has permitted general investors to trade NTD-denominated
corporate bonds and bank debentures listed on the professional board, and
repurchase agreements listed on the foreign board. It provides bills finance
companies with broader access to capital, which helps grow bond services.
2. Threats
(1) The lack of investor confidence and economic momentum in Taiwan
combined with the growth of the Chinese supply chain and protectionism in
the U.S. have made the business environment all the more difficult.
Furthermore, globalization has made credit customers’ business performance
and financial position more susceptible to market changes, causing an overall
reduction in profit margins and increased credit risks.
(2) Increasing variety of funding channels are being introduced into the financial
market, while banks continue to expand the domestic credit portfolio at a low
interest rate, particularly when the Chinese market and wealth management
segment no longer contributes the level of profitability they are used to, some
of which have even attained the bills financing license to underwrite
non-guarantee commercial papers in the primary market, which posed direct
competition against specialized bills finance companies.
(3) Due to limitations by capital adequacy and liquidity coverage ratios, the
banking system has been conservative about long-term interbank funding and
transactions in the secondary market, which affect the market’s capital supply
and cause higher interest rate volatility in short-term instruments completed at
month-end and quarter-end.
(4) Out of expectations that the Central Bank may follow the Feds in raising the
interest, both long-term and short-term market interest rates have already
begun to rise, which signify the beginning of a series of interest rate hikes to
come. This development has the worst effect on a bills finance company not
only because of the tightened money supply, but the increase in RP cost and

63
interbank funding cost would also erode much of the Company’s margins.
3. Responsive strategies
(1) Monitor credit customers’ business/financial performance, industry prospects,
and funding capability for more robust credit decisions.
(2) Adjust credit portfolio and source quality customers without compromising
credit risk. Adopt a flexible pricing strategy that increases margin on bills.
(3) Maintain long-term relationships with financial institutions for more diverse
funding sources. Negotiate for lower cost of funding and maintain contact to
gain the latest market insights that would enable the Company to react to the
changing environment.
(4) Expand source of capital in the secondary market by exploring customers that
are characterized by stability and low funding costs. Reduce the position of
bills and bonds held on hand, and thereby reduce funding costs and increase
profit margins.
(5) Pay close attention to equity market movements and actively explore quality
CBAS customers. Introduce customers of lower funding cost; increase NTD
bond spread through optimized NTD interest rate structure and stable funding
source from the secondary market.
(6) Build position in foreign currency bonds and explore diverse foreign currency
funding channels. Enhance foreign currency funding capabilities and spread.
(7) Invest in companies characterized by prospective industry, growing revenues
and profits. Choose sectors that present future potential and observe to
determine the right timing of entry.
IV. Financial Product Research and Overview of Business Development
(I) Premium financial products and new banking units, their sizes and status of profit
for the most recent two years and until the date of publication of this annual report:
None.

64
(II) R&D expenditure and results for the most recent two years:
1. R&D expenses
Unit: NT$ thousands
Item R&D expenses
2016 2015
Costs of employee participation in
various research and training
programs
602 838
2. R&D results
(1) 2015
1) Completed a paperless conference system and a paperless report
management system.
2) Studied ways of improving settlement efficiency for foreign currency
bond transactions that involve RMB.
3) Continued foreign currency NCD services.
4) Conducted studies on complying with the Equator Principles.
(2) 2016
1) Continue perfecting the Company’s paperless conference system and
paperless report management system.
2) Continue making adjustments to the internal performance evaluation
system.
3) Study the feasibility of undertaking RP transaction of US dollar bonds
with life insurance companies.
4) Apply to the competent authority for relaxing derivatives transaction
scope of bills finance companies.
5) Planned Basel III system framework and introduction practice.
6) Continuously enhanced self-assessment system of operational risks and
strengthen risk management regarding various business risk categories.
7) Enhanced implementation and risk monitoring of AML/CFT.
(3) Future R&D plans
1) Seek interpretation from the Ministry of Finance on tax-exempt income

65
and amortization of costs, expenses, losses and interest outlays.
2) Seek the authority’s approval for engaging life insurance companies in
USD RP deals.
3) Seek the authority’s approval to relax currency risk limits of bills finance
companies when transacting foreign currency bonds. This can be
achieved by excluding valuation gains and interests accrued on zero
coupon bonds from limit calculation, or by increasing overall limit.
4) Continuously request for the authority’s permission to issue CP2 up to 3
years in tenor (up to today, CP2 could only be issued up to 1 year).
5) Apply to the competent authority for relaxing derivatives transaction
scope of bills finance companies.
6) Explore applications of big data technology.
V. Long-term and short-term business plans
(I) Short-term
1. Pay close attention to customers’ business/financial performance, industry
prospects, and funding capacity for more robust credit decisions.
2. Proactively leap at opportunities to lead-arrange syndicated loans and
underwriting of non-guarantee commercial papers; hence stabilize CP sources
and increase fee income.
3. Actively explore opportunities in NCD, acquisition of guaranteed or
non-guarantee bills underwriting to achieve portfolio growth and higher gains.
4. Monitor the Central Bank’s monetary policy and movements of the financial
market to enable flexible adjustment of primary and secondary deal rates;
manage and expand bills portfolio at increased margin to secure a leading
position in the market.
5. Improve trade performance by executing outright purchases/sells in line with
NTD bond maturity.
6. Build position in foreign currency bonds; diversify country risk and increase
portfolio weight in foreign currency corporate bonds for higher overall gains
and mitigation of U.S. interest rate hike.
7. Engage credit customers in secondary deals of foreign currency bonds; secure
source of foreign currency capital from domestic financial institutions by

66
engaging them in interbank funding, currency swaps and repurchase
agreements; reduce cost of capital and increase returns on holding positions
without liquidity risks.
8. Aim to profit from equity investments by gaining insight into corporate
fundamentals and timing share price movements.
9. Long convertible bonds and CBAS issued by companies with good credit
ratings, in order to increase profits.
10. Build position in shares with good credit and high dividend yields to replace
corporate bonds that offer low returns.
11. Manage duration of NTD and foreign currency bonds for risk avoidance and
higher gains.
12. Enhance anti-money laundering (AML) and counter financing terrorism (CFT)
measures; improve the professional capacity of AML personnel and develop a
continually effective AML/CFT monitoring system.
13. Assist business units in exploring new customers and potential business
opportunities by adopting new database analysis technologies and integrating
external data sources.
14. Continuously strengthen the Company's information systems and operating
efficiency. Develop automated reporting and standardized accounting
platforms that improve efficiency of credit investigation, credit extension, and
credit review and back-end operations.
15. Promote the use of paperless conference system and paperless report
management system as a means to cut back resource usage and fulfill corporate
social responsibilities.
(II) Long-term
1. Strengthen the position as market leader of the bills and bonds business.
2. Build a profitable bonds portfolio. Expand trading of repurchase agreements
and secure profitability with the use of derivatives.
3. Enhance operation efficiency by reducing cost of funding and expanding
interest spread.
4. Ensure regulatory compliance through enhanced internal controls and internal
audit systems.

67
5. Make efficient allocation of capital; strengthen existing risk management and
systems.
6. Continue efforts in talent development and nurturing.
7. Introduce new services and expand service reach.
8. Work with Mega Financial Holding Company to integrate the information
system and share information services.
9. To integrate the group resources and explore the synergy of cross-selling.

68
Two. Employee Data for the Most Recent Two Years and Cut-off Date of
Publication for this Annual Report
Year 2015 2016 Up till March 31,
2017
Number of
employees
Staff 187 189 186
Total 187 189 186
Average age 47.39 47.82 47.83
Average length of service 18.07 18.53 18.62
Distribution
of academic
background
PhD 2 2 2
Master 82 86 84
Bachelor 97 96 95
Senior high school 6 5 5
Below senior high
school 0 0 0
Professional
certificates
held by
employees
Bills Finance
Specialist 179 184 182
Securities
Investment Analyst 7 8 8
Senior Securities
Specialist 140 144 142
Securities Specialist 72 71 70
Securities
Investment Trust
and Consulting
Professional
88 86 84
Trust Operations
Personnel 114 113 109
Futures Specialist 78 76 75
Life Insurance
Specialist 128 126 123
Property Insurance
Specialist 122 121 118
Bank Internal
Control Specialist 102 100 98
Financial Planning
Personnel 72 71 69

69
Basic Foreign
Exchange Personnel 9 10 10
Basic Bank Lending
Personnel 38 38 38
Advanced Bank
Lending Personnel 6 6 6
Three. Corporate Responsibility and Ethical Conduct
Please refer to pages 22 and 23 of the Corporate Governance Report, titled "Fulfillment
of Social Responsibilities" and "Fulfillment of Ethical Corporate Management”.
Four. Number of non-managerial staff, amount of average employee welfare
expenses, and differences from the previous year
Unit: NT$ thousands
Year Number of non-managerial staff Welfare expense (average)
2015 129 2,159
2016 130 2,160
Five. Computer equipment
I. Computer system hardware and software configuration and maintenance
System Business Platform Development Maintenance
MIS NTD and foreign
currency bills
exchange, NTD and
foreign currency
bonds, credit
investigation, credit
extension, financial
accounting,
personnel, fixed
assets, and risk
management
RS/6000 Self-developed Self-maintained
Correspondents Inter-bank
payments
IBM Outsourced Self-maintained
Notes Email, bulletin
boards, e-Form
Notes/WINDOWS Self-developed Self-maintained

70
II. Emergency contingency and security protection measures
The Company completed the establishment of the Linkou Information Facility Remote
Replication Center in 2007, and will deal with the Company’s application system server
IBM RS/6000 update program at the same time to update the computer equipment of the
recovery center at different location in 2014. The Company is dedicated to carrying out
data recovery drills every year, in order to reduce information operating risk and protect
customer trading safety and move towards sustainable management.
III. Future development or purchase plans
(I) Develop EAS credit investigation system.
(II) Develop IFRS 9 valuation system.
(III) Replace redundant PCs.
(IV) Enhanced information security management system.
(V) Replace the Company’s correspondent banking server and scrambling equipment.
(VI) Replace the Company’s mobile equipment (iPad).
(VII) Explore applications of big data technology.
Six. Labor Relations
I. Employee welfare measures:
Welfare committee, employee remuneration, health examinations, employees’ tour
reimbursement, and so on.
II. Retirement system and its implementation:
Handled in accordance with the Company’s retirement regulations, applying the
provisions either more favorable than those of the Labor Standard Law, in line with
those of the Labor Standard Law, or in line with those of the Labor Pension Act.
III. Agreement between employer and labors:
Subject to the Labor Standard Law and the Company’s work rules.
IV. Measures to protect employees’ interests and rights:
Subject to the Labor Standard Law and the Company’s work rules.
V. Loss caused by labor dispute in the most recent year and until the date of
publication of this annual report: None.
Seven. Major contracts: None.

71
Financial Information

72
One. Condensed balance sheets and income statements for the last five years
I. Condensed balance sheets and income statements
Condensed Balance Sheet
Unit: NT$ thousands
Year
Item
Financial information for the last 4 years
2016 2015 2014 2013
Cash, cash equivalents, central bank deposits, interbank call loans
346,391 321,356 444,266 544,617
Financial assets at fair value through profit and loss 125,297,488 115,285,106 117,026,616 133,085,711
Available-for-sale financial assets 132,867,186 100,816,225 83,333,880 80,127,802
Bills and bonds purchased under resale agreements - 1,000,000 9,805,054 1,966,157
Receivables - net 1,531,891 1,185,047 1,004,365 1,072,383
Held-to-maturity financial assets 350,000 600,000 850,000 500,000
Other financial assets - net 820,362 818,540 802,252 1,303,700
Property, plant and equipment - net 370,177 375,457 370,378 362,205
Investment properties - net 2,528,424 2,539,088 2,549,752 2,560,415
Intangible assets - net 3,310 2,427 2,886 3,303
Deferred income tax assets - net 152,104 106,254 95,088 89,030
Other assets 34,868 48,225 25,511 27,647
Total assets 264,302,201 223,097,725 216,310,048 221,642,970
Interbank overdraft and call loans 15,714,592 11,294,776 15,926,613 21,259,000
Financial liabilities at fair value through profit and loss 22,543 6,149 411 1,352
Bills and bonds payable under repurchase agreements 210,809,807 173,109,248 163,777,891 163,869,633
Payables 602,808 504,042 502,801 809,067
Current income tax liabilities 191,490 131,256 74,713 124,310
Liabilities reserve 2,728,105 2,757,420 2,774,969 3,282,308
Deferred income tax liabilities 22,700 12,647 790 62
Other liabilities 431,098 828,935 116,541 179,726

73
Total liabilities
Before allocation 230,523,143 188,644,473 183,174,729 189,525,458
After allocation Note 190,721,796 185,248,117 191,277,543
Capital stock
Before allocation 13,114,411 13,114,411 13,114,411 13,114,411
After allocation Note 13,114,411 13,114,411 13,114,411
Capital surplus 320,929 320,929 320,929 320,929
Retained earnings
Before allocation 20,375,867 19,490,920 18,597,142 17,386,645
After allocation Note 17,413,597 16,523,754 15,634,560
Other equity (32,149) 1,526,992 1,102,837 1,295,527
Total equity
Before allocation 33,779,058 34,453,252 33,135,319 32,117,512
After allocation Note 32,375,929 31,061,931 30,365,427
Note: As of the publication date of this annual report, the 2016 earnings appropriation plan had been
passed by the board of directors and was pending for shareholders' resolution, which the board of
directors will exercise decision-making authority on shareholders’ behalf.
Condensed income statements
Unit: NT$ thousands
Year
Item
Financial information for the last 4 years
2016 2015 2014 2013
Interest Income 3,322,888 2,930,965 2,791,448 2,837,819
Less: Interest Expense (899,280) (901,456) (980,992) (1,058,294)
Interest income, net 2,423,608 2,029,509 1,810,456 1,779,525
Revenues other than interest income, net
1,898,101 2,134,405 1,736,249 1,872,669
Net revenue 4,321,709 4,163,914 3,546,705 3,652,194
Provisions 45,896 134,508 660,965 177,739
Operating expenses (796,560) (792,612) (780,358) (775,732)
Income before Tax from Operating Unit
3,571,045 3,505,810 3,427,312 3,054,201
Income tax (expense) gain (590,919) (495,374) (426,465) (423,718)
Net Income from Operating Unit
2,980,126 3,010,436 3,000,847 2,630,483
Income (loss) from discontinued operations
- - - -

74
Net Income (loss) 2,980,126 3,010,436 3,000,847 2,630,483
Other comprehensive income for the current period (net of tax expense)
(1,576,997) 385,439 (230,955) (1,220,140)
Comprehensive Income for the current period
1,403,129 3,395,875 2,769,892 1,410,343
EPS 2.27 2.30 2.29 2.01

75
II. Condensed balance sheets and income statements-R.O.C. GAAP
Condensed balance sheets
Unit: NT$ thousands
Year
Item Financial information - 2012
Cash, cash equivalents, central bank deposits, interbank call loans
367,174
Financial assets at fair value through profit or loss 129,072,587
Available-for-sale financial assets 81,883,882
Receivables 1,261,152
Held-to-maturity financial assets 500,000
Fixed assets 2,918,234
Intangible assets 4,750
Other financial assets 1,299,398
Other assets 110,397
Total assets 217,417,574
Interbank overdraft and call loans 20,861,000
Financial liabilities at fair value through profit or loss 3,154
Bills and bonds payable under repurchase agreements 159,376,775
Payables 1,000,645
Other liabilities 3,356,926
Total liabilities
Before allocation
184,598,500
After allocation
186,615,496
Capital stock
Before allocation
13,114,411
After allocation
13,114,411
Capital surplus 312,823
Retained earnings
Before allocation
16,900,777
After allocation
14,883,781
Unrealized gain or loss on financial products 2,567,813
Other equities (76,750)
Total stockholders’ equity
Before allocation
32,819,074
After allocation
30,802,078

76
Condensed income statements
Unit: NT$ thousands
Year Item
Financial information - 2012
Interest income, net 1,989,274
Revenues other than interest income, net 2,282,614
Provisions (126,379)
Operating expenses (796,950)
Income before tax from continuing operations 3,348,559
Income after tax from continuing operations 2,880,966
Income (loss) from discontinued operations -
Extraordinary income (loss) (net of tax expense) -
Cumulative effect of changes in accounting principles (net of tax expense)
-
Net income 2,880,966
EPS 2.20
III. Independent Auditor’s Names and Opinion
Year CPA Firm CPA’s Name Auditing Opinion
2016 PricewaterhouseCoopers,
Taiwan Chien-Hung Chou,
Shu-Mei Ji Unqualified opinion
2015 PricewaterhouseCoopers,
Taiwan Chien-Hung Chou,
Shu-Mei Ji Unqualified opinion
2014 PricewaterhouseCoopers,
Taiwan Chien-Hung Chou, Po-Ju
Kuo Unqualified opinion
2013 PricewaterhouseCoopers,
Taiwan Chien-Hung Chou, Po-Ju
Kuo Unqualified opinion
2012 PricewaterhouseCoopers,
Taiwan Chien-Hung Chou,
Hsiu-Ling Li Unqualified opinion

77
Two. Financial analysis for the last five years
I. Financial Analysis - International Financial Reporting Standards
Unit: NT$ thousands; %
Year
Item
Financial analysis for the last four years
2016 2015 2014 2013
Managerial
ability
Average number of days of
bill and bond holding
6.12 5.12 4.92 5.54
NPL ratio 0 0 0 0
Total assets turnover rate 0.02 0.02 0.02 0.02
Average yield per employee 18,709 18,183 15,905 16,304
Average profit per employee 12,901 13,146 13,457 11,743
Profitability
ROA (%) 1.22 1.37 1.37 1.20
ROE (%) 8.74 8.91 9.20 8.11
Net profit margin (%) 68.96 72.30 84.61 72.02
EPS (NT$) 2.27 2.30 2.29 2.01
Financial
structure
Liability to total assets ratio
(%)
86.37 83.52 83.57 84.17
Property and equipment to
stockholder equity ratio (%) 1.10 1.09 1.12 1.13
Growth rate Asset growth rate (%) 18.47 3.14 -2.41 1.89
Profit growth rate (%) 1.86 2.21 12.22 -9.02
Cash flow
Cash flow ratio (%) N/A 3.57 3.89 0.96
Cash flow adequacy ratio
(%)
156.13 182.30 154.37 156.92
Credit extended to stakeholders with
collateral 97,000 97,000 520,000 0
Percentage of credits extended to
stakeholders with collateral (%) 0.07 0.06 0.36 0
Scale of
operations
Asset market share (%) 26.83 23.83 26.48 26.77
Net value market share (%) 28.83 29.44 29.60 29.58
Market share for guaranteed
CP2(%) 29.23 31.54 31.42 32.91
Market share for each type
of bill and bond issue and
first time purchase (%)
27.46 29.65 29.05 30.38

78
Note: Equations for analysis items:
1. Managerial ability
(1) Average number of days of bills and bonds holdings = 365/bills and bonds turnover rate (Bills and
bonds turnover rate = Amount of each type of bill or bond transaction/average balance of each
installment of bills or bonds).
(2) NPL ratio = NPL (including non-accrual loans)/total loans (including non-accrual loans).
(3) Total assets turnover rate = Income/average total assets.
(4) Average yield per employee = Income/total number of employees.
(5) Average profit per employee = Net Income/total number of employees.
2. Profitability
(1) ROA = Net Income /average total assets.
(2) ROE = Net Income/average equity, net.
(3) Net profit margin = Net Income /income. (Income = interest income + revenues other than interest
income).
(4) Earnings per share = (income and loss attributed to owners of parent company – dividends of the
preferred stocks)/weighted average numbers of outstanding shares.
3. Financial structure
(1) Liability to total assets ratio = Total liabilities/total assets.
(2) Property and equipment to stockholders’ equity ratio = Property and equipment net/total stockholders’
equity.
(3) Total liabilities should exclude allowances for the guarantee liability.
Market share for each type
of bill and bond transaction
(%)
31.85 33.18 35.07 33.57
Capital
adequacy
ratio
Capital adequacy ratio (%) 13.53 13.88 13.84 13.57
Eligible capital 33,248,864 31,288,743 28,548,890 28,705,412
Total value of risk assets 245,674,749 225,367,830 206,332,882 211,584,531
Tier I capital as a % of total
risk-weighted assets 13.53 13.55 13.59 13.29
Significant variations in the last 2 years: (for variations above 20%)
1. The increase in asset growth rate was mainly due to an increase in bills and bonds held on hand.
2. Cash flow from operating activities resulted in a net outflow for the year, hence the cash flow ratio was
not calculated.

79
4. Growth rate
(1) Asset growth rate = (Total assets in current period-total assets for the previous period)/total assets for
the previous year.
(2) Profit growth rate = (Income before tax in current period -income before tax for the previous
year)/income before tax for the previous year.
5. Cash flow
(1) Cash flow ratio = Net cash flow from operating activities/( interbank overdraft and call loans
+commercial promissory note payable + financial liabilities at fair value through profit and loss + bills
and bonds payable under repurchase agreements + payables with maturity within one year).
2) Net cash flows adequacy ratio = Net cash flow from operating activities for the most recent five
years/(capital expenditure + cash dividends) for the most recent five years.
6. Scale of operations
(1) Asset market share = Total assets/total assets of all bills finance companies.
(2) Net value market share = Net value/total net value of all bills finance companies.
(3) Market share for guaranteed CP2 = Balance of guaranteed CP2/total balance of CP2 guaranteed
and endorsed by all bills finance companies.
(4) Market share for each type of bill and bond issue and first time purchase = Amount of each type
of bill and bond issue and first time purchase/total amount of each type of bill and bond issue and first
purchase by all bills finance companies.
(5) Market share for each type of bill and bond transaction = Amount of each type of bill and bond
transaction/total amount of each type of bill and bond transaction by all bills finance companies.
7. Capital adequacy ratio
(1) Capital adequacy ratio = Eligible capital/total risk assets.
(2) Eligible capital = Tier I capital + Tier II eligible capital + Tier III eligible and used capital.
(3) Total risk assets = Credit risk weighted risk assets + (operational risk capital requirement +market
risk capital requirements) x 12.5.
(4) Ratio of Tier I capital to risk weighted assets = Tier I capital/total risk assets.

80
II. Financial analysis - based on R.O.C. GAAP
Unit: NT$ thousands; %
Year
Item Financial analysis - 2012
Managerial ability
Average number of days of bills and
bonds holding
5.26
NPL ratio 0
Total assets turnover rate 0.02
Average yield per employee 19,071
Average profit per employee 12,861
Profitability
ROA (%) 1.30
ROE (%) 8.81
Net profit margin (%) 67.44
EPS (NT$) 2.20
Financial structure
Liability to total assets ratio (%) 83.53
Fixed assets to stockholders’ equity
ratio (%)
8.89
Growth rate Asset growth rate (%) -3.58
Profit growth rate (%) 6.71
Cash flow Cash flow ratio (%) N/A
Cash flow adequacy ratio (%) 189.27
Credit extended to stakeholders with collateral 545,000
Percentage of credits extended to stakeholders with
collateral (%) 0.38
Scale of
operations
Asset market share (%) 28.36
Net value market share (%) 30.39
Market share for guaranteed CP2 (%) 35.79
Market share for each type of bill and
bond issue and first time purchase (%) 31.40
Market share for each type of bill and
bond transaction (%) 33.65
Capital adequacy
ratio
Capital adequacy ratio (%) 13.49
Eligible capital 28,584,534

81
Total value of risk assets 211,953,033
Tier I capital as a % of total
risk-weighted assets 12.94
Note: Equations for analysis items:
1. Managerial ability
(1) Average number of days of bills and bonds holdings = 365/bills and bonds turnover rate (Bills and
bonds turnover rate = Amount of each type of bill or bond transaction/average balance of each
installment of bills or bonds).
(2) NPL ratio = NPL (including non-accrual loans)/total loans (including non-accrual loans).
(3) Total assets turnover rate = Income/average total assets.
(4) Average yield per employee = Income/total number of employees.
(5) Average profit per employee = Net Income /total number of employees.
2. Profitability
(1) ROA = Net Income/average total assets.
(2) ROE = Net Income/average stakeholders’ equity, net.
(3) Net profit margin = Net Income/income. (Income = interest income + revenues other than interest
income).
(4) EPS = (Net profit after tax-preferred stock dividend)/quantity of issued shares under weighted average
method.
3. Financial structure
(1) Liability to total assets ratio = Total liabilities/total assets. (Total liabilities exclude allowances for
guarantee liability and loss on securities exchange. )
(2) Fixed assets to stockholders’ equity ratio = Fixed assets, net/stockholders’ equity, net.
4. Growth rate
(1) Asset growth rate = (Total assets in current period-total assets for the previous period)/total assets for
the previous year.
(2) Profit growth rate = (Income before tax in current period -income before tax for the previous
year)/income before tax for the previous year.
5. Cash flow
(1) Cash flow ratio = Net cash flow from operating activities/( interbank overdraft and call loans

82
+commercial promissory note payable + financial liabilities at fair value through profit or loss + bills
and bonds payable under repurchase agreements + payables with maturity within one year).
2) Net cash flows adequacy ratio = Net cash flow from operating activities for the most recent five
years/(capital expenditure + cash dividends) for the most recent five years.
(3) Net cash flow was negative in 2012, hence not applicable.
6. Scale of operations
(1) Asset market share = Total assets/total assets of all bills finance companies.
(2) Net value market share = Net value/total net value of all bills finance companies.
(3) Market share for guaranteed CP2 = Balance of guaranteed CP2/total balance of CP2 guaranteed and
endorsed by all bills finance companies.
(4) Market share for each type of bill and bond issue and first time purchase = Amount of each type of bill
and bond issue and first time purchase/total amount of each type of bill and bond issue and first
purchase by all bills finance companies.
(5) Market share for each type of bill and bond transaction = Amount of each type of bill and bond
transaction/total amount of each type of bill and bond transaction by all bills finance companies.
7. Capital adequacy ratio
(1) Capital adequacy ratio = Eligible capital/total risk assets.
(2) Eligible capital = Tier I capital + Tier II eligible capital + Tier III eligible and used capital.
(3) Total risk assets = Credit risk weighted risk assets + (operational risk capital requirement +market risk
capital requirements) x 12.5.
(4) Ratio of Tier I capital to risk weighted assets = Tier I capital/total risk assets.

83
Supervisor’s Audit Report
We have reviewed the Company's 2016 business reports, financial
statements, property registries, and earnings distribution proposal prepared by the
board of directors. The abovementioned financial statements were audited and
certified by CPA Shu-Mei Ji and CPA Chien-Hung Chou of
PriceWaterhouseCoopers Taiwan. The supervisors found no misstatements in the
business reports, financial statements, property registries or earnings distribution
proposals above, and have issued this review report in accordance with Article
219 of the Company Act and Article 36 of the Securities and Exchange Act.
To
General Shareholders’ Meeting 2017 of Mega Bills Finance Corporation
Supervisor: Jin-Cun Chen
Supervisor: Fu-Jung Chen
Supervisor: Chun-Ke Su
March 21, 2017
Three. Supervisors’ Audit Report of Financial Statements in the Most Recent
Year

84
Four. Mega Bills Finance Co., Ltd. Financial Statements, including Report of
Independent Accountants, Balance Sheets, Statement of Comprehensive
Income, Statements of Changes in Equity, Statements of Cash Flows and
Notes to Financial Statements
PWCR16000318
Report of Independent Accountants
To the Board of Directors and Stockholders
Mega Bills Finance Co., Ltd.
Opinion
We have audited the accompanying balance sheets of Mega Bills Finance Co., Ltd. as at
December 31, 2016 and 2015, and the related statements of comprehensive income, of
changes in equity and of cash flows for the years then ended, and notes to the financial
statements, including a summary of significant accounting policies.
In our opinion, the accompanying financial statements present fairly, in all material respects,
the financial position of Mega Bills Finance Co., Ltd. as at December 31, 2016 and 2015,
and its financial performance and its cash flows for the years then ended in accordance with
the “Regulations Governing the Preparation of Financial Reports by Publicly Held Bills
Finance Companies” and the International Financial Reporting Standards, International
Accounting Standards, IFRIC Interpretations, and SIC Interpretations as endorsed by the
Financial Supervisory Commission.
Basis for opinion
We conducted our audits in accordance with the “Regulations Governing Auditing and
Attestation of Financial Statements by Certified Public Accountants” and generally accepted
auditing standards in the Republic of China (ROC GAAS). Our responsibilities under those
standards are further described in the Auditor’s Responsibilities for the Audit of the
Financial Statements section of our report. We are independent of Mega Bills Finance Co.,
Ltd. in accordance with the Code of Professional Ethics for Certified Public Accountants in
the Republic of China (the “Code”), and we have fulfilled our other ethical responsibilities
in accordance with the Code. We believe that the audit evidence we have obtained is
sufficient and appropriate to provide a basis for our opinion.
Key audit matters
Key audit matters are those matters that, in our professional judgment, were of most
significance in our audit of the financial statements of the current period. These matters were
addressed in the context of our audit of the financial statements as a whole and, in forming
our opinion thereon, we do not provide a separate opinion on these matters.

85
Reserve for guarantee liabilities of financial guarantee contracts
Description
For the accounting policy for reserve for guarantee liabilities of financial guarantee
contracts, please refer to Note 4(19) of the financial statements; for critical accounting
judgments, estimates, and key sources of assumption uncertainty of reserve for guarantee
liabilities, please refer to Note 5(2) of the financial statements; for explanations on reserve
for guarantee liabilities, please refer to Note 6(16) provisions for liabilities of the financial
statements.
As of December 31, 2016, Mega Bills Finance Co., Ltd’s estimated reserve for guarantee
liabilities for the financial guarantee contracts entered with debtors was NT$2,255,703
thousand. For reserve for guarantee liabilities, in accordance with the requirements of IAS
37, ‘Provisions, contingent liabilities and contingent assets’, Mega Bills Finance Co., Ltd
assesses the possibility of guarantee obligation occurrences and assesses the amount of
possible losses for those occurrences that are probable. In addition, in accordance with
“Regulations Governing the Procedures for Bills Finance Companies to Evaluate Assets, Set
Aside Loss Reserves, and Handle Non-Performing Credit, Non-Accrual Loans, and Bad
Debt” and related regulations, after on and off balance sheet credit assets are classified
according to the status of their loan collaterals and length of time in arrears, reserves for
guarantee liabilities are calculated, based on classification amounts and respective fixed
rates, to determine the appropriate amount of provisions, therein allowing reserve for
guarantee liabilities to be adequately provisioned. For the above-mentioned assessment of
the possibility of guarantee obligation occurrences, evidence used in Mega Bills Finance Co.,
Ltd’s judgment include observable data that indicate adverse changes in the debtor’s
payment status or market insights regarding debts overdue. The amount of possible losses is
determined by evaluating the difference between the expected recoverable amount and the
net expected guarantee obligation amount, based on experience in similar transactions,
historical loss data, and collateral value. Mega Bills Finance Co., Ltd periodically reviews
the assumptions of the above-mentioned judgment factors in order to mitigate the difference
between expected and actual amounts.
Because the aforementioned assessment of the possibility of guarantee obligation
occurrences from financial guarantee contracts and the assessment of the amount of possible
losses involve subjective judgment and numerous assumptions and estimates, we believe the
method of determining assumptions and estimates will directly affect related recognized
amounts. Thus, we have included reserve for guarantee liabilities of financial guarantee
contracts as one of the key audit matters in our audit.
How our audit addressed the matter
The procedures that we have conducted in response to specific aspects of the above-mentioned
key audit matter are summarized as follows:
1. Understood and assessed the reasonableness of Mega Bills Finance Co., Ltd’ s policies, internal
control, and assessment and processing procedures related to the provisioning of reserve for
guarantee liabilities.
2. Sampled and tested information on the debtor’s time in arrears and status of loan collaterals for
financial guarantee contracts, confirming the completeness of the financial statements and

86
the appropriateness of the logic for classifications; sampled and tested the appropriateness of
provisions that were calculated according to classifications and respective fixed rates as
stipulated under “Regulations Governing the Procedures for Bills Finance Companies to
Evaluate Assets, Set Aside Loss Reserves, and Handle Non-Performing Credit, Non-Accrual
Loans, and Bad Debt”.
3. Sampled, tested, and matched related evidence that supported the occurrence of guarantee
obligations. For example, information related to the financial and business status of debtors,
time in arrears, status of credit ratings, and credit anomalies etc.
4. Assessed Mega Bills Finance Co., Ltd’ s various assumption parameters used in assessing
reserve for guarantee liabilities. For example, the appropriateness of experience in similar
transaction and historical loss data, and periodic updates.
5. Sampled and tested the appraisal reports for the debtor’s collateral, assessed the reasonableness
of the timing and assumptions of future cash flows, and assessed the accuracy of
calculations.
Responsibilities of management and those charged with governance for the financial
statements
Management is responsible for the preparation and fair presentation of the financial statements in
accordance with the “Regulations Governing the Preparation of Financial Reports by Publicly
Held Bills Finance Companies”, “Regulations Governing the Preparation of Financial Reports by
Securities Firms” and the International Financial Reporting Standards, International Accounting
Standards, IFRIC Interpretations, and SIC Interpretations as endorsed by the Financial
Supervisory Commission, and for such internal control as management determines is necessary to
enable the preparation of financial statements that are free from material misstatement, whether
due to fraud or error.
In preparing the financial statements, management is responsible for assessing Mega Bills
Finance Co., Ltd’s ability to continue as a going concern, disclosing, as applicable, matters
related to going concern and using the going concern basis of accounting unless management
either intends to liquidate Mega Bills Finance Co., Ltd or to cease operations, or has no realistic
alternative but to do so.
Those charged with governance are responsible for overseeing Mega Bills Finance Co., Ltd’s
financial reporting process.
Auditor’s responsibilities for the audit of the financial statements
Our objectives are to obtain reasonable assurance about whether the financial statements as a
whole are free from material misstatement, whether due to fraud or error, and to issue an auditor’s
report that includes our opinion. Reasonable assurance is a high level of assurance, but is not a
guarantee that an audit conducted in accordance with ROC GAAS will always detect a material
misstatement when it exists. Misstatements can arise from fraud or error and are considered
material if, individually or in the aggregate, they could reasonably be expected to influence the
economic decisions of users taken on the basis of these financial statements.
As part of an audit in accordance with ROC GAAS, we exercise professional judgment and
maintain professional skepticism throughout the audit. We also:
1. Identify and assess the risks of material misstatement of the financial statements, whether due
to fraud or error, design and perform audit procedures responsive to those risks, and obtain

87
audit evidence that is sufficient and appropriate to provide a basis for our opinion. The risk
of not detecting a material misstatement resulting from fraud is higher than for one resulting
from error, as fraud may involve collusion, forgery, intentional omissions,
misrepresentations, or the override of internal control.
2. Obtain an understanding of internal control relevant to the audit in order to design audit
procedures that are appropriate in the circumstances, but not for the purpose of expressing
an opinion on the effectiveness of liquidate Mega Bills Finance Co., Ltd’s internal control.
3. Evaluate the appropriateness of accounting policies used and the reasonableness of accounting
estimates and related disclosures made by management.
4. Conclude on the appropriateness of management’s use of the going concern basis of accounting
and, based on the audit evidence obtained, whether a material uncertainty exists related to
events or conditions that may cast significant doubt on liquidate Mega Bills Finance Co.,
Ltd’s ability to continue as a going concern. If we conclude that a material uncertainty exists,
we are required to draw attention in our auditor’s report to the related disclosures in the
financial statements or, if such disclosures are inadequate, to modify our opinion. Our
conclusions are based on the audit evidence obtained up to the date of our auditor’s report.
However, future events or conditions may cause liquidate Mega Bills Finance Co., Ltd to
cease to continue as a going concern.
5. Evaluate the overall presentation, structure and content of the financial statements, including
the disclosures, and whether the financial statements represent the underlying transactions
and events in a manner that achieves fair presentation.
We communicate with those charged with governance regarding, among other matters, the
planned scope and timing of the audit and significant audit findings, including any significant
deficiencies in internal control that we identify during our audit.
We also provide those charged with governance with a statement that we have complied with
relevant ethical requirements regarding independence, and to communicate with them all
relationships and other matters that may reasonably be thought to bear on our independence, and
where applicable, related safeguards.
From the matters communicated with those charged with governance, we determine those matters
that were of most significance in the audit of the financial statements of the current period and are
therefore the key audit matters. We describe these matters in our auditor’s report unless law or
regulation precludes public disclosure about the matter or when, in extremely rare circumstances,
we determine that a matter should not be communicated in our report because the adverse
consequences of doing so would reasonably be expected to outweigh the public interest benefits
of such communication.
PricewaterhouseCoopers, Taiwan
March 21, 2017
--------------------------------------------------------------------------------------------------------------------- The accompanying financial statements are not intended to present the financial position and results of operations and cash flows in accordance with accounting principles generally accepted in countries and jurisdictions other than the Republic of China. The standards, procedures and
practices in the Republic of China governing the audit of such financial statements may differ from those generally accepted in countries and
jurisdictions other than the Republic of China. Accordingly, the accompanying financial statements and report of independent accountants are not intended for use by those who are not informed about the accounting principles or auditing standards generally accepted in the Republic of China,
and their applications in practice.
As the financial statements are the responsibility of the management, PricewaterhouseCoopers cannot accept any liability for the use of, or reliance on, the English translation or for any errors or misunderstandings that may derive from the translation.

88
MEGA BILLS FINANCE CO., LTD.
BALANCE SHEETS
DECEMBER 31, 2016 AND 2015
(EXPRESSED IN THOUSANDS OF NEW TAIWAN DOLLARS)
Assets Notes December 31, 2016 December 31, 2015
Cash and cash equivalents 6(1) and 7 $ 346,391 $ 321,356
Financial assets at fair value through profit or loss 6(2)(6), 7 and 8 125,297,488 115,285,106
Available-for-sale financial assets 6(3)(6), 7 and 8 132,867,186 100,816,225
Bills and bonds investment with resale agreements 6(4) - 1,000,000
Receivables – net 6(5) 1,531,891 1,185,047
Held-to-maturity financial assets 6(8) 350,000 600,000
Other financial assets – net 6(9) and 8 820,362 818,540
Property and equipment - net 6(10) 370,177 375,457
Investment property - net 6(11) 2,528,424 2,539,088
Intangible assets - net 3,310 2,427
Deferred income tax assets - net 6(29) 152,104 106,254
Other assets – net 6(12) and 7 34,868 48,225
TOTAL ASSETS $ 264,302,201 $ 223,097,725
Liabilities and equity
Interbank overdraft and call loans 6(13), 7 and 8 $ 15,714,592 $ 11,294,776
Financial liabilities at fair value through profit or loss 6(7)(14) 22,543 6,149
Bills and bonds payable under repurchase agreements 6(2)(3)(4) and 7 210,809,807 173,109,248
Payables 6(15) 602,808 504,042
Current income tax liabilities 6(29) 191,490 131,256
Provisions for liabilities 6(16)(17) and 7 2,728,105 2,757,420
Deferred income tax liabilities 6(29) 22,700 12,647
Other liabilities 7 431,098 828,935
TOTAL LIABILITIES 230,523,143 188,644,473
Capital stock
Common stocks 6(18) 13,114,411 13,114,411
Capital surplus 6(19) 320,929 320,929
Retained earnings 6(20)
Legal reserve 17,209,762 16,319,161
Special reserve 203,090 203,090
Unappropriated retained earnings 2,963,015 2,968,669
Other equity interest
Unrealized valuation gain or loss of available-for-sale
financial assets
( 32,149 ) 1,526,992
TOTAL EQUITY 33,779,058 34,453,252
Significant contingent liabilities and unrecognized
contract commitments
9
TOTAL LIABILITIES AND EQUITY $ 264,302,201 $ 223,097,725
The accompanying notes are an integral part of these financial statements.

89
MEGA BILLS FINANCE CO., LTD.
STATEMENTS OF COMPREHENSIVE INCOME FOR THE YEARS ENDED DECEMBER 31, 2016 AND 2015
(EXPRESSED IN THOUSANDS OF NEW TAIWAN DOLLARS, EXCEPT FOR EARNINGS PER SHARE)
For the years ended December 31,
Items Notes 2016 2015
Interest income 6(21) $ 3,322,888 $ 2,930,965
Less:interest expense 6(21) and 7 ( 899,280 ) ( 901,456 )
Interest income, net 2,423,608 2,029,509
Non-interest income, net
Service fee and commission income, net 6(22) and 7 1,021,838 967,377
Gain or loss from financial assets and liabilities at
fair value through profit or loss
6(2)(14)(23) and
7 508,425 598,034
Realized gain or loss on available-for-sale financial
assets
6(24)
225,269 432,215
Foreign exchange gain or loss, net 2,544 3,203
Other non-interest income or loss, net
Leasehold income 7 106,167 112,699
Others 33,858 20,877
Net revenues 4,321,709 4,163,914
Reversals (provisions) 6(25) 45,896 134,508
Operating expenses
Employee benefit expense 6(17)(26) ( 565,372 ) ( 562,029 )
Depreciation and amortization 6(27) ( 24,660 ) ( 23,592 )
Other business and administrative expenses 6(28) and 7 ( 206,528 ) ( 206,991 )
Total operating expenses ( 796,560 ) ( 792,612 )
Income before income tax from operating unit 3,571,045 3,505,810
Income tax expense 6(29) ( 590,919 ) ( 495,374 )
Net income 2,980,126 3,010,436
Other comprehensive income
Not reclassifiable to profit or loss:
Remeasurement of defined benefit plans 6(17) ( 21,513 ) ( 46,645 )
Income tax relating to items that are not
reclassifiable to profit or loss
6(29)
3,657 7,929
Potentially reclassifiable to profit or loss
subsequently:
Unrealized profit or loss on valuation of
available-for-sale financials assets
( 1,559,141 ) 424,155
Total other comprehensive (loss) income (after
income tax)
( 1,576,997 ) 385,439
Total comprehensive income $ 1,403,129 $ 3,395,875
Earnings per share
Basic and diluted earnings per share 6(30) $ 2.27 $ 2.30
The accompanying notes are an integral part of these financial statements.

90
MEGA BILLS FINANCE CO., LTD. STATEMENTS OF CHANGES IN EQUITY
FOR THE YEARS ENDED DECEMBER 31, 2016 AND 2015 (EXPRESSED IN THOUSANDS OF NEW TAIWAN DOLLARS)
Retained Earnings Other equity interest
Capital Stocks
Capital Surplus
Legal
Reserve
Special Reserve
Unappropriated Retained Earnings
Unrealized gain or loss on available-for-sale
financial assets
Total equity
For the year ended December 31, 2015
Balance as of January 1, 2015 $ 13,114,411 $ 320,929 $ 15,429,923 $ 203,090 $ 2,959,575 $ 1,102,837 $ 33,130,765
Appropriation of 2014 earnings (Note)
Legal reserve - - 889,238 - ( 889,238 ) - -
Cash dividends - - - - ( 2,073,388 ) - ( 2,073,388 )
Total comprehensive income
Net income for 2015 - - - - 3,010,436 - 3,010,436
Total other comprehensive (loss) income for 2015 - - - - ( 38,716 ) 424,155 385,439
Total comprehensive income for 2015 - - - - 2,971,720 424,155 3,395,875
Balance as of December 31, 2015 $ 13,114,411 $ 320,929 $ 16,319,161 $ 203,090 $ 2,968,669 $ 1,526,992 $ 34,453,252
For the year ended December 31, 2016
Balance as of January 1, 2016 $ 13,114,411 $ 320,929 $ 16,319,161 $ 203,090 $ 2,968,669 $ 1,526,992 $ 34,453,252
Appropriation of 2015 earnings (Note)
Legal reserve - - 890,601 - ( 890,601 ) - -
Cash dividends - - - - ( 2,077,323 ) - ( 2,077,323 )
Total comprehensive income
Net income for 2016 - - - - 2,980,126 - 2,980,126
Total other comprehensive loss for 2016 - - - - ( 17,856 ) ( 1,559,141 ) ( 1,576,997 )
Total comprehensive income (loss) for 2016 - - - - 2,962,270 ( 1,559,141 ) 1,403,129
Balance as of December 31, 2016 $ 13,114,411 $ 320,929 $ 17,209,762 $ 203,090 $ 2,963,015 ( $ 32,149 ) $ 33,779,058
Note: Employee remuneration (bonuses) amounting to $62,175 and $64,322 thousand for 2015 and 2014 have been deducted from the statements of comprehensive income.
The accompanying notes are an integral part of these financial statements.

91
MEGA BILLS FINANCE CO., LTD.
STATEMENTS OF CASH FLOWS FOR THE YEARS ENDED DECEMBER 31, 2016 AND 2015
(EXPRESSED IN THOUSANDS OF NEW TAIWAN DOLLARS)
For the years ended December 31,
Notes 2016 2015
Cash Flows from Operating Activities
Income before income tax $ 3,571,045 $ 3,505,810
Adjustments to reconcile income before tax to net cash
provided by operating activities:
Income and expenses having no effect on cash flows
Depreciation 6(27) 20,660 19,550
Amortization 6(27) 4,000 4,042
Reversal for bad debts and various reserves 6(16) ( 41,865 ) ( 64,115 )
Interest income 6(21) ( 3,322,888 ) ( 2,930,965 )
Dividend income ( 49,064 ) ( 75,992 )
Interest expense 6(21) 899,280 901,456
Gains on disposal of property and equipment ( 53 ) ( 590 )
Changes in assets/liabilities relating to operating assets:
(Increase) decrease in financial assets at fair value through
profit or loss
( 10,012,382 ) 1,741,510
Decrease in bills and bonds investment with resale
agreements
1,000,000 8,805,054
Increase in receivables ( 52,191 ) ( 3,928 )
Increase in available-for-sale financial assets ( 33,610,102 ) ( 17,058,190 )
Decrease in held-to-maturity financial assets 250,000 250,000
Increase in other financial assets ( 27,625 ) ( 40,040 )
Decrease (increase) in other assets 18,122 ( 20,018 )
Increase in financial liabilities at fair value through profit or
loss
16,394 5,738
Increase in bills and bonds payable under repurchase
agreements
37,700,559 9,331,357
Increase in payables 67,925 11,460
Increase in provisions for liabilities 17,472 18,186
(Decrease) increase in other liabilities ( 397,837 ) 712,394
Interest paid ( 868,439 ) ( 911,675 )
Interest received 3,027,603 2,754,211
Dividend received 49,064 75,992
Income tax paid ( 562,825 ) ( 429,278 )
Net cash (used in) provided by operating activities ( 2,303,147 ) 6,601,969
Cash Flows from Investing Activities
Acquisition of property and equipment 6(10) ( 4,723 ) ( 15,075 )
Increase in intangible assets ( 1,627 ) ( 721 )
Increase in other assets ( 8,021 ) ( 4,448 )
Proceeds from disposal of property and equipment 60 590
Net cash used in investing activities ( 14,311 ) ( 19,654 )
Cash Flows from Financing Activities
Increase (decrease) in interbank overdraft and call loans 4,419,816 ( 4,631,837 )
Payments of cash dividends ( 2,077,323 ) ( 2,073,388 )
Net cash provided by (used in) financing activities 2,342,493 ( 6,705,225 )
Net increase (decrease) in cash and cash equivalents 25,035 ( 122,910 )
Cash and cash equivalents, beginning of year 6(1) 321,356 444,266
Cash and cash equivalents, end of year 6(1) $ 346,391 $ 321,356
The accompanying notes are an integral part of these financial statements.

92
MEGA BILLS FINANCE CO., LTD.
NOTES TO FINANCIAL STATEMENTS
DECEMBER 31, 2016 AND 2015
(Expressed in thousands of new Taiwan dollars, except as otherwise indicated)
1. HISTORY AND ORGANIZATION
(1) Mega Bills Finance Co., Ltd. (the “Company”) formerly known as Chung Hsing Bills
Finance Co., Ltd., was established on May 3, 1976. In accordance with the Explanatory
Letter Jing-Shou-Shang-Zi Ruling 09501114390 of Economic Affairs, R.O.C., dated June
14, 2006, the Company was renamed as Mega Bills Finance Co., Ltd. The Company is
mainly engaged in (1) acting as guarantor and endorser of commercial paper (CP2); (2)
approval, underwriting, brokerage and proprietary trading service of short-term negotiable
instruments; (3) approval, underwriting, brokerage and proprietary trading service of bank
debentures; (4) proprietary trading service of government bonds; (5) proprietary trading
service of corporate bonds; (6) transactions of derivative financial instruments; (7)
investments of equity instruments; (8) proprietary trading and investment service of fixed
income securities; (9) corporate financial consulting service and (10) other business
approved by the authorities.
(2) The common stock of the Company was originally traded on the Taiwan Stock Exchange.
Pursuant to a resolution in the 2002 annual stockholders’ meeting, the Company was
merged into Mega Financial Holding Co., Ltd. (hereinafter referred to as “Mega Holding”)
by way of a share swap. The ratio of the share swap was 1.39 shares of the Company’s
common stock for one common share of Mega Holding. As a result, the Company was
de-listed from the Taiwan Stock Exchange on August 22, 2002.
(3) Mega Holding is the parent company of the Company (Ultimate parent).
(4) The number of employees of the Company was 231 and 229 as of December 31, 2016 and
2015, respectively.
2. THE DATE OF AUTHORIZATION FOR ISSUANCE OF THE FINANCIAL STATEMENTS
AND PROCEDURES FOR AUTHORIZATION
These financial statements were authorized for issuance by the Board of Directors on March 21,
2017.
3. APPLICATION OF NEW STANDARDS, AMENDMENTS AND INTERPRETATIONS
(1) Effect of the adoption of new issuances of or amendments to International Financial
Reporting Standards as endorsed by the Financial Supervisory Commission (“FSC”)
None.
(2) Effect of new issuances of or amendments to International Financial Reporting Standards
as endorsed by the FSC but not yet adopted by the Company
New standards, interpretations and amendments endorsed by FSC effective from 2017 are
as follows:

93
New Standards, Interpretations and Amendments
Effective date by
International
Accounting
Standards Board
Investment entities: applying the consolidation exception
(amendments to IFRS 10, IFRS 12 and IAS 28)
January 1, 2016
Accounting for acquisition of interests in joint operations
(amendments to IFRS 11)
January 1, 2016
IFRS 14,‘Regulatory deferral accounts’ January 1, 2016
Disclosure initiative (amendments to IAS 1) January 1, 2016
Clarification of acceptable methods of depreciation and amortization
(amendments to IAS 16 and IAS 38)
January 1, 2016
Agriculture: bearer plants (amendments to IAS 16 and IAS 41) January 1, 2016
Defined benefit plans: employee contributions (amendments to IAS
19R)
July 1, 2014
Equity method in separate financial statements (amendments to IAS
27)
January 1, 2016
Recoverable amount disclosures for non-financial assets
(amendments to IAS 36)
January 1, 2014
Novation of derivatives and continuation of hedge accounting
(amendments to IAS 39)
January 1, 2014
IFRIC 21, ‘Levies’ January 1, 2014
Improvements to IFRSs 2010-2012 July 1, 2014
Improvements to IFRSs 2011-2013 July 1, 2014
Improvements to IFRSs 2012-2014 January 1, 2016
The above standards and interpretations have no significant impact to the Company’s
financial condition and operating result based on the Company’s assessment.
(3) IFRSs issued by IASB but not yet endorsed by the FSC
New standards, interpretations and amendments issued by IASB but not yet included in the
IFRSs endorsed by the FSC effective from 2017 are as follows:
New Standards, Interpretations and Amendments
Effective date by
International
Accounting
Standards Board
Classification and measurement of share-based payment transactions
(amendments to IFRS 2)
January 1, 2018
Applying IFRS 9 ‘Financial instruments’ with IFRS 4‘Insurance
contracts’ (amendments to IFRS 4)
January 1, 2018
IFRS 9, ‘Financial instruments’ January 1, 2018
Sale or contribution of assets between an investor and its associate or
joint venture (amendments to IFRS 10 and IAS 28)
To be determined
by International
Accounting
Standards Board

94
New Standards, Interpretations and Amendments
Effective date by
International
Accounting
Standards Board
IFRS 15, ‘Revenue from contracts with customers’ January 1, 2018
Clarifications to IFRS 15, ‘Revenue from contracts with customers’
(amendments to IFRS 15)
January 1, 2018
IFRS 16, ‘Leases’ January 1, 2019
Disclosure initiative (amendments to IAS 7) January 1, 2017
Recognition of deferred tax assets for unrealized losses (amendments
to IAS 12)
January 1, 2017
Transfers of investment property (amendments to IAS 40) January 1, 2018
IFRIC 22, ‘Foreign currency transactions and advance consideration’ January 1, 2018
Annual improvements to IFRSs 2014-2016 cycle- Amendments to
IFRS 1, ‘First-time adoption of International Financial Reporting
Standards’
January 1, 2018
Annual improvements to IFRSs 2014-2016 cycle- Amendments to
IFRS 12, ‘Disclosure of interests in other entities’
January 1, 2017
Annual improvements to IFRSs 2014-2016 cycle- Amendments to
IAS 28, ‘Investments in associates and joint ventures’
January 1, 2018
Except for the following, the above standards and interpretations have no significant
impact to the Company’s financial condition and operating result based on the Company’s
assessment. The quantitative impact will be disclosed when the assessment is complete.
A. IFRS 9, ‘Financial instruments’
(A) Classification of debt instruments is driven by the entity’s business model and the
contractual cash flow characteristics of the financial assets, which would be
classified as financial asset at fair value through profit or loss, financial asset
measured at fair value through other comprehensive income or financial asset
measured at amortized cost. Equity instruments would be classified as financial asset
at fair value through profit or loss, unless an entity makes an irrevocable election at
inception to present in other comprehensive income subsequent changes in the fair
value of an investment in an equity instrument that is not held for trading.
(B) The impairment losses of debt instruments are assessed using an ‘expected credit
loss’ approach. An entity assesses at each balance sheet date whether there has been a
significant increase in credit risk on that instrument since initial recognition to
recognize 12-month expected credit losses or lifetime expected credit losses (interest
revenue would be calculated on the gross carrying amount of the asset before
impairment losses occurred); or if the instrument that has objective evidence of
impairment, interest revenue after the impairment would be calculated on the book
value of net carrying amount (i.e. net of credit allowance).
(C) The amended general hedge accounting requirements align hedge accounting more
closely with an entity’s risk management strategy. Risk components of non-financial
items and a group of items can be designated as hedged items. The standard relaxes
the requirements for hedge effectiveness, removing the 80-125% bright line, and
introduces the concept of ‘rebalancing’; while its risk management objective remains
unchanged, an entity shall rebalance the hedged item or the hedging instrument for
the purpose of maintaining the hedge ratio.

95
B. IFRS 15, ‘Revenue from contracts with customers’
IFRS 15, ‘Revenue from contracts with customers’ replaces IAS 11 ‘Construction
contracts’, IAS 18 ‘Revenue’ and relevant interpretations. According to IFRS 15,
revenue is recognized when a customer obtains control of promised goods or services. A
customer obtains control of goods or services when a customer has the ability to direct
the use of, and obtain substantially all of the remaining benefits from, the asset.
The core principle of IFRS 15 is that an entity recognizes revenue to depict the transfer
of promised goods or services to customers in an amount that reflects the consideration
to which the entity expects to be entitled in exchange for those goods or services. An
entity recognizes revenue in accordance with that core principle by applying the
following steps:
Step 1: Identify contracts with customer
Step 2: Identify separate performance obligations in the contract(s)
Step 3: Determine the transaction price
Step 4: Allocate the transaction price.
Step 5: Recognize revenue when the performance obligation is satisfied.
4. SUMMARY OF SIGNIFICANT ACCOUNTING POLICIES
The principal accounting policies applied in these financial statements are set out below.
These accounting policies set out below have been consistently applied to all the periods
presented in financial statements, unless otherwise stated.
(1) Compliance statement
The financial statements of the Company have been prepared in accordance with the
“Regulations Governing the Preparation of Financial Reports by Publicly Held Bills Finance
Companies”, “Regulations Governing the Preparation of Financial Reports by Securities
Firms”, and the International Financial Reporting Standards, International Accounting
Standards, IFRIC Interpretations, and SIC Interpretations as endorsed by the FSC
(collectively referred herein as the “IFRSs”).
(2) Basis for preparation
A. Except for the following items, these financial statements have been prepared under the
historical cost convention:
(A) Financial assets and financial liabilities (including derivative instruments) at fair value
through profit or loss.
(B) Available-for-sale financial assets measured at fair value.
(C) Defined benefit liabilities recognized based on the net amount of pension fund assets
less present value of defined benefit obligation.
B.The preparation of financial statements in conformity with IFRSs requires the use of
certain critical accounting estimates. It also requires management to exercise its judgment
in the process of applying the Company’s accounting policies. The areas involving a
higher degree of judgment or complexity, or areas where assumptions and estimates are
significant to the financial statements are disclosed in Note 5.
(3) Foreign currency translations
A. Functional and presentation currency
Items included in the financial statements of the Company are measured using the
currency of the primary economic environment in which it operates (the “functional
currency”). The financial statements are presented in New Taiwan Dollars, which is the

96
Company’s functional and presentation currency.
B. Transactions and balances
(A) Foreign currency transactions are translated into the functional currency using the
exchange rates prevailing at the dates of the transactions or valuation where items are
remeasured. Foreign exchange gains and losses resulting from the settlement of such
transactions are recognized in profit or loss in the period in which they arise.
(B) Monetary assets and liabilities denominated in foreign currencies at the period end
are re-translated at the spot exchange rates prevailing at the balance sheet date.
Exchange differences arising upon re-translation at the balance sheet date are
recognized in profit or loss.
(4) Cash and cash equivalents
“Cash and cash equivalents” include cash on hand, demand deposits, short-term highly
liquid time deposits or investments that are readily convertible to known amount of cash and
subject to an insignificant risk of changes in value. Time deposits refer to those with
short-term maturity used to satisfy short-term cash commitments that are not held for
investment purposes or other purposes.
(5) Financial assets at fair value through profit or loss
A. Financial assets at fair value through profit or loss are financial assets held for trading or
financial assets designated as at fair value through profit or loss on initial recognition.
Financial assets are classified in this category of held for trading if acquired principally
for the purpose of selling in the short-term. Derivatives are also categorized as financial
assets held for trading. Financial assets that meet one of the following criteria are
designated as at fair value through profit or loss on initial recognition:
(A) Hybrid (combined) contracts; or
(B) They eliminate or significantly reduce a measurement or recognition inconsistency;
or
(C) They are managed and their performance is evaluated on a fair value basis, in
accordance with a documented risk management or investment strategy.
B. On a regular way purchase or sale basis, financial assets at fair value through profit or loss
are recognized and derecognized using trade date accounting.
C. Financial assets at fair value through profit or loss are initially recognized at fair value.
Related transaction costs are expensed in profit or loss. These financial assets are
subsequently remeasured and stated at fair value, and any changes in the fair value of
these financial assets are recognized in profit or loss.
(6) Bills and bonds under repurchase or resale agreements
Bills and bonds under repurchase or resale agreements are stated at the amount actually
received from or paid to the counterparties. When transactions of bills and bonds with a
condition of resale agreements occur, the actual payment shall be recognized in bills and
bonds investment with resale agreements. When transactions of bills and bonds with a
condition of repurchase agreements occur, the actual receipt shall be recognized in bills and
bonds payable under repurchase agreements. Any difference between the actual
payment/receipt and predetermined resale (repurchase) price is recognized in interest income
or interest expense.

97
(7) Available-for-sale financial assets
A. Available-for-sale financial assets are non-derivatives that are either designated in this
category or not classified in any of the other categories.
B. On a regular way purchase or sale basis, available-for-sale financial assets are recognized
and derecognized using trade date accounting.
C. Available-for-sale financial assets are initially recognized at fair value plus transaction
costs. These financial assets are subsequently remeasured and stated at fair value. Any
changes in the fair value of these financial assets are recognized in other comprehensive
income and shall be recognized as profit or loss in the period when available-for-sale
financial assets are derecognized.
D. When the reduction of fair value of available-for-sale financial asset has been recognized
in other comprehensive income and with objective evidence indicating that the
impairment has incurred, even if the financial asset has not been derecognized,
accumulated losses recognized in other comprehensive income shall be reclassified from
equity items to gain and loss. The amount of the impairment loss is measured as the
difference between the asset’s acquisition cost (less any principal repayment and
amortization) and current fair value, less any impairment loss on that financial asset
previously recognized in profit or loss.
In respect of investment in equity instruments classified as available-for-sale, whose
impairment loss recognized in profit or loss shall not be reversed through profit or loss.
Any increase in fair value subsequent to an impairment loss is recognized in other
comprehensive income. For debt instruments classified as available-for-sale, impairment
loss can be reversed and recognized in profit or loss if subsequent increase in the fair
value of the investment can be objectively related to an event occurring after the
impairment loss is recognized in profit or loss.
(8) Held-to-maturity financial assets
A. Held-to-maturity financial assets are non-derivative financial assets with fixed or
determinable payments and fixed maturity date that the Company has the positive
intention and ability to hold to maturity other than those that meet the definition of loans
and receivables and those that are designated as at fair value through profit or loss or as
available-for-sale on initial recognition.
B. On a regular way purchase or sale basis, held-to-maturity financial assets are recognized
and derecognized using trade date accounting.
C. Held-to-maturity financial assets are initially recognized at fair value on the trade date
plus transaction costs and subsequently measured at amortized cost using the effective
interest method, less provision for impairment. Amortization of a premium or a discount
on such assets is recognized in profit or loss.

98
D. An impairment loss is recognized when there is objective evidence of impairment. The
amount of the impairment loss is the difference between the financial assets’ book value
and the estimated future cash flow discounted using the original effective interest rate. In
the subsequent period, if the amount of the impairment loss decreases due to an event
occurring after the impairment was originally recognized, the previously recognized
impairment loss is reversed through profit or loss to the extent that the carrying amounts
shall not exceed the amortized cost that would have been determined had no impairment
loss been recognized in prior years.
(9) Financial assets measured at cost
A. Financial assets measured at cost refer to investments in equity instruments that do not
have a quoted market price in an active market or derivatives that are linked to unquoted
equity instruments without reliably measured fair value and must be settled by delivery of
such unquoted equity instruments.
B. Financial assets measured at cost are accounted for using trade date accounting. These
assets are initially recognized at fair value plus transaction costs of acquisition. The fair
value can be reasonably estimated when the following criteria are met at the balance sheet
date: (a) the variability in the range of reasonable fair value estimates is insignificant for
that instrument, or (b) the probabilities of the estimates within the range can be
reasonably assessed and used in estimating fair value. If the variability in the range of
reasonable fair value estimate could vary significantly, and the probabilities of the various
estimates cannot be reasonably measured, then it should be assessed by cost instead of
fair value.
C. When there is objective evidence of impairment indicating an impairment loss has
occurred on the financial assets carried at cost, the impairment loss should be recognized
under asset impairment loss. The amount of the impairment loss is measured as the
difference between the asset’s carrying amount and the present value of estimated future
cash flows discounted at current market return rate of similar financial asset. Such
impairment loss is not reversible.
(10) Accounts receivable and overdue receivables
Accounts receivable include accounts receivable, notes receivable and other receivables.
Accounts receivable are accounted for as follows:
A. The commercial papers guaranteed by the Company which matures without being
presented immediately within six months from the maturity, shall be accounted for as
accounts receivable. Receivables overdue for longer than six months shall be accounted
for as overdue receivables.
B. During the period which guaranteed commercial papers are issued for, the collateral is
subject to provisional attachment yet the borrower still pays the interest regularly. In
order to extend a grace period for the borrower to apply for removal of such attachment,
if such commercial paper matures without being presented immediately, the balance of
the commercial paper shall be accounted for as notes receivable.
C. Other receivables represent accounts receivable except for those listed under designated
accounts.
D. Accounts receivable and overdue receivables are initially recognized at fair value,
which includes the price of transaction, significant costs of transaction, significant
handling fees paid or received, discount and premium, etc., and subsequently measured

99
at amortized cost using the effective interest method.
E. Allowance for doubtful accounts for claims such as accounts receivable and overdue
receivables is recognized by assessing at balance sheet date whether objective evidence
exists indicating impairment losses generated from material individual financial assets,
and impairment losses generated individually or as a company from immaterial
individual financial assets. An impairment loss is recognized when there is objective
evidence of impairment. The amount of the impairment loss is the difference between
the financial assets’ book value and the estimated future cash flow discounted using the
original effective interest rate. In the subsequent period, if the amount of the impairment
loss decreases due to an event occurring after the impairment was originally recognized,
the previously recognized impairment loss is reversed through profit or loss to the
extent that the carrying amounts shall not exceed the amortized cost that would have
been determined had no impairment loss been recognized in prior years.
(11) Property and equipment
A. Property and equipment are initially recorded at cost.
B. Land is not depreciated. Other property and equipment apply cost model and are
depreciated using the straight-line method to allocate their cost over their estimated
useful lives. The assets’ residual values, useful lives and depreciation methods are
reviewed, and adjusted if appropriate, at each balance sheet date. If expectations for the
assets’ residual values and useful lives differ from previous estimates or the patterns of
consumption of the assets’ future economic benefits embodied in the assets have
changed significantly, any change is accounted for as a change in estimate under IAS 8,
‘Accounting Policies, Changes in Accounting Estimates and Errors’, from the date of
the change. The estimated useful lives of property and equipment are as follows:
buildings, 60 years; machinery and computer equipment, 3 to 8 year; miscellaneous
equipment, 3 to 18 years.
C. Subsequent costs are included in the asset’s carrying amount or recognized as a separate
asset, as appropriate, only when it is probable that future economic benefits associated
with the item will flow to the Company and the cost of the item can be measured
reliably. The carrying amount of the replaced part is derecognized. All other repairs and
maintenance are charged to profit or loss during the financial period in which they are
incurred.
(12) Operating leases
Payments made under an operating lease (net of any incentives received from the lessor)
are recognized in profit or loss on a straight-line basis over the lease term.
(13) Investment property
An investment property is stated initially at its cost and measured subsequently using the
cost model. Except for land, investment property is depreciated on a straight-line basis
over its estimated useful life of 60 years.
(14) Intangible assets
A. Computer software is stated at cost and amortized on a straight-line basis over its
estimated useful life of 3 to 8 years.
B. Intangible assets are subsequently measured using the cost model.
(15) Impairment of financial assets

100
A. The Company assesses at each balance sheet date whether there is objective evidence
that a financial asset or a company of financial assets is impaired as a result of one or
more events that occurred after the initial recognition of the asset (a ‘loss event’) and
that loss event (or events) has an impact on the estimated future cash flows of the
financial asset or Company of financial assets that can be reliably estimated.
B. The criteria that the Company uses to determine whether there is objective evidence of
an impairment loss is as follows:
(A) Significant financial difficulty of the issuer or debtor;
(B) A breach of contract, such as a default or delinquency in interest or principal
payments;
(C) The Company, for economic or legal reasons relating to the borrower’s financial
difficulty, granted the borrower a concession that a lender would not otherwise
consider;
(D) It becomes probable that the borrower will enter bankruptcy or other financial
reorganization;
(E) The disappearance of an active market for that financial asset because of financial
difficulties;
(F) Observable data indicating that there is a measurable decrease in the estimated future
cash flows from a group of financial assets since the initial recognition of those
assets, although the decrease cannot yet be identified with the individual financial
asset in the group, including adverse changes in the payment status of borrowers in
the group or national or local economic conditions that correlate with defaults on
the assets in the group;
(G) Information about significant changes with an adverse effect that have taken place
in the technology, market, economic or legal environment in which the issuer
operates, and indicates that the cost of the investment in the equity instrument may
not be recovered;
(H) A significant or prolonged decline in the fair value of an investment in an equity
instrument below its cost; or
(I) Other objective evidence.
C. When the Company assesses that there has been objective evidence of impairment and
an impairment loss has occurred, accounting for impairment shall be made according to
the category of financial assets as mentioned previously.
(16) Impairment of non-financial assets
The Company assesses at each balance sheet date the recoverable amounts of those assets
where there is an indication that they are impaired. An impairment loss is recognized for
the amount by which the asset’s carrying amount exceeds its recoverable amount. The
recoverable amount is the higher of an asset’s fair value less costs to sell or value in use.
When the circumstances or reasons for recognizing impairment loss for an asset in prior
years no longer exist or diminish, the impairment loss is reversed. The increased carrying
amount due to reversal should not be more than what the depreciated or amortized
historical cost would have been if the impairment had not been recognized.

101
(17) Derecognition of financial assets and liabilities
A. The Company derecognizes a financial asset when the contractual rights to receive the
cash flows from the financial asset expire.
B. A financial liability is derecognized when the obligation under the liability specified in
the contract is discharged or cancelled or expired.
(18) Offsetting financial instruments
Financial assets and liabilities are offset and reported in the net amount in the balance sheet
when there is a legally enforceable right to offset the recognized amounts and there is an
intention to settle on a net basis or realize the asset and settle the liability simultaneously.
(19) Financial guarantee contracts
The Company initially recognizes financial guarantee contracts at fair value on the date of
issuance. The Company charges a service fee when the contract is signed and therefore the
service fee income charged is the fair value at the date that the financial guarantee contract
is signed. Service fee received in advance is recognized in deferred accounts and amortized
through straight-line method during the contract term.
Subsequently, the Company should measure the financial guarantee contract issued at the
higher of:
A. the amount determined in accordance with IAS 37, “Provisions, contingent liabilities
and contingent assets” and
B. The amount initially recognized less, when appropriate, cumulative amortization
recognized in accordance with IAS 18, “Revenue”.
The best estimate of the liability amount of a financial guarantee contract requires
management to exercise their judgment combined with historical loss data based on the
similar transaction experiences. The increase in liabilities due to financial guarantee
contract is recognized in “Provisions”.
The Company assesses the possible loss on credit assets within and off balance sheets in
accordance with “Regulations Governing the Procedures for Bills Finance Companies to
Evaluate Assets, Set Aside Loss Reserves, and Handle Non-Performing Credit,
Non-Accrual Loans, and Bad Debt”, and provides adequate reserve for guarantee
liabilities.
(20) Provisions for liabilities, contingent liabilities and contingent assets
A. When all the following criteria are met, the Company shall recognize a provision:
(A) A present obligation (legal or constructive) as a result of a past event;
(B) It is probable that an outflow of resources embodying economic benefits will be
required to settle the obligation; and
(C) The amount of the obligation can be reliably estimated.
If there are several similar obligations, the outflow of economic benefit as a result
of settlement is determined based on the overall obligation. Provisions for liabilities
should be recognized when the outflow of economic benefits is probable in order to
settle the obligation as a whole even if the outflow of economic benefits from any

102
one of the obligation is remote.
Provisions are measured by the present value of expense which is required for
settling the anticipated obligation. The pre-tax discount rate is used with timely
adjustment that reflects the current market assessments on the time value of money
and the risks specific to the obligation.
B. Contingent liability is a possible obligation that arises from past event, whose existence
will be confirmed only by the occurrence or non-occurrence of one or more uncertain
future events not wholly within the control of the Company. Or it could be a present
obligation as a result of past event but the payment is not probable or the amount cannot
be measured reliably. The Company did not recognize any contingent liabilities but
made appropriate disclosure in compliance with relevant regulations.
C. Contingent asset is a possible obligation that arises from past event, whose existence
will be confirmed only by the occurrence or non-occurrence of one or more uncertain
future events not wholly within the control of the Company. The Company did not
recognize any contingent assets and made appropriate disclosure in compliance with
relevant regulations when the economic inflow is probable.
(21) Employee benefits
A. Short-term employee benefits
Short-term employee benefits are measured at the undiscounted amount of the benefits
expected to be paid in respect of service rendered by employees in a period and should
be recognized as expenses in that period when the employees render service.
B. Pensions
The pension plan of the Company includes both defined contribution plans and defined
benefit plans.
(A) Defined contribution plans
For defined contribution plans, the contributions are recognized as pension
expenses when they are due on an accrual basis. Prepaid contributions are
recognized as an asset to the extent of a cash refund or a reduction in the future
payments.
(B) Defined benefit plans
a. Net obligation under a defined benefit plan is defined as the present value of an
amount of pension benefits that employees will receive on retirement for their
services with the Company in current period or prior periods. The liability
recognized in the balance sheet in respect of defined benefit pension plans is the
present value of the defined benefit obligation at the balance sheet date less the
fair value of plan assets. The defined benefit net obligation is calculated annually
by independent actuaries using the projected unit credit method. The rate used to
discount is determined by using market yields at the balance sheet date on
high-quality corporate bonds with a currency and term consistent with the
currency and term of the related pension liability; when there is no deep market
in high-quality corporate bonds, the Company uses market yields on government
bonds (at the balance sheet date) instead.

103
b. Remeasurement arising on defined benefit plans are recognized in other
comprehensive income in the period in which they arise and are recorded as
retained earnings.
c. Past service costs are recognized immediately in profit or loss.
C. Employees’ remuneration
Employees’ remuneration is recognized as expenses and liabilities, provided that such
recognition is required under legal obligation or constructive obligation and those
amounts can be reliably estimated. Any difference between the resolved amounts and
the subsequently actual distributed amounts is accounted for as changes in estimates.
(22) Revenue and expense
Income and expense of the Company are recognized as incurred, the main components are
as follows:
A. Interest income and expense: Interest income means interest income generated from
holding bills and bonds, bills and bonds investment with resale agreements, various
deposits, and other financial assets. Interest expense means various interest expenses
resulting from bills and bonds payable under repurchase agreements and financing from
banks. All the interest income and interest expense generated from interest-bearing
financial instruments are calculated by effective interest rate according to relevant
regulations and recognized as interest income and interest expense.
B. Service fee income and expense: Service fee income means service fee income earned
from provision of guarantee, certification, and underwriting services. Service fee
expense means expenses resulting from authorizing others to handle various procedures.
Amounts the Company receives when providing the services, such as guarantee service,
is recognized as service fee income on a straight-line basis over the guarantee period. If
the amounts earned are classified as income from implementation of significant
activities, such as certification service, the amounts shall be recognized as income when
the certification service is completed.
C. Operating expenses: operating expenses refer to expenditures required to carry out
business operations, which primarily comprise employee benefit expense, depreciation
and amortization expenses, and other business and administrative expenses.
(23) Income tax
A. The tax expense for the period comprises current and deferred tax. Tax is recognized in
profit or loss, except to the extent that it relates to items recognized in other
comprehensive income or items recognized directly in equity, in which cases the tax is
recognized in other comprehensive income or equity.
B. The current income tax expense is calculated on the basis of the tax laws enacted or
substantively enacted at the balance sheet date in the countries where the Company
operate and generate taxable income. Management periodically evaluates positions
taken in tax returns with respect to situations in accordance with applicable tax
regulations. It establishes provisions where appropriate based on the amounts expected
to be paid to the tax authorities. An additional 10% tax is levied on the unappropriated
retained earnings and is recorded as income tax expense in the year the stockholders
resolve to retain the earnings.

104
C. Deferred income tax is recognized, using the balance sheet liability method, on
temporary differences arising between the tax bases of assets and liabilities and their
carrying amounts in the balance sheet. Deferred income tax is determined using tax
rates (and laws) that have been enacted or substantially enacted by the balance sheet
date and are expected to apply when the related deferred income tax asset is realized or
the deferred income tax liability is settled.
D. Deferred income tax assets are recognized only to the extent that it is probable that
future taxable profit will be available against which the temporary differences can be
utilized. At each balance sheet date, unrecognized and recognized deferred income tax
assets are reassessed.
E. Although the Company’s income tax returns are filed jointly with Mega Holding, the
Company’s parent company, and its other subsidiaries starting 2003, income taxes are
accounted for by the same principles stated above. The estimated amount of receivables
(payables) arising from the joint filing of income tax returns is recorded under “Current
income tax assets (liabilities)”.
F. Current income tax assets and liabilities are offset and the net amount reported in the
balance sheet when there is a legally enforceable right to offset the recognized amounts
and there is an intention to settle on a net basis or realize the asset and settle the liability
simultaneously. Deferred income tax assets and liabilities are offset on the balance sheet
when the entity has the legally enforceable right to offset current tax assets against
current tax liabilities and they are levied by the same taxation authority on either the
same entity or different entities that intend to settle on a net basis or realize the asset and
settle the liability simultaneously.
(24) Share capital
Net of incremental costs directly attributable to the issuance of new shares will be removed
from equity after related income tax expense is eliminated. Dividends on ordinary shares
are recognized in equity in the year in which they are approved by the shareholders. Cash
dividends are recorded as liabilities. They are not recognized and only disclosed as
subsequent event in the notes to the financial statements if the dividend declaration date is
later than the balance sheet date.
(25) Share-based payment
When the parent company reserves shares from cash capital increase for employee
preemption, fair value of the services received shall be measured at the fair value of equity
instruments granted at the grant date and recognized as employee benefit expense in
accordance with IFRS 2, ‘Share-based Payment’.
(26) Presentation of financial statements
In accordance with the “Regulations Governing the Preparation of Financial Reports by
Publicly Held Bills Finance Companies”, assets and liabilities in the accompanying
financial statements are not classified into current and non-current items.
(27) Operating segments
Operating segments are reported in a manner consistent with the internal reporting
provided to the chief operating decision-maker. The chief operating decision-maker is
responsible for allocating resources and assessing performance of the operating segments.

105
5. CRITICAL ACCOUNTING JUDGEMENTS, ESTIMATES AND KEY SOURCES OF
ASSUMPTION UNCERTAINTY
The preparation of these financial statements requires management to make critical judgements
in applying the Company’s accounting policies and make critical assumptions and estimates
concerning future events. Judgements and estimates are continually evaluated and adjusted
based on historical experience and other factors. The above information is addressed below:
(1)As the financial statements of the Company may be affected by the adoption of accounting
policy, accounting estimate and assumption, the Company’s management shall properly
exercise its professional judgement, estimates, and assumptions on the information of the
key risks that is obtained from other resources and could affect the carrying amounts of
financial assets and liabilities in the next fiscal year while adopting critical accounting
policies as stated in Note 4. Estimates and assumptions of the Company are the best
estimates made in compliance with IFRSs as endorsed by the FSC. Estimates and
assumptions are made based on past experience and other factors deemed relevant; however,
the actual results may differ from the estimates. The Company reviews the estimates and
assumptions on an ongoing basis and recognizes the adjustment of the estimates only in the
period which is affected by the adjustment. If the adjustment simultaneously affects both the
current and future periods, it should be recognized in both periods.
(2) The Company makes estimates and assumptions based on the expectation of future events
that are believed to be reasonable under the circumstances at the end of the reporting period.
The resulting accounting estimates might be different from the related actual results. The
estimates and assumptions that have a significant risk of causing a material adjustment to the
carrying amounts of assets and liabilities within the next financial year are addressed below:
Guarantee reserve assessment
The Company assesses the adequacy of guarantee reserve of financial guarantee contract at
the balance date. Unless otherwise provided by laws or regulations, when deciding whether
to set aside guarantee reserve, the Company shall primarily exercise its judgement on
whether the guarantee is likely to occur and cash inflow that may arise after the guaranty
obligation resulted. Evidences for making judgement include observable data indicating
adverse movement in payment status of the debtor or industry news relevant to arrears. The
Company periodically reviews assumptions of factors for judgement in order to reduce the
difference between estimated loss and actual loss.
6. DETAILS OF SIGNIFICANT ACCOUNTS
(1) Cash and cash equivalents
December 31, 2016 December 31, 2015
Checking deposits $ 205,250 $ 243,093
Demand deposits 129,050 65,573
Time deposits 11,391 11,990
Petty cash 700 700
Total $ 346,391 $ 321,356
A. For bank deposits due from related parties, please refer to Note 7.
B. Time deposits mature within three months. The CNY time deposit rate at December 31, 2016
and 2015 was 3.30% and 3.20%, respectively.

106
C. As of December 31, 2016 and 2015, demand deposits in USD amounted to US$428 thousand
and US$208 thousand, respectively, and the exchange rate of USD to NTD was 1 : 32.206 and
1 : 32.888 , respectively. (Exchange rates of USD to NTD shown below are all the same).
D. As of December 31, 2016 and 2015, CNY denominated demand deposits amounted to CNY$0
thousand and CNY$1 thousand, respectively; as of December 31, 2016 and 2015, CNY
denominated time deposits amounted to CNY$2,463 thousand and CNY $2,400 thousand,
respectively, and the exchange rate of CNY to NTD was 1:4.6253 and 1:4.9959, respectively.
(Exchange rates of CNY to NTD shown below are all the same).
(2) Financial assets at fair value through profit or loss
December 31, 2016 December 31, 2015
Financial assets held for trading
Commercial paper $ 96,861,866 $ 88,634,403
Fixed rate commercial paper purchased 15,941 45,070
Bankers’ acceptance 700,074 665,637
Negotiable certificates of time deposit 22,449,487 19,787,238
Convertible corporate bonds 339,222 368,177
Government bonds 248,076 -
Funds 3,222 -
Subtotal 120,617,888 109,500,525
Financial assets designated as at fair value
through profit or loss on initial recognition
Convertible corporate bond asset swaps 4,679,600 5,784,581
Subtotal 4,679,600 5,784,581
Total $ 125,297,488 $ 115,285,106
A. The Company recognized net gain of $557,569 thousand and $582,465 thousand on financial
assets held for trading for the years ended December 31, 2016 and 2015, respectively, and
recognized net (loss) gain of ($24,781) thousand and $24,406 thousand on financial assets
designated as at fair value through profit or loss on initial recognition for the years ended
December 31, 2016 and 2015, respectively.
B. As of December 31, 2016 and 2015, the transaction cost of bills with repurchase agreement of
above financial assets held for trading were $87,273,962 thousand and $85,868,075 thousand,
respectively.
C. As of December 31, 2016 and 2015, the above negotiable certificates of time deposits used for
bank overdraft collateral have maturities within one year. Please refer to Notes 7 and 8 for
details.

107
(3) Available-for-sale financial assets
December 31, 2016 December 31, 2015
Government bonds $ 61,809,630 $ 53,575,077
Foreign currency government bonds 328,950 163,348
Financial bonds 7,337,356 9,040,668
Foreign currency financial bonds 30,889,338 6,322,735
Corporate bonds 24,728,512 27,132,595
Foreign currency corporate bonds 6,352,820 3,074,591
Beneficiary or asset-backed securities 513,119 513,321
Stocks 894,809 992,445
Funds 12,652 1,445
Total $ 132,867,186 $ 100,816,225
A. As of December 31, 2016 and 2015, the transaction cost of bonds and beneficiary or
asset-backed securities with repurchase agreement of above available-for-sale bonds
were $121,081,530 thousand and $82,083,925 thousand, respectively.
B. The government bonds and corporate bonds were provided as collaterals for bank
overdrafts as of December 31, 2016 and 2015. Please refer to Notes 7 and 8 for details.
C. As of December 31, 2016 and 2015, in accordance with the relevant regulations, the
Company deposited refundable deposits in Central Bank or other institutions. Bonds
are collateralized as refundable deposits amounting to $835,273 thousand and $818,983
thousand, respectively.
D. As of December 31, 2016 and 2015, the fair values of government bonds denominated
in USD were US$10,214 thousand and US$4,967 thousand; respectively. As of
December 31, 2016 and 2015, the fair values of financial bonds denominated in USD
were US $959,118 thousand and US$192,251 thousand, respectively; as of December
31, 2016 and 2015, the fair values of corporate bonds denominated in USD were US
$197,256 thousand and US$93,487 thousand, respectively.
E. In consideration of increasing interest revenue, the Company holds two securitized SPT
beneficial securities, which were issued in 2011 and 2014 by the Land Bank of Taiwan
on behalf of Chailease Finance Co., Ltd.’s commission. The legal maturity dates of the
asset-backed security investments were November 24, 2018 and July 24, 2021,
respectively. However, investments are subject to an early termination according to the
underlying’s status of principal repayments.
As of December 31, 2016 and 2015, the maximum credit risk of the Company’s
investments in the above-mentioned structured entities was $513,119 thousand and
$513,321 thousand, respectively. In addition, for the years ended December 31, 2016
and 2015, interest revenue from investing in the structured entities was $9,276
thousand and $12,341 thousand, respectively.
(4) Bills and bonds under repurchase or resale agreements
December 31, 2016 December 31, 2015
Bills and bonds investment with resale
agreements $ - $ 1,000,000
Bills and bonds payable under repurchase
agreements $ 210,809,807 $ 173,109,248

108
A. As of December 31, 2016, there was no balance of bills and bonds investment with
resale agreements. As of December 31, 2015, the interest rate of bills and bonds
investment with resale agreements was 0.42%. The fair value of collaterals (bonds)
obtained by transaction amounted to $1,016,402 thousand.
B. As of December 31, 2016 and 2015, the interest rate of bills and bonds payable under
repurchase agreements in NTD were 0.18%~0.75% and 0.26%~0.60%, respectively.
C. As of December 31, 2016 and 2015, please refer to Note 7 for the balances of repo
trades with related parties.
D. As of December 31, 2016 and 2015, the interest rate of bills and bonds payable under
repurchase agreements in USD were 0.60%~2.00% and 0.55%~0.72%, and recognized
amount of USD denominated bills and bonds payable under repurchase agreements
were US$1,150,298 thousand and US$288,651 thousand, respectively.
(5) Receivables – net
December 31, 2016 December 31, 2015
Interest receivable $ 1,471,362 $ 1,176,077
Retractable rights of convertible bonds
receivables
30,225
-
Trade receivables on bond investment and
stocks
20,000
8,970
Other receivables – others 10,936 -
Subtotal 1,532,523 1,185,047
Less: Allowance for doubtful accounts ( 632) -
Receivables, net $ 1,531,891 $ 1,185,047
(6) Transfer of financial assets
Transferred financial assets that are not derecognized in their entirety
In the Company’s ordinary course of transactions, transferred financial assets that are not
derecognized in their entirety are financial instruments provided as liens for the
counterparty through repurchase agreements. Because such transactions reflect a liability
where the Company is obligated to repurchase transferred assets with a fixed price in the
future, for such transactions, the Company may not use, sell or pledge such transferred
financial assets within the effective period of the transactions; however, the Company still
bears the interest rate risk and credit risk, thus they are not derecognized in their entirety.
The following table analyzes information on financial assets not derecognized in their
entirety and their related liabilities:
December 31, 2016
Financial assets category
Carrying amount of
transferred
financial assets
Carrying amount
of related
financial liabilities
Financial assets at fair value
through profit or loss
Repurchase agreements $ 87,028,992 $ 87,032,995
Available-for-sale financial assets
Repurchase agreements $ 38,886,291 $ 36,187,999

109
December 31, 2015
Financial assets category
Carrying amount of
transferred
financial assets
Carrying amount
of related
financial liabilities
Financial assets at fair value
through profit or loss
Repurchase agreements $ 85,868,075 $ 85,885,350
Available-for-sale financial assets
Repurchase agreements $ 23,259,084 $ 22,948,981
(7) Offsetting financial assets and financial liabilities
When the Company has entered into an enforceable master netting arrangement with a
counterparty, and both parties elect to settle by the net amount, the settlement may be based
on the net amount after offsetting financial assets and financial liabilities. Related
information is listed as follows:
A. Financial assets
The balance as of December 31, 2016 and 2015 were both $0.
B. Financial liabilities
The balance as of December 31, 2016 and 2015 were both $0.
(8) Held-to-maturity financial assets
December 31, 2016 December 31, 2015
Corporate bonds $ 350,000 $ 600,000
Less: Accumulated impairment - -
Net $ 350,000 $ 600,000
(9) Other financial assets – net
December 31, 2016 December 31, 2015
Certificate of deposit pledged $ 400,000 $ 400,000
Financial assets carried at cost - net 344,300 344,300
Designated account for allowance to pay back
short-term bills 76,062 74,240
Net $ 820,362 $ 818,540
A. The above certificate of deposit pledged were provided as collaterals for bank
overdrafts as of December 31, 2016 and 2015. Please refer to Note 8 for details.

110
B. For above-mentioned financial assets carried at cost, as the variability in the range of
reasonable fair value estimate could vary significantly, and the probabilities of the
various estimates cannot be reasonably measured, the assets are measured at cost.
Relevant details are as follows:
December 31, 2016
Amount % of
Shareholding
Unlisted stock investments
Core Pacific City Co., Ltd. $ 600,000 3.130 Taiwan Asset Management Co., Ltd. 75,000 0.568 Taiwan Financial Asset Services Co., Ltd. 50,000 2.941 Taiwan Futures Exchange Co., Ltd. 10,250 0.512 Taiwan Depository & Clearing Co., Ltd. 6,850 0.628 Agora Garden Co., Ltd. 900 0.030
Subtotal 743,000
Less: Accumulated impairment ( 398,700)
Net $ 344,300
December 31, 2015
Amount % of
Shareholding
Unlisted stock investments
Core Pacific City Co., Ltd. $ 600,000 3.266 Taiwan Asset Management Co., Ltd. 75,000 0.568 Taiwan Financial Asset Services Co., Ltd. 50,000 2.941 Taiwan Futures Exchange Co., Ltd. 10,250 0.512 Taiwan Depository & Clearing Co., Ltd. 6,850 0.628 Agora Garden Co., Ltd. 900 0.030
Subtotal 743,000
Less: Accumulated impairment ( 398,700)
Net $ 344,300
As of December 31, 2016 and 2015, the Company had recognized impairment loss for
the above listed investees as follows:
December 31, 2016 December 31, 2015
Core Pacific City Co., Ltd. $ 397,800 $ 397,800
Agora Garden Co., Ltd. 900 900
$ 398,700 $ 398,700

111
(10) Property and equipment – net
Land Buildings
Machinery and
computer equipment
Miscellaneous
equipment
Equipment
prepayment Total
January 1, 2016
Cost $ 227,347 $ 166,118 $ 66,858 $ 56,067 $ 11,120 $ 527,510
Accumulated depreciation - ( 65,738 ) ( 42,414) ( 43,901) - ( 152,053)
Net Book Value 227,347 100,380 24,444 12,166 11,120 375,457
Additions-Cost - - 4,253 470 - 4,723
Transfer-Cost - - 11,120 - ( 11,120 ) -
Disposals-Cost - - ( 1,824) ( 115 ) - ( 1,939)
Disposals-Accumulated
depreciation - - 1,817 115 - 1,932
Depreciation - ( 2 ,721 ) ( 5,689) ( 1,586) - ( 9,996 )
December 31, 2016 $ 227,347 $ 97,659 $ 34,121 $ 11,050 $ - $ 370,177
December 31, 2016
Cost $ 227,347 $ 166,118 $ 80,407 $ 56,422 $ - $ 530,294
Accumulated depreciation - ( 68,459 ) ( 46,286) ( 45,372) - ( 160,117 )
Net Book Value $ 227,347 $ 97,659 $ 34,121 $ 11,050 $ - $ 370,177

112
Land Buildings
Machinery and
computer equipment
Miscellaneous
equipment
Equipment
prepayment Total
January 1, 2015
Cost $ 227,347 $ 166,118 $ 111,774 $ 58,174 $ 3,045 $ 566,458
Accumulated depreciation - ( 63,017 ) ( 85,311) ( 47,752) - ( 196,080)
Net Book Value 227,347 103,101 26,463 10,422 3,045 370,378
Additions-Cost - - 2,681 1,274 11,120 15,075
Transfer-Cost - - - 1,935 ( 3,045 ) ( 1,110)
Disposals-Cost - - ( 47,597) ( 5,316 ) - ( 52,913)
Disposals-Accumulated
depreciation - - 47,597 5,316 - 52,913
Depreciation - ( 2 ,721 ) ( 4,700) ( 1,465) - ( 8,886 )
December 31, 2015 $ 227,347 $ 100,380 $ 24,444 $ 12,166 $ 11,120 $ 375,457
December 31, 2015
Cost $ 227,347 $ 166,118 $ 66,858 $ 56,067 $ 11,120 $ 527,510
Accumulated depreciation - ( 65,738 ) ( 42,414) ( 43,901) - ( 152,053 )
Net Book Value $ 227,347 $ 100,380 $ 24,444 $ 12,166 $ 11,120 $ 375,457
All property and equipment were neither provided as collateral nor revalued.

113
(11) Investment property – net
Land Buildings Total
January 1, 2016
Cost $ 2,204,894 $ 511,868 $ 2,716,762
Accumulated
depreciation - ( 177,674 ) ( 177,674)
Net Book Value 2,204,894 334,194 2,539,088
Depreciation - ( 10,664 ) ( 10,664)
December 31, 2016 $ 2,204,894 $ 323,530 $ 2,528,424
December 31, 2016
Cost $ 2,204,894 $ 511,868 $ 2,716,762
Accumulated
depreciation - ( 188,338 ) ( 188,338)
Net Book Value $ 2,204,894 $ 323,530 $ 2,528,424
January 1, 2015
Cost $ 2,204,894 $ 511,868 $ 2,716,762
Accumulated
depreciation - ( 167,010 ) ( 167,010)
Net Book Value 2,204,894 344,858 2,549,752
Depreciation - ( 10,664 ) ( 10,664)
December 31, 2015 $ 2,204,894 $ 334,194 $ 2,539,088
December 31, 2015
Cost $ 2,204,894 $ 511,868 $ 2,716,762
Accumulated
depreciation - ( 177,674 ) ( 177,674)
Net Book Value $ 2,204,894 $ 334,194 $ 2,539,088
A. No investment property was provided as collateral.
B. Rental income from the lease of the investment property for the years ended December
31, 2016 and 2015 were $104,107 thousand and $110,656 thousand, respectively.
C. The fair value of the investment property held by the Company as at December 31, 2016
and 2015 were $3,801,532 thousand and $3,886,422 thousand, respectively, which were
revalued by independent valuers and based on the price with comprehensive reference
to comparison approach and direct capitalization under income approach. The
capitalization rate used in valuation was 2.03%~ 2.17%. The fair value of investment
property held by the Company is classified as Level 2.
(12) Other assets – net
December 31, 2016 December 31, 2015
Refundable deposits $ 10,970 $ 10,938
Guarantee deposits held for operation and funds
for security settlements 5,955 6,039
Other deferred assets 12,013 7,248
Others 5,930 24,000
Total $ 34,868 $ 48,225

114
(13) Interbank overdraft and call loans
December 31, 2016 Period Interest Rate (%)
Bank overdrafts $ 184,000 Nov.25.2016-Nov.25.2017(Note) 1.38
Call loans-NTD 14,500,000 Dec.16.2016-Jan.11.2017 0.45~0.57
Call loans-USD 1,030,592 Dec.23.2016-Jan.23.2017 1.60~1.70
Total $ 15,714,592
December 31, 2015 Period Interest Rate (%)
Bank overdrafts $ 129,000 Nov.27.2015-Nov.27.2016(Note) 1.755
Call loans-NTD 11,100,000 Dec.18.2015-Jan.15.2016 0.40~0.45
Call loans-USD 65,776 Dec.31.2015-Jan.4.2016 0.95
Total $ 11,294,776
Note: Represents contract period.
A. Please refer to Note 7 for details of bank overdrafts and call loans granted by the
related parties.
B. Please refer to Note 8 for details for collaterals provided for bank overdrafts and loans
as of December 31, 2016 and 2015.
C. As of December 31, 2016 and 2015, call loans in USD amounted to US$32,000
thousand and US$2,000 thousand, respectively.
(14) Financial liabilities at fair value through profit or loss
December 31, 2016 December 31, 2015
Fixed rate commercial paper purchased $ 20,048 $ -
Fixed rate commercial paper sold 2,495 6,149
Total $ 22,543 $ 6,149
The Company recognized net loss of $24,363 thousand and $8,837 thousand on financial
liabilities held for trading for the years ended December 31, 2016 and 2015, respectively.
(15) Payables
December 31, 2016 December 31, 2015
Bonus payable $ 196,476 $ 192,647
Payables of transactions under repurchase
agreements on maturity 110,710 42,724
Receipts under custody payable (Note) 110,498 110,456
Dividends and bonus payable 86,459 88,822
Interest payable 60,368 29,527
Others 38,297 39,866
Total $ 602,808 $ 504,042
Note: This represents withholding taxes on interest income from bills and bonds
pertaining to former purchasers.

115
(16) Provisions for liabilities
December 31, 2016 December 31, 2015
Reserve for guarantee liabilities $ 2,255,703 $ 2,324,003
Net defined benefit liability 472,402 433,417
Total $ 2,728,105 $ 2,757,420
Movements in allowance and reserves for accounts receivable, overdue loans and
guarantee liabilities are as follows:
Allowance for
accounts receivable
and overdue loans
Reserve for
guarantee liabilities Total
January 1, 2015 $ - $ 2,411,870 $ 2,411,870
Reversal - ( 64,115) ( 64,115)
Write-off ( 23,752) - ( 23,752)
Transfer 23,752 ( 23,752) -
December 31, 2015 $ - $ 2,324,003 $ 2,324,003
January 1, 2016 $ - $ 2,324,003 $ 2,324,003
Provision (Reversal) 635 ( 42,500) ( 41,865)
Write-off ( 25,803) - ( 25,803)
Transfer 25,800 ( 25,800) -
December 31, 2016 $ 632 $ 2,255,703 $ 2,256,335
(17) Pensions
A. (A)The Company and its domestic subsidiaries have a defined benefit pension plan in
accordance with the Labor Standards Law, covering all regular employees’ service
years prior to the enforcement of the Labor Pension Act on July 1, 2005 and service
years thereafter of employees who chose to continue to be subject to the pension
mechanism under the Law. In accordance with the plan, an amount equal to 8% of
the total monthly payroll was contributed by the Company to the retirement fund
deposited with Bank of Taiwan, the trustee, under the name of the independent
retirement fund committee. Benefits under this plan are calculated based on the
number of years of service, salaries, meal allowances, overtime wages and other
regular payments made in accordance with the Labor Standards Act. The maximum
number of basic points used for the purpose of benefit calculation is limited to 61
points for employees who worked before April 30, 2005 and limited to 45 points for
employees who worked after May 1, 2005.
(B) The amounts recognized in the balance sheet are determined as follows:
December 31, 2016 December 31, 2015
Present value of defined benefit
obligations $ 760,948 $ 720,004
Fair value of plan assets ( 288,546) ( 286,587)
Net defined benefit liability $ 472,402 $ 433,417

116
(C) Movements in net defined benefit liabilities are as follows:
Present value of
defined benefit
Obligation
Fair value of
plan assets
Net defined
benefit liability
Year ended December 31, 2016
Balance at January 1, $ 720,004 ($ 286,587) $ 433,417
Current service cost 23,095 - 23,095
Interest expense (income) 7,879 ( 3,164) 4,715
750,978 ( 289,751) 461,227
Remeasurements:
Return on plan assets
(excluding amounts included
in interest income or expense) - 1,123 1,123
Change in financial
assumptions 6,357 - 6,357
Experience adjustments 14,033 - 14,033
20,390 1,123 21,513
Pension fund contribution - ( 10,338) ( 10,338)
Paid pension ( 10,420) 10,420 -
Balance at December 31, $ 760,948 ($ 288,546) $ 472,402
Present value of
defined benefit
obligation
Fair value of
plan assets
Net defined
benefit liability
Year ended December 31, 2015
Balance at January 1, $ 645,916 ($ 277,330) $ 368,586
Current service cost 21,816 - 21,816
Interest expense (income) 10,919 ( 4,741) 6,178
678,651 ( 282,071) 396,580
Remeasurements:
Return on plan assets
(excluding amounts included
in interest income or expense) - ( 2,708) ( 2,708)
Change in financial
assumptions 41,315 - 41,315
Experience adjustments 8,038 - 8,038
49,353 ( 2,708) 46,645
Pension fund contribution - ( 9,808) ( 9,808)
Paid pension ( 8,000) 8,000 -
Balance at December 31, $ 720,004 ($ 286,587) $ 433,417
(D)The Bank of Taiwan was commissioned to manage the Fund of the Company’s and
domestic subsidiaries’ defined benefit pension plan in accordance with the Fund’s
annual investment and utilisation plan and the “Regulations for Revenues,
Expenditures, Safeguard and Utilisation of the Labor Retirement Fund” (Article 6:
The scope of utilisation for the Fund includes deposit in domestic or foreign
financial institutions, investment in domestic or foreign listed, over-the-counter, or
private placement equity securities, investment in domestic or foreign real estate
securitization products, etc.). With regard to the utilisation of the Fund, its
minimum earnings in the annual distributions on the final financial statements shall

117
be no less than the earnings attainable from the amounts accrued from two-year
time deposits with the interest rates offered by local banks. If the earnings is less
than aforementioned rates, government shall make payment for the deficit after
being authorized by the Regulator. The Company has no right to participate in
managing and operating that fund and hence the Company is unable to disclose the
classification of plan asset fair value in accordance with IAS 19 paragraph 142. The
composition of fair value of plan assets as of December 31, 2016 and 2015 is given
in the Annual Labor Retirement Fund Utilisation Report announced by the
government.
(E) The principal actuarial assumptions used were as follows:
For the years ended December 31,
2016 2015
Discount rate 1.20% 1.10%
Future salary increases 1.90% 1.70%
Assumptions regarding future mortality rate for 2016 and 2015 are set based on the
5th Chart of Life Span Estimate Used by the Taiwan Life Insurance Enterprises.
Because the main actuarial assumption changed, the present value of defined
benefit obligation is affected. The analysis was as follows:
Discount rate Future salary increases
Increase 0.25% Decrease 0.25% Increase 0.25% Decrease 0.25%
December 31,
2016
Effect on
present value of
defined benefit
obligation ($ 17,487) $ 18,123 $ 17,140 ($ 16,635)
(F) Expected contributions to the defined benefit pension plans of the Company for the
year ending December 31, 2016 amounts to $9,687.
B. Effective July 1, 2005, the Company has established a defined contribution pension plan
(the “New Plan”) under the Labor Pension Act (the “Act”), covering all regular
employees with R.O.C. nationality. Under the New Plan, the Company contributes
monthly an amount based on 6% of the employees’ monthly salaries and wages to the
employees’ individual pension accounts at the Bureau of Labor Insurance. The benefits
accrued are paid monthly or in lump sum upon termination of employment. The pension
costs under defined contribution pension plans of the Company for the years ended
December 31, 2016 and 2015 were $4,388 thousand and $4,311 thousand, respectively.
(18) Capital stock
As of December 31, 2016 and 2015, the Company’s paid-in capital was both $13,114,411
thousand, consisting of 1,311,441 thousand shares with a par value of $10 dollars per
share.
(19) Capital surplus
A.As required by Company Law, capital reserve of additional paid-in capital and income
from donation after offsetting accumulated deficit, the legal reserve may be used
exclusively to increase capital by issuing new shares or distribute cash dividends
according to original shareholders in proportion to the number of shares being held by
each of them given there is no accumulated deficit in a company. In addition,
according to Securities and Exchange Act, the capital reserve used for capital increase

118
shall not exceed 10% of total paid-in capital. Unless the earnings reserve is insufficient
to offset the capital deficit, the capital reserve shall not be used.
B.As of December 31, 2016 and 2015, the details of the Company's capital surplus is as
follows:
December 31, 2016 December 31, 2015
Share premium $ 312,823 $ 312,823
Share-based payment transactions(Note) 8,106 8,106
$ 320,929 $ 320,929
Note: the above-mentioned share-based payments are payments by the parent company,
Mega Financial Holding Co., Ltd., conducted in accordance with Article 267
Paragraph 1 of the Company Act, where upon issuing new shares for a capital
increase, 10% was reserved for subscription by employees of the group.
(20) Retained earnings
For the years ended December 31,
2016 2015
January 1 $ 19,490,920 $ 18,592,588
Profit for the period 2,980,126 3,010,436
Appropriation of earnings ( 2,077,323) ( 2,073,388)
Remeasurement on post employment benefit
obligations, net of tax ( 17,856) ( 38,716)
December 31 $ 20,375,867 $ 19,490,920
A. According to the Company’s Articles of Incorporation, the current year’s earnings, if
any, shall first be used to pay all taxes and offset prior year’s operating loss, and the
remaining amount should then be set aside as legal reserve and special reserve in
accordance with provisions under the applicable laws and regulations. The remaining
earnings plus prior year’s accumulated unappropriated earnings are subject to the Board
of Directors’ decision to propose a distribution plan and to be submitted to the Ordinary
Stockholders’ Meeting for approval.
B. Stock dividends are distributed by cash; however, the cash distribution ratio is adjusted
based on the business development, plan on capital and other relevant factors.
C. Except for covering accumulated deficit or issuing new stocks or cash to shareholders in
proportion to their share ownership, the legal reserve shall not be used for any other
purpose. The use of legal reserve for the issuance of stocks or cash to shareholders in
proportion to their share ownership is permitted, provided that the balance of the reserve
exceeds 25% of the Company’s paid-in capital.
D. In accordance with the regulations, the Company shall set aside special reserve from the
debit balance on other equity items at the balance sheet date before distributing earnings.
When debit balance on other equity items is reversed subsequently, the reversed amount
could be included in the distributable earnings.
E. Beginning from the year 1998, under the Income Tax Act, if there is any surplus
earnings of the then current year not distributed by the Company, an additional
profit-seeking income tax shall be levied at the rate of 10% on such undistributed
surplus earnings.
F. (A) Appropriation of 2015 and 2014 earnings as resolved by the Board of Directors on
behalf of the stockholders on April 26, 2016 and April 24, 2015, respectively, were
as follows:

119
2015 2014
Amount
Dividends
per share
(in dollars) Amount
Dividends
per share
(in dollars)
Legal reserve $ 890,601 $ 889,238
Cash dividends of
stockholders 2,077,323 $ 1.584 2,073,388 $ 1.581
(B) The appropriation of 2016 earnings resolved by the Board of Directors on March 21,
2017 is set forth follows:
2016
Amount
Dividends per
share (in dollars)
Legal reserve $ 888,905
Special surplus reserve 32,149
Cash dividends of stockholders 2,032,734 $ 1.550
G. For information relating to employees’ remuneration, please refer to Note 6(26).
(21) Interest income, net
For the years ended December 31,
2016 2015
Interest income
Interest income from bills $ 1,063,852 $ 1,133,231
Interest income from bonds (Note) 2,252,638 1,662,626
Others 6,398 135,108
Subtotal 3,322,888 2,930,965
Interest expense
Interest expense of bills payable under
repurchase agreements 292,522 413,679
Interest expense of bonds payable under
repurchase agreements 510,888 386,721
Interest expense of overdraft and call loans 95,624 100,762
Others 246 294
Subtotal 899,280 901,456
Net $ 2,423,608 $ 2,029,509
Note: Including interest income of $106,853 thousand and $90,642 thousand from
convertible bond asset swap recognized for the years ended December 31, 2016 and 2015,
respectively.
(22) Service fee and commission income, net
For the years ended December 31,
2016 2015
Service fee income from guarantee service $ 638,802 $ 584,929
Service fee income from certification service 61,513 58,501
Service fee income from underwriting service 295,253 293,462
Others 37,403 41,290
Subtotal 1,032,971 978,182
Service fee expense ( 11,133) ( 10,805)
Net $ 1,021,838 $ 967,377

120
(23) Gain or loss from financial assets and liabilities at fair value through profit or loss
For the years ended December 31,
2016 2015
Realized (Loss) Gain
Bills $ 567,121 $ 526,500
Bonds 9,812 21,685
Derivatives ( 7,968) ( 2,833)
Others - 1,797
Subtotal 568,965 547,149
Valuation (Loss) Gain
Bills ( 39,170) 36,384
Bonds(Note) ( 21,206) 16,356
Derivatives - 145
Others ( 164) ( 2,000)
Subtotal ( 60,540) 50,885
Total $ 508,425 $ 598,034
Note: Including (loss) gain of ($24,781) thousand and $24,406 thousand on convertible
bond asset swap recognized for the years ended December 31, 2016 and 2015,
respectively.
(24) Realized gain or loss on available-for-sale financial assets
For the years ended December 31,
2016 2015
Dividends income $ 36,509 $ 63,851
Stocks 73,738 318,357
Bonds 115,022 50,007
Total $ 225,269 $ 432,215
(25) Provisions (Reversal)
For the years ended December 31,
2016 2015
Bad debt recovery ($ 4,031) ($ 70,393)
Reversal provision for guarantee reserve ( 41,865) ( 64,115)
Total ($ 45,896) ($ 134,508)
(26) Employee benefit
For the years ended December 31,
2016 2015
Wages and salaries $ 486,362 $ 478,351
Labor and health insurance fees 23,235 23,638
Pension costs 32,198 32,305
Other employee benefits 23,577 27,735
Total $ 565,372 $ 562,029
A.In accordance with the Company’s Articles of Incorporation, if there are earnings for the
fiscal year, 1.75%~3% shall be appropriated as employees’ compensation. However,
when there are accumulated deficits, earnings to cover the deficit shall first be retained.

121
B.For the years ended December 31, 2016 and 2015, employees’ compensation was
accrued at $86,459 and $88,822, respectively. The aforementioned amounts were
recognized in salary expenses. The employees’ compensation was estimated and accrued
based on 2.375% and 2.5% of distributable profit of current year for the year ended
December 31, 2016 and 2015. The employees’ compensation resolved by the Board of
Directors in 2017 was $63,707 of 2016 and the employees’ compensation will be
distributed in the form of cash.
C.The Company distributed employees’ cash compensation and recognized in employees’
compensation expense on financial statements were $62,175 and $88,822 for the year
ended December 31, 2015, respectively. Because the ratio of employee’s compensation
changed, the difference, $26,647, had been adjusted the income for the year ended
December 31, 2016.
D.Information about employees’ compensation and directors’ and supervisors’
remuneration of the Company as resolved by the Board of Directors and the
stockholders at the stockholders’ meeting will be posted in the “Market Observation Post
System” at the website of the Taiwan Stock Exchange.
(27) Depreciation and amortization
For the years ended December 31,
2016 2015
Depreciation $ 20,660 $ 19,550
Amortization 4,000 4,042
Total $ 24,660 $ 23,592
(28) Other business and administrative expenses
For the years ended December 31,
2016 2015
Tax and official fee $ 73,019 $ 74,378
Rental expense 45,038 45,565
Professional expense 7,706 7,112
Repairs and maintenance 5,479 4,387
Others 75,286 75,549
Total $ 206,528 $ 206,991
(29) Income taxes
A. Components of income tax expense:
(A)Components of income tax expense:
For the years ended December 31,
2016 2015
Current tax:
Current tax on profits for the period $ 582,312 $ 485,083
Tax on undistributed surplus earnings 74 -
Prior year income tax underestimation 40,673 738
Total current tax 623,059 485,821
Deferred tax:
Origination and reversal of temporary
differences ( 32,140) 9,553
Total deferred tax ( 32,140) 9,553
Income tax expense $ 590,919 $ 495,374

122
(B) The income tax relating to components of other comprehensive income is as
follows:
For the years ended December 31,
2016 2015
Remeasurement of defined benefit
obligations $ 3,657 $ 7,929
B. Reconciliation between income tax expense and accounting profit
For the years ended December 31,
2016 2015
Tax calculated based on profit before tax
and statutory tax rate $ 607,077 $ 595,988
Effects from items disallowed by tax
regulation ( 32,541) ( 27,786)
Effects from tax exempt income ( 24,290) ( 73,566)
Prior year income tax underestimation 40,673 738
Income tax expense $ 590,919 $ 495,374
C. Temporary differences resulting in deferred income tax assets or liabilities as of
December 31, 2016 and 2015:
For the year ended December 31, 2016
January 1
Recognized in
profit or loss
Recognized in other
comprehensive income December 31
Temporary differences:
- Deferred tax assets:
Pension unfunded $ 103,340 $ 2,967 $ 3,657 $ 109,964
Others 2,914 39,226 - 42,140
Subtotal 106,254 42,193 3,657 152,104
- Deferred tax liabilities:
Others ( 12,647) ( 10,053) - ( 22,700)
Total $ 93,607 $ 32,140 $ 3,657 $ 129,404
For the year ended December 31, 2015
January 1
Recognized in
profit or loss
Recognized in other
comprehensive income December 31
Temporary differences:
- Deferred tax assets:
Pension unfunded $ 92,316 $ 3,095 $ 7,929 $ 103,340
Others 3,705 ( 791) - 2,914
Subtotal 96,021 2,304 7,929 106,254
- Deferred tax liabilities:
Others ( 790) ( 11,857) - ( 12,647)
Total $ 95,231 ($ 9,553) $ 7,929 $ 93,607
D. As of December 31, 2016, the Company’s income tax returns through 2010 had been
assessed by the Tax Authorities. The Company disagreed with the assessment for 2009
and 2010, and has filed for a reassessment. In addition, the assessment for the 2011 tax
returns was received on February 18, 2017. The Company disagrees with the
assessment and has in accordance with regulations filed for a reassessment.
E. The Company’s income tax returns are filed jointly with Mega Holding, the Company’s

123
parent company, and its other subsidiaries starting 2003. As of December 31, 2016 and
2015, current income tax liabilities on the joint filing of income tax returns amounted
to $191,490 thousand and $131,256 thousand, respectively.
F. Unappropriated retained earnings
As of December 31, 2016 and 2015, unappropriated retained earnings were both
originated after 1998.
G. As of December 31, 2016 and 2015, the balance of the imputation tax credit account
was $8,965 thousand and $12,622 thousand, respectively. The creditable tax rate was
0.43% for 2015 and is estimated to be 0.30% for 2016.
(30) Earnings per share
2016
Amount after tax
Weighted-average
number of shares
outstanding
(share in thousands)
Basic and diluted earnings
per share
(In dollars)
Net income $ 2,980,126 1,311,441 $ 2.27
2015
Amount after tax
Weighted-average
number of shares
outstanding
(share in thousands)
Basic and diluted earnings
per share
(In dollars)
Net income $ 3,010,436 1,311,441 $ 2.30
7. RELATED PARTY TRANSACTIONS
(1) Names of the related parties and their relationship with the Company
Names of related parties Relationship with the Company
Mega Financial Holding Co., Ltd. (Mega Holding) The Company’s parent company
Chunghwa Post Co., Ltd. (Chunghwa Post) The director of the Company’s parent company
Bank of Taiwan (BOT) The director of the Company’s parent company
Mega International Commercial Bank Co., Ltd
(MICB)
Subsidiary of Mega Holding
Mega Securities Co., Ltd. (MS) Subsidiary of Mega Holding
Mega International Investment Trust Co., Ltd
(MIIT)
Subsidiary of Mega Holding
Chung Kuo Insurance Co., Ltd. (CKI) Subsidiary of Mega Holding
Mega Asset Management Co., Ltd. (MAM) Subsidiary of Mega Holding
Mega Diamond Money Market Fund Fund issued by subsidiaries of Mega Holding
Mega Prosperity Private Placement Fund Fund issued by subsidiaries of Mega Holding
Mega USD Money Market Fund Fund issued by subsidiaries of Mega Holding
Others The Company’s directors, supervisors, general
managers, vice general managers, assistant
managers, managers, and close relatives of the
Company’s directors, supervisors, general
managers, and vice general managers.
(2) Significant transactions and balances with related parties

124
A. Bank deposits
December 31, 2016
Demand deposits Checking deposits Time deposits Total
Management of
the parent
BOT $ 21,346 $ 47,687 $ - $ 69,033
Fellow subsidiary
MICB 105,347 66,907 11,391 183,645
Total $ 126,693 $ 114,594 $ 11,391 $ 252,678
December 31, 2015
Demand deposits Checking deposits Time deposits Total
Management of
the parent
BOT $ 21,928 $ 41,928 $ - $ 63,856
Fellow subsidiary
MICB 41,736 75,790 11,990 129,516
Total $ 63,664 $ 117,718 $ 11,990 $ 193,372
B. Other financial assets
December 31, 2016 December 31, 2015
Management of
the parent
BOT $ 8,549 $ 4,353
Fellow subsidiary
MICB 56,864 58,013
Total $ 65,413 $ 62,366
The above-mentioned other financial assets include the designated accounts for
allowance to pay back short-term bills.
C. Interbank overdraft and call loans
For the year ended December 31, 2016
Highest
Balance
Ending
Balance Interest Rate(%)
Interest
Expense
Bank overdrafts
Management of the
parent
BOT $ 1,130,000 $ 184,000 1.38~1.755 $ 8,424
Call loans
Management of the
parent
BOT 12,600,000 7,000,000 0.20~0.57 18,704
Chunghwa Post 11,500,000 - 0.30~0.46 4,601
Fellow subsidiary
MICB 6,392,650 - 0.28~1.40(Note1) 14,914
Total
$ 7,184,000
$ 46,643
(Note 1)Interest rates for call loans denominated in NTD and foreign currency were
0.28%~0.50% and 0.70%~1.40%, respectively. For the year ended December 31, 2015
Highest
Balance
Ending
Balance Interest Rate(%)
Interest
Expense

125
Bank overdrafts
Management of the
parent
BOT $ 866,000 $ 129,000 1.755~1.88 $ 10,486
Call loans
Management of the
parent
Chunghwa Post 11,300,000 - 0.365~0.46 3,827
BOT 10,400,000 - 0.30~0.61 20,790
Fellow subsidiary
MICB 3,000,000 2,765,776 0.45~5.35(Note2) 1,905
Total
$ 2,894,776
$ 37,008
(Note 2)Interest rates for call loans denominated in NTD and foreign currency were
0.45%~0.66% and 0.70%~5.35%, respectively.
Interest rates for call loans applied to the related parties are the same as those offered to
other financial institutions.
D. Purchase of bills and bonds
For the years ended December 31,
2016 2015
Ultimate parent
Mega Holding $ 20,191,016 $ 26,487,445
Management of the parent
Chunghwa Post - 50,586
Fellow subsidiary
MAM 23,610,718 6,097,241
MS 759,002 3,267,912
Total $ 44,560,736 $ 35,903,184
The terms of the above transactions are the same as those with non-related parties.
E. Sale of bills and bonds
For the year ended December 31, 2016
Amount
Gain from financial
assets and
liabilities at fair value
through profit or loss
Realized gain on
available-for-sale
financial assets
Management of the parent
Chunghwa Post $ 181,181,742 $ 58,269 $ 51,427
BOT 21,955,636 1,204 -
Fellow subsidiary
MICB 163,364,928 53,232 -
Other related parties
Mega Diamond Money
Market Fund 27,793,486 9,616 -
Total $ 394,295,792 $ 122,321 $ 51,427
For the year ended December 31, 2015
Amount
Gain from financial
assets and
liabilities at fair value
through profit or loss

126
Management of the parent
Chunghwa Post $ 63,926,278 $ 19,795
BOT 23,736,387 5,065
Fellow subsidiary
MICB 323,756,768 116,403
Other related parties
Mega Diamond Money Market Fund 19,365,304 8,322
Total $ 430,784,737 $ 149,585
The terms of the above transactions are the same as those with non-related parties.
F. Financial assets at fair value through profit or loss
The Company's short-term bills issued by related parties are as follows:
December 31, 2016: None.
December 31, 2015
Type of
instrument Issuance date Maturity date
Interest
rate (%)
Face value Cost
Fellow
subsidiary
MAM Commercial
papers
2015.12.23 2016.01.22 0.64 $1,100,000 $1,099,421
G. Bills and bonds under repurchase agreements
For the year ended December 31, 2016
Amount Ending balance Interest expense
Ultimate parent
Chunghwa Post $ 4,860,253 $ - $ 808
Fellow subsidiary
MICB 141,010,835 - 9,860
MS 2,550,762 - 71
CKI 1,147,443 333,569 236
Other related parties
Mega Diamond Money
Market Fund 669,664 - 9
Mega Prosperity Private
Placement Fund 34,093,990 1,201,219 15,538
Mega USD Money
Market Fund 1,479,491 66,022 748
Total $ 185,812,438 $ 1,600,810 $ 27,270

127
For the year ended December 31, 2015
Amount Ending balance Interest expense
Ultimate parent
Mega Holding $ 7,880,508 $ - $ 2,837
Fellow subsidiary
MICB 80,179,796 - 1,556
CKI 4,027,481 49,902 1,101
MS 3,695,208 149,881 787
MIIT 166,159 - 81
Other related parties
Mega Diamond Money
Market Fund 799,226 - 105
Others 100,000 - 14
Total $ 96,848,378 $ 199,783 $ 6,481
The terms of the above transactions are the same as those with non-related parties.
H. Financial derivative transactions
As of December 31, 2016 and 2015, the realized loss of financial derivative
transactions were $7,003 thousand and $1,287 thousand, respectively.
I. Guarantees provided to related parties
December 31, 2016: None.
For the year ended December 31, 2015
Highest
Balance
Ending
Balance
Allowance for doubtful
accounts and reserves
for guarantee liabilities
Rates
(%)
Pledged
Asset
Fees
income
Fellow
subsidiary
MAM $ 420,000 $ - $ - 0.63 Real estate $ 45
The terms of the above commercial paper issuance guarantees are the same as those
with non-related parties.
J. The issuance of non-guaranteed commercial papers from consigned related parties
For the year ended December 31, 2016
Highest Balance Ending Balance Rates (%) Fees income
Ultimate
parent
Mega
Holding
$ 4,000,000 $ 2,100,000 0.40~0.80 $ 232
Fellow
subsidiary
MAM 2,650,000 - 0.42~0.75 278
MS 210,000 - 0.42~0.57 10
$ 2,100,000 $ 520

128
For the year ended December 31, 2015
Highest Balance Ending Balance Rates (%) Fees income
Ultimate
parent
Mega
Holding
$ 4,000,000 $ 3,000,000 0.63~0.91 $ 964
Fellow
subsidiary
MAM 2,650,000 2,650,000 0.63~0.93 307
MS 810,000 210,000 0.65~0.98 177
$ 5,860,000 $ 1,448
The terms of the above non-guaranteed commercial papers are the same as those with
non-related parties.
K. Collaterals provided to related parties for bank overdrafts
December 31, Pledged Asset 2016 2015
Management of
the parent
BOT Financial assets at fair value through profit or
loss - negotiable certificates of time deposit $ 700,802
$ 700,971
Available-for-sale financial assets -
government bonds 304,092
378,756
Available-for-sale financial assets –
corporate bonds 1,707,660
1,623,094
Fellow
subsidiary
MICB Financial assets at fair value through profit or
loss - negotiable certificates of time deposit 3,000,852
2,700,409
Available-for-sale financial assets -
government bonds 2,250,067
2,243,934
$ 7,963,473 $ 7,647,164
L. Assets provided as operating deposits for securities firm:
December 31, Pledged Asset 2016 2015
Management of
the parent
BOT Available-for-sale financial assets -
government bonds $ 50,049
$ 50,758
M. Service fee expenses
The Company underwrote the short-term securities guaranteed by the Mega Financial
Holdings’ subsidiary, MICB, and the service fee expenses are as follows:
For the years ended December 31,
2016 2015
Fellow subsidiary
MICB $ - $ 114

129
N. Leasehold income
Leased For the years ended December 31,
Lessee Property Period 2016 2015
Fellow
subsidiary
MICB Office and
parking
lots
Jan. 1, 2016-
Dec. 31, 2018
$ 79,779 $ 84,246
CKI Office Dec. 1, 2016-
Nov. 30, 2021
1,054 1,037
$ 80,833 $ 85,283
(A) The Company rented office space in Mega Financial Holding’s building in Taipei
City to MICB for office use. The lease agreement was signed with the $14,041
thousand deposit already received.
(B) The Company’s Sanchong branch rented the storage house to CKI for office use.
The lease agreement was signed with the $170 thousand dollar deposit already
received.
(C) The rent is determined based on the comparable rental expense in the surrounding
area.
O. Rental expenses
Rental For the years ended December 31,
Lessor Property Period 2016 2015
Fellow
subsidiary
MICB Office Jan. 1, 2016-Dec. 31, 2018 $ 34,183 $ 35,121
MICB Office Jan. 1, 2014-Feb. 28, 2015 - 126
MICB Office - 25 20
CKI Warehouse Dec. 1, 2016-Nov. 30, 2021 331 316
$ 34,539 $ 35,583
(A) The Company rented partial office space located at HengYang Rd., Taipei City
from MICB. The lease agreement was signed with the $5,853 thousand deposit
already paid.
(B) The Company leased the office on Hengyang Rd., Taipei City from MICB based on
a daily rent for education and training venues.
(C) The Company rented Keelung lodge from CKI for file storage. The lease agreement
was signed with the $52 thousand deposit already paid.
(D) The rent is determined based on the comparable rental expense in the surrounding
area.
P. Insurance expenses
For the years ended December 31,
2016 2015
Fellow subsidiary
CKI $ 3,352 $ 3,403

130
(3) Information on remunerations to the Company’s directors, supervisors, general managers
and assistant general manager:
For the years ended December 31,
2016 2015
Salaries and other short-term employee
benefits
$ 30,580 $ 30,220
Post-employment benefits 700 700
$ 31,280 $ 30,920
8. PLEDGED ASSETS
The Company has pledged the following assets as collaterals for bank overdrafts, call loans
and refundable deposit.
December 31,
2016 2015 Secured for
Financial asset at fair value
through profit or loss -
negotiable certificates of time
deposit $ 10,503,132 $ 10,405,233
Collateral for Central bank
and other banks’ overdraft
Available-for-sale financial assets
- government bonds
6,595,349
6,635,254
Operating bond for bills and
securities firms, and reserve
for GTSM Electronic Bond
Trading System (EBTS)
and bank overdraft and call
loan collateral
Available-for-sale financial assets
- corporate bonds 1,707,660 1,623,094
Bank overdraft
Other financial assets-
certificate of deposit pledged 400,000 400,000
Bank overdraft
Total $ 19,206,141 $ 19,063,581
9. SIGNIFICANT CONTINGENT LIABILITIES AND UNRECOGNIZED CONTRACT
COMMITMENTS
As of December 31, 2016 and 2015, the commitments and contingencies arising from the
Company’s normal course of business were as follows:
December 31,
2016 2015
Securities bills and bonds investment with resale
agreements $ - $ 1,000,000
Securities bills and bonds payable under repurchase
agreements 210,809,807 173,109,248
Guarantees on commercial papers 147,973,500 150,968,600
Fixed rate commercial paper purchased 14,170,000 8,870,000
Fixed rate commercial paper sold 500,000 500,000
Index rate commercial paper purchased 29,310,000 29,710,000
Index rate commercial paper sold 4,000,000 5,500,000
10. SIGNIFICANT DISASTER LOSS
None.

131
11. SIGNIFICANT SUBSEQUENT EVENTS AFTER THE BALANCE SHEET DATE
None.
12. FINANCIAL INSTRUMENTS AFTER THE BALANCE SHEET DATE
(1) Fair value and level information of financial instruments
A. Fair value information of financial instruments
(a) Except for those listed in the table below, the carrying amounts of the Company’s
financial instruments not measured at fair value (including cash and cash
equivalents, bills and bonds investment with resale agreements, accounts receivable,
certificate of deposit pledged, designated account for allowance to pay back
short-term bills, guarantee deposits held for operation and funds for security
settlements, refundable deposits, interbank overdraft and call loans, bills and bonds
payable under repurchase agreements, payables, and other liabilities) are
approximate to their fair values. The fair value information of financial instruments
measured at fair value is provided in Note 12(1)B. In addition, information on the
counterparty’s and Company’s credit risk is also considered and assessed
throughout the valuation process.
December 31, 2016 December 31, 2015
Carrying
Value
Fair
Value
Carrying
Value
Fair
Value
Held-to-maturity financial assets $ 350,000 $ 354,948 $ 600,000 $ 606,715
The fair values of the above-mentioned held-to-maturity financial assets are all classified as
Level 2.
(b) The Company’s methods and assumptions used in measuring fair value is as
follows:
Held-to-maturity financial assets: if there are public quotes in active markets, then the market
price is the fair value; when there are no available market prices for reference, then estimates
from valuation methods.
B. Level information of financial instruments at fair value and Fair value estimation
(A) Three definitions of the Company’s financial instruments at fair value
a. Level 1
Quoted prices (unadjusted) in active markets for identical assets or liabilities
that the entity can access at the measurement date. A market is regarded as
active where a market in which transactions for the asset or liability take place
with sufficient frequency and volume to provide pricing information on an
ongoing basis.
b. Level 2
Inputs other than quoted prices included within Level 1 that are observable for
the asset or liability, either directly or indirectly.
c. Level 3

132
Unobservable inputs for the asset or liability. There are no financial
instruments measured at fair value held by the Company which are classified as
Level 3.
(B) Information of fair value hierarchy of financial instruments
Unit: In thousand of New Taiwan dollars December 31, 2015
Recurring fair value measurement Total Level 1 Level 2 Level 3
Non-derivative Financial
Instruments
Assets
Financial assets at fair value
through profit or loss
Financial assets held for
trading
Investment in bills $ 120,027,368 $ - $ 120,027,368 $ -
Investment in bonds 587,298 - 587,298 -
Other 3,222 3,222 - -
Financial assets designated as
at fair value through profit or
loss on initial recognition 4,679,600 - 4,679,600 -
Available-for-sale financial
assets
Investment in stock 894,809 894,809 - -
Investment in bonds 131,446,606 284,212 131,162,394 -
Beneficiary or asset-backed
securities 513,119 - 513,119 -
Other 12,652 12,652 - -
Liabilities -
Financial liabilities at fair value
through profit or loss 22,543 - 22,543 -
December 31, 2015
Recurring fair value measurement Total Level 1 Level 2 Level 3
Non-derivative Financial
Instruments
Assets
Financial assets at fair value
through profit or loss
Financial assets held for
trading
Investment in bills $ 109,132,348 $ - $ 109,132,348 $ -
Investment in bonds 368,177 - 368,177 -
Financial assets designated as
at fair value through profit or
loss on initial recognition 5,784,581 - 5,784,581 -
Available-for-sale financial
assets
Investment in stock 992,445 992,445 - -
Investment in bonds 99,309,014 514,975 98,794,039 -
Beneficiary or asset-backed
securities 513,321 - 513,321 -
Other 1,445 1,445 - -
Liabilities
Financial liabilities at fair value 6,149 - 6,149 -

133
through profit or loss
(C) The fair value of financial instruments traded in active markets is based on quoted
market prices at the balance sheet date. A market is regarded as active if quoted
prices are readily and regularly available from an exchange, dealer, broker,
industry group, pricing service, or regulatory agency, and those prices represent
actual and regularly occurring market transactions on an arm’s length basis.
The Company’s stocks, funds, benchmark bonds with transaction price, and the
derivatives with a quoted price in an active market, are all included in level 1.
Fair values of stocks (excluding emerging stocks) listed on the Taiwan Stock
Exchange or Over-The-Counter (hereinafter OTC) are determined by the closing
price at the balance sheet date. Fair values of open-ended funds are determined by
the net asset value at the balance sheet date. Fair value of benchmark bond is
determined by the transaction price at the balance sheet date for fair value of
bonds of different maturities bulletined by OTC. Fair values of derivatives traded
on the Taiwan Futures Exchange are determined by the closing prices at the
balance sheet date.
(D) If all significant inputs required to fair value an instrument are observable, the
instrument is included in level 2. If non-derivatives held by the Company have no
active market, a valuation technique or quoted price offered by the counterparties
will be adopted to measure their fair values. The fair value obtained through the
valuation technique may take reference to the current fair value of other financial
instruments with similar characteristics and actual terms, discounted cash flow
method, or other valuation techniques, including the available market information
obtained through the exercise of model calculations at the balance sheet date.
When assessing non-standardized financial instruments with lower complexity,
such as interest rate swaps, currency swaps and options, the Company adopts the
valuation technique generally accepted by market users. The inputs used in the
valuation models for these kinds of financial instruments are generally observable
information in the market.
Bills and bonds (except for benchmark bonds with transaction price), fixed
income securities, and derivatives (except for those traded in Taiwan Futures
Exchange) are all included in level 2.
Fair values of short-term bills are determined by the secondary trading’s offered
rate index indicated by quotation’s interest rate index. Government bonds are
valued by the fair values of government bonds fair value offered by OTC or
Bloomberg L.P at the balance sheet date; bank debentures, corporate bonds,
foreign currency bonds and marketable securities of fixed income are valued by
the corporate bonds reference rates or the volume-weighted average yield/price
offered by OTC or the information of average prices of foreign currency bonds
and marketable securities offered by Bloomberg L.P. The Company used the
evaluation system for interest rate swaps, currency swaps, convertible corporate
bond asset swaps and fixed rate commercial papers. Fair values are determined by
individual contracts. The yield curve used in calculating fair values of instruments
with maturity within one year is based on the offered rate by the Reuters; those
with maturity above one year is based on the average price of the Reuters. The
exchange rate adopted is the spot average rate of the Megabank and the Bank of
Taiwan.

134
(E) There was no significant transfer between level 1 and level 2 for the years ended
December 31, 2016 and 2015.
(F) If one or more of the significant inputs is not based on observable market data, the
instrument is included in level 3. No financial instrument measured at fair value is
included in level 3.
13. THE MANAGEMENT OBJECTIVES AND POLICIES OF FINANCIAL RISKS
(1) Overview
Except for complying with the laws and regulations, the Company’s risk management
aims to confine various operating risks to the tolerable scopes, maintain sound capital
adequacy ratio, and pursue sustainable development. In order to maintain asset security
and financial quality, risk management system was established for all employees to
follow and work accordingly. With respect to various businesses, the Company
established risk management mechanism for identification, measurement, supervision,
and reporting purpose and set up relevant control methods such as specific risk
management objectives, warning, and stop-loss limit.
The Company’s activities expose it to a variety of financial risks: credit risk, market risk
liquidity risk and operating risk. Market risk including interest rate risk, price risk and
foreign exchange risk.
(2) The organization framework of risk management
The Company’s Board of Directors has the ultimate approval right in risk management.
Major management risk items that include the Company-wide risk management policy,
risk tolerance limit, and authority must be approved by the Board of Directors. Risk
management committee established under the jurisdiction of general manager is
responsible for examination of business risks such as credit risk, market risk, and
operational risk and supervision of enforcement of risk management objectives. Credit
management company and stock investment company were also set up under the
jurisdiction of general manager to respectively examine and manage risks relevant to
credit and investment transactions. Department of risk management is responsible for
supervision of overall risk positions and concentration, assessment of capital adequacy,
and submitting reports concerning enforcement of various risk management objectives to
the Board of Directors. Additionally, relevant risk management affairs are planned,
supervised, or implemented in accordance with regulations by regulatory authorities and
Mega Financial Holding Co., Ltd.
The Company also set up an audit department responsible for audit and assessment of
internal control system to ensure sustained and effective implementation.
(3) Credit risk
A. The source and definition of credit risk
Credit risk refers to the risk of financial loss to the Company arising from default by
the clients or counterparties of financial instruments on the contract obligations. Credit
risk faced by the Company may arise from accounts in and off the balance sheet. For
accounts balance sheet, credit risk mainly arises from debt instruments investment and
derivatives. Off balance sheet accounts mainly comprise financial guarantees.

135
Above-mentioned financial guarantees refer to guarantees for underwriting of
commercial papers issued. Such guarantees agreement normally comes with a 1 year
expiration period. The range of contract period for commercial papers is normally
from 10 days to 180 days and the expiration dates are not concentrated on the same
day.
B. Credit risk management policies
(A) Policy and procedure
The Company’s credit risk management aims to control risk of loss from borrower
or counterparty default because their financial status worsened or for other reasons
and fails to fulfill the contract obligations. The Company established credit risk
management standard and mechanism to ensure the credit risk is controlled within
the tolerable scope. In avoidance of high risk concentration, the Company
established summary of regulations governing credit risk concentration to define
concentration limits by client (including the same person, the same company),
location and country risk and set up early-warning indicator and monitoring
mechanism.
a. Credit extensions
(a)The Company set up regulations governing credit risk to define ratio of
credit ceiling by industry, ratio of credit ceiling on specific security
requirements, and administration of limit on credit risk acceptance.
(b)The Company set up “Regulations Governing the Procedures for Bills
Finance Companies to Evaluate Assets, Set Aside Loss Reserves, and
Handle Non-Performing Credit, Non-Accrual Loans, and Bad Debt” and
evaluation method of asset quality and classification with regular review to
check up on provision of allowance for losses.
b. Investments in financial instruments
Financial instruments held by the Company are mainly classified by credit
ratings of counterparties. The Company regularly reviews, checks, and
evaluates changes in the credit ratings to enhance control over credit risk taken
by the Company. The Company also established rules governing control over
credit risk on non-government bonds purchased to define administration of
setting limits under credit ratings of bond debtor (issuer or guarantor) or
specific debt.
(B) Measurement method
The Company’s credit risk measurement system and statement comprises
summary of total exposure to credit risk and management reports of ratio of
overdue credits, credit ceiling by industry, underwriting limits for guarantee,
credit ceiling for a single entity, the same associates, and the same related parties.
C. Policies of hedging and mitigation of credit risk
(A) Collaterals

136
The Company’s credit extension cases are processed following the procedure of
credit extension and checking. According to the client’s financial position and
credit status, the Company may consider obtaining collaterals and guarantors and
setting of notices for handling of credit review to enhance management upon
credit extension.
(B) Master netting arrangements
The Company’s transactions predominantly settle at gross amount. A portion of
transactions have entered into net master netting arrangements with counterparties
or upon the event of a default may cease all transactions with the counterparties
and settle by net amount in order to further reduce credit risk.
(C) Other credit enhancements
A portion of the Company’s held financial instruments have obtained guarantees
from financial institutions in order to reduce credit risk.
(D) Credit risk limit and credit risk concentration control
The Board of Directors assesses the annual risk management objectives
concerning credit extension business, including ratio of overdue credits, coverage
ratio of overdue credits, limit control over industry credit, specific security
requirements, and the same entity or company’s investments. Risk control
department analyzes details of credit asset quality and credit risk concentration
and reports to the general manager on a monthly basis. Risk control department
also reports exposure to credit extension business, credit risk concentration, and
enforcement of risk management objectives to the risk management committee
and the Board of Director on a quarterly basis.
D. Maximum credit risk exposure
(A) The maximum exposure to credit risk of assets in the balance sheet, without
consideration of the collateral or other credit enhancements, is equivalent to the
carrying amount. The maximum exposure amount related to off-balance-sheet
items is as follows:
Off-balance-sheet items Carrying amount
Maximum credit
risk exposure amount December 31,2016 Off-balance-sheet guarantees $ - $ 147,973,500 December 31,2015 Off-balance-sheet guarantees - 150,968,600
(B) As of December 31, 2016 and 2015, the off-balance sheet contract amount for the
guarantees of commercial papers subject to potential credit risks is NT$300,440
million and NT$292,445 million, respectively (The contract amount which has
been drawn upon amounted to NT$147,974 million and NT$150,969 million,
respectively).
(C) Since the Company is only subject to payments in the event of default on the
issuer of commercial papers in such guarantee contracts, the contract amount for
such financial instruments does not represent the expected future cash outflow. In
fact, the demand for future cash flow is less than the contract amount. When the

137
guaranteed amount had been drawn upon and the underlying collateral or other
collaterals has completely lost its values, the amount of credit risk exposure will
equal to the contract amount which is the maximum potential loss.
(D) In granting guarantees for the issuance of commercial papers, the Company
undertakes strict credit assessment and also demands appropriate collaterals from
the customers as necessary. As of December 31, 2016 and 2015, the percentage of
guarantees with collaterals is 72.60% and 68.49%, respectively. Collaterals
provided normally include real estate properties, circulating securities or other
properties, etc. In the event of customer defaults, the Company assumes rights on
such collaterals.
(E) Information on the financial impact of collateral, master netting arrangements and
other credit enhancements of the Company’s assets subject to credit exposure is as
follow:
December 31, 2016 Collateral Other credit
enhancements Total Financial assets measured at fair value
through profit or loss-debt instruments $ - $ 7,175,148 $ 7,175,148 Available-for-sale financial assets-debt
instruments - 5,719,977 5,719,977
Off-balance-sheet guarantees 107,422,666 - 107,422,666
December 31, 2015 Collateral Other credit
enhancements Total Financial assets measured at fair value
through profit or loss-debt instruments $ - $ 4,352,415 $ 4,352,415 Available-for-sale financial assets-debt
instruments - 3,075,000 3,075,000 Investments in bills and bonds with resale
agreements 1,000,000 - 1,000,000
Off-balance-sheet guarantees 103,394,900 - 103,394,900
Note 1: Collaterals include property, movable property, securities and certificates
of deposits.
(1)Value of collaterals pledged for assets that arise from lending is the
lower of collateral value/ market value and maximum exposure amount.
If the collateral value cannot be obtained, value of collaterals must be
assessed.
(2)Value of collaterals pledged for assets that do not arise from lending is
the lower of market value and maximum exposure amount.
Note 2: For explanations on master netting arrangements and other credit
enhancements, please refer to Note 13(3)C(B) and (C).
E. Credit risk concentration
There will be a significant concentration of credit risk when the counterparty of the
financial instruments is highly concentrated in a single customer or a company of
counterparties who engage mostly in similar business activities with similar economic
nature, and such business activities make their abilities to fulfill the contractual
obligations influenced similarly by the economic affairs or other situations. The
Company does not engage in transactions that are concentrated significantly in a single
customer or counterparty. However, significant credit risk concentrations for provision
of guarantees for commercial papers are as follows:
(A) Industry (guarantee service)

138
December 31, 2016 December 31, 2015
Amount Ratio(%) Amount Ratio(%)
Real estate $ 43,451,100 29.36 $ 38,380,700 25.42
Financial & insurance 39,665,700 26.81 46,194,200 30.60
Manufacturing 32,604,000 22.03 34,344,900 22.75
Wholesale & retail 9,255,600 6.26 9,301,200 6.16
Accommodation and
Food 8,302,900 5.61 - - Others – less than 5% of balance of guarantees at period end 14,694,200 9.93 22,747,600 15.07
Total $ 147,973,500 100.00 $ 150,968,600 100.00
(B) Collateral (guarantee service)
December 31, 2016 December 31, 2015
Amount Ratio(%) Amount Ratio(%)
Unsecured $ 40,550,834 27.40 $ 47,573,700 31.51
Secured
Secured by stocks 25,880,261 17.49 28,689,887 19.00
Secured by bonds 5,674,315 3.84 5,433,555 3.60
Secured by real estate 72,822,154 49.21 65,398,229 43.32
Others 3,045,936 2.06 3,873,229 2.57
Total $ 147,973,500 100.00 $ 150,968,600 100.00
F. Financial assets credit quality and analysis of past due and impairment
Financial assets held by the Company mainly comprise financial assets at fair value
through profit or loss, investments in bills and bonds with resale agreements,
available-for-sale financial assets, held-to-maturity financial assets, and financial
assets measured at cost. Most of these assets have sound and satisfactory asset quality.
For the Company’s classification of asset quality, credit asset quality is based on the
Company’s internal credit rating (categorized into thirteen levels). Other financial
asset quality is based on the external credit rating of counterparty, which is categorized
into four levels: sound, satisfactory, fair, and weak.
Each of these four levels has internal and external credit rating equivalents in the
following table:
Equivalent
default rate
Internal
credit rating
Corresponding
to S&P
Corresponding to
Taiwan Ratings
(long-term)
Sound Below 0.4%
(included) 1~5 AAA~BBB- twAAA ~ twA
Satisfactory 0.4% above
~1.68%(included) 6~8 BB+~ BB- twA- ~ twBBB-
Fair 1.68% above
~4.3%(included) 9~10 B+ twBB+
Weak 4.3% above 11~13 B and below twBB and below
(Blank Below)

139
(A) Credit quality analysis on securities investment
December 31, 2016 Neither past due nor impaired
Past due but not impaired Impaired Total
Reserve for losses Net amount Financial assets Excellent Satisfactory Fair Weaker
No rating(note)
Financial assets at fair value through profit or loss
Investment in bills $ 49,826,633 $ 42,373,653 $ 21,997,895 $ 5,499,237 $ 329,950 $ - $ - $ 120,027,368 $ - $ 120,027,368 Investment in bonds 1,341,593 107,592 - - 3,817,713 - - 5,266,898 - 5,266,898
Available-for-sale financial assets Investment in bonds 124,898,319 2,925,479 - - 3,622,808 - - 131,446,606 - 131,446,606 Beneficiary or
asset-backed securities 513,119 - - - - - - 513,119 - 513,119 Held-to-maturity financial
assets 250,000 100,000 - - - - - 350,000 - 350,000 Financial assets carried at
cost - - - - - - 600,900 600,900 398,700 202,200
December 31, 2015 Neither past due nor impaired
Past due but not impaired Impaired Total
Reserve for losses Net amount Financial assets Excellent Satisfactory Fair Weaker
No rating(note)
Financial assets at fair value through profit or loss
Investment in bills $ 49,196,831 $ 38,961,487 $ 17,128,378 $ 3,650,986 $ 194,666 $ - $ - $ 109,132,348 $ - $ 109,132,348 Investment in bonds 1,406,676 540,104 - - 4,205,978 - - 6,152,758 - 6,152,758
Bills and bonds investment with resale agreements - 1,000,000 - - - - - 1,000,000 - 1,000,000
Available-for-sale financial assets Investment in bonds 94,487,075 4,560,225 - - 261,714 - - 99,309,014 - 99,309,014 Beneficiary or
asset-backed securities 513,321 - - - - - - 513,321 - 513,321 Held-to-maturity financial
assets 250,000 350,000 - - - - - 600,000 - 600,000 Financial assets carried at
cost - - - - - - 600,900 600,900 398,700 202,200
Note: Bills without ratings are mainly guaranteed bills, which do not have credit ratings as they are newly formed businesses and no
complete annual financial reports are available. Bonds without ratings are mainly convertible corporate bonds listed and traded
through the open market.

140
(B) Credit quality analysis on credit business
There were no accounts receivable as of December 31, 2016 and 2015.
G. Analysis of impaired financial assets of the Company
Financial assets
Carrying amount prior
to recognition of
impairment loss
Amount of the
impairment loss
Carrying amount after
recognition of
impairment loss
Available collateral and
other credit strengthening
collateral
December 31, 2016
On-balance sheet accounts
Financial assets carried at cost $ 600,900 $ 398,700 $ 202,200 None
Other receivables 632 632 - None
December 31, 2015
On-balance sheet accounts
Financial assets carried at cost 600,900 398,700 202,200 None
(Blank Below)

141
H. The following information is disclosed in accordance with “Regulations Governing the
Preparation of Financial Reports by Publicly Held Bills Finance Companies”.
(A) Asset quality
Items December 31, 2016 December 31, 2015
Guarantees in arrear and guaranteed
credits overdue for no longer
than three months $ - $ -
Overdue credits (including overdue
receivables) - -
Loans under surveillance - -
Overdue receivables - -
Ratio of overdue credits (%) - -
Ratio of overdue credits plus ratio
of loans under surveillance (%) - -
Provision for bad debts and
guarantees as required by
regulation 2,130,454 2,292,234
Provision for bad debts and
guarantees actually reserved 2,255,703 2,324,003
Note: Items follow ”Regulations Governing the Procedures for Bills Finance
Companies to Evaluate Assets, Set Aside Loss Reserves, and Handle
Non-Performing Credit, Non-Accrual Loans, and Bad Debt”.
(B) Primary business activities
Items December 31, 2016 December 31, 2015
Total guarantees and endorsement
for short-term bills $ 147,973,500 $ 150,968,600
Guarantees and endorsement for
short-term bills / Net amount
(after deducting final accounts
allotment) 4.68 4.98
Total bills and bonds payable under
repurchase agreements 210,809,807 173,109,248
Bills and bonds payable under
repurchase agreements / Net
amount (after deducting final
accounts allotment) 6.66 5.71

142
(C) Concentration of credit risk
Items December 31, 2016 December 31, 2015
Credits extended to related
parties $ 97,000 $ 97,000
Percentage of credits
extended to related parties
(%) (Note 1) 0.07 0.06
Percentage of credits
extended secured by equity
(%) (Note 2) 17.49 19.00
Industry concentration (Top
3 industries with maximum
industry credit ratio)
Industry Ratio(%) Industry Ratio(%)
Real estate 29.36
Financial and
insurance 30.60
Financial and
insurance 26.81 Real estate 25.42
Manufacturing 22.03 Manufacturing 22.75
Note 1: The ratio of credit extensions to related parties = the amount of credit
extensions to related parties / the total amount of all credit extensions.
Note 2: The ratio of credit extensions secured by stocks = the amount of credit
extensions secured by stocks / the total amounts of all credit extensions.
Note 3: Total amount of credit extensions include loans, bills discounted,
acceptances receivable, guarantees receivable, and advance accounts for
factoring receivable.
(D) Policy of reserve for losses and movements of allowance for credit losses:
The Company has evaluated the allowance and reserves for bills receivable,
accounts receivable, overdue loans, and the ending balance guaranteed by
commercial papers by considering unrecoverable risks and analyzed the
possibility of loss based on “Regulations Governing the Procedures for Bills
Finance Companies to Evaluate Assets, Set Aside Loss Reserves, and Handle
Non-Performing Credit, Non-Accrual Loans, and Bad Debt”. For details of
changes in allowance for doubtful accounts, please refer to Note 6(16).
(4) Liquidity risk
A. Definition and sources of liquidity risk
Liquidity risk is defined as possible losses to the Company when the Company is
unable to realize the assets or obtain funds to meet the obligations soon to be matured.
It can also be defined as risk of impact on the Company’s financial position due to
adverse changes in interest rates. Gap in liquidity risk position refers to differences
between assets with liquidity risk and liabilities with liquidity risk classified by
maturity structure.
B. Procedures for management of liquidity risk

143
Liquidity risk management of the Company mainly refers to control over the limit
management made to gaps in liquidity risk position across different periods that have
been through business operation.
(A) Policies and procedures
Policies and procedures were created to establish rules governing liquidity risk
management, effectively measure liquidity risk position, and maintain appropriate
liquidity with ability to pay assured. Relevant control measures comprise:
a. Establishing limit on gap of each time period and supervising the Company’s
cash flow gap of each time period on a daily basis to appropriately hedge fund
liquidity risk.
b. Establishing emergency response management mechanism for funding, which
can start immediately to call on risk management committee for deliberation of
emergency measures when prolonged capital austerity, prolonged increase in
interest rates or unexpected financial events result in liquidity risk with
significant impact.
c. With respect to the Company’s control over liquidity risk, bill segment is
responsible for daily operation and control over fund liquidity gap; and finance
segment is responsible for reporting liquidity risk monitored.
(B) Risk measurement methods
Risk measurement methods are applied to set limit on cash flow gap of each time
period based on the ability to allocate and transfer capital. Measurement system
and statistics comprise: control over total major liabilities and limit control over
funding gap of each time period.
C. Maturity date analysis for financial assets and liabilities held
(A) Most of financial instruments held by the Company have an open market. These
financial instruments are expected to be sold easily and immediately at a price
approximate to the fair value and they are sufficient to fulfill the payment
obligation and potential emergent fund demand in the market.
(B) The Company’s fundamental management policy is to match the maturity date and
interest rate on assets and liabilities and control cap arising from any mismatch.
Due to uncertainty of terms and variety of types, maturity date and interest rate on
assets and liabilities usually cannot fully match up, such mismatch may result to
either potential gain or loss. As of December 31, 2016 and 2015, the carrying
amounts of financial assets and financial liabilities are classified according to their
time-to-maturity as follows:

144
December 31, 2016
1 to 30 days 31 to 90 days 91 to 180 days 181 days to 1 year 1 to 5 years Over 5 years Total
Assets
Cash and cash equivalents $ 335,000 $ 11,485 $ - $ - $ - $ - $ 346,485
Financial assets at fair value
through profit or loss
Non-derivative financial
instruments 67,509,372 48,513,849 4,680,467 1,702,537 3,074,901 101,125 125,582,251
Available-for-sale financial assets 908,041 2,779,226 4,603,797 10,180,693 80,468,372 54,193,677 153,133,806
Receivables 60,529 - - - - - 60,529
Held-to-maturity financial assets 1,100 - - 256,100 104,400 - 361,600
Other financial assets 76,203 281 200,295 200,464 - - 477,243
Total assets $ 68,890,245 $ 51,304,841 $ 9,484,559 $ 12,339,794 $ 83,647,673 $ 54,294,802 $ 279,961,914
Liabilities
Interbank overdraft and call loans ( 15,718,356) - - - - - ( 15,718,356)
Financial liabilities at fair value
through profit or loss
Non-derivative financial
instruments - - - ( 746) ( 21,797) - ( 22,543 )
Bills and bonds payable under
repurchase agreements ( 175,059,205) ( 33,416,803 ) ( 2,375,081 ) ( 72,677) - - ( 210,923,766 )
Payables ( 257,996 ) ( 4,411) ( 148,182 ) ( 131,851) - - ( 542,440)
Other funds outflow upon maturity ( 252,923 ) ( 112,224) - - ( 19,596 ) - ( 384,743)
Total liabilities ( 191,288,480 ) ( 33,533,438) ( 2,523,263) ( 205,274) ( 41,393) - ( 227,591,848)
Net liquidity gap ( $ 122,398,235 ) $ 17,771,403 $ 6,961,296 $ 12,134,520 $ 83,606,280 $ 54,294,802 $ 52,370,066
(Blank Below)

145
December 31, 2015
1 to 30 days 31 to 90 days 91 to 180 days 181 days to 1 year 1 to 5 years Over 5 years Total
Assets
Cash and cash equivalents $ 309,366 $ 12,086 $ - $ - $ - $ - $ 321,452
Financial assets at fair value
through profit or loss
Non-derivative financial
instruments 64,173,126 36,647,709 9,259,664 1,422,334 4,090,627 - 115,593,460
Available-for-sale financial assets 103,058 2,826,983 2,324,574 7,021,777 60,549,932 37,943,731 110,770,055
Bills and bonds investment with
resale agreements 1,000,207 - - - - - 1,000,207
Receivables 8,970 - - - - - 8,970
Held-to-maturity financial assets 1,100 252,600 - 6,100 361,600 - 621,400
Other financial assets 74,470 460 200,451 200,661 - - 476,042
Total assets $ 65,670,297 $ 39,739,838 $ 11,784,689 $ 8,650,872 $ 65,002,159 $ 37,943,731 $ 228,791,586
Liabilities
Interbank overdraft and call loans ( 11,296,566) - - - - - ( 11,296,566 )
Financial liabilities at fair value
through profit or loss
Non-derivative financial
instruments - - - - ( 6,149) - ( 6,149 )
Bills and bonds payable under
repurchase agreements ( 153,558,797 ) ( 17,025,646 ) ( 2,589,078 ) ( 645) - - ( 173,174,166 )
Payables ( 123,073 ) ( 123,902) ( 163,800 ) ( 63,740) - - ( 474,515)
Other funds outflow upon maturity ( 770,771 ) ( 8,700) - ( 421 ) ( 4,596 ) - ( 784,488 )
Total liabilities ( 165,749,207 ) ( 17,158,248 ) ( 2,752,878 ) ( 64,806 ) ( 10,745) - ( 185,735,884)
Net liquidity gap ( $ 100,078,910 ) $ 22,581,590 $ 9,031,811 $ 8,586,066 $ 64,991,414 $ 37,943,731 $ 43,055,702
(C) Structure analysis for maturity of derivative financial assets and liabilities - gross basis
There were no derivatives that were settled on a gross basis as at December 31, 2016 and 2015.
(D) Structure analysis for maturity of derivative financial assets and liabilities-net basis

146
There were no derivatives that were settled on a net basis as at December 31, 2016 and 2015.
D. Analysis on maturity value of off balance sheet accounts
The following table illustrates the maturity analysis for off balance sheet accounts of the Company by the remaining maturity from the balance sheet
date to the contract expiration date. In terms of the Company’s commercial paper business, the maximum amount of the guarantee is allocated to the
earliest period in which the guarantee could be called.
1 to 30 days 31 to 90 days 91 to 180 days 181 days to 1 year 1 to 5 years Total
December 31, 2016
Off-balance sheet items
Guarantees for
commercial papers $ 99,230,200 $ 45,750,300 $ 2,993,000 $ - $ - $ 147,973,500
December 31, 2015
Off-balance sheet items
Guarantees for
commercial papers $ 115,559,100 $ 33,607,800 $ 1,801,700 $ - $ - $ 150,968,600
E. Maturity analysis for lease contract and capital expense commitment
Operating lease commitment is the total minimum lease payments that the Company should make as a lessee or lessor under an operating lease term
which is not cancelable. The Company has no capital expenditure commitment.
December 31, 2016 Below 1 year 1 to 5 years Over 5 years Total
Lease commitment
Operating lease expense (lessee) ( $ 39,047) ( $ 41,162) $ - ( $ 80,209)
Operating income (lessor) 102,038 121,552 - 223,590
Total $ 62,991 $ 80,390 $ - $ 143,381
December 31, 2015
Lease commitment
Operating lease expense (lessee) ( $ 38,778) ( $ 70,435) $ - ( $ 109,213)
Operating income (lessor) 104,958 221,726 - 326,684
Total $ 66,180 $ 151,291 $ - $ 217,471

147
Additional information disclosed in accordance to the “Regulations Governing the
Preparation of Financial Reports by Publicly Held Bills Finance Companies”
Sources and Utilization of Capital
as of December 31, 2016
(Expressed in Millions of NT Dollars)
1 to 30 days 31 to 90 days 91 to 180 days
181 days to
1 year Over 1 year
Utilization of capital
Bills 67,358 48,241 4,412 - -
Bonds 821 1,571 4,062 10,814 120,309
Bank deposit 334 12 200 200 -
Loans extended - - - - -
Bills and bonds
investment with resale
agreements - - - - -
Total 68,513 49,824 8,674 11,014 120,309
Sources of capital
Loans borrowed 15,715 - - - -
Bills and bonds payable
under repurchase
agreements 174,983 33,383 2,371 73 -
Own capital - - - - 33,779
Total 190,698 33,383 2,371 73 33,779
Net capital ( 122,185) 16,441 6,303 10,941 86,530
Accumulated net capital ( 122,185) ( 105,744) ( 99,441) ( 88,500) ( 1,970)
Sources and Utilization of Capital
as of December 31, 2015
(Expressed in Millions of NT Dollars)
1 to 30 days 31 to 90 days 91 to 180 days
181 days to
1 year Over 1 year
Utilization of capital
Bills 63,838 36,411 8,838 - -
Bonds 251 1,442 1,923 7,567 95,392
Bank deposit 309 12 200 200 -
Loans extended - - - - -
Bills and bonds
investment with resale
agreements 1,000 - - - -
Total 65,398 37,865 10,961 7,767 95,392
Sources of capital
Loans borrowed 11,295 - - - -
Bills and bonds payable
under repurchase
agreements 153,516 17,008 2,584 1 -
Own capital - - - - 34,453
Total 164,811 17,008 2,584 1 34,453
Net capital ( 99,413) 20,857 8,377 7,766 60,939
Accumulated net capital ( 99,413) ( 78,556) ( 70,179) ( 62,413) ( 1,474)

148
(5) Market risk
A. Definition and sources of market risk
Market risk refers to the risk of fluctuation in the fair value or future cash flows of
financial instruments held by the Company as a result of the change in market price.
The so-called market price include interest rate, exchange rate, and price of equity
securities. The market risk faced by the Company mainly arises from the fluctuations
in interest rates. Fluctuations in interest rates will result in change in fair value of bills
and bonds investment held by the Company.
B. Procedures for management of market risk
The Company’s market risk management aims to control the probable losses arising
from on and off-balance sheet positions as a result of adverse change in market price.
The Company established not only market risk management standard to control market
risk assumed for holding financial instrument position but also sales management rules
such as standard governing authorization of bill trading, standard governing operations
and authorization of bond trading, standard governing brokerage and proprietary
trading business and authorization of fixed income securities, procedures for engaging
in derivatives transactions, and procedures for engaging in equity investments to
define control measures for relevant businesses, which include:
(A) Monitoring relevant risk management objectives such as position limits, loss
limits, and sensitivity limits on bills, bonds, stocks, derivatives, and various
businesses on a daily basis.
(B) Performing interest rate sensitivity analysis on positions of bills and bonds on a
daily basis.
(C) Performing valuation and verification on derivatives on a monthly basis.
C. Methods used in market risk measurement
Methods used in market risk measurement primarily aims to set limits based on risk
characteristics of risk positions arising from bills, bonds, stocks, and derivatives,
perform valuation and control loss limits according to operations of positions and
hedge strategy, and set adverse scenarios for assessment of significant loss the
Company may assume. Measurement system and statistics include: details of gains
and losses, risk life, sensitivity analysis, and stress testing on positions of various bills,
bonds, stocks, and derivatives.
D. Policies of hedging and mitigation of market risk
The Company’s hedge strategy for financial assets aims to use hedging instruments
individually or collectively to manage risk of change in fair value and achieve risk
management objectives. The hedge strategy also aims to periodically review and
revise various transaction risk limits based on change in economic and financial
situation and adjustment of business strategy to ensure relevant risk measures and
procedures conform to established policies, internal control, and operational
procedures.

149
E. Interest rate risk management
(A) Interest rate risk mainly arises from bond positions of interest rate instruments,
which are primarily held for earning spread between short-term and long-term
interest rates because bonds are primarily recognized in available-for-sale
financial assets. Interest rate risk management aims to assess bearable extent of
interest rate risk assumed by comparing weighted yields on bond position held
with interest rate level of bonds under repurchase agreements.
(B) The Company’s interest rate risk management mainly refers to the business plan
and objectives of budget surplus to set position limits, loss limits, and sensitivity
limits on bond business as annual risk management objectives. The interest rate
risk management is also applied to evaluate the economic situation, predict future
path of interest rates, and draft operation strategy according to domestic and
foreign economic data.
(C) Relevant control measures include: daily supervision on risk management
objectives relevant to various bond businesses; daily price assessment and
sensitivity analysis on bill and bond positions; monthly stress testing with an
assumption of 100 bp increase in interest rates; and reporting to the Risk
Management Committee quarterly.
F. Foreign exchange risk
(A) Foreign exchange risk faced by the Company refers to movement in fair values of
foreign currency denominated assets less foreign currency denominated liability,
and plus derivative position as a result of exchange rate fluctuations may result in
losses to the Company.
(B) In terms of foreign exchange risk management, the Company mainly supervises
position limits and loss limits on relevant businesses. Related control measures
include daily supervision on exposure position, price assessment, and control over
loss limits, daily calculation of currency position and analysis on foreign
exchange sensitivity, monthly stress testing on the currency position held with an
assumption of ±3% exchange rate fluctuations; and reporting to the Risk
Management Committee quarterly.
(C) Company’s foreign exchange risk exposure
(Expressed in Thousands of NT Dollars)
December 31, 2016
USD RMB
Cash and cash equivalents $ 13,791 $ 11,392
Available-for-sale financial assets 37,571,108 -
Receivables - net 437,702 31
Total assets 38,022,601 11,423
Interbank overdraft and call loans 1,030,592 -
Bills and bonds sold under repurchased
agreements
37,046,495
-
Payables 24,313 -
Total liabilities 38,101,400 -
On-balance sheet foreign exchange gap ( $ 78,799 ) $ 11,423

150
Off-balance sheet currency swaps $ - $ -
Exchange rate to NTD 32.2060 4.6253
Foreign exchange gain (loss) $ 3,450 ( $ 906 )
(Expressed in Thousands of NT Dollars)
December 31, 2015
USD RMB
Cash and cash equivalents $ 6,840 $ 11,994
Available-for-sale financial assets 9,560,675 -
Receivables - net 117,482 34
Total assets 9,684,997 12,028
Interbank overdraft and call loans 65,776 -
Bills and bonds sold under repurchased
agreements
9,493,161
-
Payables 1,346 -
Total liabilities 9,560,283 -
On-balance sheet foreign exchange gap $ 124,714 $ 12,028
Off-balance sheet currency swaps $ - $ -
Exchange rate to NTD 32.8880 4.9959
Foreign exchange gain (loss) $ 3,457 ( $ 254 )
G. Equity securities risk management
(A) The Company’s equity securities market risk comprises the risk of individual
equity security coming from the security’s market price changes and the general
market risk coming from overall equity securities market price changes.
(B) For equity securities risk management, the Company has set trading strategies for
three categories of positions: (a) positions held for selling and earning capital gain
in short-term; (b) positions held for earning dividends; and (c) positions held for
earning capital gains reflecting stock price for good prospect industry or long-term
good profitability, and set annual loss limits to the tolerable scopes.
(C) Related control measures include: daily market price valuation to control loss
limits, monthly stress-testing calculating probable amount of loss on investment
portfolio held by the Company on the assumption that overall market price
decrease by 15%, and reporting to the Risk Management Committee quarterly.

151
H. Sensitivity Analysis
December 31, 2016
Risks Extent of Variation
Effect on
Profit or Loss
Effect on
Other
Comprehensive
Income
Foreign
exchange risk
Exchange rate of NTD to USD, to JPY, to
EUR and to each of other currencies
appreciated by 1%. $ 674 $ -
Foreign
exchange risk
Exchange rate of NTD to USD, to JPY, to
EUR and to each of other currencies
depreciated by 1% ( 674) -
Interest rate risk Major increases in interest rates 1bp ( 1,985) ( 64,276 )
Interest rate risk Major decline in interest rates 1bp 1,996 64,370
Equity securities
risk
TAIEX declined by 1%.
33 ( 6,128 )
Equity securities
risk
TAIEX increased by 1%
( 33) 6,128
December 31, 2015
Risks Extent of Variation
Effect on
Profit or Loss
Effect on
Other
Comprehensive
Income
Foreign
exchange risk
Exchange rate of NTD to USD, to JPY, to
EUR and to each of other currencies
appreciated by 1%. ($ 1,368) $ -
Foreign
exchange risk
Exchange rate of NTD to USD, to JPY, to
EUR and to each of other currencies
depreciated by 1% 1,368 -
Interest rate risk Major increases in interest rates 1bp ( 1,770) ( 42,564)
Interest rate risk Major decline in interest rates 1bp 1,771 42,600
Equity securities
risk
TAIEX declined by 1%.
- ( 7,179)
Equity securities
risk
TAIEX increased by 1%
- 7,179

152
Additional information disclosed in accordance to the “Regulations Governing the Preparation of Financial Reports by Publicly Held Bills Finance
Companies”
(A) The information of interest rate sensitivity
Interest rate sensitivity analysis on assets and liabilities
December 31, 2016
Unit: In thousands of NT Dollars, %
Items 1 to 90 days 91 to 180 days 181 days to 1 year Over 1 year Total
Interest rate sensitive assets 118,335,955 8,674,652 11,013,602 120,309,532 258,333,741
Interest rate sensitive liabilities 224,080,796 2,371,087 72,516 - 226,524,399
Interest rate sensitive gap ( 105,744,841) 6,303,565 10,941,086 120,309,532 31,809,342
Net worth 33,779,058
Ratio of interest rate sensitive assets to interest rate sensitive liabilities (%) 114.04
Ratio of interest rate sensitivity gap to net worth (%) 94.17
December 31, 2015
Unit: In thousands of NT Dollars, %
Items 1 to 90 days 91 to 180 days 181 days to 1 year Over 1 year Total
Interest rate sensitive assets 103,263,453 10,960,681 7,766,461 95,392,432 217,383,027
Interest rate sensitive liabilities 181,819,763 2,583,619 642 - 184,404,024
Interest rate sensitive gap ( 78,556,310) 8,377,062 7,765,819 95,392,432 32,979,003
Net worth 34,453,252
Ratio of interest rate sensitive assets to interest rate sensitive liabilities (%) 117.88
Ratio of interest rate sensitivity gap to net worth (%) 95.72
Note 1: Interest rate sensitive assets and liabilities refer to the interest-earning assets and interest-bearing liabilities of which the income or
costs are affected by the fluctuations in interest rates.
Note 2: Ratio of interest rate sensitive assets to interest rate sensitive liabilities = Interest rate sensitive assets ÷ Interest rate sensitive
liabilities.
Note 3: Interest rate sensitivity gap = Interest rate sensitive assets – Interest rate sensitive liabilities

153
Average amounts and average interest rates of interest-earning assets and
interest-bearing liabilities
For the year ended December 31, 2016
Average Amount
Average Interest
Rate (%)
Assets
Cash and cash equivalents (Note) $ 895,741 0.30
Financial assets at fair value through
profit or loss 124,034,245 0.94
Bills and bonds investment with resale
agreements 880,683 0.36
Available-for-sale financial assets 122,382,562 1.74
Held-to-maturity financial assets 395,082 2.06
Liabilities
Interbank overdraft and call loans 23,405,510 0.41
Bills and bonds payable under
repurchase agreements 193,977,205 0.41
For the year ended December 31, 2015
Average Amount
Average Interest
Rate (%)
Assets
Cash and cash equivalents (Note) $ 899,501 0.50
Financial assets at fair value through
profit or loss 113,448,200 1.08
Bills and bonds investment with resale
agreements 2,855,538 0.56
Available-for-sale financial assets 88,626,072 1.74
Held-to-maturity financial assets 607,534 2.06
Liabilities
Interbank overdraft and call loans 22,314,315 0.45
Bills and bonds payable under
repurchase agreements 154,021,273 0.52
Note: Cash and cash equivalents include certificate of deposit pledged and
designated account for allowance to pay back short-term bills.
(6) Operating risk and legal risk
The Company’s operational risk management mainly aims to effectively implement
internal control and reduce losses from operational risk due to improper internal
operational procedures, personnel mistakes, system failure, or external events to achieve
business and management objectives.
A. Risk management policy
The Company established operational risk management guidelines and risk management
mechanism with objective review of effective implementation of operational risk
management mechanism in accordance with independent internal audit process. The
Company also set up emergency response plan and business continuity planning to
ensure rapid operation recovery and maintenance of normal business operation in case
of emergency and disaster.

154
B. Methods used in risk measurement
(A) The Company establishes operational loss database, gathers statistics on frequency
and amount of loss for individual loss event, and screen key risk indicators for the
purpose of enhancing current management mechanism of pointer event and
decreasing operational loss.
(B) The Company set up system of operational risk control self-assessments to perform
annual operational risk control self-assessments. The possibility and effect of loss
are used as loss measure indicators for self-assessments to generate risk mapping
and enhance control over businesses rated as medium risk. Besides, the Company
follows suggestion for self-assessments to improve current control mechanism for
the purpose of reducing losses from operational risk.
C.Additional information disclosed in accordance to the “Regulations Governing the
Preparation of Financial Reports by Publicly Held Bills Finance Companies”
Information on Breach of Applicable Laws or Regulations
December 31, 2015
Reason and Amount
Incurred
Indictment of the Company’s chairman or employees
for breach of applicable laws or regulations in the
latest year
None
Penalties imposed by the regulatory authority for breach
of the Bills Financing Act in the latest year None
Rectification requested by the Ministry of Finance for
business misconduct in the latest year None
Frauds committed by the Company’s employees, major
contingencies, or incidents caused by non-compliance
with the Safety Rules Governing the Financial
Institutions, which have incurred a total loss
exceeding $50 million on one single incident or all
the incidents in the latest year
None
Others None
Note: The latest period denotes one-year time from the current period of disclosure.
14. CAPITAL MANAGEMENT
For the purpose of establishing assessment procedure for capital adequacy and maintaining
adequate capital to assume overall risk arising from operations, the Company set up capital
adequacy self-assessment procedure and regulations to specify all significant risks that should
be assessed under capital management and adequate capital required for acceptance of such
risks. Moreover, the Company set up capital adequacy ratio for annual risk management
objectives and periodically report capital adequacy ratio with disclosure of information about
capital adequacy. Objectives, policies, and procedures of the Company’s capital management
are as follows:

155
(1) The objectives of capital management
A. Methods used in assessment of capital required for acceptance of various risks should
follow the principle of supervisory review for capital adequacy by the competent
authority except standardized approach used in assessment of credit risk and market
risk, and basic indicator approach used in assessment of operational risk.
B. The Company’s capital management should not only meet the minimum regulated
capital adequacy ratio but also evaluate the risk profile, strategy, and operational plan
that could be sufficiently handled by the internal eligible self-owned capital to set
capital adequacy ratio as the objective of internal capital management.
(2) Policies and procedures of capital management
A. The Company shall keep meeting the capital adequacy ratio regulated by the
competent authority and establish capital adequacy self-assessment procedure that
conforms to the risk profile based on the business size, status of credit risk, market risk,
and operational risk, as well as future trend in operation. The Company shall also set
up strategy to maintain adequate capital and supervise the capital adequacy.
B. The risk control department annually sets target value and alarm value of capital
adequacy ratio as the annual risk management objectives, which will be submitted to
the risk management committee of the Company and Mega Financial Holding Co., Ltd.
for deliberation and then the Company’s Board of Directors for approval. The risk
control department supervises enforcement of risk management objectives and
quarterly reports it to the risk management committee and Board of Directors of the
Company.
C. The risk control department calculates capital adequacy ratio, assesses the capital
adequacy, and reports the details to the general manager on a monthly basis.
Assessment of capital adequacy includes the following: capital structure and risk
tolerance, impact of major business risks on the capital, simulation analysis on
operational plan, capital adequacy ratio for capital increase/reduction plan or
significant capital utilization, and stress testing.
(3) Capital adequacy ratio
Year
Items
December 31,
2016
December 31,
2015
Eligible
capital
Tier 1 Capital, net 33,248,864 30,545,923
Tier 2 Capital, net - -
Tier 3 Capital, net - 742,820
Eligible capital, net 33,248,864 31,288,743
Risk-
weighted
assets,
total
Credit risk 152,319,549 150,648,275
Operation risk 7,045,250 6,520,755
Market risk 86,309,950 68,198,800
Risk-weighted assets, total 245,674,749 225,367,830
Capital adequacy ratio (%) 13.53 13.88
Ratio of Tier I capital to risk - weighted assets (%) 13.53 13.55
Ratio of Tier II capital to risk - weighted assets (%) - -
Ratio of Tier III capital to risk - weighted assets (%) - 0.33
Ratio of common stocks to total assets (%) 4.96 5.88

156
A. Capital adequacy ratio = Eligible capital ÷ Risk-weighted assets
B. The total amount of assets equals the total assets presented in the balance sheet.
C. The ratio is calculated for the end of June and December which were also disclosed in
the first and third quarter financial statements.
D. The above eligible capital and risk-weighted assets are calculated and recorded in
accordance with “Regulations Governing Capital Adequacy of Bills Finance
Companies” and “Calculation and Forms of Own Capital and Risk Assets of Bills
Finance Companies”.
15. ADDITIONAL DISCLOSURES
(1) Significant transaction information:
A. Marketable securities acquired or disposed of, at costs or prices of at least NT$100
million or 20% of the issued capital: None.
B. Acquisition of individual real estate, at costs or prices of at least NT$100 million or
20% of the issued capital: None.
C. Disposal of individual real estate, at costs or prices of at least NT$100 million or 20%
of the issued capital: None.
D. Allowance for service fees to related parties amounting to at least NT$5 million: None.
E. Receivables from related parties amounting to at least NT$100 million or 20% of the
issued capital: None.
F. Sales of non-performing loans : None.
G. Securitization products and its related information that applied by subsidiaries in
compliance with the “Financial Asset Securitization Act” or “Real Estate Securitization
Act” : None.
H. Significant inter-company transactions : None.
I. Other significant transactions which may affect the decisions of users of financial
reports: None.
(2) Information on the subsidiaries: None.
(3) Supplementary disclosure regarding investee companies: None.
(4) Information on investments in Mainland China: None.
(5) Information on the apportionment of the revenues, costs, expenses, gains and losses arising
from the transactions among the Company, Mega Financial Holding Co., Ltd. and its
subsidiaries, joint promotion of businesses, and sharing of information, operating facilities
or premises:
A. Please refer to Note 7 for details.

157
B. Joint promotion of businesses
In order to create synergies within the company and provide customers financial
services in all aspects, the Company provides mobility service (e.g. visiting clients) or
promotes through telephone, mobile phone or email.
C. Sharing of information and operating facilities or premises
Under the Financial Holding Company Act, Personal Data Protection Law and the
related regulations stipulated by FSC, when customers’ information of a financial
holding company’s subsidiary is disclosed to the other subsidiaries under the company
or exchanged between the subsidiaries for the purpose of cross-selling of products, the
subsidiaries receiving, utilizing, managing or maintaining the information are bound to
use the information for the specified purposes only. In addition, the Company is
required to publish its “Measures for Protection of Customers’ Information” at its
website and operating premises. Customers also reserve the right to have their
information withdrawn from the information sharing mechanism.
16. DISCLOSURE OF FINANCIAL INFORMATION BY
SEGMENTS
(1) General information
The Company determines the responsible segments for information reporting depending on
the information used by Chief Operating Decision-Maker (CODM). There are three
segments of the Company which are responsible for reporting: bills, bonds, and the branch
segment. The branch segment refers to eight branches with similar economic and business
characteristics which do not satisfy the criteria for quantitative threshold and are into a
reporting segment.
The bills segment is responsible for the commercial bill guarantee, short-term bill issuance
in the primary market and the repo trade in the secondary market. The bonds segment is
responsible for the business of bonds, bonds under repurchase or reverse sell agreements,
fixed-income instruments, equity investment and businesses of financial derivative
transactions. The branches are responsible for bills and bonds businesses other than the
abovementioned trades for equity investment and derivative instruments.
The main income sources of the Company are from bills and bonds businesses. And the
bills and bonds business managed by the branches shares a similarity with the head office,
adding that the clients for primary market and investors in secondary market usually have a
strong regional characteristic. Therefore, the Company manages through a comprehensive
system by business nature and location.
(2) Measurement for segmental information
The gains and losses of both bills and bonds segments of the Company are assessed by net
income, whereas those of the branches are assessed by profit before income tax and used as
basis for performance evaluation. The inter-segment bills and bonds transactions of the
Company are regarded as transactions with a third party and are evaluated by current
market prices. The Company does not amortize the operating expenses and income tax
expense to bills segment and bonds segment. The amounts reported should be consistent
with the report submitted to the CODM. All the accounting policies of operating segments
are the same with the significant accounting policies summarized in Note 4. There is no
material change in the basis for formation of entities and division of segments in the
Company or in the measurement basis for segment information during this period.

158
Reconciliation for segment
Segmental information provided to CODM :
For the year ended December 31, 2016
Items
Bills
Segment
Bonds
Segment
Branch
Segment Adjustments Total
Net revenues (Note) $ 923,346 $ 1,586,717 $ 1,613,826 $ 197,820 $ 4,321,709
Net revenues from external clients 1,838,188 1,635,594 833,780 14,147 4,321,709
Net bills revenues 1,816,232 - 512,630 - 2,328,862
Net bond revenues - 1,530,194 315,185 - 1,845,379
Net equity investment revenues - 110,082 - - 110,082
Other net revenues 21,956 ( 4,682) 5,965 14,147 37,386
Net inter-segment revenues ( 914,842) ( 48,877) 780,046 183,673 -
Net bills revenues ( 914,842) - 779,696 135,146 -
Net bond revenues - ( 48,877) ( 5,413) 54,290 -
Other net revenues - - 5,763 ( 5,763) -
Interest income 888,116 1,426,567 201,054 ( 92,129) 2,423,608
Gains (losses) from reportable segments 923,346 1,586,717 1,298,086 ( 237,104) 3,571,045
Reportable segment assets 75,709,562 114,527,255 72,501,224 1,564,160 264,302,201
Reportable segment liabilities 45,059,052 97,374,758 71,040,606 17,048,727 230,523,143
(Blank Below)

159
For the year ended December 31, 2015
Items
Bills
Segment
Bonds
Segment
Branch
Segment Adjustments Total
Net revenues (Note) $ 1,093,141 $ 1,376,257 $ 1,430,650 $ 263,866 $ 4,163,914
Net revenues from external clients 1,954,003 1,469,881 717,673 22,357 4,163,914
Net bills revenues 1,818,313 - 438,290 - 2,256,603
Net bond revenues - 1,086,794 277,160 - 1,363,954
Net equity investment revenues - 382,005 - - 382,005
Other net revenues 135,690 1,082 2,223 22,357 161,352
Net inter-segment revenues ( 860,862) ( 93,624) 712,977 241,509 -
Net bills revenues ( 860,862) - 700,560 160,302 -
Net bond revenues - ( 93,624) 717 92,907 -
Other net revenues - - 11,700 ( 11,700) -
Interest income 889,620 998,745 109,874
31,270 2,029,509
Gains (losses) from reportable segments 1,093,141 1,376,257 1,089,042 ( 52,630) 3,505,810
Reportable segment assets 60,040,710 82,630,397 77,326,295 3,100,323 223,097,725
Reportable segment liabilities 39,375,792 60,168,432 75,863,446 13,236,803 188,644,473
Note: Net revenues include net interest income and net non-interest income. Additionally, net bills revenues and net bond revenues of the net
revenues include net interest income.
Five. Latest audited standalone financial reports: None.
Six. Financial distress encountered by the company or any of its affiliated companies in the recent year, up until the
publication date of this annual report, and impacts on the company’s financial position: None.

160
Analysis of Financial Condition and Financial
Performance, and Risk Management

161
One. Financial Condition
Unit: NT$ thousands
Year
Item 2016 2015 Variation
Amount %
Cash and cash equivalents 346,391 321,356 25,035 7.79
Financial assets at fair
value through profit and
loss
125,297,488 115,285,106 10,012,382 8.68
Available-for-sale financial
assets 132,867,186 100,816,225 32,050,961
31.79
Bills and bonds purchased
under resale agreements - 1,000,000 (1,000,000) (100.00)
Receivables - net 1,531,891 1,185,047 346,844 29.27
Held-to-maturity financial
assets 350,000 600,000 (250,000) (41.67)
Other financial assets - net 820,362 818,540 1,822 0.22
Property and equipment -
net 370,177 375,457 (5,280 ) (1.41)
Investment property– net 2,528,424 2,539,088 (10,664) (0.42)
Intangible assets - net 3,310 2,427 883 36.38
Deferred income tax assets-
net 152,104 106,254 45,850 43.15
Other assets - net 34,868 48,225 (13,357) (27.70)
Total assets 264,302,201 223,097,725 41,204,476 18.47
Interbank overdraft and call
loans 15,714,592 11,294,776 4,419,816 39.13
Financial liabilities at fair
value through profit and
loss
22,543 6,149 16,394 266.61
Bills and bonds payable
under repurchase
agreements
210,809,807 173,109,248 37,700,559 21.78
Payables 602,808 504,042 98,766 19.59
Current income tax
liabilities 191,490 131,256 60,234
45.89
Liabilities reserve 2,728,105 2,757,420 (29,315) (1.06)
Deferred income tax
liabilities 22,700 12,647 10,053
79.49
Other liabilities 431,098 828,935 (397,837) (47.99)
Total liabilities 230,523,143 188,644,473 41,878,670 22.20
Capital stocks 13,114,411 13,114,411 - -
Capital surplus 320,929 320,929 - -
Retained earnings 20,375,867 19,490,920 884,947 4.54

162
Other equity (32,149) 1,526,992 (1,559,141) (102.11)
Total equity 33,779,058 34,453,252 (674,194) (1.96)
Ratio change analysis: (Ratio change before and after over 20%; moreover, amount change for up
to NT$10,000 thousand)
1. Available-for-sale financial assets increased mainly because of higher holding position in
bonds.
2. Decrease in resale bill and resale bond investments was mainly due to the absence of resale
bond transactions at the end of 2016.
3. Net receivables increased mainly because of the higher bond positions held on hand, which
generated accrued interest receivables.
4. Held-to-maturity financial assets decreased mainly because of bonds maturing.
5. Net deferred income tax assets increased mainly because the Company had recognized deferred
income tax assets that were subject to review.
6. Net other assets decreased mainly due to a reduction in suspense payment.
7. The increase in interbank overdraft and call loans, repurchase bills and bond liabilities was
mostly the result of additional interbank borrowing and repurchase agreements undertaken to
fund the increase in bills and bonds position.
8. Increase in financial liabilities at fair value through profit and loss was mainly due to unrealized
losses on valuation of fixed-rate commercial papers acquired.
9. Increase in current income tax liabilities was mainly caused by an increase in income tax
payable.
10. Increase in deferred income tax liabilities was mainly attributed to the recognition of deferred
income tax liabilities on unrealized bond interest income.
11. Decrease in other liabilities was mainly attributed to the reduction of credit customers’ bill
repayment in temporary credits.
12. Decrease in other equity items was caused by a decrease of unrealized gain on available-for-sale
financial assets.

163
Two. Financial performance
Unit: NT$ thousands
Item 2016 2015
Increase
(Decrease)
amount
Ratio
Change
(%)
Interest income, net 2,423,608 2,029,509 394,099 19.42
Revenues other than
interest income, net 1,898,101 2,134,405 (236,304) (11.07)
Net income 4,321,709 4,163,914 157,795 3.79
Provisions 45,896 134,508 (88,612) (65.88)
Operating expenses (796,560) (792,612) (3,948) 0.50
Income before Tax from
Operating Unit 3,571,045 3,505,810 65,235 1.86
Income tax (expense) gain (590,919) (495,374) (95,545) 19.29
Net Income 2,980,126 3,010,436 (30,310) (1.01)
Other comprehensive
income for the current
period (net of tax expense)
(1,576,997) 385,439 (1,962,436) (509.14)
Comprehensive Income
for the current period 1,403,129 3,395,875 (1,992,746) (58.68)
Explanation of analysis of changes: (Ratio change over 20%)
1. Decrease in provision reversals was mainly due to lesser bad debt recovery.
2. Decrease in other comprehensive income for the current period was mainly attributable
to lesser unrealized gain on available-for-sale financial assets.

164
Three. Cash flow
I. Liquidity analysis for the last two years
Year
Item 2016 2015 Increase/Decrease (%)
Cash flow ratio (%) N/A 3.57 -
Cash flow adequacy ratio
(%) 156.13 182.30 (14.36)
Explanation of analysis of changes: (Ratio change over 20%)
None.
II. Liquidity analysis for the next year
Unit: NT$ thousands
Opening
cash
balance
Projected net
cash flow from
operating
activities
Projected cash
outflow
Projected cash
surplus (deficit)
+-
Remedial measures
for estimated cash
deficit
Investme
nt Plan
Financial
Plan
346,391 (3,297,253) 17,787,898 (20,738,760) - 21,079,366
1. Current cash flow analysis:
(1) Operating activities: Net cash outflow from operating activities is mainly due to
expected increase of holding position in available-for-sale financial assets.
(2) Investing activities: No major increase in investment is expected.
(3) Financing activities: mainly comprise of cash dividend payments and repayment
of interbank overdraft and call loans.
2. Liquidity analysis and financing of projected cash deficits: deficits are expected to
be supported by interbank overdraft and call loans.
Four. Impact of major capital expenditure on financial operations in the most
recent years: None.
Five. Investment policy, the cause of profit and loss, improvement plan and the
next-year investment plan in the most recent years:
I. Investment policy and investment plan for the next year
The Company's investment policy has been established in accordance with the
Regulations Governing Investments by Bills Finance Companies in Other Enterprises,

165
which requires the Company seek the parent company's and the authority's approval
before investing in new businesses, except for investments that had already been
approved prior to the implementation of The Act Governing Bills Finance Business.
The Company does not have any new investments planned in the next year.
II. The cause of investment profit or loss and the corresponding corrective action
In 2016, the Company received cash dividends totaling NT$12.555 million from
invested businesses, and stock dividends totaling 53,995 shares from Taiwan
Depository and Clearing Corporation and 45,677 shares from Taiwan Futures
Exchange Corporation.

166
Six. Risk Management
I. Risk management organizational framework and policy
(I) Risk management organizational framework
The Board of Directors is the highest authority for the Company’s risk
management; therefore, the Board of Directors takes ultimate responsibility for
establishing the Company’s risk management system and ensuring its effective
operation. The Risk Management Committee is under the supervision of the
General Manager to review business risk management reports, the allocation of
business risk and the deployment of risk assets, business risk management
objectives and implementation scenarios, and other risk management issues.
The Risk Control Department is responsible for enacting the risk
management-related regulations, enforcing the plans under the risk
management mechanism pursuant to the New Basel Capital Accord, organizing
the risk management objectives and reviewing the enforcement results,
controlling the Company’s capital adequacy, summarizing risk controls and
reporting the risk controls, and working with the competent authority and
holding company to plan, supervise or execute the risk management matters.
(II) Risk management policy
The Company relies on the “Financial Holding Company and Banking Internal
Control and Auditing System Enforcement Rules,” “Mega Financial Holding
Company Risk Management Policies and Guidelines,” and the Company’s
“Internal Control System Enforcement Rules” to regulate the Company’s
“Risk Management Policies and Operating Procedures” as the guidance for
business risk management in order to establish the Company’s risk
management system, ensure that the operational risk control within the
tolerance, and maintain a sound capital adequacy ratio.
II. Qualitative and quantitative information about various risks:
(I) Credit risk management system and capital requirement
1. Credit risk management system

167
2016
Aspects Contents
(1) Strategy,
objective, policy
and procedure
For the establishment of the credit risk management mechanism and
ensuring credit risk control within the tolerance of management
objectives, the “Credit Risk Management Guidelines” is stipulated
to control default loss risk resulted from the non-performance of
borrowers or counterparties due to business deterioration or other
factors. The relevant risk control measures include:
(1) Define the credit limit ratio by type of business and specific
security terms, and define credit risk limit management in
accordance with the “Credit Risk Management Guidelines.”
(2) Define the risk concentration ratio, set up alert standard, and
control mechanism for preventing excessive risk concentration
by customers (including one individual, one related party, and
one affiliated enterprise), businesses, and nations in accordance
with the “Regulations Governing Credit Risk Concentration.”
(2) Organization and
framework of
credit risk
management
system
With respect to the credit risk in the Company’s granting of loans
and various financial instruments, the Loan Review team and Risk
Management Committee are responsible for supervising and
reviewing various management regulations, granting of loans and
business risk management objectives. Meanwhile, the Bills
Department, Bonds Department and all branches are the main
operational units for credit risk control.
(3) Scope and
characteristics of
credit risk
reporting and the
measurement
system
The Company has set up the Risk Management Committee to
monitor operational risks. All business supervision units in the head
office are to present the business risk report by Department to the
Risk Management Committee on a quarterly basis. The Risk
Management Department is to report the risk management profile to
the board of directors periodically. The credit risk report covers the
total credit risk exposures by customer, industry and country, and
the status of operation of credit risk position. The measurement
system and reporting include the summarization of total credit risk
exposures by customer, industry and country, NPL ratio, maximum
limit of credit extension by business, maximum limit of guarantee,
and maximum limit of credit extension to a single enterprise, same
affiliate and same related party.
(4) Hedging policies,
strategy, and
process of
monitoring the
continuing
effectiveness of
hedging
The Company grants loans in accordance with a defined credit
investigation procedure, and considers the requirement of collaterals
and guarantor based on the customer’s financial and credit status.
Meanwhile, the Company defined the “Notes to Loan Review
Operation” to enhance the post-credit extension management. The
financial instruments are primarily managed in accordance with the
credit ratings for issuers and trading counterparts, and reviewed,
followed up and evaluated periodically, in order to enhance the
ability to bear the credit risk.

168
Aspects Contents
(5) Approach to
require the
authorized capital
Standard Method
2. Capital requirement of credit risk and risk assets amount (Standard Method)
March 31, 2017 Unit: NT$ thousands
Exposure type Capital requirement Risk-weighted assets
Sovereign state 0 0
Non-central government public
sectors 8,610 107,621
Bank (including multilateral
development banks) 189,884 2,373,544
Corporate (including securities
and insurance company) 12,303,088 153,788,603
Retail creditor’s right 53,455 688,194
Investments in equity securities 64,704 808,800
Credit extended to parent
company or subsidiary and credit
secured by marketable securities
issued by parent company or
subsidiary
0 0
Other assets 254,431 3,180,389
Total 12,874,172 160,927,151

169
(II) Risk management system, exposure and capital requirement of asset securitization
1. Risk management system of asset securitization
2016
Aspects Contents
(1) Asset securitization
management strategy
and procedure
A. In order to manage the transaction of asset securitization
products, the Company defined its “SOP and License
Guidelines for Fixed-Income Securities Underwritten and
Traded for Its Own Account for Customers”, “SOP for
Investment in Beneficiary Securities, Asset-Based
Securities and Related Fund”. Meanwhile, in order to
underwrite or buy in guarantee-free short-term bills, it also
defined the “SOP for Underwriting or Buy-in of
Guarantee-Free Short-Term Bills” and “Instructions to
Certify Underwriting and Trading of Beneficiary Securities
and Asset-Based Securities”, which provide that buy-in of
asset securitization products and asset securitization
short-term bills shall take into consideration the issuing
terms and conditions, yield, issuer (or guarantor) or credit
relating to specific debts, and relevant limit management,
limit review, risk control and business management
operations.
B. The relevant control measures include daily monitoring of
single beneficiary security bought in, evaluation on market
value of asset-based securities, limit of tolerable market
risk (value of change per basic point or per market
transaction); underwriting and buy-in of guarantee-free
short-term bills positions; reporting the beneficiary
securities invested by the Company, balance of asset-based
securities and income thereof to the Board of Director on a
quarterly basis.
(2) Organization and
framework of asset
securitization
management
Under the Company’s asset securitization product risk
management framework, the Company’s Board of Directors
has defined the limit of various securitization products or
limit of position and limit of loss. Bonds Dept. is responsible
for the management of beneficiary securities and asset-based
securities. Bills Dept. is responsible for the business
management of securitization short-term bills, dedicated to
reviewing the changes of credit rating related to asset
securitization products and researching and defines the
relevant countermeasures when the limit of loss is met. The
Risk Control Department is responsible for controlling the
change in the entire risk of asset securitization products
(3) Scope and
characteristics of asset
securitization risk
The business management units of the Head Office submit
the asset securitization product risk report to Risk
Management Committee on a quarterly basis by functions in

170
Aspects Contents
reporting and the
measurement system
order to explain the changes of credit relating related to
various asset securitization products, asset portfolio and
analysis about position income. The measurement system and
reports include credit ratings and income management
statement related to beneficiary securities, asset-based
securities related fund and guarantee-free asset securitization
short-term bills.
(4) Hedging policies,
strategy, and process of
monitoring the
continuing effectiveness
of hedging
The Company’s asset securitization product hedging strategy
is to avoid price risk, implement derivatives as operating
tools, periodically assess profit and loss and report the same
to the Board of Directors.
(5) Approach to require the
authorized capital
Standard Method

171
2. Asset Securitization Exposure and Capital Requirement by Type of Transaction
March 31, 2017 Unit: NT$ thousands
Type of
Exposure
Category of
asset
Traditional Portfolio Total
Company/Book Exposure Capital
Requirement Exposure
Capital
Requirement Exposure
Capital
Requirement Capital
Requirement
Before Asset
Securitization
Role Retention or
Buy-in (2)
Retention
or Buy-in (4) (5)=
(1)+(3)
(6)=
(2)+(4)
(1) (3)
Non-
founding
institution
Bank
book
Trading
book
Creditor’s
right to lease
512,108 29,454 512,108 29,454
Subtotal 512,108 29,454 512,108 29,454
Founding
institution
Bank
book
Trading
book
Subtotal
Total 512,108 29,454 512,108 29,454

172
3. Assets securitization of the Company (as the founding institution):
(1) Be an assets securitization founding institution: None.
(2) Securitized instruments information:
A. Summary of investment in securitized instruments
March 31, 2017 Unit: NT$ thousands
Item Accounting
category
Initial
Cost
Cumulative valuation
gains/losses
Cumulative
impairment
Book
value
Land Bank of
Taiwan in its
capacity as a
master custodian
of Chailease
Finance 2014
Securitized Senior
Special Purpose
Beneficiary
Security Tranche
A.
Available-for-sale
financial assets 500,000
12,108 (valued at market
price using corporate bond
benchmark yield curves (of
four ratings: twAAA, twAA,
twA, and twBBB) published
by Taipei Exchange;
straight-line compensation
was applied to derive yield
rates applicable for the
remaining tenor)
0 512,108
B. For the investment of any securitized instrument that amounts to more than
NT$300 million (excluding the Company as a founding institution holding
for the purpose of credit enhancement), the following information must be
disclosed:
March 31, 2017 Unit: NT$ thousands
Securities Accounting
category Currency
Issuer and
business
location
Date of
purchase
Maturity
date
Coupon
rate
Credit
rating
Payment for
interest and
principal
Initial
Cost
Cumulative
valuation
gains/losses
Cumulative
impairment
Book
value
Point of
claim
Assets pool
capacity
Land Bank of
Taiwan in its
capacity as a
master
custodian of
Chailease
Finance 2014
Securitized
Senior
Special
Purpose
Beneficiary
Security
Tranche A.
Available-
for-sale
financial
assets
NTD
Land Bank
of Taiwan,
Taipei City
July 24,
2014
Expected
maturity -
2019/7/24
1.85%
Taiwan
Ratings
twAAA
Interest is paid
on the 18th
business day
after the closing
date. From
2017/7/24
onwards, any
rental income,
instalment
payments, and
principals
received from
resale
agreements in
the asset pool
will no longer
be spent on
purchasing
assets but will
instead be used
first to repay
tranche A of the
beneficiary
security.
500,000
12,108 (valued
at market price
using corporate
bond benchmark
yield curves (of
four ratings:
twAAA, twAA,
twA, and
twBBB)
published by
Taipei
Exchange;
straight-line
compensation
was applied to
derive yield
rates applicable
for the
remaining tenor)
0 512,108 21.87%
Chailease
Finance's
entitlement
over
customers'
leases,
instalments
, and resale
agreements

173
C. Bills Finance Company serves as a founding institution of securitization
holding position for the purpose of credit enhancement: None.
D. Bills finance company serves as a buyer of credit-impaired assets or buyer
of liquidated assets in a securitization arrangement: None.
E. Bills Finance Company serves as a securitized instruments assurance
agency or providing liquidity financing credit line: None.
(III) Operational risk management system and capital requirement
1. Operational risk management system
2016
Item Contents
(1) Strategy and procedure
of operational risk
management
The “Operational Risk Management Guidelines” is stipulated
for the establishment of a sound operational risk management
framework and reduction of operational risk losses. The
framework referred to above includes: Define internal control
and management measures of operational risk and objectively
review the effective implementation of operational risk
management mechanism in accordance with independent
internal auditing procedures; stipulate operational risk
identification, assessment, measurement, communication, and
monitoring the management processes of implementing
countermeasures; establish risk management information
framework including loss event notification, follow-up and
verification, and systematic control of individual loss event
frequency, severity, and related information; establish
emergency response and business continuity plans; ensure the
resumption of operations promptly during an emergency or
disaster; and maintain business operations normally.
(2) Organization and
framework of
operational risk
management system
The Company’s operational risk controls mean the express
enactment of various operational manuals, which may be
amended from time to time due to changes in the laws and
regulations, or if required, in order to help the workers follow
the same. Risk Control Department shall design and introduce
the operational risk management framework approved by the
Board of Directors. The various units shall comply with the
internal controls, laws, and the requirements about operating
risk self-assessment system, fulfill the self-assessment
periodically. The auditing unit shall review the effective

174
Item Contents
implementation of risk management mechanisms
independently and objectively to promote the Company’s
well-founded operation.
(3) Scope and
characteristics of
operational risk
reporting and the
measurement system
The business management units of the Head Office report the
corrective actions against important operational risk loss
events, operating procedures and operating systems to Risk
Management Committee on a quarterly basis by functions;
Risk Control Department reports the annual operational risk
map to Risk Management Committee periodically, analyze the
operational risk event loss data and other information, and
report to the Board of Directors the development of qualitative
risk management objectives (various projects); the audit unit
shall report the audit result to the Board of Directors and
follow up and control required improvements periodically.
(4) Hedging policies,
strategy and process of
monitoring the
continuing effectiveness
of hedging
It is mainly to assess the probability of risk losses and the size
of potential losses. The choices of counter-measures include
avoidance, control and the transfer of offset. Establish business
surveillance reports and daily cross-examine the balance of
business operations, risk management objectives, and limits set
by external regulations. Check whether the risk exposures
exceed the limit and make an alert when it reaches the
vigilance level so as not to exceed the limits set by law or the
Company.
(5) Approach to require the
authorized capital
Basic Indicator Method

175
2. Capital requirement of operational risk and risk assets amount (Basic Indicator Method)
March 31, 2017 Unit: NT$ thousands
Year Gross profits Capital requirement Risk assets amount
2016 4,287,851
2015 4,143,037
2014 3,531,959
Total 11,962,847 598,142 7,476,775
(IV) Market risk management system and capital requirement
1. Market risk management system
2016
Item Contents
(1) Strategy and
procedure of market
risk management
The “Market Risk Management Guidelines” are stipulated for the
managing of market risk of financial instrument position. Control adverse
movement resulted from market price causing possible losses inside and
outside the Balance Sheet as guidelines for business operation. Based on
domestic and foreign economic data, measure economic status, predict
interest rate, and draft up operating strategies to plan control measures.
The measures include daily monitor risk management objectives
including the relevant position limit, loss limit, and sensitivity limit of
bills, bonds, equities, and derivatives; daily conduct bills, and bonds
position sensitivity analysis; and monthly validation of derivatives and
equities transaction valuation.
(2) Organization and
framework of market
risk management
system
The Company’s market risk is mainly the price risk of bills, bonds,
equities, and derivatives. The Risk Management Committee reviews the
risk management objectives of all financial instruments. The Bills
Department, Bonds Department, and all branches are the main
operational units for market risk control.
(3) Scope and
characteristics of
market risk reporting
and the measurement
The business management units of the Head Office shall submit the
report on the economic situation and interest rate analysis, operation of
bills, bonds, equities, and derivatives position, capital cost and
deployment, and hedging strategies and implementation to Risk

176
Item Contents
system
Management Committee on a quarterly basis by functions; Risk Control
Department reports the development of market risk management
objectives to the Board of Directors on a quarterly basis; Audit Office
submits the audit report on transaction of derivatives to the Board of
Directors on a monthly basis. The risk measurement system and reports
include bills, bonds, equities, and derivatives positions, profit and loss,
risk life and stress tests, and sensitivity analysis.
(4) Hedging policies,
strategy, and process
of monitoring the
continuing
effectiveness of
hedging
The Company’s hedging strategy is to avoid price risk, implement
derivatives as operating tools, and periodically assess profit and loss.
(5) Approach to require
the authorized capital
Standard Method
2. Capital requirement of market risk and risk assets amount (Standard Method)
March 31, 2017 Unit: NT$ thousands
Type Capital requirement Risk assets amount
Interest rate risk 7,199,065 89,988,313
Equity security risk 220,685 2,758,563
Foreign exchange risk 34,068 425,850
Product risk 0 0
Stock option processed with simplified method 0 0
Total 7,453,818 93,172,725
(V) The liquidity risk includes the analysis about maturity of assets and liabilities, and also
explains the method to manage the asset liquidity and funding gap liquidity.
1. By the characteristics of business lines, the Company’s liquidity assets include bonds,
Treasury bills, Central Bank Certificate of Deposits, and short-term promissory notes,
with low credit risk and liquidity.
2. The “Liquidity Risk Management Guidelines” are stipulated for the measuring of
liquidity risk position effectively, maintaining adequate liquidity, and ensuring
solvency. The relevant control measures include: Monitor daily the Company’s cash

177
flow deficit limits of each term and appropriately avoid capital liquidity risk;
establish a capital emergency response management mechanism, activate an
emergency response mechanism promptly upon the occurrence of a liquidity crunch,
soaring interest rates or unexpected financial events causing serious impacts on
liquidity risk, and convene the Risk Management Committee to form contingency
measures.
3. The Company’s liquidity risk control is under the supervision of the Risk
Management Committee. The Bills Department is responsible for daily operations
and capital liquidity deficit management. The risk measurement system and reports
include: Control of total main liabilities amount and capital flow deficit management
of each term. The Finance Department is responsible for reporting the monitoring
and control of liquidity risk.
Analysis on Maturity of Assets and Liabilities
March 31, 2017 Unit: NT$ millions
Total
Amount of the remaining period to maturity date
0 – 30 Days 31 – 90 Days 91 – 180
Days
181 Days – 1
Year
Over 1 Year
Assets 268,268 61,949 65,831 9,070 8,831 122,587
Liabilities 235,148 211,346 22,108 1,241 284 169
Deficit 33,120 -149,397 43,723 7,829 8,547 122,418
Accumulated
deficit -149,397 -105,674 -97,845 -89,298 33,120
III. Impact on the Company’s financial standing due to changes in domestic or foreign
policies and laws, and corresponding countermeasures
(I) Financial impacts in the event of changes in local and foreign regulations
1. Permission for banks to issue AUD-denominated NCDs: On September 20, 2016, the
Central Bank amended “Notes on Issuance of Foreign Currency-denominated
Negotiable Certificate of Deposit by Banks” and allow banks to issue
AUD-denominated NCDs. Enhanced system has gone live since the end of
December 2016, thereby enabling the Company to trade NCDs and make DVP
settlement over the foreign currency clearing platform.
2. A securities dealer that trades any 5-year and 10-year central government bond
announced by the TPEx may not have a cumulative net trading position in that bond

178
exceeding one-third of the total issued amount in the quarterly plan: On November
16, 2015, Taipei Exchange amended its “Taipei Exchange Rules Governing
Securities Trading on the TPEx” to introduce a new rule that, starting from 2016, no
single securities dealer may hold more than one-third of any of the 5-year and
10-year central government bonds announced by the TPEx at any time between the
period from the date of its when-issued trading to 6 months after the bond issuance
or reopening. This restriction will help eliminate monopolistic competition in bonds
market and bring trade activities to stimulate market interest rate movements.
3. Starting from January 1, 2016, banks are required to maintain liquidity coverage
ratio above 70%, and this minimum requirement will be raised progressively to
100% by January 1, 2019: On December 29, 2014, the Financial Supervisory
Commission announced the “Liquidity Coverage Ratio (LCR) Implementation
Standards” (referred to as the Implementation Standards below) and implemented
from January 1, 2015. From January 1, 2016 onwards, banks are required to
maintain LCR above 70%, and the minimum LCR requirement will be raised
progressively to 100% by January 1, 2019. Under the Implementation Standards,
some large banks will have to adjust asset quality, and bills finance companies may
encounter some difficulties with funding.
(II) Responsive measures
1. Maintain long-term relationships with financial institutions for more diverse funding
sources. Negotiate for lower cost of funding and maintain contacts with peers to gain
the latest market insights that would enable the Company to react to the changing
environment.
2. Expand source of capital in the secondary market by exploring customers that are
characterized by stability and low funding costs. Reduce the position of bills and
bonds held on hand.
IV. Impact on the Company’s financial standing due to technological or industrial
changes, and corresponding countermeasures
(I) Impact of technological changes and industrial changes on the Company’s finance and
business
1. The transactions and risk control financial engineering and system are increasingly
sophisticated to the advantage of bills finance company’s financial and business

179
operation.
2. The competent authorities open up new businesses (foreign currency bills and bonds,
and treasury bills) that help diverse business operations and increase operating
spaces to the advantage of enhancing the operation scales. However, uncertainties
remain with regards to the prospects of the world’s major economies, which may
complicate trading decisions.
(II) Responsive measures
1. Outsource systems and develop systems in-house to support transactions and risk
control.
2. Actively explore new services for higher income. In the meantime, the Company
will pay attention to changes in the economic and financial environment, and take
actions to minimize risks and negative impacts.
V. Impact of changes of the Company’s corporate image, and corresponding
countermeasures: None.
VI. Expected benefits, possible risks and response actions of merger and acquisitions:
None.
VII. Expected effect and possible risk of expanding business locations and the
countermeasures: None.
VIII. Risks generated by business concentration and response measures
The Company holds relatively high position of interest rate-sensitive assets due to
the nature of its business, and hence is prone to interest rate volatility. To address this
situation, the Company has implemented risk management targets for bills and
bonds-related activities based on the overall economy and growth requirements. Enhanced
measures are being taken to control risk exposure and duration, and hence avoid adverse
changes in market risks. In terms of credit/guarantee services, the Company is prone to the
concentration risk of guaranteed parties, which it aims to address by following the group’s
“Notes on Credit Control for Single Group of Borrowers.” Borrowers’ credit balances are
being controlled based on credit conduct, industry prospect, business performance,
financial position, debt levels and credit rating on both individual and group levels.

180
IX. Impact of changes in operating concessions on bills finance company, the related risk,
and the countermeasures: None.
X. Impact or risk associated with large transfers or changes in shareholdings by
directors or major shareholders holding over 1%: None.
XI. Lawsuit and non-lawsuit: None.
XII. Other significant risks and response actions
The Company has business risk management objectives defined annually in
accordance with the laws and policies of the competent authorities, the development of the
macro economy, features of instruments, and competition in financial services sector; also,
convenes Risk Management Committee meeting on a quarterly basis for ensuring all
business operations in compliance with the defined risk management objects and reducing
operational risk.
Seven. Crisis Management and Emergency Response
The Company has defined a management crisis contingency measure to help the Company
resolve crisis and resume business operation on a timely manner while suffering a huge loss of
fund or faces a severe shortage of liquidity that is detrimental to the Company’s solvency and
sustainable management. The Company is in line with the corporate risk management system,
has established emergency handling and notification system and activates related emergency
response mechanisms and external reporting systems in accordance with the emergency event.
In terms of liquidity risk, strictly control capital deficit of each term, maintain adequate liquidity,
and ensure solvency. Activate emergency response mechanism promptly upon the occurrence of
liquidity crunch, soaring interest rate or unexpected financial events causing serious impact on
capital by utilizing business channels and resources of the holding parent company and
subsidiaries for quick access to funds pour.
In terms of information safety, define the process recovery procedures of the server system,
database, terminal system, application system, computer-related facilities; also, set up remote
backup center in order to resume business operation promptly.
In terms of emergency rescue and protection, the disaster prevention measures and
emergency response strategies are defined and the Company’s disaster prevention and rescue

181
system are established to help minimize the impact and damage to business operation, office
equipment, document archives, and employee safety.
Eight. Other important issues: None.

182
Special Recorded Items

183
One. Affiliated enterprises
I. Consolidated business report of affiliated enterprises: None.
II. Consolidated financial statements of affiliated enterprises: None.
III. Affiliation report
(I) Declaration of Mega Bills Finance Co., Ltd.
Declaration
The Company’s 2016 Affiliation Report (from January 1 to December 31, 2016)
has been prepared in accordance with “Criteria Governing Preparation of Affiliation
Reports, Consolidated Business Reports and Consolidated Financial Statements of
Affiliated Enterprises.” There was no material discrepancy between information
disclosed in the Affiliation Report and information disclosed in footnotes of financial
statements for the corresponding period.
Sincerely yours,
Company: Mega Bills Finance Co., Ltd.
Chairman of the Board: Chang-Ruey Shiau
March 21, 2017

184
(II) Independent Auditor’s Report
Mega Bills Finance Co., Ltd.
Affiliation Report - Independent Auditor’s Report
Tze-Huei-Tsung-Tze No. 16008422
To Mega Bills Finance Co., Ltd.
The 2016 Affiliation Report dated March 21, 2017, was claimed to have been
prepared in accordance with "Criteria Governing Preparation of Affiliation Reports,
Consolidated Business Reports and Consolidated Financial Statements of Affiliated
Enterprises" with no material discrepancy between information disclosed in the above
report and notes to financial statements for the corresponding period.
We, the auditors, have compared the Company's Affiliation Report against
footnote disclosures presented in the 2016 financial statements based on “Criteria
Governing Preparation of Affiliation Reports, Consolidated Business Reports and
Consolidated Financial Statements of Affiliated Enterprises”, and found no material
contradiction to the above claims.
PriceWaterhouseCoopers, Taiwan
Shu-Mei Ji, CPA
March 21, 2017

185
(III) Relationship between subsidiary and parent company
Unit: shares; %
Parent
Company
Cause of
Control
Shareholding and pledge by parent
company
Directors, Supervisors and Managers
appointed by parent company
Quantity of
Shares Held Percentage
Pledged
shares Title Name
Mega
Financial
Holding Co.,
Ltd.
Wholly
owned 1,311,441,084 100% 0
Chairman of the
Board Chang-Ruey Shiau
Director and President Chi-Fu Lin
Independent Director Tsai-Chih Chen
Independent Director Yi-Jui Huang
Director Jui-Yun Lin
Director To-Ching Hu
Director Zong-Ming Yen
Director Chun-Hsiang Lee
Supervisor Fu-Jung Chen
Supervisor Chun-Ke Su
Supervisor Jin-Cun Chen
(IV) Transactions
1. Purchase (sales) transaction: None.
2. Property trade: None.
3. Financing transaction: None.
4. Assets leasing: None.
5. Other important transactions:
Bills and bonds trade Unit: NT$ thousands
Transactions conducted with parent company Trade terms and conditions with parent
company Remarks
Item Amount
Purchase of bills and bonds 20,191,016 Terms of transactions are same as
non-related parties’. None
The highest balance of guarantee-free
commercial paper issued. 4,000,000
Terms of trade transactions are same as
non-related parties’. Fee income: 232
The ending balance of guarantee-free
commercial paper issued. 2,100,000
(V) Endorsement and guarantee: None.

186
(VI) Other matters with a significant impact on finance and business: None.
Two. Offering of marketable securities as of last year and the Annual Report
publication date: None.
Three. Subsidiary holds or disposes the shares of the Company as of last year
and the Annual Report publication date: None.
Four. Other supplementary information: None.
Five. Matters that have a significant impact on the shareholders’ equity or
securities price as defined in Securities Exchange Act Article 36.2.2 as
of last year and the Annual Report publication date: None.
MEGA BILLS FINANCE CO., LTD.
Chairman of the Board: Chang-Ruey Shiau

187
Head Office
2~5F, No. 91 Heng-yang Road, Taipei City
Tel. No.: (02) 2383-1616 (Representative)
Fax: (02) 2382-2878 (Administration Department)
Website: http://www.megabills.com.tw/