megan oakleaf, mls, phd moakleaf@syr ...meganoakleaf.info/mlarubrics.pdf · 1. think aloud through...
TRANSCRIPT

Megan Oakleaf, MLS, PhDwww.meganoakleaf.info
Massachusetts Library Association1:15-2:30
© Oakleaf, 2010
Before We Begin…

© Oakleaf, 2010
What’s a Rubric?
Rubrics…• describe library service impact in 2
dimensions1. parts, indicators, or criteria and 2. levels of performance
• formatted on a grid or table• employed to judge quality • used to translate difficult, unwieldy data into
a form that can be used for decision-making

© Oakleaf, 2010
Rubric Types
• Checklists• Likert scales• Scoring guides• Full-model rubrics
© Oakleaf, 2010
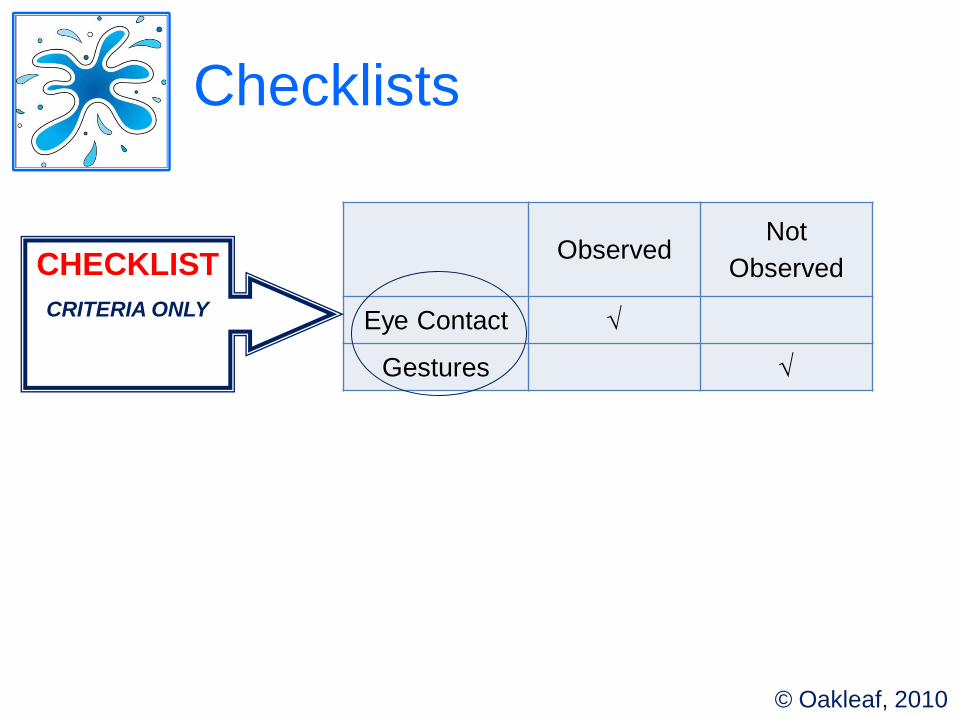
ObservedNot
Observed
Eye Contact √
Gestures √
Checklists
CHECKLIST CRITERIA ONLY

© Oakleaf, 2010
Novice Proficient Professional
Eye Contact √Gestures √
0 1 2
Eye Contact √
Gestures √
Likert Scales
LIKERT SCALECRITERIA
&
PERFORMANCE LEVELS
(numbers or descriptive terms)

© Oakleaf, 2010
Scoring Guides
Exemplary Comments
Eye Contact
Maintains sustained eye contact with the
audience.
Gestures
Gestures are used to emphasize talking
points.
SCORING GUIDECRITERIA,
TOP PERFORMANCE LEVEL,
&
TOP PERFORMANCE DESCRIPTION
© Oakleaf, 2010
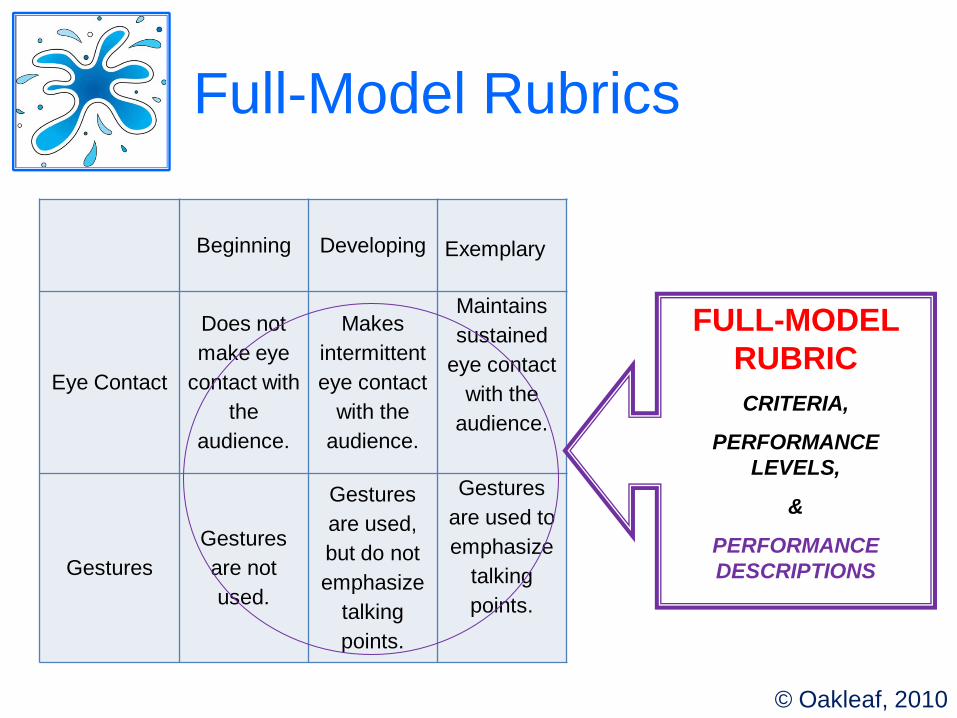
Full-Model Rubrics
Beginning Developing Exemplary
Eye Contact
Does not make eye
contact with the
audience.
Makes intermittent eye contact
with the audience.
Maintains sustained
eye contact with the
audience.
GesturesGestures are not used.
Gestures are used, but do not emphasize
talking points.
Gestures are used to emphasize
talking points.
FULL-MODEL RUBRICCRITERIA,
PERFORMANCE LEVELS,
&
PERFORMANCE DESCRIPTIONS

Fiction Writing (Analytic) Rubric

© Oakleaf, 2010
Criteria
1. “the conditions a [service] must meet to be successful” (Wiggins)
2. “the set of indicators, markers, guides, or a list of measures or qualities that will help [a scorer] know when a [service] has met an outcome” (Bresciani, Zelna and Anderson)
3.what to look for in [service] performance “to determine progress…or determine when mastery has occurred” (Arter)

© Oakleaf, 2010
Performance Levels
mastery, progressing, emerging, satisfactory, marginal, proficient,
high, middle, beginning, advanced, novice, intermediate, sophisticated,
competent, professional, exemplary, needs work, adequate,
developing, accomplished, distinguished

© Oakleaf, 2010
Performance Levels
If you want to force evaluative decisions, choose an even number of levels (usually 4).
If you want to have a middle ground, choose an odd number of levels (usually 3 or 5).
Choose a number that you can justify based on developmental service stages.
© Oakleaf, 2010
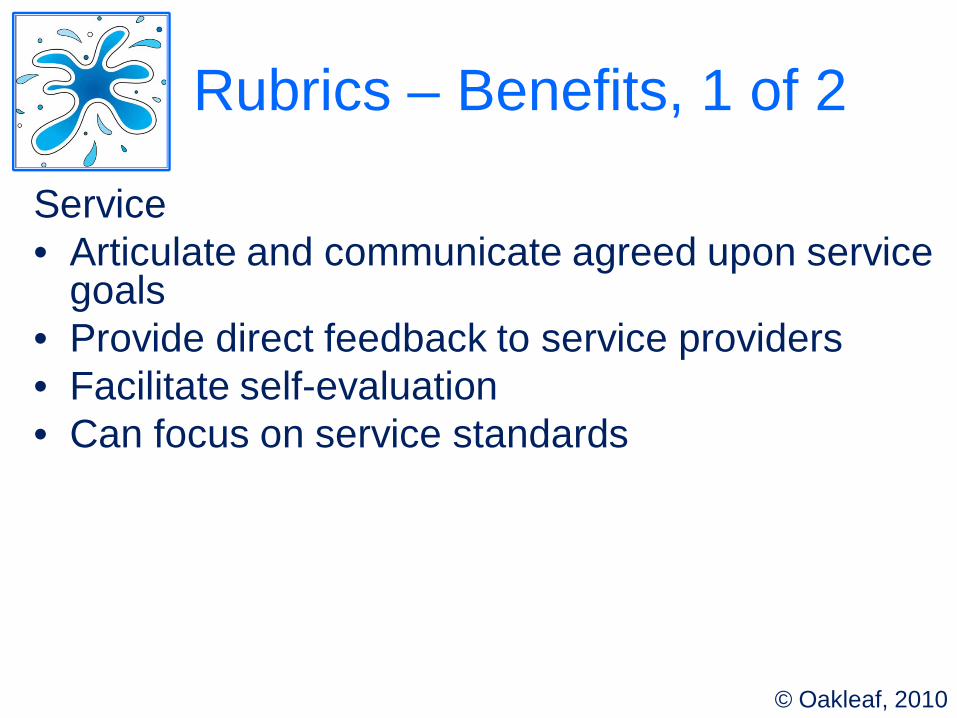
Rubrics – Benefits, 1 of 2
Service• Articulate and communicate agreed upon service
goals• Provide direct feedback to service providers• Facilitate self-evaluation• Can focus on service standards
Article forthcoming by Megan Oakleaf
© Oakleaf, 2010
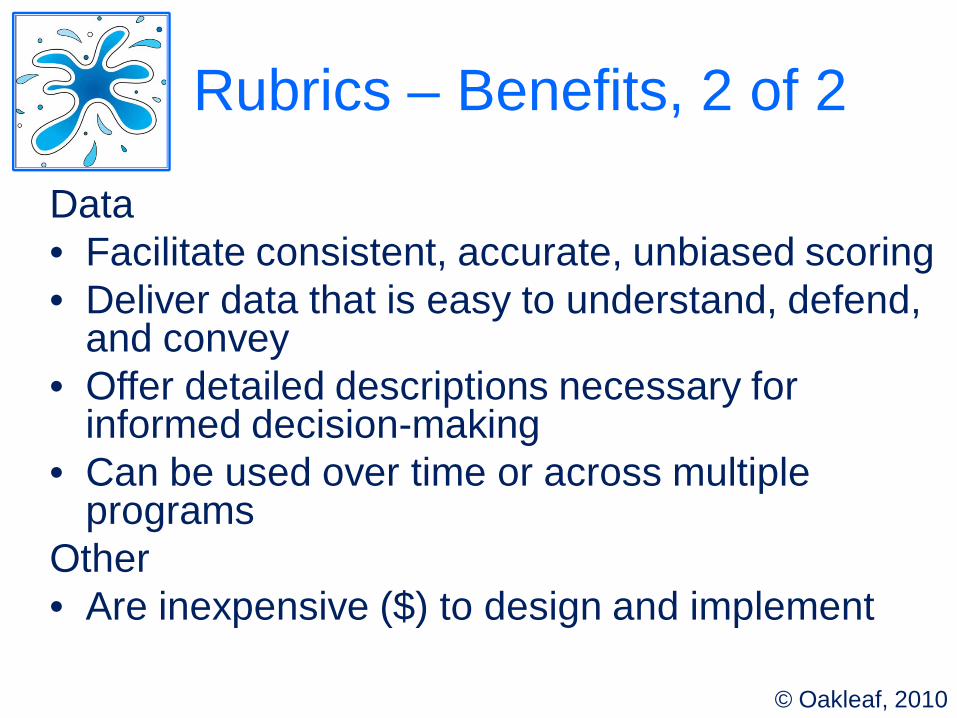
Rubrics – Benefits, 2 of 2
Data• Facilitate consistent, accurate, unbiased scoring• Deliver data that is easy to understand, defend,
and convey• Offer detailed descriptions necessary for
informed decision-making• Can be used over time or across multiple
programsOther• Are inexpensive ($) to design and implement
© Oakleaf, 2010
Rubrics – Limitations
• May contain design flaws that impact data quality
• Require time for development

Example Service Rubrics
Disclaimer: Created by former students…not necessarily perfect!
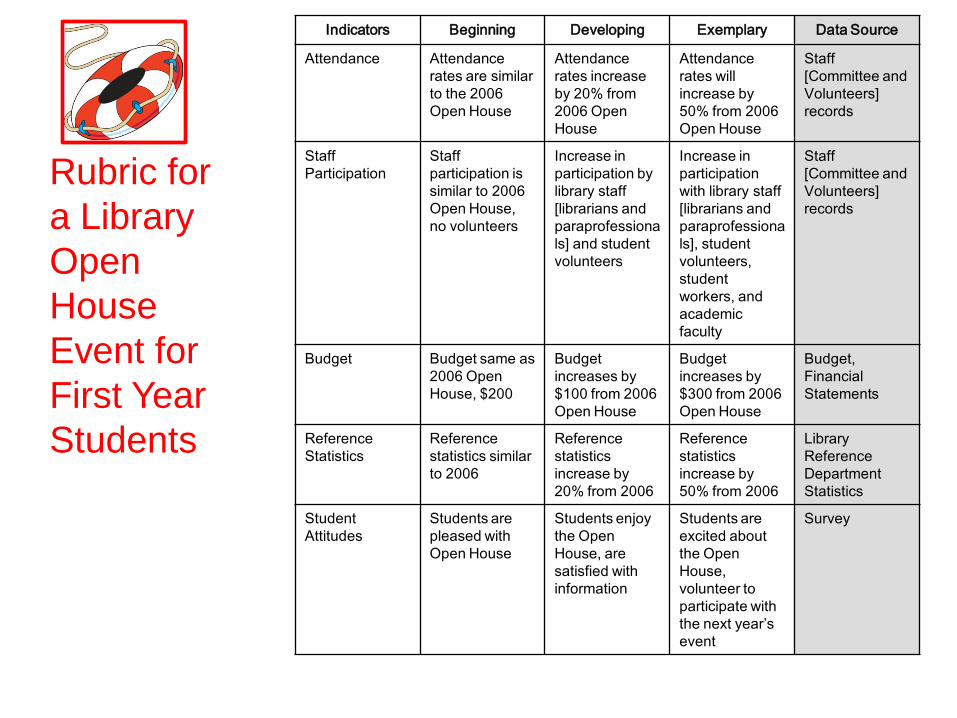
Rubric for a Library Open House Event for First Year Students
Indicators Beginning Developing Exemplary Data Source
Attendance Attendance rates are similar to the 2006 Open House
Attendance rates increase by 20% from 2006 Open House
Attendance rates will increase by 50% from 2006 Open House
Staff [Committee and Volunteers] records
Staff Participation
Staff participation is similar to 2006 Open House, no volunteers
Increase in participation by library staff [librarians and paraprofessionals] and student volunteers
Increase in participation with library staff [librarians and paraprofessionals], student volunteers, student workers, and academic faculty
Staff [Committee and Volunteers] records
Budget Budget same as 2006 Open House, $200
Budget increases by $100 from 2006 Open House
Budget increases by $300 from 2006 Open House
Budget, Financial Statements
Reference Statistics
Reference statistics similar to 2006
Reference statistics increase by 20% from 2006
Reference statistics increase by 50% from 2006
Library Reference Department Statistics
Student Attitudes
Students are pleased with Open House
Students enjoy the Open House, are satisfied with information
Students are excited about the Open House, volunteer to participate with the next year’s event
Survey

Indicators Beginning Developing Exemplary Data Source
Transactions 0 – 4 reference transactions per week.
5 – 7 reference transactions per week.
8 + reference transactions per week.
Transaction Logs
User Satisfaction Students, faculty and staff report they are “dissatisfied” or “very dissatisfied” with reference transactions.
Students, faculty and staff report they are “neutral” about reference transactions.
Students, faculty and staff report they are “satisfied” or “very satisfied” with reference transactions.
User Surveys
Training Librarians report they are “uncomfortable” or “very uncomfortable” with providing virtual reference service.
Librarians report they are “neutral” about providing virtual reference service.
Librarians report they are “comfortable” or “very comfortable” with providing virtual reference service.
Post-Training Surveys
Technology Between 75 % and 100 % of transactions a week report dropped calls or technical difficulties.
Between 25 % and 74% of transactions a week report dropped calls or technical difficulties.
Between 0 % and 24% of transactions a week report dropped calls or technical difficulties.
System Transcripts
Electronic Resources 0 – 50 hits on electronic resources a week.
50 – 100 hits on electronic resources a week.
100 + hits on electronic resources a week.
Systems Analysis Logs
Rubric for a Virtual Reference Service
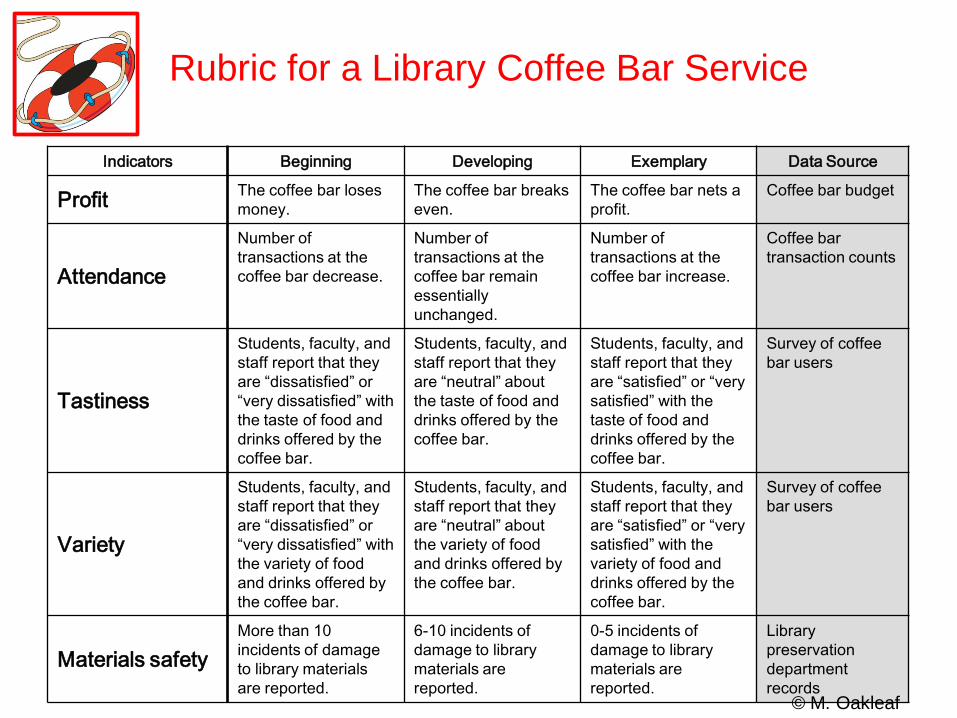
Indicators Beginning Developing Exemplary Data Source
Profit The coffee bar loses money.
The coffee bar breaks even.
The coffee bar nets a profit.
Coffee bar budget
Attendance
Number of transactions at the coffee bar decrease.
Number of transactions at the coffee bar remain essentially unchanged.
Number of transactions at the coffee bar increase.
Coffee bar transaction counts
Tastiness
Students, faculty, and staff report that they are “dissatisfied” or “very dissatisfied” with the taste of food and drinks offered by the coffee bar.
Students, faculty, and staff report that they are “neutral” about the taste of food and drinks offered by the coffee bar.
Students, faculty, and staff report that they are “satisfied” or “very satisfied” with the taste of food and drinks offered by the coffee bar.
Survey of coffee bar users
Variety
Students, faculty, and staff report that they are “dissatisfied” or “very dissatisfied” with the variety of food and drinks offered by the coffee bar.
Students, faculty, and staff report that they are “neutral” about the variety of food and drinks offered by the coffee bar.
Students, faculty, and staff report that they are “satisfied” or “very satisfied” with the variety of food and drinks offered by the coffee bar.
Survey of coffee bar users
Materials safetyMore than 10 incidents of damage to library materials are reported.
6-10 incidents of damage to library materials are reported.
0-5 incidents of damage to library materials are reported.
Library preservation department records
Rubric for a Library Coffee Bar Service
© M. Oakleaf
© Oakleaf, 2010
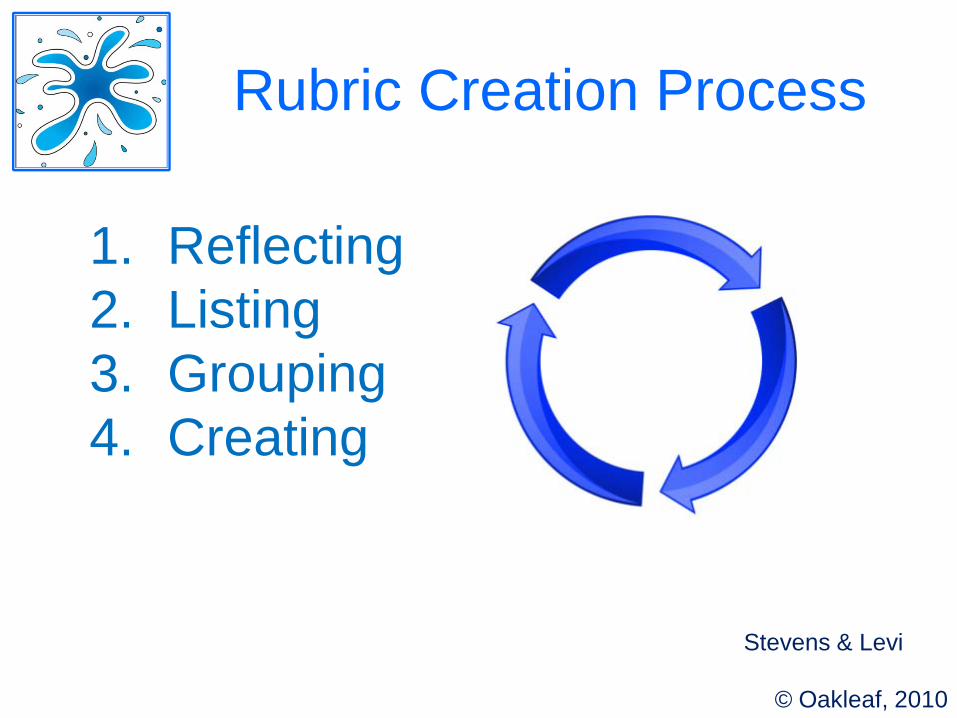
Rubric Creation Process
1. Reflecting2. Listing3. Grouping4. Creating
Stevens & Levi

© Oakleaf, 2010
At Your Table…Choose a Service!
• Reference• Virtual Reference• First Year Orientation• Summer Reading Program• Book Club• Coffee Bar• Gaming Program• Media Resources

© Oakleaf, 2010
Reflecting
Consider:1. Why did we create this
service?2. What happened when other
libraries provided the service?
3. What is the relationship between this service and the rest of the library services?
Stevens & Levi

© Oakleaf, 2010
Listing
1. What are our expectations of the service? What does a successful service of this type look like?
2. What specific service outcomes do we want to see in the completed service?
3. What evidence can we find that will demonstrate service success? Stevens & Levi

© Oakleaf, 2010
Grouping & Labeling
1. Can we group our brainstorms into categories?
2. How can we label them?
Stevens & Levi

© Oakleaf, 2010
Labeled Groups = Criteria
© Oakleaf, 2010
Performance Levels
mastery, progressing, emerging, satisfactory, marginal, proficient,
high, middle, beginning, advanced, novice, intermediate, sophisticated,
competent, professional, exemplary, needs work, adequate,
developing, accomplished, distinguished
© Oakleaf, 2010
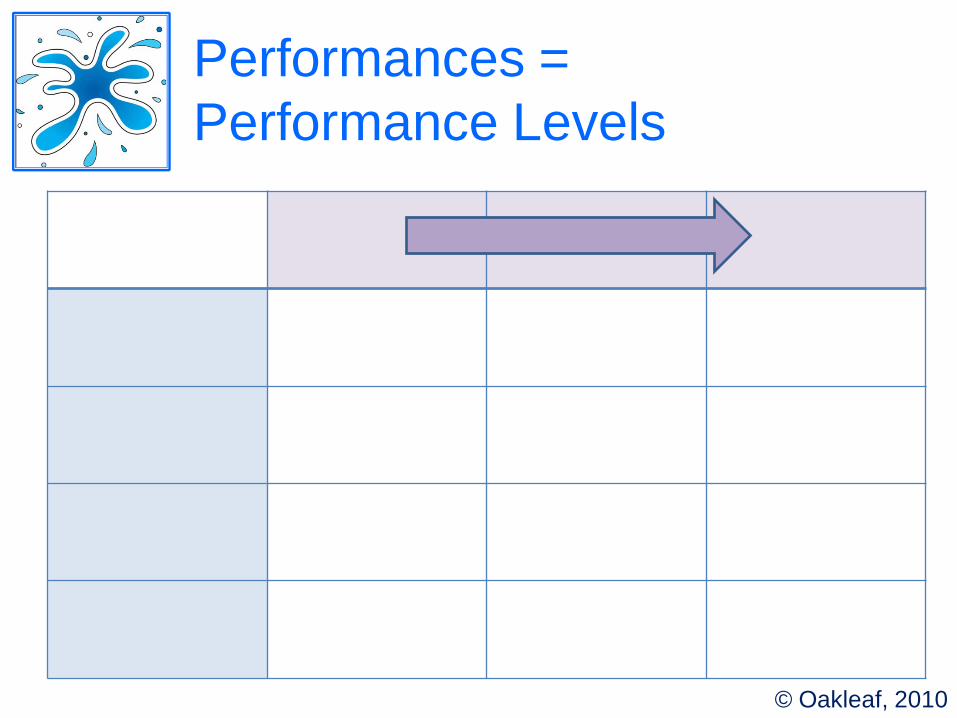
Performances = Performance Levels
© Oakleaf, 2010
Best Possible Performance
1. For each group area (“criteria”), what are our highest expectations of the service? What is the best possible performance?

© Oakleaf, 2010
Other Possible Performances
1. For each group area (“criteria”), what are our highest expectations of the service? What is the best possible performance?
2. The worst?3. The other expected levels?

© Oakleaf, 2010
Performances = Performance Descriptions

© Oakleaf, 2010
Common Design Flaws
• Too long• Too “jargony”• Too vague• Inconsistent across performance levels
(using parallel language helps)• Lack of differentiation across performance levels• Too negative at lower levels
© Oakleaf, 2010
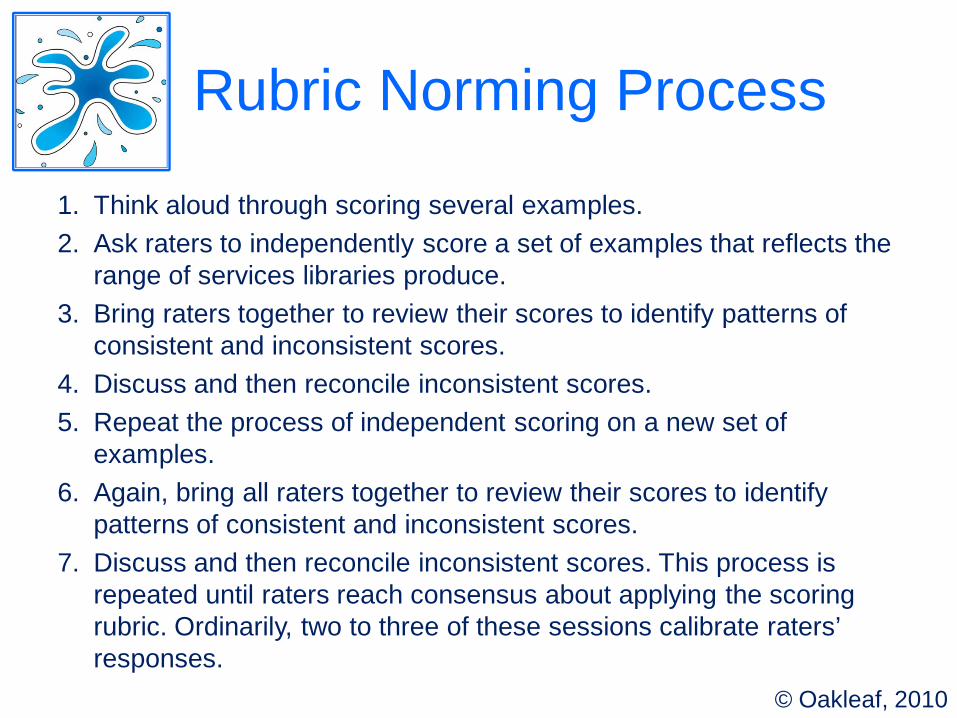
Rubric Norming Process
1. Think aloud through scoring several examples.2. Ask raters to independently score a set of examples that reflects the
range of services libraries produce.3. Bring raters together to review their scores to identify patterns of
consistent and inconsistent scores. 4. Discuss and then reconcile inconsistent scores.5. Repeat the process of independent scoring on a new set of
examples.6. Again, bring all raters together to review their scores to identify
patterns of consistent and inconsistent scores.7. Discuss and then reconcile inconsistent scores. This process is
repeated until raters reach consensus about applying the scoring rubric. Ordinarily, two to three of these sessions calibrate raters’ responses.
© Oakleaf, 2010
Thinking Aloud
What are appropriate scores for these
examples?

© Oakleaf, 2010
Independent Scoring
What scores would you assign to these
examples?
© Oakleaf, 2010
Reconciling Differences
Where do we disagree? Can we come to
consensus?

© Oakleaf, 2010
Identifying Anchors
Are there great examples of specific levels
on each criterion?
© Oakleaf, 2010
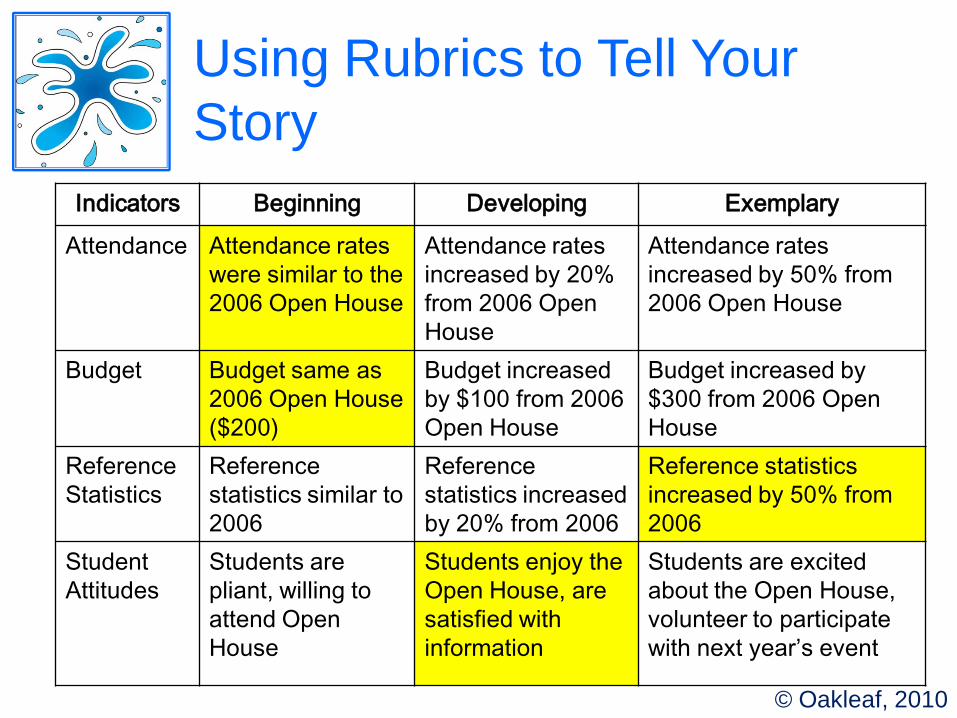
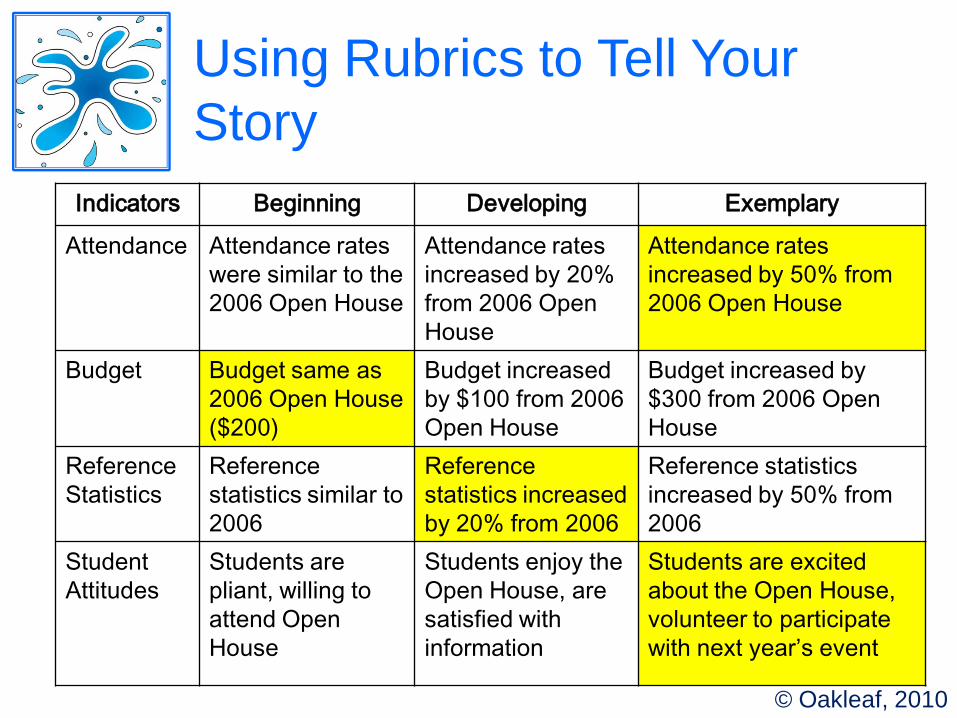
Using Rubrics to Tell Your Story
Indicators Beginning Developing Exemplary
Attendance Attendance rates were similar to the 2006 Open House
Attendance rates increased by 20% from 2006 Open House
Attendance rates increased by 50% from 2006 Open House
Budget Budget same as 2006 Open House ($200)
Budget increased by $100 from 2006 Open House
Budget increased by $300 from 2006 Open House
Reference Statistics
Reference statistics similar to 2006
Reference statistics increased by 20% from 2006
Reference statistics increased by 50% from 2006
Student Attitudes
Students are pliant, willing to attend Open House
Students enjoy the Open House, are satisfied with information
Students are excited about the Open House, volunteer to participate with next year’s event
© Oakleaf, 2010
Using Rubrics to Tell Your Story
Indicators Beginning Developing Exemplary
Attendance Attendance rates were similar to the 2006 Open House
Attendance rates increased by 20% from 2006 Open House
Attendance rates increased by 50% from 2006 Open House
Budget Budget same as 2006 Open House ($200)
Budget increased by $100 from 2006 Open House
Budget increased by $300 from 2006 Open House
Reference Statistics
Reference statistics similar to 2006
Reference statistics increased by 20% from 2006
Reference statistics increased by 50% from 2006
Student Attitudes
Students are pliant, willing to attend Open House
Students enjoy the Open House, are satisfied with information
Students are excited about the Open House, volunteer to participate with next year’s event

2-Question Evaluation
• What is the most valuable thing you learned from this workshop?
• What is one question you still have?


© Oakleaf, 2010
Weighting, Points, & Grades
Use weight to communicate areas of emphasis
If learning-oriented…• Award points in whole
numbers• Base grades on logic,
not percentages or GPA equivalents