meize otc16290 slides spe distinguished lecturer series
TRANSCRIPT

Distinguished Lecturer Series, 2005 - 2006
1
SPE DISTINGUISHED LECTURER SERIESis funded principally
through a grant of the
SPE FOUNDATIONThe Society gratefully acknowledges
those companies that support the programby allowing their professionals
to participate as Lecturers.
And special thanks to The American Institute of Mining, Metallurgical,and Petroleum Engineers (AIME) for their contribution to the program.

Distinguished Lecturer Series, 2005 - 2006
2
“Lessons Learned from Integrated Analysis of GOM Drilling
Performance ”
Presented by Robert A. Meize, WWDWO Drilling Manager
Anadarko Petroleum Corporation
Distinguished Lecturer Series, 2005 - 2006
3
Presentation Summary
• Company Overview• Drilling Data Analysis Implications• Conventional Drilling Data Analysis• “New-and-improved” Analysis• Actual Results• Conclusions

Distinguished Lecturer Series, 2005 - 2006
4
TEXAS
LOUISIANA10
00m
2004 GOM Rig Count – Max 7; Min 2
GC 518 (K2 North)
GC 562 (K2)
GC 608 (Marco Polo)
GC 652 (Genghis Khan)
EGOM

Distinguished Lecturer Series, 2005 - 2006
5
WesternWestern
Eastern Gulf CoastEastern Gulf Coast
MidMid--ContinentContinent
Central TexasCentral Texas
Western CanadaWestern Canada
MacKenzieMacKenzie DeltaDelta
North SlopeNorth Slope
Onshore
2004 Onshore Rig Count; Max. 62, Min. 42

Distinguished Lecturer Series, 2005 - 2006
6
Georgia Black SeaGeorgia Black Sea
Faroe IslandsFaroe Islands
Nova ScotiaNova Scotia
W. AfricaW. Africa
International
IndonesiaIndonesia
N. AfricaN. Africa
Middle EastMiddle East

Distinguished Lecturer Series, 2005 - 2006
7
Study Objectives
• Stimulate industry discussion• Present summary data to management and
industry peers• Benefits of state-of-the-art drilling analysis
– efficiency– knowledge retention and transfer– problem identification

Distinguished Lecturer Series, 2005 - 2006
8
Drilling Analysis ….
• On par with other disciplines?
• What resources committed to collecting and storing data?
• How much analysis needed for improvement?

Distinguished Lecturer Series, 2005 - 2006
9
Drilling Challenges and Opportunities
• Wellbore Designs for Different Areas• Project Management – All Disciplines• Implementation• Technology Development & Transfer• Lowering Cost / ft

Distinguished Lecturer Series, 2005 - 2006
10
Motivation and Justification
• Industry spends $MM’s collecting/storing data
• 35% + corporate capex spent on drilling • Individual well costs often determine
economics• Cost/benefit of drilling studies • Trained personnel necessary for
maximum benefit. • Drilling Data Mgmt ≤ $1MM/yr

Distinguished Lecturer Series, 2005 - 2006
11
Percentages of Total and Non-Trouble Drilling Costs SPUD Through Evaluation
APC 1999 – 2004
73%620 MM
27%232 MM
Non-Trouble Cost
Trouble

Distinguished Lecturer Series, 2005 - 2006
12
1999 - 2004 APCDrilling Trouble Cost
0
5
10
15
20
25
30
35
40
Cemen
ting
Well C
ontrol
Loss C
irc.
Tool Fail
ureTight H
oleRig R
epair BOP
Other
Trouble Type
Cos
t ($
MM
)
Distinguished Lecturer Series, 2005 - 2006
13
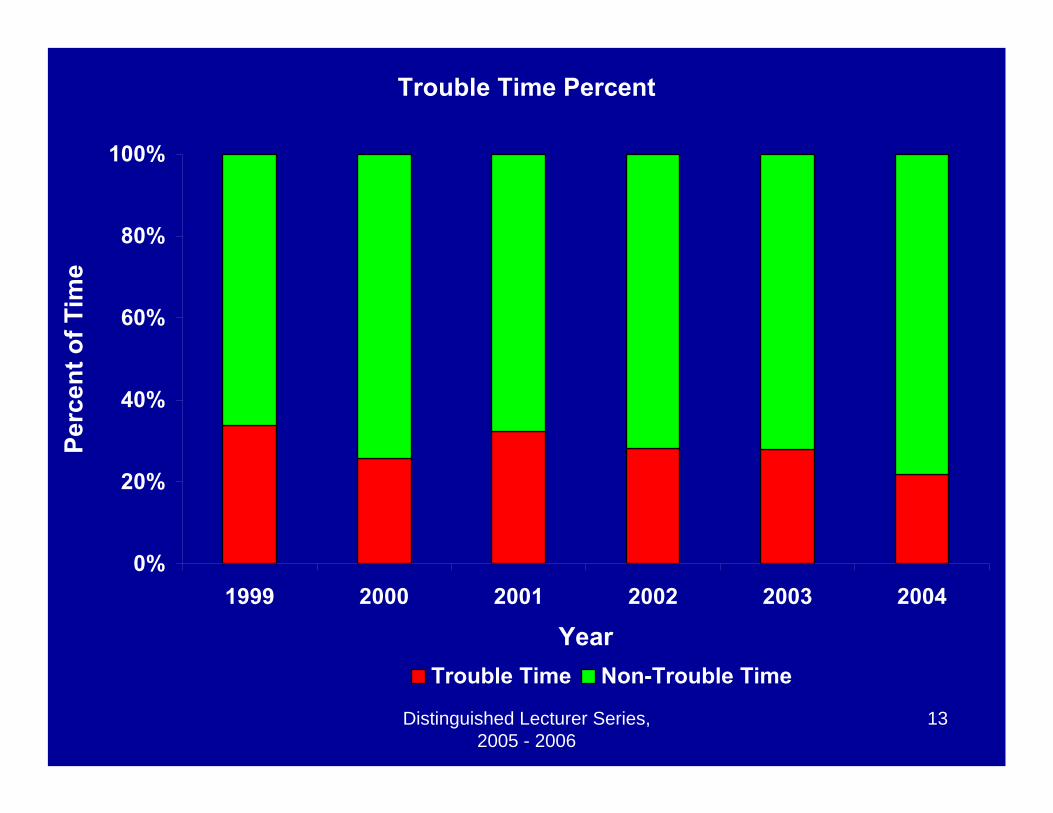
Trouble Time Percent
0%
20%
40%
60%
80%
100%
1999 2000 2001 2002 2003 2004
Year
Perc
ent o
f Tim
e
Trouble Time Non-Trouble Time

Distinguished Lecturer Series, 2005 - 2006
14
Trouble Time Analysis Lessons Learned
• Drilled too far, took kick• Weak formation or close tolerance to
frac gradient• Lost circulation• Tight hole/packing-off• Casing/cementing problems

Distinguished Lecturer Series, 2005 - 2006
15
Lessons Learned Number One
“Enemy of Good is Perfect”
• Don’t “push” casing points• Casing point selection & pore
pressure interpretation is critical• Add 1 or 2 contingency strings• Once wellbore starts losing mud, set
pipe.

Distinguished Lecturer Series, 2005 - 2006
16
AnadarkoWells Max Depth
0
5,000
10,000
15,000
20,000
25,000
30,000
35,000
1993 1994 1995 1996 1997 1998 1999 2000 2001 2002 2003 2004
Year
Dep
th (f
t)

Distinguished Lecturer Series, 2005 - 2006
17
CONTINUOUS DRILLING
IMPROVEMENT …
BEST COMPOSITE COST-BCC BEST COMPOSITE TIME-BCT (Combined best cost & time from existing wells in a field)

Distinguished Lecturer Series, 2005 - 2006
18
GOM Wells 3&45.0Circ.& Cmt. Casing GOM Wells 1,3,616.5Run 13-3/8" Casing GOM Well 56Trip out of HoleGOM Well 40.5Rig ServiceGOM Wells 1&20Short Trip GOM Well 27.5Circ/Condition Mud GOM Well 343Drilling Ahead GOM Wells 5&61Leak off TestGOM Well 42.5
Drill out Shoe/Cement
GOM Wells 2&55.5Make Up BHA & TIH
FROM WELL(S)BestHrs.
EXAMPLE BCT ACTIVITIES
17" HOLE SECTION

Distinguished Lecturer Series, 2005 - 2006
19
Deepwater Well Times,18-23 days with the BCT (pink curve ~15 days)
0
2,500
5,000
7,500
10,000
12,500
15,0000 5 10 15 20
Time (day)
Mea
sure
d D
epth
(ft)
Best no TroubleInput Data
Time vs Depth

Distinguished Lecturer Series, 2005 - 2006
20
Deepwater Drilling Costs with BCC -Uppermost (Pink) Curve
(12,000,000)
(10,000,000)
(8,000,000)
(6,000,000)
(4,000,000)
(2,000,000)
0
PHASE SEQUENCE
CU
MM
ULA
TIVE
WEL
L C
OST
PreSpud Conductor 26" Phase 17.5" Phase 12.25" Post-TD

Distinguished Lecturer Series, 2005 - 2006
21
The Drilling Learning Curve
Well Sequence Number
Tim
e
1 2 3 4
Learning Potential
(C1)
Learning Rate (C2)
Operational Limit (C3)

Distinguished Lecturer Series, 2005 - 2006
22
Learning Curve Analysis
tn = C3 + C1*exp [(1-n)C2]; ……… (Eq.1)tn is time to drill the nth well; C1, C2, C3are defined in the literature as the learning potential, learning rate & operational limit.
BCT (~15 days) < C3 (~20 days); C2 from 0.4 to 0.8 shows “good performance” and C2 > 0.8 indicates excellent performance;
Note: C2=0.7 results in 50% C1 in 2nd well.

Distinguished Lecturer Series, 2005 - 2006
23
Lessons Learned Number Two
“Measure twice, cut once”
• Review all available data• Seek best performance in all phases
of operations• Repeat things that work well

Distinguished Lecturer Series, 2005 - 2006
24
Cajun Express

Distinguished Lecturer Series, 2005 - 2006
25
Deepwater Drilling Economics -Improved C1 Level $5.96MM
0 .0
5 .0
1 0 .0
1 5 .0
2 0 .0
2 5 .0
3 0 .0
3 5 .0
4 0 .0
W e ll # 1 W e ll # 2 W e ll # 3 W e ll # 4 W e ll # 5 W e ll # 6
Day
s (N
orm
. foo
tage
= 7
957.
3 ft)
DrillingCas ingB O PTroubleR ig P osE valuat ionP os t D rill
3 4 .49
2 4 .6 12 4 .99
2 8 .77
2 1 .852 5 .43

Distinguished Lecturer Series, 2005 - 2006
26
Lessons & Solutions from ~4000 ft WD to Ultra-deepwater, 9000 ft WD
0.0
5.0
10.0
15.0
20.0
25.0
30.0
35.0
40.0
W ell#1
W ell#2
W ell#3
W ell#4
W ell#5
W ell#6
W ell#7
W ell#8
W ell#9
Day
s (N
orm
. foo
tage
= 8
541.
5 ft)
DrillingCasingBOPTroubleRig PosEvaluationPost Drill
37.02
30.89
35.17
31.49
26.42 26.8223.45
27.328.36
Wells 1-6; Deepwater; 4,000' ft WD Ultra deepwater; 9,000' ft WD

Distinguished Lecturer Series, 2005 - 2006
27
Millennium

Distinguished Lecturer Series, 2005 - 2006
28
ULTRA-DEEPWATER LEARNING;Curves Separated by Drlg. Operation
14.2
11.83 10.45
7.01
5.6 4.77
4.79
0.79
2.16
6.58 5.75
7.96
0
2
4
6
8
10
12
14
16
Atwater Valley349 #1
Lloyd Ridge360 #1
Lloyd Ridge 50#1
Day
s (N
orm
. foo
tage
= 9
902.
5 ft)
DrillingCasingEvaluationTrouble

Distinguished Lecturer Series, 2005 - 2006
29
Subsalt S. Timbalier; AFE estimate forWell #3 based on previous performance
0
30
60
90
120
150
180
South
Timbalier
308 #1
South
Timbalier
308 #2S
T1
South
Timbalier
308 #3
South
Timbalier
308 #3(P
lanned)
South
Timbalier
308 #4
5 da
ys (N
orm
foot
abe
= 90
18.4
ft)
Drilling
Casing
Evaluation
Trouble
Rig Pos
BOP
Post-Drill
164.95
121.04
70.76
102.43
60.26

Distinguished Lecturer Series, 2005 - 2006
30
S. Timbalier Learning Analysis; C2 = 0.8 Excellent Learning
0
30
60
90
120
150
180
South
Timbalier
308 #1
South
Timbalier
308 #2S
T1
South
Timbalier
308 #3
South
Timbalier
308 #4
Day
s (N
orm
foot
abe
= 18
590.
1 ft)
Drilling
Casing
Evaluation
Trouble
Rig Pos
BOP
Post-Drill
163.89
119.75
70.74
62.77

Distinguished Lecturer Series, 2005 - 2006
31
Top Five Time & Money Savers
1. Marker beads on surface casing cementing
2. BOP test against 20” & 13-5/8”casing
3. Bit run retrievable wear bushing4. Use cement stinger on 9-5/8”
production to set TA plugs5. Utilize same rig & crew on
consecutive wells
Distinguished Lecturer Series, 2005 - 2006
32
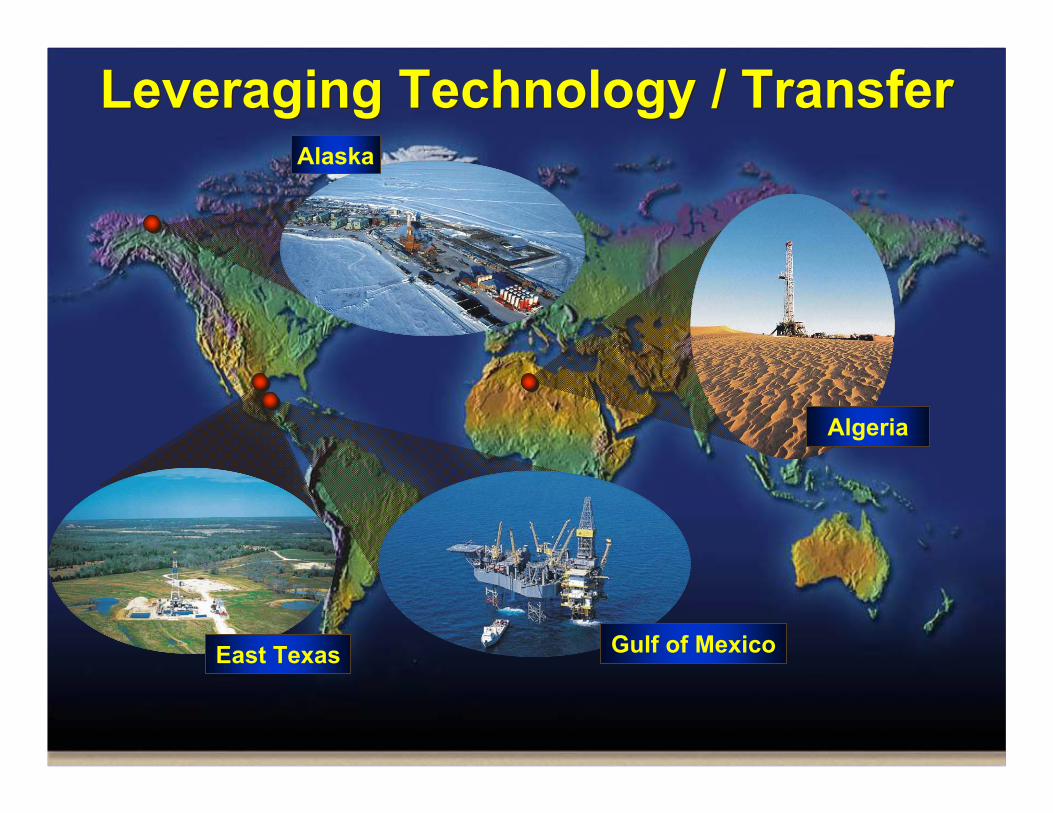
Algeria
East Texas Gulf of Mexico
Leveraging Technology / Transfer Leveraging Technology / Transfer Alaska
Distinguished Lecturer Series, 2005 - 2006
33
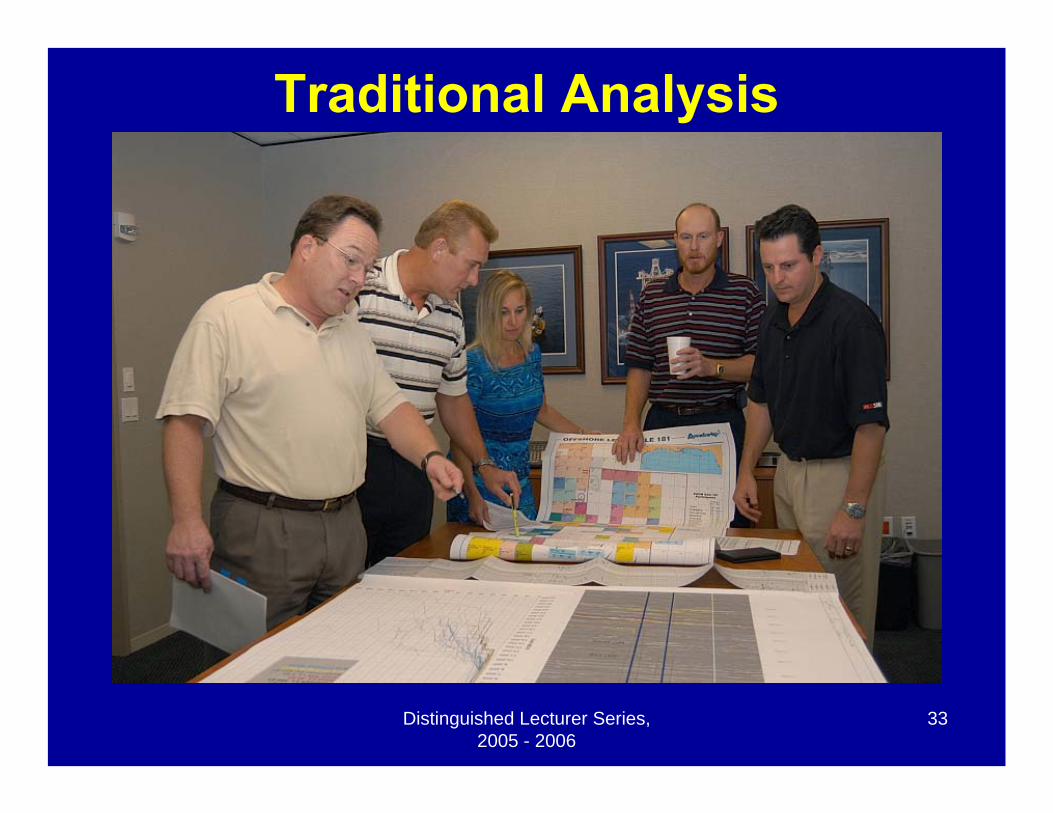
Traditional Analysis

Distinguished Lecturer Series, 2005 - 2006
34
The Future

Distinguished Lecturer Series, 2005 - 2006
35
Summary and Conclusions• There are computer-assisted tools available
for drilling data analysis• Proper utilization can set new benchmarks
for drilling performance• Facilitate lessons learned, problem
identification and areas for improvement• Requires technical skills to interpret and
utilize the data• Senior management support is essential.

Distinguished Lecturer Series, 2005 - 2006
36
SPE DISTINGUISHED LECTURER SERIESis funded principally
through a grant of the
SPE FOUNDATIONThe Society gratefully acknowledges
those companies that support the programby allowing their professionals
to participate as Lecturers.
And special thanks to The American Institute of Mining, Metallurgical,and Petroleum Engineers (AIME) for their contribution to the program.