mekanika tanah atterberg limits laporan praktikum
DESCRIPTION
laporan mekanika tanah dasarTRANSCRIPT
BASIC SOIL MECHANICS PRACTICAL REPORT
MODULE 1
ATTERBERG LIMITS
GROUP PI 1
Asti Diar Syafitri 1206292414
Christopher Kevinly 1206223846
Wednesson Lawijaya 1206230593
Date of Practicum : 4th of March 2013
Laboratory Assistant : Rachma Yuliana
Date Approved :
Grade :
Assistant’s Signature :
Laboratory of Soil Mechanics
Department of Civil Engineering
Faculty of Engineering
University of Indonesia
Depok
2013
University of Indonesia
A. Liquid Limit
A.1. Introduction
A.1.1. Objective
To determine the water content of the liquid limit of the soil sample.
A.1.2. Apparatus
Cassagrande device
Standard Grooving tool
Can
Spatula
Ceramics bowl
Soil sample (passing no. 40 ASTM sieve)
Pure water
Oven
Scale with an accuracy of 0.01 gram
Blower bottle
A.1.3. Theorem and Formula Which is Used
In terms of laboratory testing, liquid limit is defined as the water
content of which the soil sample which has been set in the cassagrande
device and grooved in its center by using standard grooving tool, then the
cassagrande device rolls in a rate of two knocks per second with a falling
height of 10mm, so at the 25th knock the scratch on soil sample will close
by 0.5 inch.
In the water content experiment, we will get the value of water
content in a specific condition. Besides, for the next experiments the soil
will be tested in three phases to determine the liquid limit, plastic limit and
the shrinkage limit of the soil sample, or can be expressed schematically
with the following model:
Liquid Plastic Semi Plastic Solid
Liquid limit Plastic limit Shrinkage limit
1 | A t t e r b e r g L i m i t s
University of Indonesia
In the diagram, the water content is higher in the left side and
lower in the right side. This liquid limit is determined by doing experiment
using the liquid limit device. This device was developed by Cassagrande
and the value of the liquid limit can be determined by the 25th knock
W =w1−w2
w2−w3
× 100 %
Where:
W = water content
W1 = weight of Wet soil sample + can
W2 = weight of Dry soil sample + can
W3 = weight of can
A.2. Practical Activity
A.2.1. Experiment Preparation
1. Prepare the soil which passed the sieve no.40 ASTM, air dried
2. Ensure the apparatus cleanness
3. Calibrate the scale which is used
4. Prepare the water blower bottle
5. Prepare and dry the can which is used
A.2.2. Experiment
1. Insert the soil sample into the bowl, then mix it with water and stir
with spatula until the sample is homogenous
2. Insert the soil sample into the cassagrande device layer by layer and try
to ensure that no air bubbles is trapped inside the sample in each layer.
The insertion is done by using spatula and the thickness of the sample
is 0.5 inch in the center.
3. Create a pit in the middle of the sample inside the cassagrande bowl
using the grooving tool. Ensure that the grooving tool is perpendicular
with the bowl. Do this carefully so that no cracking will happen in its
middle.
2 | A t t e r b e r g L i m i t s
University of Indonesia
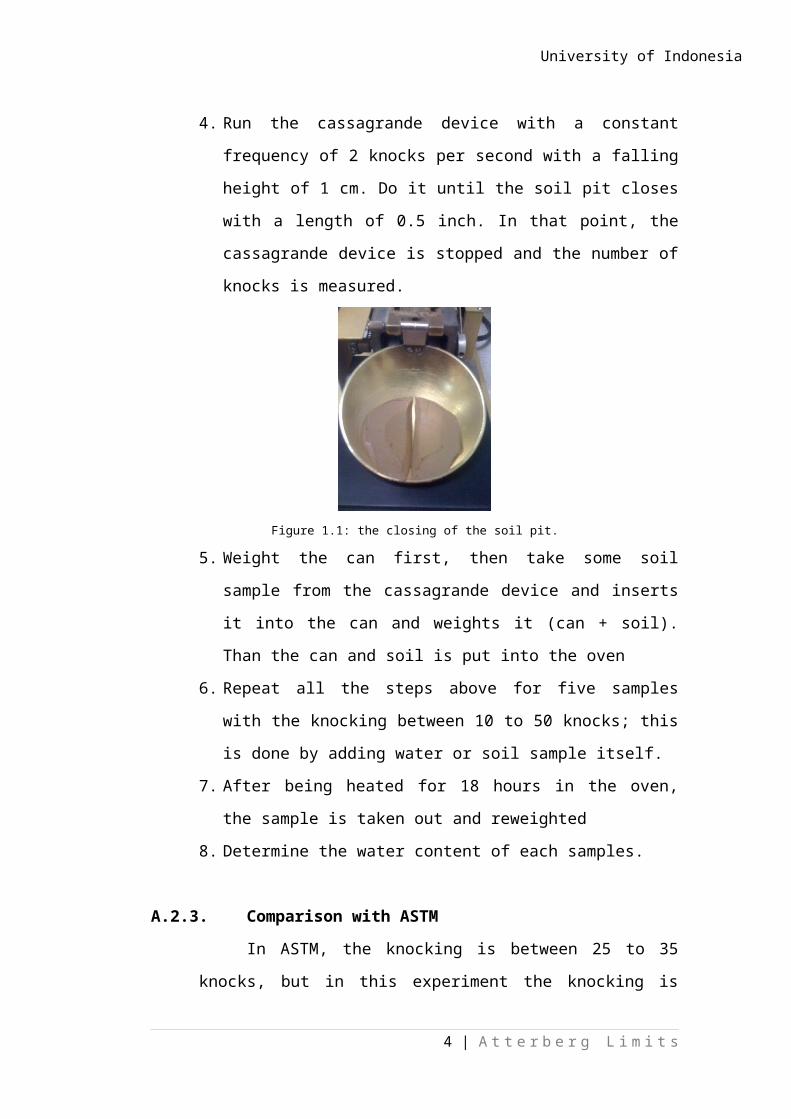
4. Run the cassagrande device with a constant frequency of 2 knocks per
second with a falling height of 1 cm. Do it until the soil pit closes with
a length of 0.5 inch. In that point, the cassagrande device is stopped
and the number of knocks is measured.
Figure 1.1: the closing of the soil pit.
5. Weight the can first, then take some soil sample from the cassagrande
device and inserts it into the can and weights it (can + soil). Than the
can and soil is put into the oven
6. Repeat all the steps above for five samples with the knocking between
10 to 50 knocks; this is done by adding water or soil sample itself.
7. After being heated for 18 hours in the oven, the sample is taken out
and reweighted
8. Determine the water content of each samples.
A.2.3. Comparison with ASTM
In ASTM, the knocking is between 25 to 35 knocks, but in this
experiment the knocking is between 10 to 50 knocks until the soil pit
closes by 0.5 inch.
3 | A t t e r b e r g L i m i t s
University of Indonesia
A.3. Experiment Result
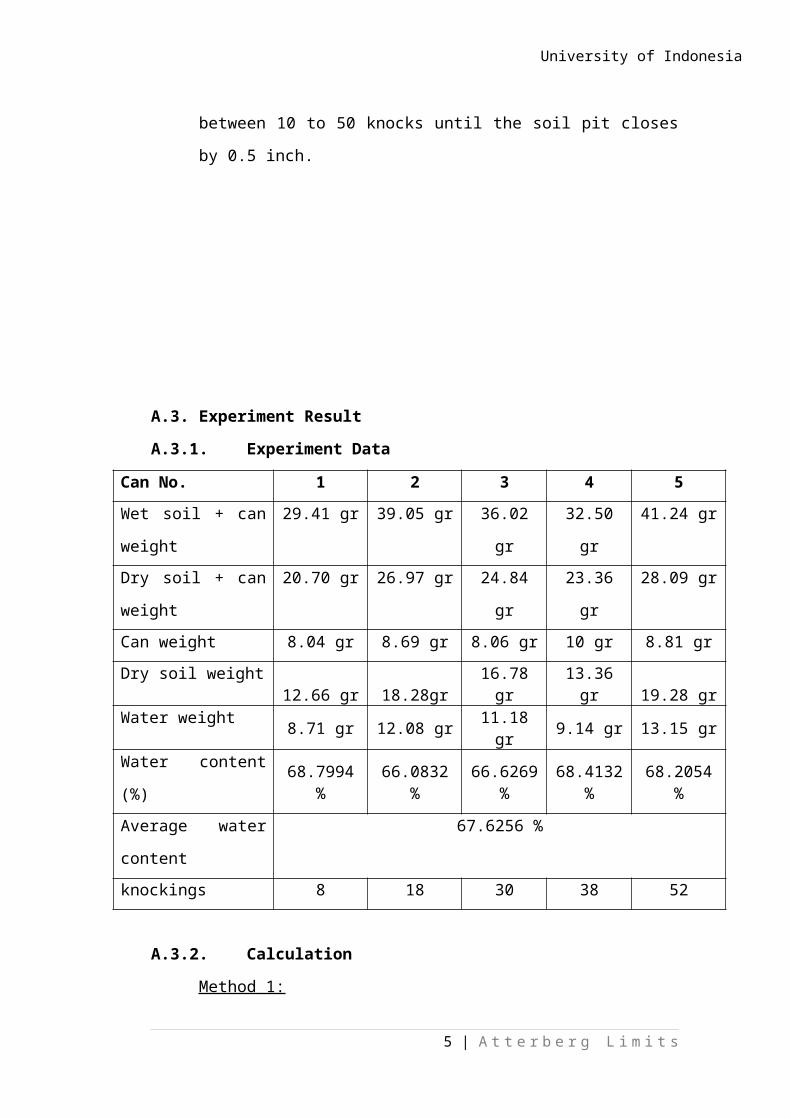
A.3.1. Experiment Data
Can No. 1 2 3 4 5
Wet soil + can weight 29.41 gr 39.05 gr 36.02 gr 32.50 gr 41.24 gr
Dry soil + can weight 20.70 gr 26.97 gr 24.84 gr 23.36 gr 28.09 gr
Can weight 8.04 gr 8.69 gr 8.06 gr 10 gr 8.81 gr
Dry soil weight 12.66 gr 18.28gr 16.78 gr 13.36 gr 19.28 grWater weight 8.71 gr 12.08 gr 11.18 gr 9.14 gr 13.15 gr
Water content (%) 68.7994 % 66.0832 % 66.6269 % 68.4132 % 68.2054 %
Average water content 67.6256 %
knockings 8 18 30 38 52
A.3.2. Calculation
Method 1:
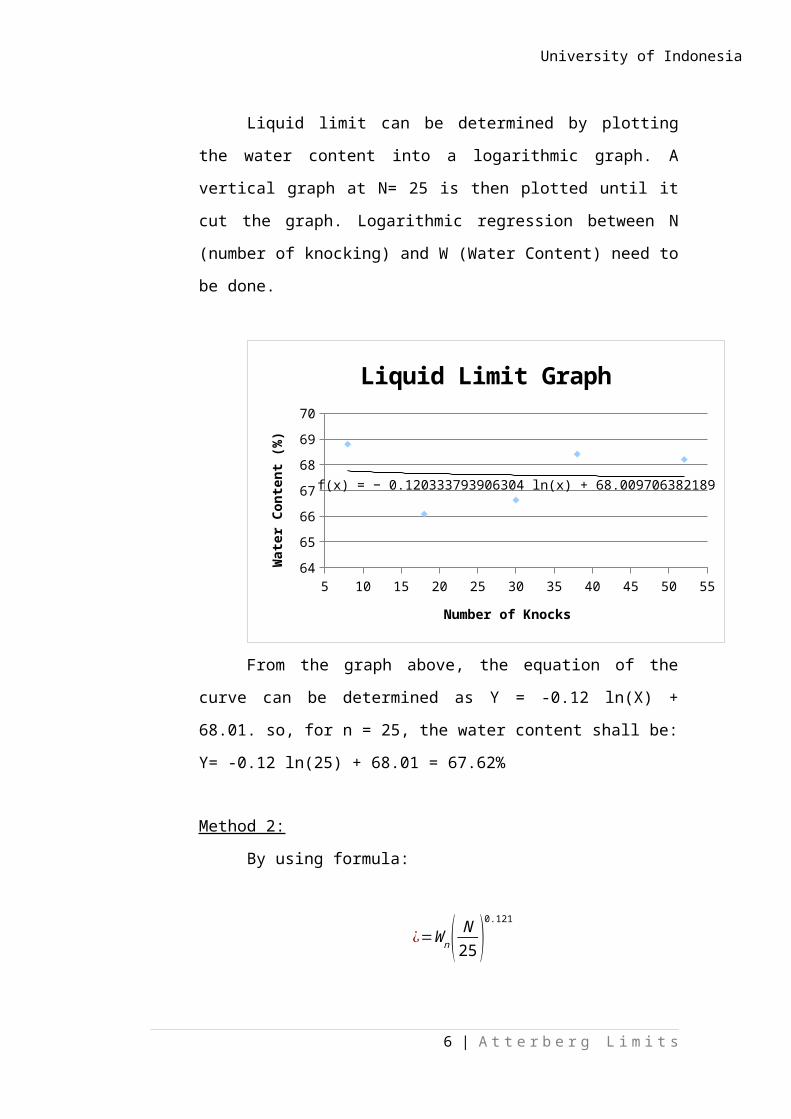
Liquid limit can be determined by plotting the water content into a
logarithmic graph. A vertical graph at N= 25 is then plotted until it cut the
graph. Logarithmic regression between N (number of knocking) and W
(Water Content) need to be done.
5 10 15 20 25 30 35 40 45 50 5564.5
6565.5
6666.5
6767.5
6868.5
6969.5
f(x) = − 0.120333793906304 ln(x) + 68.009706382189
Liquid Limit Graph
Number of Knocks
Wat
er C
onte
nt (%
)
4 | A t t e r b e r g L i m i t s
University of Indonesia
From the graph above, the equation of the curve can be determined
as Y = -0.12 ln(X) + 68.01. so, for n = 25, the water content shall be:
Y= -0.12 ln(25) + 68.01 = 67.62%
Method 2:
By using formula:
¿=W n( N25 )
0.121
LL = Liquid Limit
Wn = Water content at nth knock
N = the number of knocking
Can no.
knocking Wn (%) LL (%)
1 8 68.7994
59.9387
2 18 66.0832
63.5079
3 30 66.6269
68.1131
4 38 68.4132
71.9686
5 52 68.2054
74.5254
LL (%) average 67.6108
Relative Error¿|¿ Method 1−¿ method2¿ Melthod1 |×100 %
¿|67.62−67.6167.61 |×100 %
= 0.015%
5 | A t t e r b e r g L i m i t s
University of Indonesia
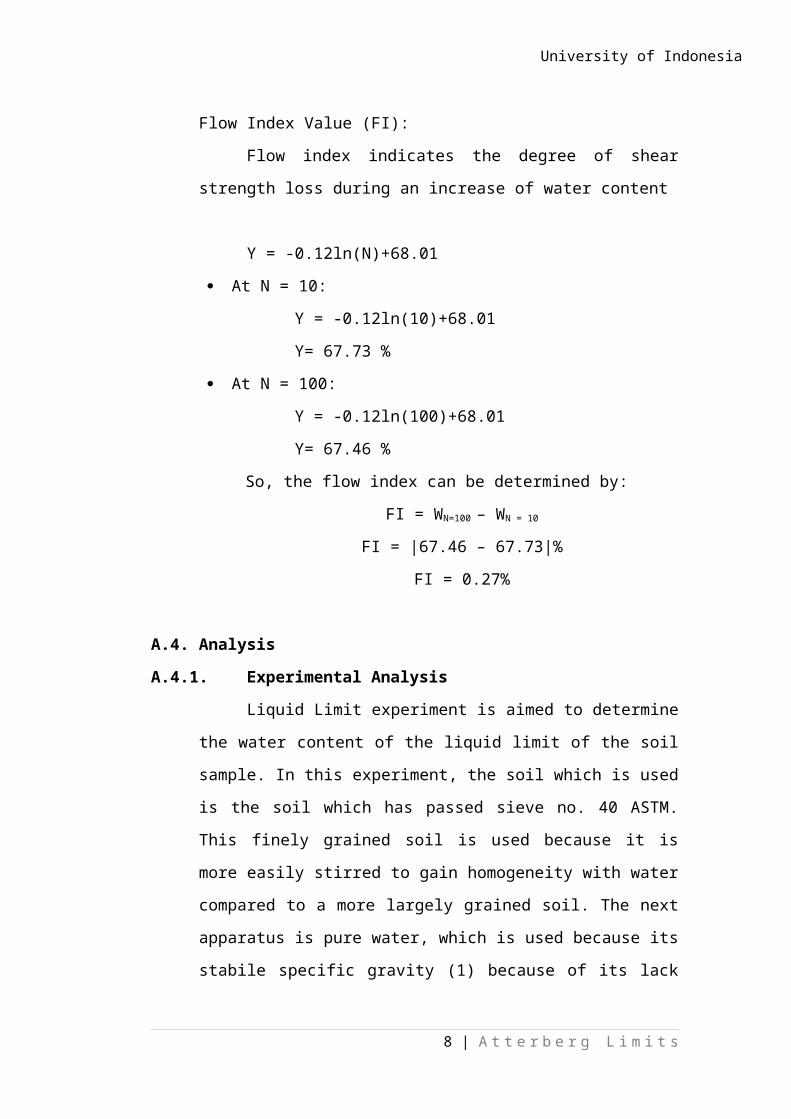
Flow Index Value (FI):
Flow index indicates the degree of shear strength loss during an
increase of water content
Y = -0.12ln(N)+68.01
At N = 10:
Y = -0.12ln(10)+68.01
Y= 67.73 %
At N = 100:
Y = -0.12ln(100)+68.01
Y= 67.46 %
So, the flow index can be determined by:
FI = WN=100 – WN = 10
FI = |67.46 – 67.73|%
FI = 0.27%
A.4. Analysis
A.4.1. Experimental Analysis
Liquid Limit experiment is aimed to determine the water content of
the liquid limit of the soil sample. In this experiment, the soil which is
used is the soil which has passed sieve no. 40 ASTM. This finely grained
soil is used because it is more easily stirred to gain homogeneity with
water compared to a more largely grained soil. The next apparatus is pure
water, which is used because its stabile specific gravity (1) because of its
lack of mineral contains. Spatula is used to stir the sample and insert it to
the cassagrande bowl, Can is used to vessel the soil sample while its being
stirred, cassagrande is used to knock the soil and the grooving tool is used
to groove the soil to create a pit where the soil closes.
6 | A t t e r b e r g L i m i t s
University of Indonesia
The first step of the experiment is mixing a part of the soil sample
with water and mixes it to homogeneity. Homogeneity has to be archived
because only a very homogenous soil will exactly reflect the behavior of
the soil sample with the specified water content. After the soil has been
homogenous, it is inserted into the cassagrande bowl. There must be no air
content inside the soil sample in the bowl because the air will influence the
rate of closing of the soil sample. 2 knocks per second and 10 mm height
of fall have been determined by the ASTM, and 10 until 50 knocks are set
so a good logarithmic graph can be obtained.
After the soil has fulfilled a certain knocks, it is heated in the oven
in order to flush the water out, so no saturation condition can be archived
to measure how much the solid particles weighted. Note that the porcelain
bowl which is used as the soil’s vessel while in oven has to be weighted.
A.4.2. Result Analysis
In the liquid limit experiment, some data are gained such as: can
weight, wet soil + can weight, and the dry soil + can weight. In order to
process these data, there are 2 methods which are able to be used to
measure the water content at the liquid limit. Then the result from both
methods can be compared to gain the relative error of the experiment.
The first method is using liquid limit graphs, which uses the
logarithmic regression which the x axis represents number of blows and
the y axis represents water content in percent. After the data is plotted, the
line equation which is gained is Y = -0.12ln(10)+68.01. Note that the data
which is gained is a bit scattered due to errors during the experiment. In
order to get the value of liquid limit, the x is set to 25, so x = 25 is inserted
into the equation. This yields to a value of LL = 67.62%. The logarithmic
regression line which has been plotted shows that the number of blows
drops logarithmically in respect to the increase of water content.
The second method is done by using a certain formula
¿=W n( N25 )
0.121
in order to determine the liquid limit from each water
7 | A t t e r b e r g L i m i t s
University of Indonesia
contents. From the calculation using the formula stated, the value of the
LL are scattered because of the low flow index. By averaging the data, the
liquid limit which is gained was LL = 67.61%
By comparing both results from two different methods, the relative
error which was gained was 0.015%, which indicates a low error. The LL
which was gained was LL = 67.615%, which indicates the soil is subject to
deformation and settlement because any soil which has LL > 50% has
highly compressible property, which means the soil requires less
compactive effort to compact. The calculation also reveals that the flow
index of this soil sample is 0.27%. Flow index indicates the degree of
shear strength loss during an increase of water content.
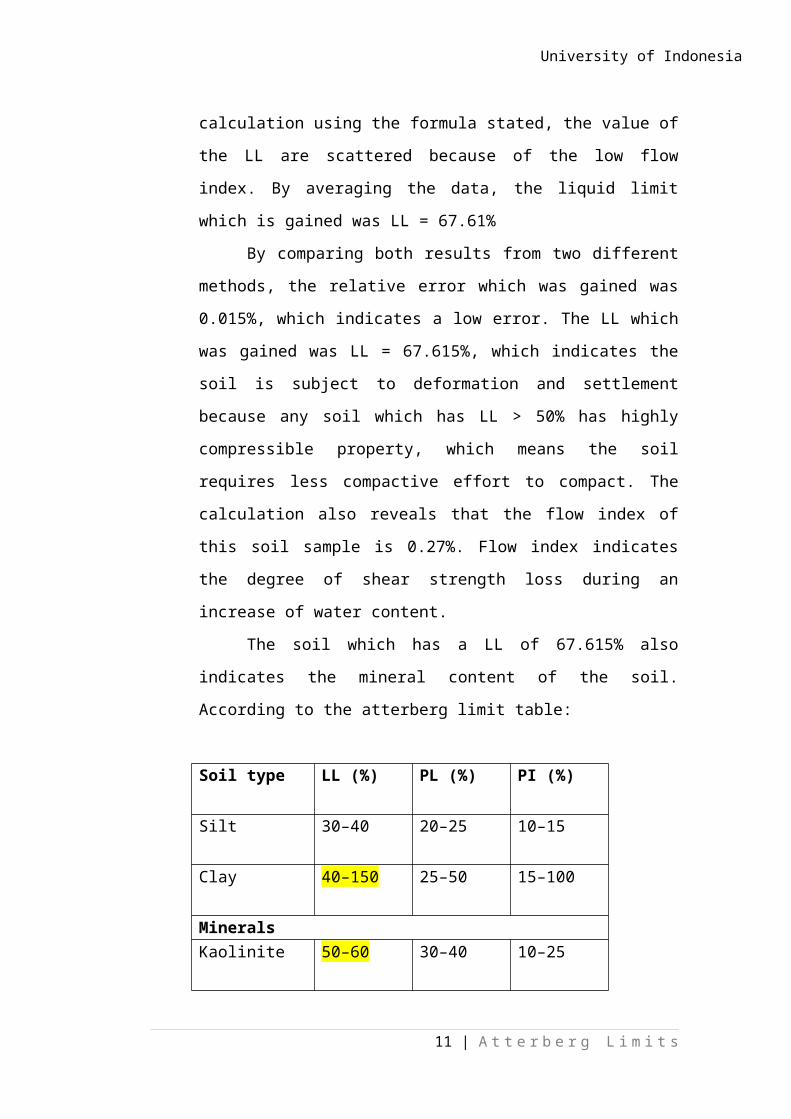
The soil which has a LL of 67.615% also indicates the mineral
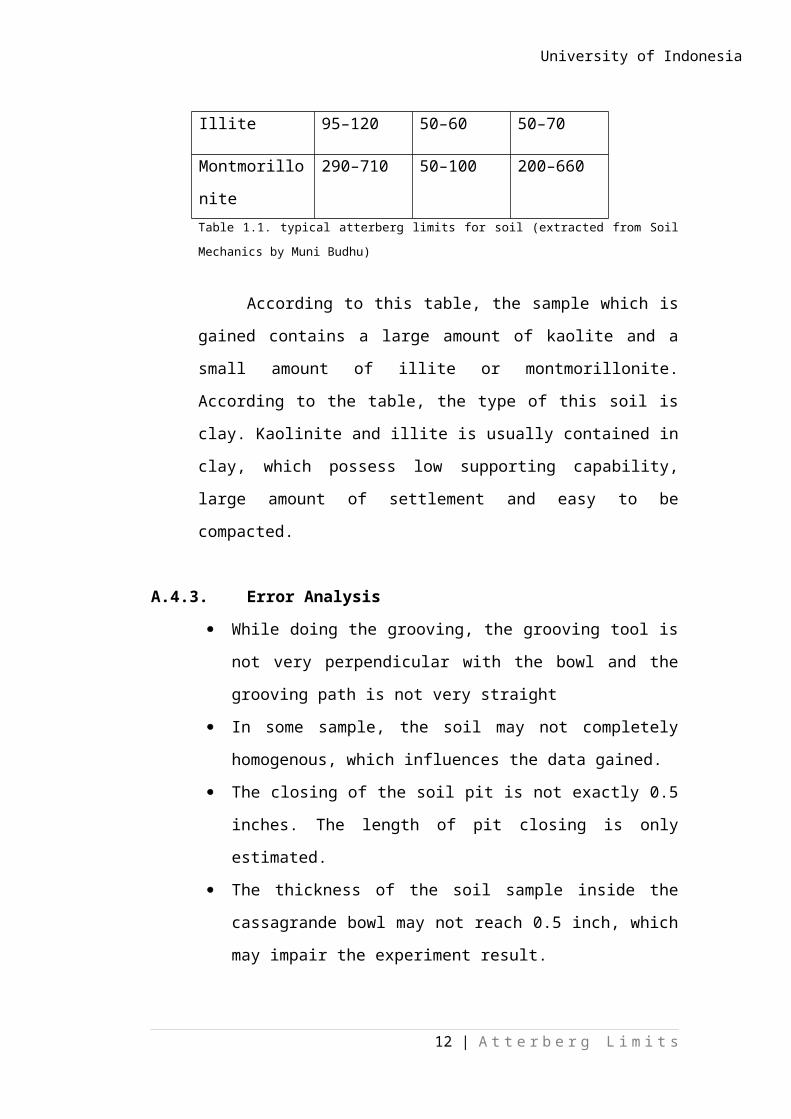
content of the soil. According to the atterberg limit table:
Soil type LL (%) PL (%) PI (%)
Silt 30–40 20–25 10–15
Clay 40–150 25–50 15–100
Minerals
Kaolinite 50–60 30–40 10–25
Illite 95–120 50–60 50–70
Montmorillon
ite
290–710 50–100 200–660
Table 1.1. typical atterberg limits for soil (extracted from Soil Mechanics by Muni Budhu)
According to this table, the sample which is gained contains a large
amount of kaolite and a small amount of illite or montmorillonite.
According to the table, the type of this soil is clay. Kaolinite and illite is
usually contained in clay, which possess low supporting capability, large
amount of settlement and easy to be compacted.
8 | A t t e r b e r g L i m i t s
University of Indonesia
A.4.3. Error Analysis
While doing the grooving, the grooving tool is not very perpendicular
with the bowl and the grooving path is not very straight
In some sample, the soil may not completely homogenous, which
influences the data gained.
The closing of the soil pit is not exactly 0.5 inches. The length of pit
closing is only estimated.
The thickness of the soil sample inside the cassagrande bowl may not
reach 0.5 inch, which may impair the experiment result.
A.5. Conclusion
The value of liquid limit is 67.62% through first method, and 67.61%
through second method
The flow index which is gained was 0.27%
The relative error which is gained was 0.015%
The soil which is tested is clay which contains mostly kaolinite and
illite.
The soil which is tested is highly compressible.
9 | A t t e r b e r g L i m i t s
University of Indonesia
B. Plastic Limit
B.1. Introduction
B.1.1. Objective
To determine the water content of the plastic limit of the soil sample
B.1.2. Apparatus
Glass Plate
Container
Soil sample which passed sieve no. 40 ASTM
Spatula
Porcelain bowl
Pure water
Oven
Scale with an accuracy of 0.01 gram
B.1.3. Theorem and Formula Used
In terms of laboratory testing, plastic limit is defined as the water
content of when the soil sample is rolled on the glass plate until its
diameter is 1/8 inch (3.2 mm) and the soil is exactly having fine cracks. In
this experiment, Plasticity index can be determined where:
I p=¿−PL
The water content in the real situation is usually lies between the
plastic limit and the liquid limit. The formula which is used to determine
the water content is the same as used before:
10 | A t t e r b e r g L i m i t s
University of Indonesia
W =w1−w2
w2−w3
× 100 %
Where:
W = water content
W1 = weight of Wet soil sample + container
W2 = weight of Dry soil sample + container
W3 = weight of container
B.2. Practical Activity
B.2.1. Experiment Preparation
1. Prepare the apparatus which are wanted to be used
2. Prepare the blower bottle and the pure water
3. Prepare the soil sample (Passing sieve no.40 ASTM)
4. Weight the containers
B.2.2. Experiment
1. Insert the soil sample into the porcelain bowl and then mix it with pure
water and then stir the sample with spatula until it is homogenous.
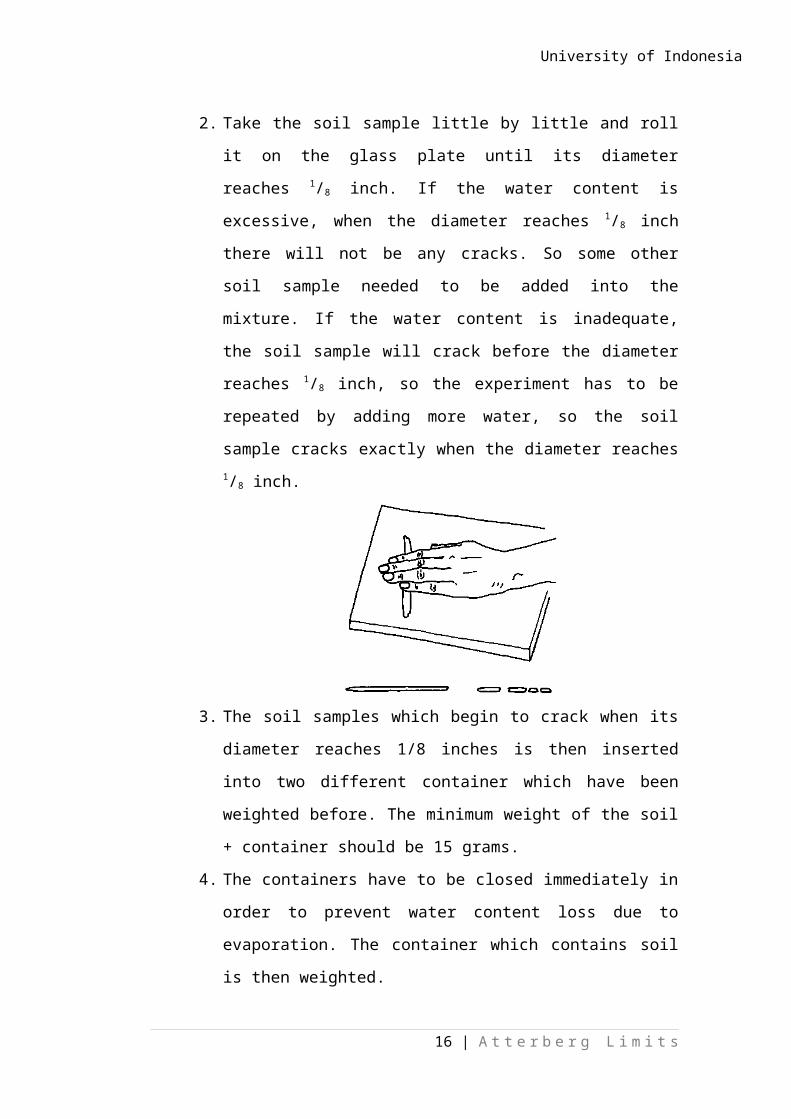
2. Take the soil sample little by little and roll it on the glass plate until its
diameter reaches 1/8 inch. If the water content is excessive, when the
diameter reaches 1/8 inch there will not be any cracks. So some other
soil sample needed to be added into the mixture. If the water content is
inadequate, the soil sample will crack before the diameter reaches 1/8
inch, so the experiment has to be repeated by adding more water, so
the soil sample cracks exactly when the diameter reaches 1/8 inch.
11 | A t t e r b e r g L i m i t s
University of Indonesia
3. The soil samples which begin to crack when its diameter reaches 1/8
inches is then inserted into two different container which have been
weighted before. The minimum weight of the soil + container should
be 15 grams.
4. The containers have to be closed immediately in order to prevent water
content loss due to evaporation. The container which contains soil is
then weighted.
5. Insert the container without the caps into the oven for 18 hours.
6. After the soil samples have been heated inside the oven for
approximately 18 hours, the containers and the containing samples are
weighted in order to find out its water content. When calculating the
water content, do not forget to add the weight of the container’s cap so
the weight of the total container is the same as its before when the wet
soil sample was weighted.
B.2.3. Comparison with ASTM
During the experiment, the rolling time of the soil is not specifically
determined. While in ASTM, the rolling time must not exceed 2 minutes.
During the experiment, after the soil is rolled and cracks, so the soil is
inserted into the container. While in ASTM, the soil which has been rolled
will be crushed once more and rolled more, until the soil is difficult to be
rolled again.
B.3. Practical Result
B.3.1. Experiment Data and Calculation
Can No. 1 2Wet soil + can
weight26.19 34.3
Dry soil + can weight 20.81 28.86Can weight 9.4 14.85
Dry soil weight 11.41 14.01Water weight 5.38 5.44
Water content (%) 47.15% 38.83%Average water
content42.99%
12 | A t t e r b e r g L i m i t s
University of Indonesia
Plasticity Index (Ip) = LL – PL
= 67.615% - 42.99%
= 24.625%
B.4.Practical Analysis
B.4.1. Experimental Analysis
Plastic Limit laboratory testing is an experiment which is aimed to
determine the water content of soil in its plastic limit. The soil which is
used is the fine graded soil particles which have passed through sieve no.
40 ASTM. Finely graded soil particle is used because it is easier to archive
homogeneity due to its large cross sectional area. The other apparatus
needed are pure water, which is used due to its neutrality and its lack of
any minerals which make the testing more accurate. Spatula for stirring the
sample to homogeneity can as its container and glass plate where the soil
is rolled. Glass is chosen because its smooth surface and glass is not
permeable, so the water content will not escape during the rolling process.
The first step which is done is to insert the soil sample with an
amount of pure water inside the can, then mix it to reach homogeneity.
The phase which is wanted to be archived is that a condition where the soil
sample is not too liquid or too dry, so it is able to be rolled. After the soil
sample has been mixed, the soil sample is then rolled on the glass plate.
The value of 1/8 inch is gained from ASTM standard. Note that which
cause the fine cracking of the soil is the inability of the water to bind the
soil particle together.
The rolling process is carried on until the weight of the can plus the
container exceeds 15 grams. 15 grams is set in order to reach a good
accuracy, since if the soil + container’s weight are below 15 grams, the
container’s weight will be more dominant and the soil will hardly be read
in the scale, especially after the water content of the soil has been removed
through heating. The next step is heating the soil sample in the oven, in
order to flush the water content out, so the weight of the solid particle of
the soil can be determined.
13 | A t t e r b e r g L i m i t s
University of Indonesia
B.4.2. Result Analysis
In this experiment, there are two data which is gained: the weight
of the wet soil + can and the weight of the dry soil + can. From these data,
the weight of the moisture and the solid particle of the soil and the
moisture content can be determined. The weight of the moisture can be
gained by subtraction of the weight of the wet soil + can and the weight of
dry soil + can, and the water content can be determined by using the
formula:
W =w1−w2
w2−w3
× 100 %
` From the formula above, the water content of the first sample is
47.15% and the water content of the second sample is 38.83%, so the
average water sample is 42.99%. Then, after gaining these results,
plasticity index of the soil can be determined by subtracting the sample’s
liquid limit with its plastic limit, so the plasticity index of this sample is
24.625%.
Based on the liquid limit and the plasticity index which has been
gained, it is possible to determine the type of the soil sample which is
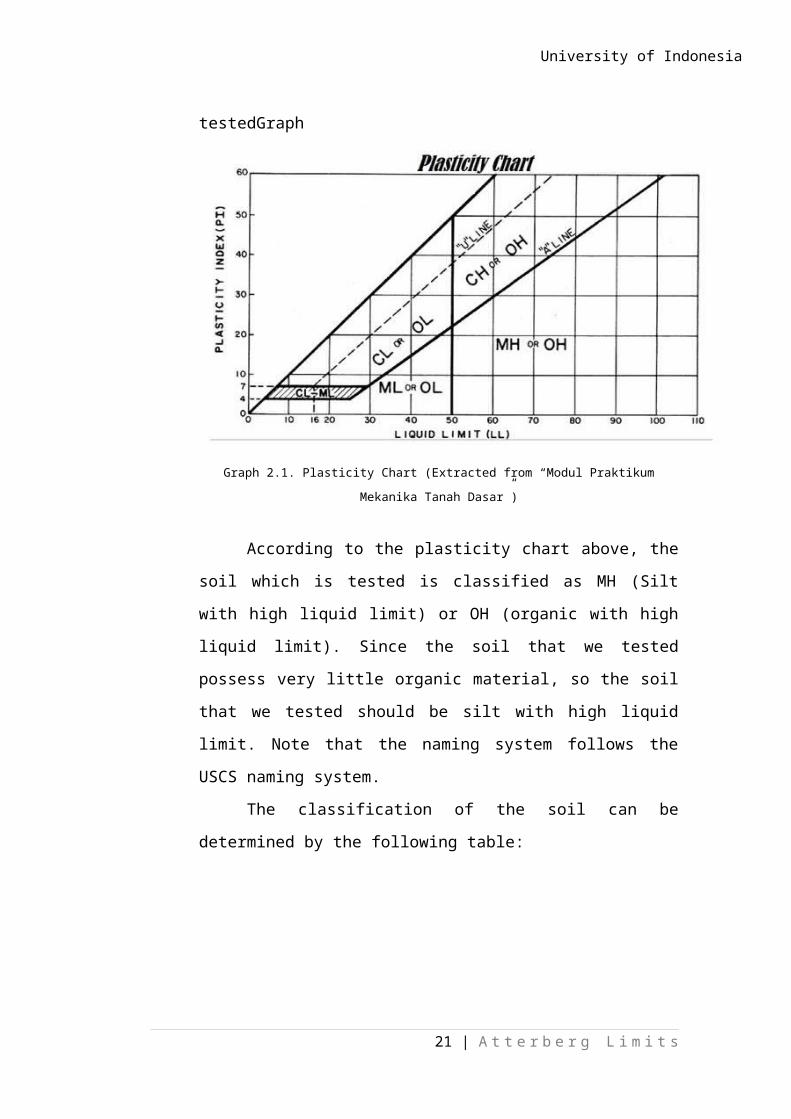
testedGraph
Graph 2.1. Plasticity Chart (Extracted from “Modul Praktikum Mekanika Tanah Dasar”)
14 | A t t e r b e r g L i m i t s
University of Indonesia
According to the plasticity chart above, the soil which is tested is
classified as MH (Silt with high liquid limit) or OH (organic with high
liquid limit). Since the soil that we tested possess very little organic
material, so the soil that we tested should be silt with high liquid limit.
Note that the naming system follows the USCS naming system.
The classification of the soil can be determined by the following
table:
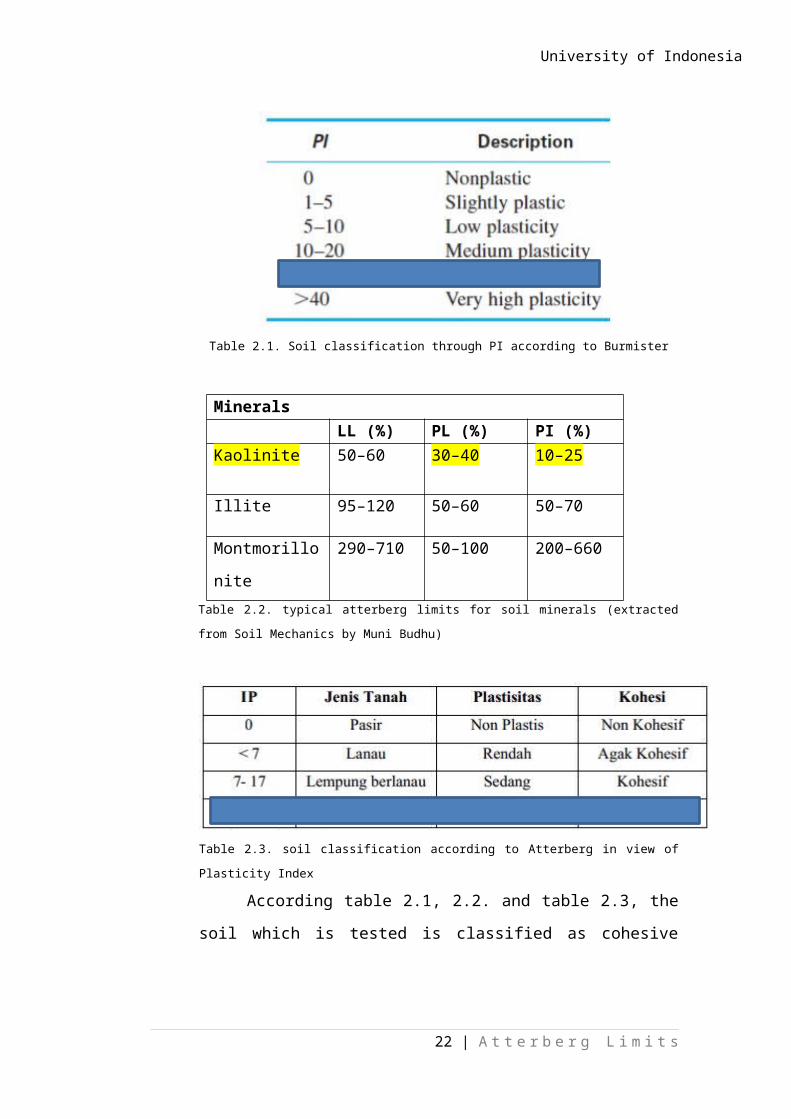
Table 2.1. Soil classification through PI according to Burmister
Minerals
LL (%) PL (%) PI (%)
Kaolinite 50–60 30–40 10–25
Illite 95–120 50–60 50–70
Montmorillon
ite
290–710 50–100 200–660
Table 2.2. typical atterberg limits for soil minerals (extracted from Soil Mechanics by Muni Budhu)
15 | A t t e r b e r g L i m i t s
University of Indonesia
Table 2.3. soil classification according to Atterberg in view of Plasticity Index
According table 2.1, 2.2. and table 2.3, the soil which is tested is
classified as cohesive high plasticity soil and contains mostly kaolinite.
B.4.3. Error Analysis
The soil sample which is tested may not totally homogenous since
the mixing process did not take a long time.
The measurement of 1/8 inch is only an approximation; the real
diameter value may not the same.
The cracking on the soil sample may be rash cracks, which
indicates that the water content of the soil sample may not
accurately reflects the plastic limit of the soil.
B.5. Conclusion
The soil which is tested possess a plastic limit of 42.99%
The soil which is tested possess a plasticity index of 24.625%
The soil which is tested is classified as cohesive high plasticity soil and
contains mostly kaolinite.
16 | A t t e r b e r g L i m i t s
University of Indonesia
C. Shrinkage Limit
C.1.Introduction
C.1.1. Objective
This experiment is conducted in order to determine the water
content of the soil sample in its shrinkage limit.
C.1.2. Apparatus
Mercury (Quicksilver)
Scale with an accuracy of 0.01 gram
Soil sample which passed sieve no. 40 ASTM, oven dried
Shrinkage dish
Coated dish
Cassagrande Device
Oven
C.1.3. Theorem and Formula Used:
In terms of laboratory testing, Shrinkage limit is the water content
where any reduction of water content will not cause a reduction of volume.
Shrinkage limit lies between solid phase and the semi-solid phase. In this
phase, the soil gets dry without any further volume reduction. Shrinkage
limit is shown by the water content in drying condition but it is not
followed by any volume reduction. The formula which is used in order to
find the shrinkage limit is as following:
SL=(W w−W d )−(V w−V d ) ρw
W d
× 100 %
SR=W d
V d
×100 %
17 | A t t e r b e r g L i m i t s
University of Indonesia
With:
SL = Shrinkage Limit
SR = Shrinkage Ratio
Ww = Weight of wet soil
Wd = Weight of dry soil
Vw = volume of wet soil
Vd = volume of dry soil
ρw = density of water = 1 gram/cm3
C.2. Practical Activity
C.2.1. Experiment Preparation
1. Prepare the soil sample that had passed sieve no. 40 ASTM, air dried
2. Weight the coated dish which will be used
3. Prepare the pure water and the blower bottle
C.2.2. Experiment Procedure
1. Insert the dry soil sample into a can, then mix it with pure water then
stir until the sample is homogenous.
2. The soil sample which has been homogenized is tested with
cassagrande device to obtain 20 – 25 knocks through the same method
which is used in liquid limit determination.
3. Take the soil sample from the cassagrande device to a coated dish
which has been coated with Vaseline. Knock the coated dish in order
to take out the air contained inside the soil sample. Ensure that the
surface of the coated dish is flat.
4. Weight the coated dish which contains the soil.
5. Do step 1-5 once again with another coated dish.
6. Leave the coated dish to dry in the open air for approximately 18
hours. This is done to prevent cracking due to sudden shrinkage.
7. After 18 hours, the soil sample in the coated dish is then inserted into
the oven for 18 to 24 hours.
18 | A t t e r b e r g L i m i t s
University of Indonesia
8. After 18 to 24 hours, the coated dish and the dried soil are weighted,
and then the volume of the wet soil and the dry soil is calculated.
a. To calculate the volume of wet soil:
i. Weight the coated dish (w1)
ii. Pour the mercury into the coated dish until the dish is
full, and then flatten it with the glass plate.
iii. Weight the coated dish containing the mercury (w2)
iv. The volume of wet soil sample is:
V w=W Hg
ρHg
=W 2−W 1
13.53
b. To calculate the volume of dry soil:
i. Insert mercury into the shrinkage dish, fulfill it, then
flatten it with glass plate.
ii. Weight the shrinkage dish and its content, the weight of
mercury and the shrinkage dish is obtained (wHg+S)
iii. Soak the dried soil sample into the shrinkage dish
containing mercury, and then press it carefully with the
glass plate. Ensure that the soil’s surface is the same
level with the mercury’s surface. This process is called
submerging soil cake.
iv. Removing the soil sample and reweight the shrinkage
dish and the containing mercury (wHg)
C.2.3. Comparison With ASTM
In this experiment, the coated dish which has been coated with
Vaseline and filled with soil is knocked in order to flush the air
bubbles out, while according to ASTM D-427, the coated dish is
only required to be shake.
In ASTM, the apparatus which is used to vessel the soil sample is a
porcelain bowl which poses a diameter of ±1.75 inch and a
diameter of ±0.5 inch, while in this experiment, coated dish is used.
19 | A t t e r b e r g L i m i t s
University of Indonesia
C.3.Practical Result
C.3.1. Experiment Data:
Can no. 1 2Weight of Wet soil + coated dish 58.93 gr 71.17 gr
Weight of coated dish 31.86 gr 46.00 grWeight of Wet soil 27.06 gr 25.17 gr
Weight of dry soil + coated dish 48.11 gr 60.13 grWeight of dry soil 16.25 gr 14.13 gr
weight of mercury + coated dish 260.06 gr 263.97 grweight of mercury 228.20 gr 217.97 grvolume of wet soil 16.87 ml 16.11 ml
Weight of mercury and shrinkage dish 759.47 gr 755.24 grWeight of mercury and shrinkage dish (after submerging soil cake) 620.55 gr 629.96 gr
weight of displaced mercury 138.92 gr 125.28 grvolume of dry soil 10.27 ml 9.26 ml
C.3.2. Calculation
Shrinkage Limit:
Sample 1:
SL=(W w−W d )−(V w−V d ) ρw
W d
× 100 %
SL=(27.06−16.25 )−(16.87−10.27 ) 1
16.25×100 %
SL = 25.91 %
Sample 2:
SL=(W w−W d )−(V w−V d ) ρw
W d
× 100 %
SL=(25.17−14.13 )−(16.11−9.26 ) 1
14.13×100 %
SL = 29.65 %
Average:
25.91 %+29.65 %2
20 | A t t e r b e r g L i m i t s
University of Indonesia
= 27.78 %
Shrinkage Ratio:
Sample 1:
SR=W d
V d
×100 %
SR=16.2510.27
× 100 %
SR = 158.23 %
Sample 2:
SR=W d
V d
×100 %
SR=14.139.26
× 100 %
SR = 152. 59 %
Average:
158.23 %+152.59 %2
= 155.41%
C.4. Practical Analysis
C.4.1. Experiment Analysis
The soil sample which is used has the same condition as liquid
limit experiment which has undergo 20-25 knocks with cassagrande
device by using the exactly same process of liquid limit experiment. By
using the soil sample which water content is within the liquid limit, there
is more water which is contained by the soil sample, which will cause the
shrinkage to be significant and make calculation easier. The insertion of
21 | A t t e r b e r g L i m i t s
University of Indonesia
soil sample into the coated dish has to be done gently. This is done to
prevent any air bubble to be trapped in the soil sample. Knocking the
coated dish is also necessary to flush out all the air, so the coated dish only
contains water and the solid particle. Any entrapped air will impair the
experiment, since the weight measured will not be the same with the
“pure” soil sample.
After the coated dish has been filled with sample, it is air-dried, so
the water will evaporate into the air slowly and cause shrinkage to happen.
The sample is not inserted directly into the oven to prevent cracking which
is caused by sudden shrinkage.
After the soil has been dried perfectly, it is weighted and then the
coated dish is filled by mercury and then weighted. Mercury is used to
measure volume because of its property: always pure, unable to stick and o
any surface and has a significant weight to compare. But note that any
experiment which uses mercury should be carried carefully, since
swallowing mercury can be fatal. In order to measure the volume of the
soil sample, the soil sample itself is soaked into the full shrinkage dish.
This makes the volume of the displaced mercury is the same with the
volume of the soaked soil cake. The volume of the coated dish and the soil
cake can be determined by dividing the mass of the displaced mercury
with its specific gravity.
C.4.2. Result Analysis
After doing the experiment and do the calculation, the first sample
has a shrinkage limit of 25.91% and a shrinkage ratio of 158.53%. The
second sample has a shrinkage limit of 29.65 % and a shrinkage ratio of
152.59%. By averaging both samples, it is known that the sample’s
shrinkage limit is 27.78% and the shrinkage ratio is 155.41%. The value of
27.78% is considered good, because any soil which has a shrinkage limit
below 15% will more likely to develop cracks when dried, and even any
soil which has a shrinkage limit below 10% cannot be used for some
22 | A t t e r b e r g L i m i t s
University of Indonesia
engineering purposes such as embankment due to its likeliness to cracks
due to change of moisture content.
The shrinkage ratio value of 155.41% means that after exceeding
its shrinkage limit, the soil is able to deform to 1.5541 times of its initial
volume due to its water content.
C.4.3. Error Analysis
While stirring the soil for cassagrande device, the soil is not
completely homogenous.
The soil sample may still contain air, so the real dry soil weight
may not be accurate.
While taking out the soil cake from the coated dish, there is some
part of the soil which is left in the coated dish, but the remains are
then added into the shrinkage dish, leaving only a very few excess
soil in the coated dish
C.5.Conclusion
The value of shrinkage limit of this soil sample is 27.78 %
The shrinkage ratio of this soil sample is 155.41%
23 | A t t e r b e r g L i m i t s
University of Indonesia
D. Overall Conclusion
After doing the Atterberg limits experiment, it is known that the liquid
limit is higher than the plastic limit, and the plastic limit is higher than
the shrinkage limit. Thus, the definition and condition of all Atterberg
limits are proven.
E. References
Bhudu, Muni. “Soil Mechanics and Foundations”. John Wiley & Sons.
New York. 2010
Basic Soil Mechanics Practicum Module Arranger Team. “Modul
Praktikum Mekanika Tanah Dasar”. Laboratory of Soil Mechanics,
Universitas Indonesia. Depok. 2008
F. Attachments
Adding soil sample to cassagrande device
24 | A t t e r b e r g L i m i t s
Rolling Soil in Plastic Limit experiment
University of Indonesia
Apparatus for shrinkage limit test
25 | A t t e r b e r g L i m i t s