melissa clinedinst and pooja patel - nacacnet.org · 2018 state of college admission 5 introduction...
TRANSCRIPT

STATE OF COLLEGE ADMISSION2018
MELISSA CLINEDINST AND POOJA PATEL

2 NATIONAL ASSOCIATION FOR COLLEGE ADMISSION COUNSELING
ACKNOWLEDGMENTS
The National Association for College Admission Counseling (NACAC) wishes to acknowledge the following key individuals and groups for their contributions to this report.
Most importantly, NACAC would like to thank the secondary school counselors, admission officers, and institutional research staff who gave their valuable time to participate in the annual Admission Trends Survey and Counseling Trends Survey. The report would not be possible without the data collected from these surveys.
ACKNOWLEDGMENTS
The association also appreciates the US Department of Education and the Higher Education Research Institute for sharing the education data they collect for inclusion in the report.
The authors of the report wish to thank the following members of the NACAC staff for assistance with survey development and administration, and with reviewing, editing, designing, and promoting the final report: David Hawkins, executive director of educational content and policy; Joyce Smith, chief executive
officer; John McGrath, deputy executive director; Shanda Ivory, director of communications, publications and technology; Kristen Garman, associate director of communications, publications and technology; Mary Stegmeir, assistant director for content and marketing; and Sarah Cox, associate director of editorial and creative services.
Special thanks to Anna-Maria Koranteng, former NACAC research associate, for her contributions to survey administration and data analysis.

32018 STATE OF COLLEGE ADMISSION
EXECUTIVE SUMMARY
Highlights from the 2018 State of College Admission report include findings related to the transition from high school to postsecondary education in the United States, gathered primarily through NACAC’s annual Admission Trends Survey and Counseling Trends Survey. The 2018 report also includes information about the recruitment and admission process for transfer and international students.
College ApplicationsThe increase in the number of colleges to which each student applies continues a near perfectly upward trend, which is reflected in college reports of increased application volume.
• Growth in Application Volume Continues: Between the Fall 2016 and Fall 2017 admission cycles, the number of applications from first-time freshmen increased 4 percent; applications from prospective transfer students increased by 3 percent; and international student applications increased by 8 percent, on average.
• Colleges Accept Nearly Two-Thirds of First-Time Freshmen, on Average: The percentage of applicants offered admission at four-year colleges and universities in the United States—referred to as the average selectivity rate—was
EXECUTIVE SUMMARY
65.4 percent for Fall 2016.1 The national average acceptance rate is down slightly after increasing steadily from a low of 63.9 percent in Fall 2012 to 66.1 percent in Fall 2015.
• Decline in Average Yield Rate for First-Time Freshmen Continues: The average yield rate for Fall 2016 (33.6 percent) is down from 35.1 percent in Fall 2015 and 36.2 percent in Fall 2014.
• Transfer Acceptance Rate Slightly Lower than Freshmen Rate; Yield Much Higher: Among institutions that enroll transfer students, average selectivity for Fall 2017 was 62 percent, compared to 65 percent for first-time freshmen. However, more than half (54 percent) of transfer applicants who were admitted ultimately enrolled, compared to only 28 percent of freshman admits.
• International Student Acceptance Rate is Low; Yield Slightly Higher than First-Time Freshmen: At institutions that enroll first-time international students, the Fall 2017 admit rate for this population (52 percent) was lower than both transfer and first-time freshmen students. The average yield rate for international students was 30 percent.
Recruitment and Yield StrategiesCollege admission offices use a variety of strategies to recruit prospective students, particularly those who would be likely to attend if admitted. Colleges are broadening their recruitment efforts to bring in more transfer and international students.
• Top Recruitment Strategies: Email and institutional websites are the primary means by which colleges recruit first-time freshmen, transfer students, and international students. However, colleges employ a broader range of strategies when recruiting domestic high school students. Four other factors were each rated as considerably important by at least 50 percent of colleges—hosting campus visits, outreach to parents and high school counselors, high school visits, and college fairs.
• Early Decision (ED) and Early Action(EA) Activity Increases: Between Fall 2016 and Fall 2017, colleges reported an average increase of 4 percent in the number of Early Decision applicants and 5 percent in ED admits. The number of Early Action applications increased by 9 percent and the number of students accepted through EA increased by 10 percent.
______________________________________________________
1 Based on US Department of Education data. Fall 2016 is the most recent available.

4 NATIONAL ASSOCIATION FOR COLLEGE ADMISSION COUNSELING
EXECUTIVE SUMMARY
• Wait List Activity Increases; Likelihood of Wait List Acceptance Remains Low: For the Fall 2017 admission cycle, 40 percent of institutions reported using a wait list. Institutions accepted an average of 25 percent of all students who chose to remain on wait lists. From Fall 2016 to Fall 2017, the number of students offered a place on an admission wait list increased by 12 percent, on average.
Factors in Admission DecisionsThe factors that admission officers use to evaluate applications from first-time freshmen have remained largely consistent over the past 20 years. Students’ academic achievements—which include grades, strength of curriculum, and admission test scores—constitute the most important factors in the admission decision. Admission decision factors for first-time international students are similar to those for domestic students, but the transfer admission decision process differs in significant ways.
• Admission Offices Identify Grades, High School Curriculum, and Test Scores as Top Factors for First-Time Freshmen: The top factors in the admission decision were: overall high school GPA, grades in college preparatory courses, admission test scores, and strength of curriculum. Among the next most important factors were the essay, a student’s demonstrated interest, counselor and teacher recommendations, class rank, and extracurricular activities.
• Top Factor for International Students is English Proficiency Exam Scores: After English proficiency, the factors for admission decisions with international applicants are remarkably similar to those for domestic students, with one notable exception. A greater proportion of colleges rated the essay/writing sample as considerably important for international applicants, likely because of the additional confirmation of English skills that the essay provides.
• For Transfer Admission Decisions, Grades Matter Most: The only transfer admission decision factors rated considerably important by a substantial proportion of colleges were overall GPA at the student’s prior postsecondary institution and average grades in transferrable courses.
College Counseling in Secondary SchoolsAccess to college information and counseling in school is a significant benefit to students in the college application process. For many students, particularly those in public schools, college counseling is limited at best. Counselors are few in number, often have large student caseloads, and have additional constraints on the amount of time they can dedicate to college counseling.
• Student-to-Counselor Ratio: According to US Department of Education data, in 2015-16 each public school counselor (including elementary and secondary) was responsible for 470 students, on average.
• College Counseling Staff: For the 2017–18 academic year, 33 percent of public schools reported employing at least one counselor (full- or part-time) whose exclusive responsibility was to provide college counseling, compared to 68 percent of private schools.
• Time Available for College Counseling: Some differences exist between the duties and activities of counselors employed at public schools versus those who work at private schools. On average, public school counselors spent 21 percent of their time on postsecondary counseling in 2017–18 , while their private school counterparts spent 47 percent of their time on college counseling.

52018 STATE OF COLLEGE ADMISSION
INTRODUCTION
NACAC’s MissionSupporting students in the transition from high school to college has been at the core of NACAC’s mission since the association was founded in 1937. Given changes in both the national and global economy in recent decades, as well as rapidly shifting student demographics, the role of professionals who assist students in this process has never been more important. Expert projections indicate that 65 percent of US jobs will require some type of postsecondary education by 2020; however, the US will lag by 5 million workers with those credentials if postsecondary attainment rates do not increase substantially.1 Nearly all of the jobs (99 percent) created during the most recent recession recovery (since 2008) have gone to workers with at least some college education.2 To the detriment of individuals and communities, those whose highest degree is a high school diploma are denied the
INTRODUCTION
many benefits that college graduates enjoy, including:
• higher incomes and increased lifetime earnings
• lower levels of unemployment and poverty
• decreased reliance on public assistance programs
• increased job satisfaction
• greater likelihood of receiving employer-sponsored pensions and health insurance
• healthier lifestyles
• higher levels of civic engagement.3
Unfortunately, as of 2017 only 34 percent of all adults age 25 and older had obtained at least a bachelor’s degree.4 Even more significant, underserved minority groups and students from low-SES backgrounds fall behind in every step of the attainment process: high school graduation, college enrollment, and postsecondary credential completion.
In recognition of the important role that community colleges have in achieving national postsecondary attainment goals, NACAC has more recently expanded the association’s resources, advocacy, and research efforts to serve community college professionals. An increasing number of students are achieving their educational goals at two-year colleges and exploring transfer pathways to a bachelor’s degree. Transferring also provides an opportunity for students to find success when the first college enrollment experience proves to not serve the student well. According to US Department of Education data, approximately one-third (36 percent) of all first-time degree-seeking students attended a two-year institution in Fall 2016.5 Thirty-eight percent of students who began postsecondary education in Fall 2011 transferred at least once in the following six years.7 And, contrary to popular belief, many students “reverse transfer,” meaning they move from a four-year college to a
______________________________________________________
1 Carnevale, A.P., Smith, N., and Strohl, J. (2013). Recovery: Job Growth and Education Requirements Through 2020. Georgetown University Center on Education and the Workforce.
2 Carnevale, A.P., Jayasundera, T., and Gulish, A. (2016). America’s Divided Recovery: College Haves and Have-Nots. Georgetown University Center on Education and the Workforce.
3 Ma, J., Pender, M., Welch, M. (2016). Education Pays 2016: The Benefits of Higher Education for Individuals and Society. College Board: Washington, DC.
4 US Census Bureau. (2017). Educational Attainment in the United States: 2017. Washington, DC: Government Printing Office.5 US Department of Education. (2017). Digest of Education Statistics. Table 305.10. Washington, DC: NCES.6 Shapiro, D., Dundar, A., Huie, F., Wakhungu, P.K., Bhimdiwali, A., Nathan, A., & Youngsik, H. (2018, July). Transfer and Mobility:
A National View of Student Movement in Postsecondary Institutions, Fall 2011 Cohort (Signature Report No. 15). Herndon, VA: National Student Clearinghouse Research Center.
7 Shapiro, D., Dundar, A., Huie, F., Wakhungu, P.K., Bhimdiwali, A., Nathan, A., & Youngsik, H. (2018, July). Transfer and Mobility: A National View of Student Movement in Postsecondary Institutions, Fall 2011 Cohort (Signature Report No. 15). Herndon, VA: National Student Clearinghouse Research Center.

6 NATIONAL ASSOCIATION FOR COLLEGE ADMISSION COUNSELING
INTRODUCTION
two-year college. Among that same Fall 2011 cohort, more than half (59 percent) of those who transferred from four-year institutions moved to a community college.8
NACAC has also expanded its focus to include support for professionals who work with students from outside the US and those who advise US students interested in pursuing postsecondary degrees abroad. The growth of international student enrollment at American high schools, colleges, and universities, along with increased interest among American students in study abroad options, is adding a global dynamic to the work of college counseling and admission professionals. In 2016, approximately 5 million students enrolled in tertiary education outside their country of citizenship. In the 2015-16 academic year, 325,339 US students received academic credit for study abroad, a 4 percent increase over the previous year.9
State of College Admission ReportThe 2018 State of College Admission report provides up-to-date information on a number of issues that impact students’ transition from high school to postsecondary education, as well as the admission process for transfer students and
international students attending postsecondary institutions in the United States. The report covers the recruitment strategies that colleges use to attract each group of prospective students and the process by which candidates are evaluated. The report also includes a chapter dedicated to school counseling in
US secondary schools, given the integral role school counselors play in putting students on the path to postsecondary success.
The report is divided into four chapters: College Applications; Recruitment and Yield Strategies; Factors in Admission Decisions; and Secondary School Counseling.
______________________________________________________
8 Organization for Economic Co-Operation and Development (2018). Education at a Glance, 2018. Washington, DC: OECD.9 Institute of International Education (IIE). (2017). Open Doors 2017.
Methodology in Brief
The information presented in the report primarily includes data gathered through NACAC’s annual Counseling Trends Survey and Admission Trends Survey.
NACAC’s annual Counseling Trends Survey (CTS) collects information from secondary school counselors and counseling departments about their priorities and work responsibilities—particularly as they relate to helping students transition to college, and their practices in communicating with students, parents, and colleges. The 2017–18 academic year CTS was distributed in May 2018 to 16,252 secondary school counseling offices. NACAC received 2,251 responses.
NACAC administers its annual Admission Trends Survey (ATS) to US four-year colleges that are NACAC members. NACAC collects data related to application volume; application practices; the use of various enrollment management strategies, including wait lists, Early Decision, and Early Action; the importance of various factors in the admission decision; and admission staffing. Since 2014, NACAC has expanded ATS to incorporate questions related to the admission process for prospective transfer and international students. NACAC received 493 responses to the 2017–18 ATS.
(See Appendix A: Methodology for more detailed information about survey administration and data analysis.)

72018 STATE OF COLLEGE ADMISSION
01CHAPTER 1 COLLEGE APPLICATIONS
Each year, US colleges and universities receive hundreds of thousands of applications from first-time domestic students, transfer students, and international students. Results of recent NACAC Admission Trends Surveys indicate that the number of applications has continued to increase across four-year colleges.
Application VolumeResults of the 2017–18 Admission Trends Survey indicate that the average number of applications increased for each group of prospective students between the Fall 2016 and Fall 2017 admission cycles.
Applications from first-time freshmen increased by 4 percent, on average, and applications from prospective transfer students increased by 3 percent. The percent increase in applications was greater
at private institutions than publics for both first-time freshmen and transfer students.1
Although applications from international students represented the smallest proportion of all applications received, they increased by 8 percent from Fall 2016 to Fall 2017.2 Applications for each group of prospective students also had increased from Fall 2015 to Fall 2016, by 7 percent, 1 percent, and 10 percent, respectively.
According to the Higher Education Research Institute’s The American Freshmen report series, 35 percent of first-time freshmen applied to seven or more colleges during the Fall 2016 admission cycle, after reaching a peak of 36 percent in Fall 2015. Since Fall 2013, more than 80 percent of first-time freshmen have applied to at least three colleges each year (see Figure 1).
______________________________________________________
1 Independent t-tests indicated there were significant differences in percent change in applicants and control for both freshman (t (454) = .466, p < .01); and transfer students (t (321) = 1.1, p < .01).
2 International percent change responses trimmed 5 percent due to extreme outliers.
PERCENT CHANGE IN THE NUMBER OF APPLICATIONS BETWEEN FALL 2016 AND FALL 2017
First-time freshmen
4%Transfer
3%International
8%

8 NATIONAL ASSOCIATION FOR COLLEGE ADMISSION COUNSELING
CHAPTER 1
SOURCE: Eagan, K., Stolzenberg, E.B., Zimmerman, H.B., Aragon, M.C., Sayson, H.W., & Rios-Aguilar, Rios. (2017). The American Freshman: National Norms Fall 2016. Los Angeles: Higher Education Research Institute at UCLA. Eagan, M. K., Stolzenberg, E.B., Ramirez, J.J., Aragon, M.C., Suchard, M.R., and Rios-Aguilar. (2016) The American freshman: Fifty-Year trend, 1996-2015. Los Angeles: Higher Education Research Institute, UCLA.
Application volume increases have created a growing burden on admission office staff who evaluate prospective students for admission. According to Admission Trends Survey results, the average number of applications for each admission office staff member (excluding administrative staff) for the Fall 2017 admission cycle was 791 for public institutions and 426 for privates. The number of applications per admission officer
increases with both applicant selectivity rates and enrollment size (see Table 1).
Acceptance and Yield RatesThe acceptance rate for a college or university is defined as the percentage of applicants who are offered admission. Institutions with lower acceptance rates are considered more highly selective, meaning a smaller number of applicants are admitted. The selectivity of US postsecondary
institutions range from acceptance rates of fewer than 10 percent to more than 90 percent of applicants. An institution’s yield rate is defined as the percentage of admitted students who ultimately enroll at the institution, after considering other admission offers. Although yield rates may have little relevance to prospective students, accurately predicting yield is critical to colleges looking to avoid either over- or under-enrollment.
First-Time FreshmenAccording to the most recent data collected by the US Department of Education, the national average acceptance rate for first-time freshmen across all four-year institutions in the US was 65.4 percent, after increasing steadily from a low of 63.9 percent in Fall 2012 to 66.1 percent in Fall 2015. For Fall 2016, the average acceptance rate at private institutions was about 6 percentage points lower than the average rate at public institutions (63.5 percent versus 69.1 percent).
The most selective four-year colleges—defined as those accepting less than half of all applicants—received 36 percent of all Fall 2016 applications but enrolled only 21 percent of first-time undergraduate students. Nearly two-thirds of first-time, full-time freshmen (68 percent) were enrolled in institutions with selectivity rates between 50 percent and 85 percent (see Table 2).
For the Fall 2016 freshman class, the average yield rate among four-year colleges and universities was 33.6 percent, down from 35.1 percent in Fall 2015 and 36.2 percent in Fall 2014.
FIGURE 1. INCREASES IN FIRST-TIME FRESHMEN APPLICATION SUBMISSION: 1995 TO 2016

92018 STATE OF COLLEGE ADMISSION
CHAPTER 1
Transfer and International Students Among 2017–18 Admission Trends Survey respondents that
accept transfer students, the average acceptance rate for transfer applicants was slightly lower than for the first-time freshmen
N Mean
ControlPublic 53 791Private 100 426EnrollmentFewer than 3,000 students 77 2963,000 to 9,999 43 670
10,000 or more 30 1,016SelectivityAccept fewer than 50 percent of applicants 25 91550 to 70 percent 64 53471 to 85 percent 51 429More than 85 percent 12 435
NOTE: Admission counselors and mid/senior level admission officials were included in the analyses.NOTE: Independent t-tests and one-way ANOVAs indicated there were significant differences in the application to admission officer ratio by: control (t (151) = 4.9, p < .001); enrollment (F (2, 147) = 51.6, p < .001), and acceptance rate (F (3, 148) = 7.3, p < .001).Pearson correlation applications per admission officer and: enrollment .588, p < .01; acceptance rate -.313, p < .01. What about control t-test?SOURCE: NACAC Admission Trends Survey, 2017–18.
TABLE 1. APPLICATIONS PER ADMISSION OFFICER, FALL 2017
THE AVERAGE ACCEPTANCE RATE FOR FIRST-TIME FRESHMEN
population (62 percent compared to 65 percent). However, the yield for accepted transfer students was much higher (54 percent compared to 28 percent).
A similar analysis of institutions that accept international students showed that first-time international students are accepted at a lower rate (52 percent) than both transfer students and first-time freshmen. The yield rate for international students was 30 percent, indicating they were only slightly more likely to enroll than accepted first-time freshmen applicants (see Table 3).
Application FeesResults of the Admission Trends Survey indicate that 74 percent of four-year, not-for-profit colleges had an application fee for the Fall 2017 admission cycle, which averaged $49. Public colleges were more likely to report having an application fee than privates (94 percent versus 62 percent), but no difference was found in the average fee amount.3 Larger enrollment sizes and lower selectivity rates were associated with higher average fees.4
Fall 2016
65.4%Fall 2015
66.1%Fall 2014
65.8%______________________________________________________
3 Chi-squared test control and application fee (X2 (1) = 47.6 p < .001; phi = .351 p < .001. 4 Pearson correlations for application fee amount and: enrollment (.218), acceptance rate (-.433), p < .01.
Fall 2013
64.7%

10 NATIONAL ASSOCIATION FOR COLLEGE ADMISSION COUNSELING
CHAPTER 1
Selectivity
National share of
institutions
Average number of
applications per institution
National share of
applications
National share of full-time, first-time
degree seeking undergraduates
Accept fewer than 50 percent of applicants 19.5% 11,969 36.0% 20.9%50 to 70 percent 36.6 5,936 33.4 35.671 to 85 percent 27.7 5,648 24.1 32.0More than 85 percent 16.2 2,635 6.6 11.5
N = 1,596SOURCE: US Department of Education, National Center for Education Statistics. (2016–17). Integrated Postsecondary Education Data System (IPEDS) Data Center. Washington, DC: NCES. [Includes Title-IV participating, four-year public and private not-for-profit, degree-granting (primarily baccalaureate) institutions in the US that enroll first-time freshman and are not open admission.]
TABLE 2. APPLICATIONS AND ENROLLMENT, BY SELECTIVITY: FALL 2016

112018 STATE OF COLLEGE ADMISSION
CHAPTER 1
Transfer N Mean
Transfer Selectivity Rate 364 61.7%Overall Freshman Selectivity Rate for Institutions with Transfer Students 353 64.7%Transfer Yield Rate 363 53.5%Overall Yield Rate for Institutions with Transfer Students 331 27.7%International N Mean
International Selectivity Rate 263 51.7%Overall Freshman Selectivity Rate for Institutions with International Students 341 64.5%International Yield Rate 263 30.4%Overall Yield Rate for Institutions with International Students 321 27.8%
SOURCE: NACAC Admission Trends Survey, 2017–18.
TABLE 3. KEY STATISTICS FOR TRANSFER AND INTERNATIONAL STUDENT ADMISSION: FALL 2017

12 NATIONAL ASSOCIATION FOR COLLEGE ADMISSION COUNSELING
CHAPTER 2 RECRUITMENT AND YIELD STRATEGIES02
Recruitment Strategies by Prospective Student GroupResults of NACAC’s 2017–18 Admission Trends Survey indicate that many of the recruitment methods used for traditional domestic high school students are also useful with other populations. For example, contacting students through email and engaging with them through the institution’s website were the most important recruitment strategies that colleges and universities use for first-time freshmen, transfer students, and international students. For high school students, an additional four factors were each rated as considerably important by at least 50 percent of colleges. They were: hosting campus visits, outreach to parents and high school counselors, high school visits, and college fairs. More than
half of colleges (57 percent) also rated campus visits as considerably important in recruiting transfer students (see Table 4). A variety of other strategies were used with both transfer and international recruitment, but only email and website were rated very highly as recruitment tools.
Survey respondents reported that they actively recruited in nine countries, on average. For the purpose of the survey, “active recruitment” was defined as engaging in recruitment activities that involve either maintaining an in-country office/staff presence or periodic staff travel to students’ home countries (e.g., attending education fairs, making high school visits, or conducting site visits with international student recruitment agents). The number of countries also increased with selectivity.1
(A complete breakdown of how colleges rated various recruitment strategies by population can be found in Appendix Tables B.1 to B.3.)
Early Decision Twenty-one percent of respondents to NACAC’s 2017–18 Admission Trends Survey offered Early Decision (ED). Private colleges were more likely than public institutions to offer Early Decision policies (30 percent compared to 6 percent), as were selective colleges.2
More than half (52 percent) of the most selective colleges (those accepting fewer than 50 percent of applicants) had an Early Decision application option. (See Appendix C for a detailed description of Early Decision and Early Action policies.)
Early Decision applicants represent only a small portion of the total applicant pool at colleges that have
______________________________________________________
1 Correlation (Pearson’s R) acceptance rate and number of countries (.317), p < .01.2 Chi-squared test for Early Decision policy and: institution type (X2 (1) = 41.5, Phi = .293), p < .001; Correlation (Spearman’s Rho) for
Early Decision policy and acceptance rate (-.321), p < .001.

132018 STATE OF COLLEGE ADMISSION
CHAPTER 2
Factor First-Time Freshmen Transfer International
(First-Time Freshmen)
Email 87.5 79.4 84.1
Website 85.0 82.8 85.6
Hosted Campus Visit 81.3 56.8 29.5
Parents 64.4 25.7 42.0
High School Counselor 63.8 15.2 31.8
High School Visit (in the US) 58.8 12.8 8.6
College Fairs 49.7 24.0 18.2
Direct Mail 48.1 24.4 7.2
Social Media 44.4 30.6 33.6
Text Messaging 37.8 31.8 19.7
Online Advertising 29.1 23.5 16.2
Community Based Organizations 20.1 8.7 7.9
Test-Optional Policy 18.2 5.0 9.4
Alumni 14.5 10.3 11.2
High School Visit (Outside the US) 9.8 2.9 26.7
Community College Outreach/Partnerships 9.7 55.4 10.2
Conditional/Provisional Admission Program 7.9 6.2 8.5
Articulation Agreements with Community Colleges 7.6 50.6 8.1
International Student Recruitment Agents — — 15.1
Partnerships with International Colleges/Universities — — 19.5
State or Regional Recruitment Consortium — — 5.7
Federal Government Support — — 6.3
Foreign Government Support — — 12.1
Pathways Programs — — 12.1
—Question was only asked for international students. SOURCE: NACAC Admission Trends Survey, 2017–18.
TABLE 4. PERCENTAGE OF COLLEGES ATTRIBUTING “CONSIDERABLE IMPORTANCE” TO VARIOUS RECRUITMENT STRATEGIES, BY PROSPECTIVE STUDENT POPULATION: 2017–18

14 NATIONAL ASSOCIATION FOR COLLEGE ADMISSION COUNSELING
CHAPTER 2
N Mean Percent
Applications Received through Early Decision 88 4.7Early Decision Selectivity Rate 89 62.3Overall Selectivity Rate for Institutions with Early Decision Policies 99 50.7Early Decision Yield Rate 75 87.9Overall Yield Rate for Institutions with Early Decision Policies 85 25.8
SOURCE: NACAC Admission Trends Survey, 2017–18.
TABLE 5. KEY STATISTICS FOR EARLY DECISION COLLEGES: FALL 2017
ED policies. Only 5 percent of applications for Fall 2017 admission to ED colleges were received through Early Decision. The proportion of applications received through ED increased with the admission selectivity rate and yield rate.3
As expected, colleges with Early Decision policies reported a higher acceptance rate for their ED applicants as compared to all applicants (62 percent versus 51 percent). Given the binding nature of Early Decision policies, the average yield rate for Early Decision admits was 88 percent, substantially higher
than the average yield rate for all students admitted to ED colleges (26 percent) (see Table 5). Colleges with lower total yield rates tended to admit a greater percentage of their ED applicants compared to those with higher yield rates.4 More selective colleges tended to have higher ED yield rates.5
Between Fall 2016 and Fall 2017, colleges reported an average increase of 4 percent in the number of Early Decision applicants and 5 percent in ED admits. In a prior survey, colleges also had reported increases in ED applications and ED admits between
Fall 2015 and Fall 2016 (6 percent and 6 percent, respectively).
Early Action Thirty-six percent of four-year colleges offered Early Action (EA)plans, according to results of the 2017–18 Admission Trends Survey. Private colleges were more likely than publics to have Early Action application options (40 percent compared to 28 percent, respectively). Colleges with lower yield rates also were more likely to offer Early Action.6 Forty-six percent of colleges with
OF SELECTIVE COLLEGES OFFERED EARLY DECISION
52%OF COLLEGES WITH LOW YIELD RATES OFFERED
EARLY ACTION
46%
______________________________________________________
3 Correlation (Pearson’s R) for percent of apps received through ED and: acceptance rate (.690); yield rate (.502), p < .01.4 Correlation (Pearson’s R) for institutional yield rate and ED acceptance rate (-.447), p < .01. 5 Correlation (Pearson’s R) for institutional selectivity rate and ED yield (.392), p < .01.6 Chi-squared test for Early Action policy and: institution type (X2 (1) = 6.8, Phi = .119), p < .01; Correlation (Spearman’s Rho) for
Early Action policy and institutional yield rate (.272), p < .001.
152018 STATE OF COLLEGE ADMISSION
CHAPTER 2
N Mean Percent
Applications Received through Early Action 91 43.2Early Action Selectivity Rate 88 73.6Overall Selectivity Rate for Institutions with Early Action Policies 161 64.1Early Action Yield Rate 92 22.1Overall Yield Rate for Institutions with Early Action Policies 155 23.2
SOURCE: NACAC Admission Trends Survey, 2017–18.
TABLE 6. KEY STATISTICS FOR EARLY ACTION COLLEGES: FALL 2017
THE MOST SELECTIVE COLLEGES ADMITTED ONLY 14 PERCENT OF
WAITLISTED STUDENTS
yield rates lower than 30 percent used Early Action.
For Fall 2017, 44 percent of applications to colleges that had Early Action admission plans were received through EA. Similar to the pattern with Early Decision, colleges with Early Action accepted a greater proportion of EA applicants when compared to the overall applicant pool (74 percent versus 64 percent). Unlike Early Decision, Early Action did not provide a significant benefit to institutions in terms of yield rates. The average yield rate for EA admits was nearly identical to that of the overall applicant pool (22 percent and 23 percent, respectively) (see Table 6).
From Fall 2016 to Fall 2017, the number of Early Action applications increased by 9 percent and the number of students accepted through EA increased by 10 percent, on average. Colleges also had reported average increases in EA applications
and EA admits between Fall 2015 and Fall 2016 (15 percent and 16 percent, respectively).
Wait Lists For the Fall 2017 admission cycle, 40 percent of institutions reported using a wait list. Private institutions were more likely than public colleges and universities to maintain a wait list (43 percent compared to 33 percent), as were those with lower acceptance rates.7 Seventy-five percent of the most selective institutions (accepting fewer than half of all applicants) maintained a wait list.
Institutions reported placing an average of 10 percent of all applicants on the wait list for the Fall 2017 admission cycle, and an average of 50 percent of waitlisted students opted to remain on the wait list. Colleges with lower acceptance rates placed a greater proportion of students on wait lists, on average.8
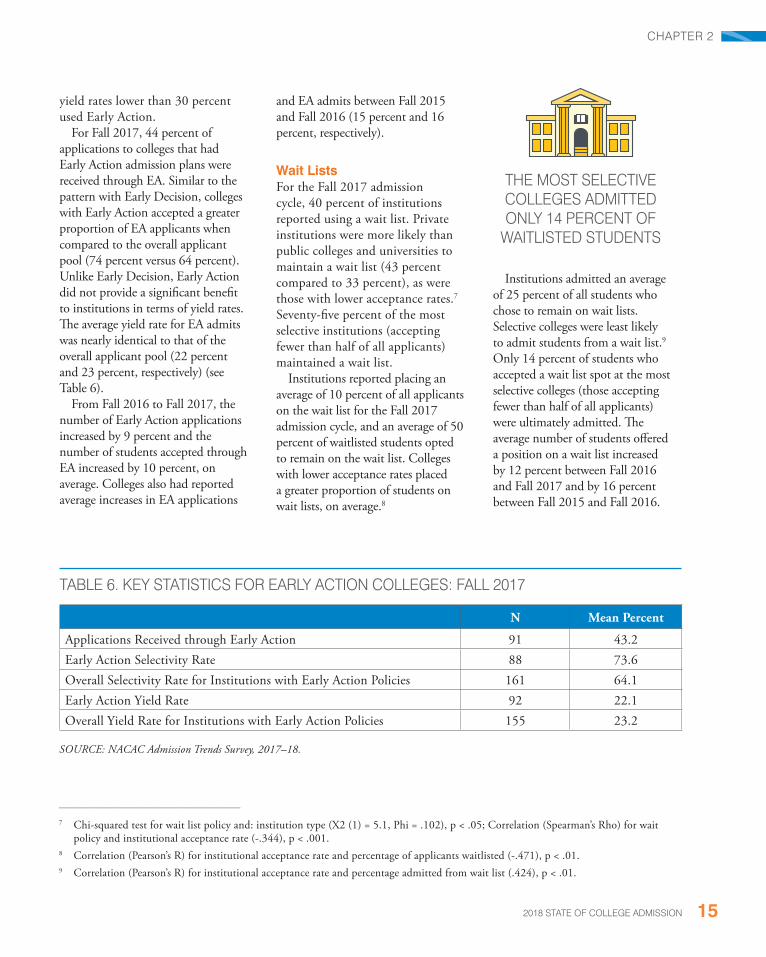
Institutions admitted an average of 25 percent of all students who chose to remain on wait lists. Selective colleges were least likely to admit students from a wait list.9 Only 14 percent of students who accepted a wait list spot at the most selective colleges (those accepting fewer than half of all applicants) were ultimately admitted. The average number of students offered a position on a wait list increased by 12 percent between Fall 2016 and Fall 2017 and by 16 percent between Fall 2015 and Fall 2016.
______________________________________________________
7 Chi-squared test for wait list policy and: institution type (X2 (1) = 5.1, Phi = .102), p < .05; Correlation (Spearman’s Rho) for wait policy and institutional acceptance rate (-.344), p < .001.
8 Correlation (Pearson’s R) for institutional acceptance rate and percentage of applicants waitlisted (-.471), p < .01. 9 Correlation (Pearson’s R) for institutional acceptance rate and percentage admitted from wait list (.424), p < .01.

16 NATIONAL ASSOCIATION FOR COLLEGE ADMISSION COUNSELING
CHAPTER 3 FACTORS IN ADMISSION DECISIONS03
There is no definite plan or specific combination of factors that will guarantee a student admission to their preferred institution. Colleges and universities review many aspects of prospective student applications in order to determine which students will be admitted. In addition to considering the merits of each applicant, most universities also consider the composition of the entering freshmen and transfer classes as a whole, in order to ensure that a diverse group of students with a variety of academic and extracurricular interests will enrich the campus experience. The importance of various factors in the admission decision also differ depending on a student’s designation as a first-time freshman, transfer, or international student. While first-time freshmen and international students had similarities in regard to top admission factors, top factors for transfer students were considerably different. Institutional characteristics, such
as enrollment size and acceptance rate, also impact the importance of admission factors.
Factors in the Admission Decision: First-Time Freshmen, 2017 (see Table 7)
• Grades in high school have been among the top decision factors for first-time freshmen for decades. Eighty-one percent of colleges rated grades in all courses as considerably important, and 71 percent rated grades in college prep courses as considerably important. Admission test scores and strength of curriculum were also rated considerably important by more than half of colleges (52 and 51 percent, respectively).
• A second set of factors were most often considered to be moderately important. These factors tend to provide insight regarding personal qualities and interest of students, as well as more details regarding academic performance.
They include essays or writing samples; teacher and counselor recommendations; student’s demonstrated interest; class rank; and extracurricular activities.
• A final group of admission decision factors were given, on average, moderate or considerable importance by a small percentage of institutions, likely because they are relevant only to a small subset of colleges. These factors included subject test scores (AP, IB), portfolios, SAT II scores, interviews, state graduation exam scores, and work experience.
Factors in the Admission Decision: International Students, 2017 (see Table 8)
• The top factors in admission decisions for first-time international students applying to four-year US colleges were similar to those of first-time domestic students, with the important exception of English proficiency exam scores.

172018 STATE OF COLLEGE ADMISSION
CHAPTER 3
Eighty percent of colleges rated these proficiency scores as considerably important, followed by grades in all courses (76 percent), grades in college prep courses (67 percent), and strength of curriculum (48 percent).
• A national school leaving or graduation certificate was also an important factor for international students, rated as considerably important by 35 percent of institutions and as moderately important by an additional 28 percent.
Factors in the Admission Decision: Transfer Students, 2017 (see Table 9)
• The factors considered in transfer admission decisions are notably different than those for first-time domestic and international students. The only two factors that are rated as considerably important by a majority of colleges were overall GPA at prior postsecondary institutions (83 percent) and average grades in transferable courses (72 percent). Unlike other prospective student populations, these factors serve as direct evidence of a student’s
ability to succeed in college-level academic coursework.
• For transfer students, many factors related to high school performance fall to the level of moderate to limited importance, including grades, strength of the high school curriculum, and recommendations from teachers and counselors.
• In contrast to first-time prospective students, 74 percent of colleges rated admission test scores (SAT, ACT) as having limited or no importance in transfer admission decisions.
Factor NConsiderable Importance
Moderate Importance
Limited Importance
No Importance
Grades in All Courses 173 80.9 10.4 5.8 2.9Grades in College Prep Courses 171 70.8 17.5 8.8 2.9Admission Test Scores (SAT, ACT) 172 52.3 30.8 14.5 2.3Strength of Curriculum 170 51.2 29.4 12.9 6.5Essay or Writing Sample 168 16.7 36.9 20.8 25.6Counselor Recommendation 167 10.8 46.1 28.7 14.4Student’s Demonstrated Interest 168 15.5 21.4 34.5 28.6Teacher Recommendation 168 7.1 46.4 29.2 17.3Class Rank 172 9.3 27.9 36.0 26.7Extracurricular Activities 169 3.6 34.9 40.8 20.7Subject Test Scores (AP, IB) 166 4.2 28.9 28.3 38.6Portfolio 167 5.4 7.2 27.5 59.9Interview 168 3.6 14.3 29.2 53.0Work 169 1.8 17.8 41.4 39.1SAT II Scores 166 6.6 3.0 19.9 70.5State Graduation Exam Scores 168 1.8 8.3 17.9 72.0
SOURCE: NACAC Admission Trends Survey, 2017–18.
TABLE 7. PERCENTAGE OF COLLEGES ATTRIBUTING DIFFERENT LEVELS OF IMPORTANCE TO FACTORS IN ADMISSION DECISIONS: FIRST-TIME FRESHMEN, FALL 2017

18 NATIONAL ASSOCIATION FOR COLLEGE ADMISSION COUNSELING
CHAPTER 3
Factor NConsiderable Importance
Moderate Importance
Limited Importance
No Importance
English proficiency exam scores 162 80.2 14.8 1.9 3.1Grades in All Courses 166 75.9 13.9 7.2 3.0Grades in College Prep Courses 165 67.3 18.2 9.7 4.8Strength of Curriculum 164 48.2 28.7 13.4 9.8Admission Test Scores (SAT, ACT) 165 39.4 31.5 21.8 7.3National school-leaving certificate (non U.S.)
151 35.1 27.8 14.6 22.5
Essay or Writing Sample 162 20.4 39.5 17.3 22.8Counselor Recommendation 161 12.4 41.0 28.0 18.6Student’s Demonstrated Interest 161 16.8 23.0 31.7 28.6Teacher Recommendation 162 10.5 43.8 25.3 20.4Class Rank 165 9.7 17.6 32.1 40.6Extracurricular Activities 163 1.8 31.3 42.3 24.5Subject Test Scores (AP, IB) 159 7.5 22.6 28.9 40.9Portfolio 161 5.0 6.8 31.1 57.1Interview 161 2.5 18.0 31.1 48.4Work 162 1.2 13.6 38.3 46.9SAT II Scores 160 6.3 2.5 20.6 70.6State Graduation Exam Scores 159 4.4 6.9 12.6 76.1
SOURCE: NACAC Admission Trends Survey, 2017–18.
TABLE 8. PERCENTAGE OF COLLEGES ATTRIBUTING DIFFERENT LEVELS OF IMPORTANCE TO FACTORS IN ADMISSION DECISIONS: INTERNATIONAL STUDENTS (FIRST-TIME FRESHMEN), FALL 2017
Factors in Admission Decisions for First-Time Freshmen: Change Over TimeBecause NACAC only recently began to collect annual data from transfer and international students, change in admission factor importance over time is limited to first-time freshmen. The relative importance of many admission decision factors have remained remarkably stable over the long term. Notable exceptions include the declining importance of class
rank, interviews, and the essay/writing sample (see Table 10).
While academic performance has remained the most important consideration for colleges, in recent years, specific changes in the top factors have become evident. For many years, grades in college prep courses had been rated as the top factor in admission decisions, followed by strength of curriculum and grades in all courses (overall GPA). However, from 2014 to 2017, the percentage of colleges rating grades in all
courses as considerably important has increased from 60 percent to 81 percent. During the same time frame, grades in college prep courses decreased from 77 percent to 71 percent, and strength of curriculum from 60 percent to 51 percent.
This recent change in the relative order of overall GPA, grades in college prep courses, and strength of curriculum could be due to increases in the proportion of students who take college prep courses, such as AP

192018 STATE OF COLLEGE ADMISSION
CHAPTER 3
Factor NConsiderable Importance
Moderate Importance
Limited Importance
No Importance
Overall GPA at prior institution 166 82.5 13.3 3.0 1.2Average of grades in transferable courses 164 72.0 17.7 4.9 5.5Grades in All Courses 167 16.2 29.3 38.9 15.6Grades in College Prep Courses 168 11.9 29.2 41.7 17.3Admission Test Scores (SAT, ACT) 167 9.6 16.8 44.9 28.7Strength of Curriculum 166 12.0 23.5 40.4 24.1Essay or Writing Sample 164 10.4 31.1 24.4 34.1Counselor Recommendation 163 5.5 22.1 35.0 37.4Student’s Demonstrated Interest 165 13.3 23.0 32.1 31.5Teacher Recommendation 164 4.9 30.5 31.7 32.9Class Rank 167 3.0 9.6 29.3 58.1Extracurricular Activities 165 1.2 24.8 40.0 33.9Subject Test Scores (AP, IB) 162 — 13.6 34.0 52.5Portfolio 163 4.9 6.1 25.2 63.8Interview 164 2.4 11.6 31.1 54.9Work 165 1.8 15.8 39.4 43.0SAT II Scores 162 1.9 2.5 15.4 80.2State Graduation Exam Scores 163 — 3.1 16.0 81.0Articulation with prior postsecondary institutions
163 20.9 32.5 19.6 27.0
Quality of prior postsecondary institution 164 13.4 28.7 31.7 26.2English proficiency exam scores 150 6.0 16.7 12.7 64.7National school-leaving certificate (non US) 143 4.2 6.3 8.4 81.1
SOURCE: NACAC Admission Trends Survey, 2017–18.
TABLE 9. PERCENTAGE OF COLLEGES ATTRIBUTING DIFFERENT LEVELS OF IMPORTANCE TO FACTORS IN ADMISSION DECISIONS: TRANSFER STUDENTS, FALL 2017
and dual enrollment. In analyzing this data, however, it is important to focus on the long-term trends for each factor rather than any year-to-year changes, as such differences may be due to variations in the annual survey samples. Additional years of data will be needed to determine if this change becomes a longer-term trend.
Factors in Admission by Institutional Characteristics for First-Time Freshmen, Transfer, and International Students, 2017This section highlights differences in the level of importance attributed to admission factors based on institutional characteristics. The
results presented below are limited to admission factors for prospective first-time freshmen. Lack of variation for transfer and international admission factor ratings prohibited analysis for these groups.
The top four admission decision factors for first-time freshmen are consistent across all types of institutions. However, institutional

20 NATIONAL ASSOCIATION FOR COLLEGE ADMISSION COUNSELING
CHAPTER 3
2007 2008 2009 2010 2011 2012 2013 2014 2015 2016 2017
Grades in College Prep Courses
80% 75% 87% 83% 84% 82% 82% 79% — 77% 71%
Grades in All Courses
52 52 46 46 52 50 52 60 — 77 81
Strength of Curriculum
64 62 71 66 68 65 64 60 — 52 51
Admission Test Scores
59 54 58 59 59 56 58 56 — 54 52
Essay or Writing Sample
26 27 26 27 25 20 22 22 — 19 17
Class Rank 23 19 16 22 19 13 15 14 — 9 9Counselor Recommendation
21 20 17 19 19 16 16 17 — 15 11
Demonstrated Interest
22 21 21 23 21 18 20 17 — 14 16
Teacher Recommendation
21 21 17 19 17 15 14 15 — 11 7
Interview 11 11 7 9 6 7 8 4 — 5 4Extracurricular Activities
7 7 9 7 5 7 10 6 — 8 4
Work 2 2 2 2 2 1 3 1 — 3 2Subject Test Scores (AP, IB)
7 8 7 10 7 5 8 7 — 7 4
State Graduation Exams
4 4 3 4 4 2 3 4 — 2 2
SAT II Scores 6 7 5 5 5 4 6 5 — 2 7Portfolio — 7 8 6 7 5 6 7 — 6 5
—Data are not available.SOURCE: NACAC Admission Trends Surveys, 2007-08 through 2017–18.
TABLE 10. PERCENTAGE OF COLLEGES ATTRIBUTING “CONSIDERABLE IMPORTANCE” TO FACTORS IN ADMISSION DECISIONS: FIRST-TIME FRESHMEN, FALL 2007 TO FALL 2017
characteristics determined the relative level of importance assigned to some admission factors.
Institutional Control
• For each prospective student population, private colleges placed relatively more importance
on the essay/writing sample, the interview, counselor and teacher/professor recommendations, deomonstrated interest, and extracurricular activities.
• For first-time freshmen, public colleges valued admission test
scores more highly than private institutions.
• For transfer applicants, public colleges attributed more importance to the quality of prior postsecondary institution(s).

212018 STATE OF COLLEGE ADMISSION
CHAPTER 3
N Considerable Influence
Moderate Influence
Limited Influence
No Influence
FIRST-TIME FRESHMEN
High School Attended 166 3.6 18.1 36.7 41.6
Race/Ethnicity 169 2.4 13.0 20.7 63.9
State or County of Residence 165 1.2 7.9 23.6 67.3
First-generation Status 167 4.2 12.6 32.3 50.9
Ability to Pay 168 1.2 4.2 13.7 81.0
Gender 168 1.8 3.0 17.9 77.4
Alumni Relations 168 1.2 11.3 38.1 49.4
TRANSFER STUDENTS
High School Attended 162 2.5 6.8 27.8 63.0
Race/Ethnicity 164 1.2 11.0 20.7 67.1
State or County of Residence 161 1.9 5.6 20.5 72.0
First-generation Status 162 3.1 10.5 30.2 56.2
Ability to Pay 164 1.8 4.9 12.8 80.5
Gender 164 1.8 2.4 14.6 81.1
Alumni Relations 164 1.2 11.6 36.0 51.2
INTERNATIONAL STUDENTS (FIRST-TIME FRESHMEN)
High School Attended 161 4.3 17.4 31.7 46.6
Race/Ethnicity 163 1.2 8.0 17.2 73.6
State or County of Residence 161 1.9 11.2 24.8 62.1
First-generation Status 161 3.1 9.3 28.0 59.6
Ability to Pay 163 20.2 16.6 9.8 53.4
Gender 163 1.8 2.5 16.0 79.8
Alumni Relations 163 1.8 12.3 36.8 49.1
SOURCE: NACAC Admission Trends Survey, 2017–18.
TABLE 11. PERCENTAGE OF COLLEGES ATTRIBUTING DIFFERENT LEVELS OF INFLUENCE TO STUDENT CHARACTERISTICS IN ADMISSION DECISIONS: FALL 2017

22 NATIONAL ASSOCIATION FOR COLLEGE ADMISSION COUNSELING
CHAPTER 3
Enrollment
• Smaller colleges rated the interview, teacher/professor recommendations, and demonstrated interest more highly for each applicant group.
• For both domestic and international first-time freshmen applicants, smaller colleges gave more weight to total high school GPA and work in comparison to their larger counterparts.
• Grades in college prep courses and counselor recommendations were rated more highly by smaller colleges only for domestic first-time freshmen applicants.
Selectivity
• When evaluating applications from each student group, institutions that were more selective placed more emphasis on the essay, interview, and extracurricular activities.
• For both domestic and international first-time freshmen applicants, more selective colleges rated strength of curriculum and recommendations from counselors and teachers more highly.
• Grades in college prep courses and counselor recommendations were given more weight by selective colleges for domestic first-time freshmen only.
(See Appendix Table B.4. – B.6. for a correlation matrix of statistically significant associations.)
Student Characteristics as Contextual Factors in Admission Decisions for First-Time Freshmen, Transfer, and International Students, 2017Colleges were asked to rate the influence of certain student characteristics—race/ethnicity, first-generation status, high school attended, state or county of residence, gender, alumni relations, and ability to pay—in terms of how they affect evaluation of the main admission factors. Although, for the most part, college admission officers give very little importance to these characteristics, there are some findings worth noting (see Table 11).
For example, 22 percent of colleges rated the high school attended as at least moderately important in first-time freshmen admission decisions. Alumni relations was attributed some (at least limited) level of influence by 51 percent of colleges in admission decisions for both domestic and international first-time freshmen, and by 49 percent of colleges for transfer admission decisions. For international students, ability to pay was rated as a considerable influence at 20 percent of colleges, compared to only 1 percent for domestic freshmen and 2 percent for transfer students.
Interesting differences also were found in the relative importance given to these factors based on institution type. Data provided on the NACAC 2017–18 Admission Trends Survey allowed for comparison by institutional characteristics for each prospective student group—first-time freshmen, transfer students, and international students.
Institutional Control
• Private institutions gave more weight to race/ethnicity, gender, high school attended, and alumni relations when evaluating the applications of each student group.
• Private colleges gave greater consideration to ability to pay when evaluating first-time freshmen and transfer students.
Enrollment
• For all three prospective student groups, alumni relations was rated as having more influence in admission decisions for smaller colleges. For both first-time freshmen and transfer students, ability to pay was more influencial at smaller colleges.
• Larger colleges gave more weight to state, county, or country of residence for all three applicant groups.
Selectivity
• When evaluating applications from each student group, institutions that were more selective placed more emphasis on race/ethnicity, gender, first-generation status, state/county/country of residence, and high school attended.
• For transfer students, ability to pay was given more consideration by institutions with a more selective admission process.
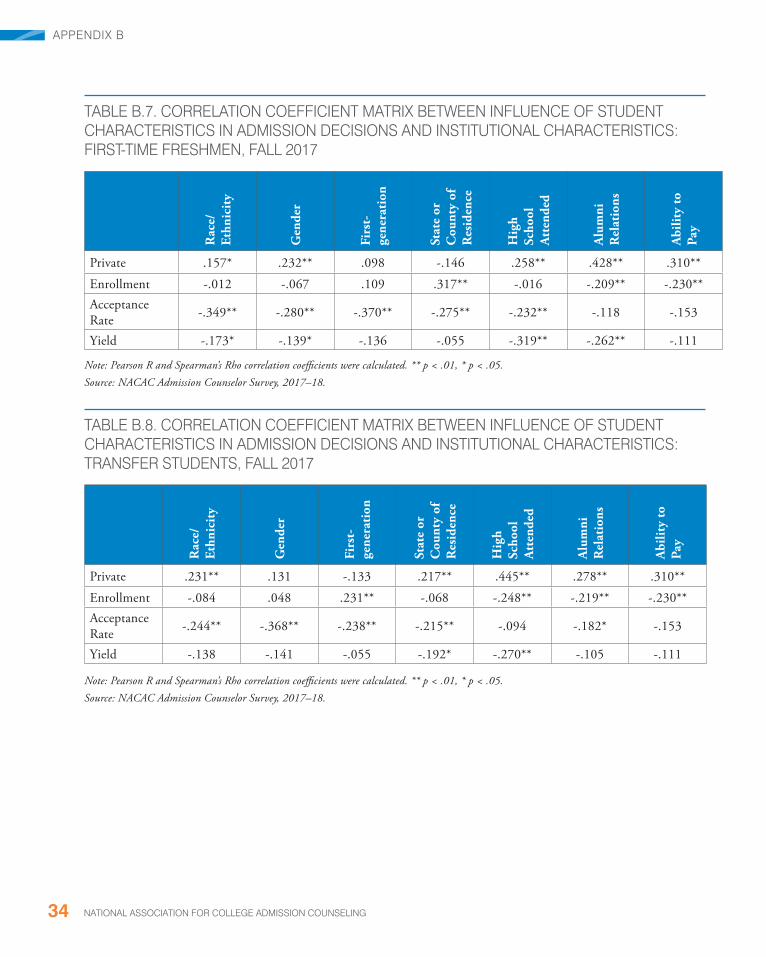
(See Appendix Tables B.7. – B.9. for complete correlation matrices of statistically significant associations.)
232018 STATE OF COLLEGE ADMISSION
04CHAPTER 4 SCHOOL COUNSELORS: ACADEMIC AND COLLEGE COUNSELING
IntroductionUsing data from NACAC’s 2017–18 Counseling Trends Survey, this chapter explores student-to-counselor ratios and college counseling activities.
NACAC’s Statement on Precollege Guidance and Counseling and the Role of the School Counselor defines precollege counseling as generally including activities that help students: 1) pursue the most challenging curriculum that results in enhanced postsecondary educational options; 2) identify and satisfy attendant requirements for college access; and 3) navigate the maze of financial aid, college choice, and other processes related to college application and admission.1
School counselors play a key role in assisting students through the transition to postsecondary education. By collaborating with school administrators, teachers, community representatives, government officials, and parents, school counselors can be significant assets throughout the college application and admission process.
Student-to-Counselor RatiosAccording to the US Department of Education, in 2015-16 each public school counselor (including pre-kindergarten, elementary, and secondary counselors) was responsible for overseeing 470 students, on average.2 US Department of Education data show that student-to-counselor ratios vary widely. Only two
states—New Hampshire and Vermont—had ratios below the 250-to-1 maximum ratio recommended by the American School Counselor Association.3 The states with the highest number of students per counselor included Arizona (902), Michigan (744), California (708), Minnesota (694), and Illinois (676).
(A list of average public school student-to-counselor ratios for all 50 states plus the District of Columbia can be found in Appendix Table B.10.)
Results of NACAC’s 2017–18 Counseling Trends Survey indicated the average student-to-counselor ratio for public secondary schools (ending in grade 12), taking into account part-time staff, was 268-to-1.
______________________________________________________
1 National Association for College Admission Counseling. (1990). Statement on Precollege Guidance and the Role of the School Counselor. Available at: https://www.nacacnet.org/globalassets/documents/advocacy-and-ethics/statement-of-principles-of-good-practice/roleofschlcounsnew.pdf.
2 US Department of Education. (2016). Common Core of Data State Nonfiscal Survey Public Elementary/Secondary Education: School Year, 2015–16 Version 1a. Washington, DC: NCES.
3 American School Counselor Association. (2016). The role of the school counselor. Alexandria, VA: ASCA.

24 NATIONAL ASSOCIATION FOR COLLEGE ADMISSION COUNSELING
CHAPTER 4
Data regarding the extent to which college advising is part of counselors’ job responsibilities showed the average student-to-college counselor ratio was 297-to-1.4
Public institutions assigned substantially more students to each counselor. There also were significant differences in the student-to-counselor and student-to-college counselor ratios by enrollment size (see Table 12).
Notably, 75 percent of private, non-parochial schools reported that they employed at least one counselor (full- or part-time) whose sole responsibility was to provide college counseling for students, compared to 58 percent of private, parochial schools, and only 33 percent of public schools. Schools with higher proportions of students eligible for free- and reduced-price lunch and those with higher student-to-counselor ratios also were less likely to have a dedicated college counselor.5
Staff Time for College CounselingPostsecondary admission counseling is one of many functions of school counselors. On average, the time that counselors in secondary schools spend on various tasks breaks down in the following way:
• Postsecondary admission counseling (30 percent)
• Choice and scheduling of high school courses (20 percent)
• Personal needs counseling (22 percent)
• Academic testing (12 percent)
• Occupational counseling and job placement (6 percent)
• Teaching (6 percent)
• Other non-guidance activities (5 percent)
However, the division of time among these tasks differs significantly based on school
______________________________________________________
4 The student-to-college counselor ratio is based on both the total number of counselors who exclusively provide college counseling for students and the total number who provide college counseling among other services for students. As such, it overestimates the focus on college counseling. Both full-time and part-time counselors were included in this calculation.
5 T\Chi-squared test for exclusive college counselor and: institution type (X2 (2) = 223.5, V = .343), p < .001; Correlation (Spearman’s Rho) for exclusive college counselor and: percent eligible for FRPL (.174), students per counselor (.398), p < .01.
STATES WITH HIGHEST AND LOWEST RATIOS
Vermont
195
California
708Arizona
902Minnesota
694Michigan
744
Illinois
676
New Hampshire
217
characteristics. For example, the counseling staff at private, non-parochial schools spent an average of 54 percent of their time on college counseling, compared to 39 percent at private, parochial schools, and only 21 percent at public schools. Counselors at schools with more students eligible for free- and reduced-price lunch spent less time on postsecondary admission counseling, as did those with larger enrollments and higher student-to-counselor ratios (see Table 13).

252018 STATE OF COLLEGE ADMISSION
CHAPTER 4
Students per Counselor
Students per College Counselor
Total 243 297
Type
Public 268 313
Private 188 263
Private non-parochial 181 254
Private parochial 198 276
Enrollment
Fewer than 500 students 179 213
500 to 999 283 341
1,000 to 1,499 282 340
1,500 to 1,999 304 389
2,000 or more students 338 466
Free and Reduced Price Lunch (FRPL)
0 to 25% of students eligible 215 285
26 to 50% 278 321
51 to 75% 277 311
76 to 100% 238 283
SOURCE: NACAC Counseling Trends Survey, 2017–18.NOTE: One-way ANOVAs showed there was a statistical difference between school type and: the number of students per counselor (F(2, 1,890) = 53.3, p < .001); the number of students per college counselor (F(2, 1889) = 10.8, p < .01). Correlation (Pearson R) for enrollment and: students per counselor (.323), students per college counselor (.347), p < .01.
TABLE 12. AVERAGE STUDENT-TO-COUNSELOR AND STUDENT-TO-COLLEGE COUNSELOR RATIOS, BY SCHOOL TYPE AND ENROLLMENT, 2017–18

26 NATIONAL ASSOCIATION FOR COLLEGE ADMISSION COUNSELING
CHAPTER 4
TABLE 13. PERCENTAGE OF TIME COUNSELING STAFF SPENT ON VARIOUS TASKS, BY SCHOOL CHARACTERISTICS: 2017–18
SOURCE: NACAC Counseling Trends Survey, 2017–18. Note: One-way ANOVAs showed there was a statistical difference between the percentage of time spent on college counseling and school type: F(2, 1881) = 539.5, p < .001. Correlation (Pearson R) for percentage of time spent on college counseling and: enrollment (-.133), percentage of students eligible for FRPL (-.446), student-to-counselor ratio (-.199), p < .01.
Post
seco
ndar
y ad
mis
sion
co
unse
ling
Cho
ice
and
sche
dulin
g of
hig
h sc
hool
cou
rses
Pers
onal
nee
ds
coun
selin
g
Aca
dem
ic te
stin
g
Occ
upat
iona
l co
unse
ling
and
job
plac
emen
t
Teac
hing
Oth
er n
on-
guid
ance
act
ivit
ies
All Schools 29.5% 20.1% 21.6% 12.2% 5.7% 5.5% 5.4%
Type
Public 21.4 23.0 25.2 13.2 6.8 4.9 5.6
Private 47.3 13.9 13.8 10.2 3.1 6.8 5.0
Private non-parochial 53.7 12.2 10.3 9.3 2.4 7.2 5.0
Private parochial 38.7 16.2 18.4 11.5 4.0 6.3 5.0
Enrollment
Fewer than 500 students 30.6 17.2 19.6 13.2 5.8 7.4 6.2
500 to 999 31.8 19.0 21.5 12.8 5.5 4.3 5.1
1,000 to 1,499 28.7 24.1 23.5 10.9 5.7 3.4 3.8
1,500 to 1,999 24.2 25.6 27.5 9.0 5.8 3.5 4.3
2,000 or more 20.0 29.5 25.6 9.6 5.5 4.2 5.6
Free and Reduced Price Lunch (FRPL)
0 to 25% of students eligible 38.5 17.9 18.9 10.5 4.5 5.3 4.4
26 to 50% 20.5 22.9 25.7 13.2 7.0 5.1 5.6
51 to 75% 19.7 22.0 24.0 15.3 6.8 5.5 6.6
76 to 100% 19.8 23.4 24.6 13.5 7.1 5.0 6.7
Students per Counselors
100 or fewer 35.4 16.2 19.4 11.3 5.1 7.3 5.2
101 to 200 34.9 18.8 19.9 11.3 5.1 5.4 4.7
201 to 300 25.7 21.4 23.4 12.9 6.2 4.8 5.8
301 to 400 22.0 24.4 23.5 13.6 6.1 5.3 5.1
401 to 500 23.5 21.3 24.0 12.3 6.8 4.0 8.2
More than 500 25.0 19.9 22.3 14.7 5.7 6.0 6.3
272018 STATE OF COLLEGE ADMISSION
APPENDIX A
The 2018 State of College Admission report primarily uses data collected from two annual NACAC surveys: Counseling Trends Survey (CTS) and Admission Trends Survey (ATS).
Counseling Trends Survey The purpose of NACAC’s annual Counseling Trends Survey (CTS) is to collect information from secondary school counselors and counseling departments about their priorities and work responsibilities, particularly as they relate to helping
APPENDIX A. METHODOLOGY
students transition to college; and their practices in communicating with students, parents, and colleges.
In May 2018, NACAC distributed the 2017–18 academic year CTS to a school counseling office staff member at 16,252 secondary schools ending in 12th grade. NACAC preference for respondents at each school started with the school counseling department chair, followed by school counselor, college placement advisor, and college advisor. The list of counselors was purchased from
MCH Strategic Data. The survey was administered online using SurveyMonkey. Responses were collected through the middle of June 2018.
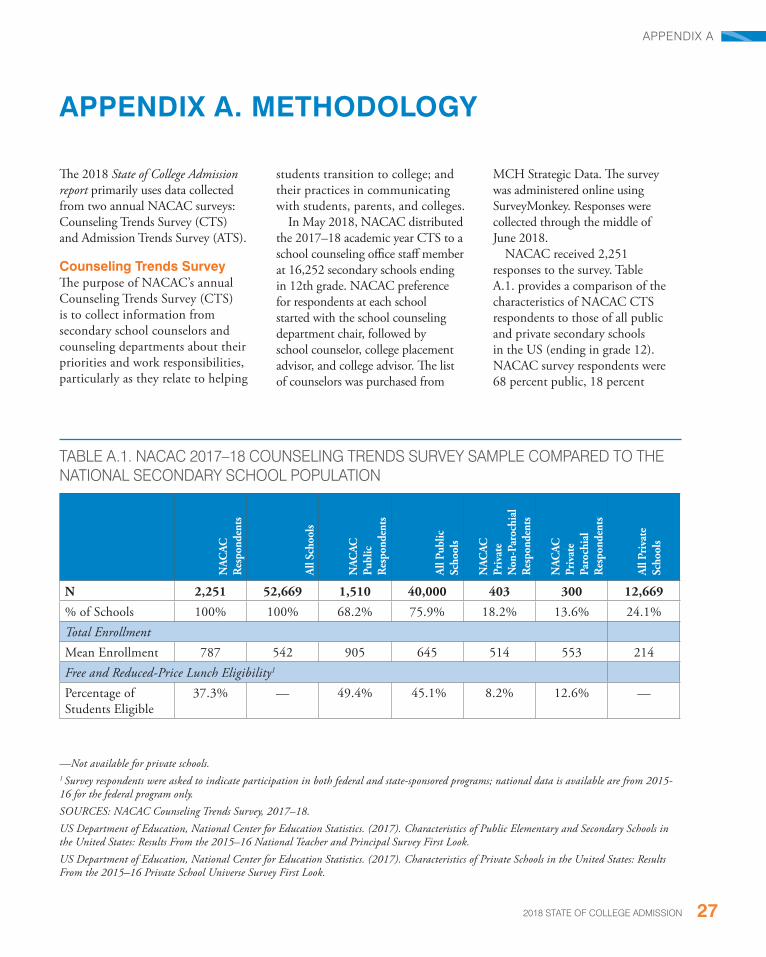
NACAC received 2,251 responses to the survey. Table A.1. provides a comparison of the characteristics of NACAC CTS respondents to those of all public and private secondary schools in the US (ending in grade 12). NACAC survey respondents were 68 percent public, 18 percent
NAC
ACR
espo
nden
ts
All S
choo
ls
NAC
AC
Publ
ic
Res
pond
ents
All P
ublic
Sc
hool
s
NAC
AC
Priv
ate
Non
-Par
ochi
al
Res
pond
ents
NAC
AC
Priv
ate
Paro
chia
l R
espo
nden
ts
All P
riva
teSc
hool
s
N 2,251 52,669 1,510 40,000 403 300 12,669
% of Schools 100% 100% 68.2% 75.9% 18.2% 13.6% 24.1%Total EnrollmentMean Enrollment 787 542 905 645 514 553 214Free and Reduced-Price Lunch Eligibility1
Percentage of Students Eligible
37.3% — 49.4% 45.1% 8.2% 12.6% —
—Not available for private schools.1 Survey respondents were asked to indicate participation in both federal and state-sponsored programs; national data is available are from 2015-16 for the federal program only. SOURCES: NACAC Counseling Trends Survey, 2017–18.US Department of Education, National Center for Education Statistics. (2017). Characteristics of Public Elementary and Secondary Schools in the United States: Results From the 2015–16 National Teacher and Principal Survey First Look. US Department of Education, National Center for Education Statistics. (2017). Characteristics of Private Schools in the United States: Results From the 2015–16 Private School Universe Survey First Look.
TABLE A.1. NACAC 2017–18 COUNSELING TRENDS SURVEY SAMPLE COMPARED TO THENATIONAL SECONDARY SCHOOL POPULATION

28 NATIONAL ASSOCIATION FOR COLLEGE ADMISSION COUNSELING
APPENDIX A
private non-parochial, and 14 percent private parochial, making the sample under-representative of public schools in favor of private, non-parochial schools. Among public schools, NACAC respondents were similar to the larger population in the percentage of students eligible for free or reduced-price lunch. NACAC survey respondents reported larger enrollments compared to all secondary schools.
Admission Trends SurveyNACAC conducts its annual Admission Trends Survey (ATS) to better understand admission processes at US colleges and universities. NACAC collects data related to application volume; application practices; the use of various enrollment management strategies,
including wait lists, Early Decision, and Early Action; the importance of various factors in the admission decision; and admission staffing. Since 2014, NACAC has expanded ATS to incorporate questions related to the admission process for prospective transfer and international students.
For the 2017–18 administration of the Admission Trends Survey, the questionnaire was divided into two parts—one set of questions was sent to university admission offices and another set to institutional research (IR) offices. Both portions were administered online using SurveyMonkey. The IR survey was e-mailed in February 2018 to 1,266 four-year postsecondary institutions. In August 2018, the admission office survey was sent to all 1,241 four-year postsecondary institutions that were NACAC members. Admission
NACAC Respondents All Colleges
NACAC Public Respondents
All Public Colleges
NACAC Private Respondents
All Private Colleges
N (%) 493 1,817 184 (37%) 579 (32%) 309 (70%) 1,238 (68%)
Total Full-Time Undergraduate Enrollment Mean Enrollment 6,204 3,947 12,716 8,602 2,557 1,768Selectivity and Yield (Percents)Mean Selectivity 64.4 65.4 67.9 69.3 62.3 63.5Mean Yield 27.9 33.6 32.0 34.0 25.3 33.4
NOTE: Data for all colleges was drawn from the 2016–17 Integrated Postsecondary Education Data System (IPEDS) using the following criteria: US location, four-year, not-for-profit, baccalaureate degree-granting, and Title IV-participating. Of the 1,817 total institutions, approximately 1,567 (86 percent) provided both selectivity and yield data for Fall 2013.SOURCES: NACAC Admission Trends Survey, 2017–18.US Department of Education, National Center for Education Statistics. (2016–17). Integrated Postsecondary Education Data System (IPEDS) Data Center. Washington, DC: NCES.
TABLE A.2. NACAC 2017–18 ADMISSION TRENDS SURVEY SAMPLE COMPARED TO NATIONAL COLLEGE POPULATION
offices also were asked to provide additional data if the IR portion had not been submitted. At the time of the survey, NACAC member institutions represented 70 percent of all degree-granting four-year, not-for-profit, baccalaureate degree-granting, Title-IV participating institutions in the US. NACAC received 493 responses, for an overall response rate of 39 percent. Of the 493 responses, 220 institutions submitted completed surveys (both admission and IR sections) and 273 submitted just the IR portion. All responses were utilized in the analyses.
As shown in Table A.2, NACAC 2017–18 ATS respondents had a similar average acceptance rate compared to all colleges, but private college respondents had lower yield rates when compared to the national average. NACAC survey respondents also had larger undergraduate enrollments.

292018 STATE OF COLLEGE ADMISSION
APPENDIX B. TABLES
Factor NConsiderable Importance
Moderate Importance
Limited Importance
No Importance
Email 160 87.5 11.9 — 0.6Website 160 85.0 11.9 2.5 0.6Hosted Campus Visit 160 81.3 15.0 3.1 0.6High School Counselor 160 63.8 30.0 6.3 —High School Visit (in the US) 160 58.8 34.4 6.3 0.6Direct Mail 160 48.1 36.9 13.1 1.9College Fairs 160 50.0 36.3 11.9 1.9Text Messaging 156 37.8 20.5 23.1 18.6Social Media 160 44.4 43.1 11.3 1.3Parents 160 64.4 24.4 9.4 1.9Online Advertising 158 29.1 30.4 27.2 13.3Community Based Organizations 159 20.1 33.3 40.9 5.7Test-Optional Policy 148 18.2 9.5 3.4 68.9Alumni 159 14.5 36.5 44.7 4.4Articulation Agreements with Community Colleges
144 7.6 9.0 22.2 61.1
Community College Outreach/Partnerships 145 9.7 9.0 29.0 52.4High School Visit (Outside the US) 143 9.8 7.7 15.4 67.1Conditional/Provisional Admission Program 152 7.9 18.4 27.0 46.7
SOURCE: NACAC Admission Trends Survey, 2017–18.
TABLE B.1. PERCENTAGE OF COLLEGES ATTRIBUTING DIFFERENT LEVELS OF IMPORTANCE TO VARIOUS RECRUITMENT STRATEGIES: FIRST-TIME FRESHMEN, FALL 2017
APPENDIX B

30 NATIONAL ASSOCIATION FOR COLLEGE ADMISSION COUNSELING
Factor NConsiderable Importance
Moderate Importance
Limited Importance
No Importance
Website 157 82.8 12.7 3.8 0.6Email 155 79.4 16.1 1.9 2.6Hosted Campus Visit 155 56.8 28.4 10.3 4.5High School Counselor 145 15.2 10.3 30.3 44.1High School Visit (in the US) 148 12.8 10.8 10.8 65.5Direct Mail 156 24.4 33.3 28.2 14.1College Fairs 154 24.0 35.1 32.5 8.4Text Messaging 151 31.8 17.9 25.8 24.5Social Media 157 30.6 46.5 20.4 2.5Parents 152 25.7 27.6 32.9 13.8Online Advertising 153 23.5 26.8 28.1 21.6Community Based Organizations 149 8.7 20.1 47.7 23.5Test-Optional Policy 141 5.0 10.6 7.1 77.3Alumni 155 10.3 25.2 50.3 14.2Articulation Agreements with Community Colleges
156 50.6 26.3 13.5 9.6
Community College Outreach/Partnerships 157 55.4 23.6 15.9 5.1High School Visit (Outside the US) 138 2.9 2.2 8.7 86.2Conditional/Provisional Admission Program 146 6.2 13.0 26.7 54.1
SOURCE: NACAC Admission Trends Survey, 2017–18.
TABLE B.2. PERCENTAGE OF COLLEGES ATTRIBUTING DIFFERENT LEVELS OF IMPORTANCE TO VARIOUS RECRUITMENT STRATEGIES: TRANSFER STUDENTS, FALL 2017
APPENDIX B

312018 STATE OF COLLEGE ADMISSION
Factor NConsiderable Importance
Moderate Importance
Limited Importance
No Importance
Website 153 85.6 13.1 1.3 —Email 151 84.1 12.6 2.0 1.3Hosted Campus Visit 146 29.5 21.9 29.5 19.2High School Counselor 148 31.8 30.4 19.6 18.2High School Visit (in the US) 140 8.6 15.7 29.3 46.4Direct Mail 152 7.2 7.9 38.2 46.7College Fairs 148 18.2 26.4 33.8 21.6Text Messaging 147 19.7 15.0 27.9 37.4Social Media 152 33.6 44.7 19.1 2.6Parents 150 42.0 27.3 18.7 12.0Online Advertising 148 16.2 23.0 33.1 27.7Community Based Organizations 140 7.9 12.9 29.3 50.0Test-Optional Policy 139 9.4 11.5 11.5 67.6Alumni 152 11.2 27.0 49.3 12.5Articulation Agreements with Community Colleges
135 8.1 14.1 21.5 56.3
Community College Outreach/Partnerships 137 10.2 11.7 21.9 56.2High School Visit (Outside the US) 150 26.7 24.7 21.3 27.3Conditional/Provisional Admission Program 142 8.5 16.2 28.2 47.2International Student Recruitment Agents 159 15.1 15.1 49.7 20.1Partnerships with International Colleges/Universities
159 19.5 18.9 37.7 23.9
State or Regional Recruitment Consortium 158 5.7 14.6 44.9 34.8Federal Government Support 158 6.3 17.1 43.7 32.9Foreign Government Support 157 12.1 26.8 39.5 21.7Pathways Programs 157 12.1 14.6 47.8 25.5
—No institutions in category. SOURCE: NACAC Admission Trends Survey, 2017–18.
TABLE B.3. PERCENTAGE OF COLLEGES ATTRIBUTING DIFFERENT LEVELS OF IMPORTANCE TO VARIOUS RECRUITMENT STRATEGIES: INTERNATIONAL STUDENTS (FIRST-TIME FRESHMEN), FALL 2017
APPENDIX B

32 NATIONAL ASSOCIATION FOR COLLEGE ADMISSION COUNSELING
Tota
l Hig
h Sc
hool
GPA
Gra
des
in
Col
lege
Pr
ep
Cou
rses
Stre
ngth
of
Cur
ricu
lum
Adm
issi
on
Test
Sco
res
Ess
ay/
Wri
ting
Sa
mpl
e
Inte
rvie
w
Private .134 .157* .067 -.208** .186* .468**
Enrollment -.218** -.252** .007 .149 .036 -.381**Acceptance Rate .020 -.171* -.170* .120 -.323** -.179*Yield -.102 -.202* -.261** .165* -.092 -.117
NOTES: Pearson R and Spearman’s Rho correlation coefficients were calculated. * p < .05, ** p < .01.SOURCE: NACAC Admission Trends Survey, 2017–18.
TABLE B.4. CORRELATION MATRIX BETWEEN PERCENTAGE OF COLLEGES ATTRIBUTING DIFFERENT LEVELS OF IMPORTANCE TO SELECT ADMISSION DECISION FACTORS AND INSTITUTIONAL CHARACTERISTICS: FIRST-TIME FRESHMEN, FALL 2017
Cou
nsel
or
Rec
.
Teac
her
Rec
.
Dem
onst
rate
d In
tere
st
Wor
k
Extr
a-cu
rric
ular
s
Private .330** .350** .322** .076 .161*Enrollment -.209** -.242** -.248** .177* .057Acceptance Rate -.187* -.186* -.028 -.393** -.319**Yield -.316** -.304** -.105 -.152 -.168*
Tota
l Hig
h Sc
hool
GPA
Gra
des
in
Col
lege
Pr
ep
Cou
rses
Stre
ngth
of
Cur
ricu
lum
Adm
issi
on
Test
Sco
res
Ess
ay/
Wri
ting
Sa
mpl
e
Inte
rvie
w
Private .030 -.011 .255** .262** .437** .468**
Enrollment .062 .025 -.153 -.035 -.383** -.381**Acceptance Rate .040 -.037 -.118 -.248** -.051 -.179*Yield -.183* -.160* -.252** -.192* -.151 -.117
TABLE B.5. CORRELATION MATRIX BETWEEN PERCENTAGE OF COLLEGES ATTRIBUTING DIFFERENT LEVELS OF IMPORTANCE TO SELECT ADMISSION DECISION FACTORS AND INSTITUTIONAL CHARACTERISTICS: TRANSFER, FALL 2017
APPENDIX B
Continues.

332018 STATE OF COLLEGE ADMISSION
NOTES: Pearson R and Spearman’s Rho correlation coefficients were calculated. * p < .05, ** p < .01.SOURCE: NACAC Admission Trends Survey, 2017–18.
Cou
nsel
or
Rec
.
Teac
her
Rec
.
Dem
onst
rate
d In
tere
st
Wor
k
Extr
a-cu
rric
ular
s
Private .397** .411** .366** .150 .243**Enrollment -.323** -.276** -.299** .111 -.019Acceptance Rate -.093 -.101 .042 -.332** -.230**Yield -.147 -.218** -.143 -.165 -.154
TABLE B.5. (CONT.) CORRELATION MATRIX BETWEEN PERCENTAGE OF COLLEGES ATTRIBUTING DIFFERENT LEVELS OF IMPORTANCE TO SELECT ADMISSION DECISION FACTORS AND INSTITUTIONAL CHARACTERISTICS: TRANSFER, FALL 2017
Tota
l Hig
h Sc
hool
GPA
Gra
des
in
Col
lege
Pr
ep
Cou
rses
Stre
ngth
of
Cur
ricu
lum
Adm
issi
on
Test
Sco
res
Ess
ay/
Wri
ting
Sa
mpl
e
Inte
rvie
w
Private .096 .101 .122 .234** .416** .468**
Enrollment -.156* -.147 -.021 -.038 -.378** -.381**Acceptance Rate .016 -.132 -.167* -.202* -.140 -.179*Yield -.133 -.276** -.317** -.185* -.248** -.117
NOTES: Pearson R and Spearman’s Rho correlation coefficients correlation coefficients were calculated. * p < .05, ** p < .01.SOURCE: NACAC Admission Trends Survey, 2017–18.
TABLE B.6. CORRELATION MATRIX BETWEEN PERCENTAGE OF COLLEGES ATTRIBUTING DIFFERENT LEVELS OF IMPORTANCE TO SELECT ADMISSION DECISION FACTORS AND INSTITUTIONAL CHARACTERISTICS: INTERNATIONAL STUDENTS (FIRST-TIME FRESHMEN), FALL 2017
Cou
nsel
or
Rec
.
Teac
her
Rec
.
Dem
onst
rate
d In
tere
st
Wor
k
Extr
a-cu
rric
ular
s
Private .253** .314** .310** .044 .165*Enrollment -.111 -.188* -.234** .166* .062Acceptance Rate -.223** -.187* -.050 -.370** -.257**Yield -.236** -.218** -.122 -.080 -.162*
APPENDIX B
34 NATIONAL ASSOCIATION FOR COLLEGE ADMISSION COUNSELING
Rac
e/
Ethn
icit
y
Gen
der
Firs
t-ge
nera
tion
Stat
e or
C
ount
y of
R
esid
ence
Hig
h Sc
hool
A
tten
ded
Alu
mni
R
elat
ions
Abi
lity
to
Pay
Private .157* .232** .098 -.146 .258** .428** .310**
Enrollment -.012 -.067 .109 .317** -.016 -.209** -.230**Acceptance Rate -.349** -.280** -.370** -.275** -.232** -.118 -.153
Yield -.173* -.139* -.136 -.055 -.319** -.262** -.111
TABLE B.7. CORRELATION COEFFICIENT MATRIX BETWEEN INFLUENCE OF STUDENT CHARACTERISTICS IN ADMISSION DECISIONS AND INSTITUTIONAL CHARACTERISTICS: FIRST-TIME FRESHMEN, FALL 2017
Note: Pearson R and Spearman’s Rho correlation coefficients were calculated. ** p < .01, * p < .05.Source: NACAC Admission Counselor Survey, 2017–18.
Rac
e/
Ethn
icit
y
Gen
der
Firs
t-ge
nera
tion
Stat
e or
C
ount
y of
R
esid
ence
Hig
h Sc
hool
A
tten
ded
Alu
mni
R
elat
ions
Abi
lity
to
Pay
Private .231** .131 -.133 .217** .445** .278** .310**
Enrollment -.084 .048 .231** -.068 -.248** -.219** -.230**Acceptance Rate -.244** -.368** -.238** -.215** -.094 -.182* -.153
Yield -.138 -.141 -.055 -.192* -.270** -.105 -.111
TABLE B.8. CORRELATION COEFFICIENT MATRIX BETWEEN INFLUENCE OF STUDENT CHARACTERISTICS IN ADMISSION DECISIONS AND INSTITUTIONAL CHARACTERISTICS: TRANSFER STUDENTS, FALL 2017
Note: Pearson R and Spearman’s Rho correlation coefficients were calculated. ** p < .01, * p < .05.Source: NACAC Admission Counselor Survey, 2017–18.
APPENDIX B

352018 STATE OF COLLEGE ADMISSION
Rac
e/
Ethn
icit
y
Gen
der
Firs
t-ge
nera
tion
Stat
e or
C
ount
y of
R
esid
ence
Hig
h Sc
hool
A
tten
ded
Alu
mni
R
elat
ions
Abi
lity
to
Pay
Private .164* .251** .103 .044 .256** .456** .114
Enrollment -.043 -.093 .046 .168* -.038 -.241** -.151Acceptance Rate -.290** -.260** -.371** -.252** -.216** -.096 -.094
Yield -.159 -.134 -.123 -.091 -.306** -.254** -.240**
TABLE B.9. CORRELATION COEFFICIENT MATRIX BETWEEN INFLUENCE OF STUDENT CHARACTERISTICS IN ADMISSION DECISIONS AND INSTITUTIONAL CHARACTERISTICS: INTERNATIONAL STUDENTS (FIRST-TIME FRESHMEN), FALL 2017
Note: Pearson R and Spearman’s Rho correlation coefficients were calculated. ** p < .01, * p < .05.Source: NACAC Admission Counselor Survey, 2017–18.
APPENDIX B

36 NATIONAL ASSOCIATION FOR COLLEGE ADMISSION COUNSELING
State Total Enrollment CounselorsStudents
per Counselor
Alabama 743,789 1,758 423Alaska 132,477 308 430Arizona 1,107,161 1,228 902Arkansas 492,132 1,303 378California 6,226,543 8,800 708Colorado 899,112 2,392 376Connecticut 537,933 1,167 461Delaware 134,847 320 422District of Columbia 83,439 172 486Florida 2,792,234 5,770 484Georgia 1,757,237 3,690 476Hawaii 181,995 634 287Idaho 292,277 500 584Illinois 2,035,008 3,011 676Indiana 1,046,685 1,964 533Iowa 508,014 1,218 417Kansas 495,884 956 519Kentucky 686,598 1,553 442Louisiana 718,711 1,828 393Maine 181,474 564 322Maryland 879,601 2,361 373Massachusetts 964,026 2,349 410Michigan 1,536,010 2,064 744Minnesota 864,384 1,246 694Mississippi 487,166 1,120 435Missouri 919,155 2,637 349Montana 145,319 449 324Nebraska 316,014 831 380Nevada 467,527 965 485New Hampshire 179,682 828 217New Jersey 1,407,384 3,814 369New Mexico 335,694 713 471New York 2,711,626 6,921 392North Carolina 1,544,934 4,124 375
TABLE B.10. PUBLIC SCHOOL STUDENT-TO-COUNSELOR RATIOS, BY STATE: 2015–2016
Continues.
APPENDIX B

372018 STATE OF COLLEGE ADMISSION
TABLE B.10. (CONT.) PUBLIC SCHOOL STUDENT-TO-COUNSELOR RATIOS, BY STATE: 2015–2016
State Total Enrollment CounselorsStudents
per Counselor
North Dakota 108,631 359 303Ohio 1,716,585 3,881 442Oklahoma 692,878 1,611 430Oregon 576,378 1,127 511Pennsylvania 1,717,405 4,317 398Rhode Island 142,014 335 424South Carolina 763,533 2,079 367South Dakota 134,061 346 388Tennessee 1,000,171 2,980 336Texas 5,301,477 11,943 444Utah 647,870 — —Vermont 87,866 451 195Virginia 1,283,590 3,334 385Washington 1,087,030 2,131 510West Virginia 277,452 731 380Wisconsin 867,800 1,891 459Wyoming 94,717 — —
SOURCE: US Department of Education. (2017). Common Core of Data State Nonfiscal Survey Public Elementary/Secondary Education Survey: School Year, 2015-16 Version 1a. Washington, DC: NCES.
APPENDIX B

38 NATIONAL ASSOCIATION FOR COLLEGE ADMISSION COUNSELING
The use of multiple admission plans by colleges and universities often results in confusion among students, parents, and college admission counseling professionals. NACAC believes institutions must clearly state policies, and counselors are advised to assist students with their understanding of the various admission decision options. The following information outlines agreed-upon definitions and conditions, included in the Statement of Principles of Good Practice: NACAC’s Code of Ethics and Professional Practices.1
Standard application plans
Regular Decision: Students submit their applications by a specified deadline and are notified of a decision within a clearly stated period of time.
Rolling Admission: Students apply at any time after a college begins accepting applications until a final closing date, which may be as late as the start of the term for which they are applying. Students are notified of a decision as their applications are completed and are reviewed.
Early application plan
Early Action (EA): Students apply by an earlier deadline to receive a decision in advance of the college’s Regular Decision notification date. Students will not be asked to accept the college’s offer of admission or to submit a deposit prior to May 1.
Restrictive early application plans
Early Decision (ED): Students commit to a first-choice college and, if admitted, agree to enroll and withdraw their other college applications. Colleges may offer ED I or II with different deadlines. This is the only application plan where students are required to accept a college’s offer of admission and submit a deposit prior to May 1.
Restrictive/Single Choice Early Action (REA): Students apply to a college of preference and receive a decision in advance of its Regular Decision noti- fication date. Colleges place certain restrictions on applying under other early application plans . Stu- dents admitted under Restrictive Early Action are not obligated to accept the college’s offer of admission or to submit a deposit prior to May 1.
APPENDIX C. EARLY DECISION AND EARLY ACTION DEFINED
______________________________________________________
1 NACAC’s Statement of Principles of Good Practice: NACAC’s Code of Ethics and Professional Practices is available online at: www.nacacnet.org/SPGP.
APPENDIX C

392018 STATE OF COLLEGE ADMISSION
NOTES
____________________________________________________________________________________________________
____________________________________________________________________________________________________
____________________________________________________________________________________________________
____________________________________________________________________________________________________
____________________________________________________________________________________________________
____________________________________________________________________________________________________
____________________________________________________________________________________________________
____________________________________________________________________________________________________
____________________________________________________________________________________________________
____________________________________________________________________________________________________
____________________________________________________________________________________________________
____________________________________________________________________________________________________
____________________________________________________________________________________________________
____________________________________________________________________________________________________
____________________________________________________________________________________________________
____________________________________________________________________________________________________
____________________________________________________________________________________________________
____________________________________________________________________________________________________
____________________________________________________________________________________________________
____________________________________________________________________________________________________
____________________________________________________________________________________________________
____________________________________________________________________________________________________
____________________________________________________________________________________________________
