melita schuster, do mike lafontaine, phd marian university college of osteopathic medicine...
TRANSCRIPT

Mel i ta Schuster, DOMike LaFonta ine , PhD
Marian Univers i tyCo l lege o f Osteopath ic Medic ine
Deconstructing Diets

Why do we care about diet?
Obesity is a risk factor in most of the leading causes of death in the US.
Diet and Exercise influence many of these as well.
Top Ten Causes of Death in the US Heart Disease Cancer Chronic Respiratory Diseases Accident Alzheimer’s Disease Diabetes Kidney Disorders Influenza and Pneumonia Suicide
From CDC

Obesity in the United States
1985
-6 States with greater than 10% obesity
1994
-First year with data from all 50 states
-50 states with greater than 10% obesity
-No state with greater than 20% obesity
2005
-Only Colorado with less than 20% obesity
2009
-Last year for Colorado under 20%

ENERGY METABOLITES AND BIOMOLECULAR BUILDING
BLOCKS.Carbohydrates
LipidsProteins/Amino Acid
VITAMINS AND MINERALSVariety of uses, but NOT an energy source.
Nutritional Components

Simple Sugars Complex Carbohydrates
Carbohydrates

Carbohydrates in Diet
Complex carbohydrates require digestion, slowly enter circulation.
Simple sugars are rapidly absorbed.
Excess blood glucose increases fat storage, increased glycosylation of LDLs. Simple Sugar
Complex Carbohydrate

Dietary Proteins and Amino Acids
Typically require 0.8g/kg/day
Protein toxicity can occur with as little as 2g/kg/day in individuals with pre-existing renal disease.
Animal derived proteins typically have sufficient spectrum of amino acid content.
Grains lack lysine, legumes low in methionine.
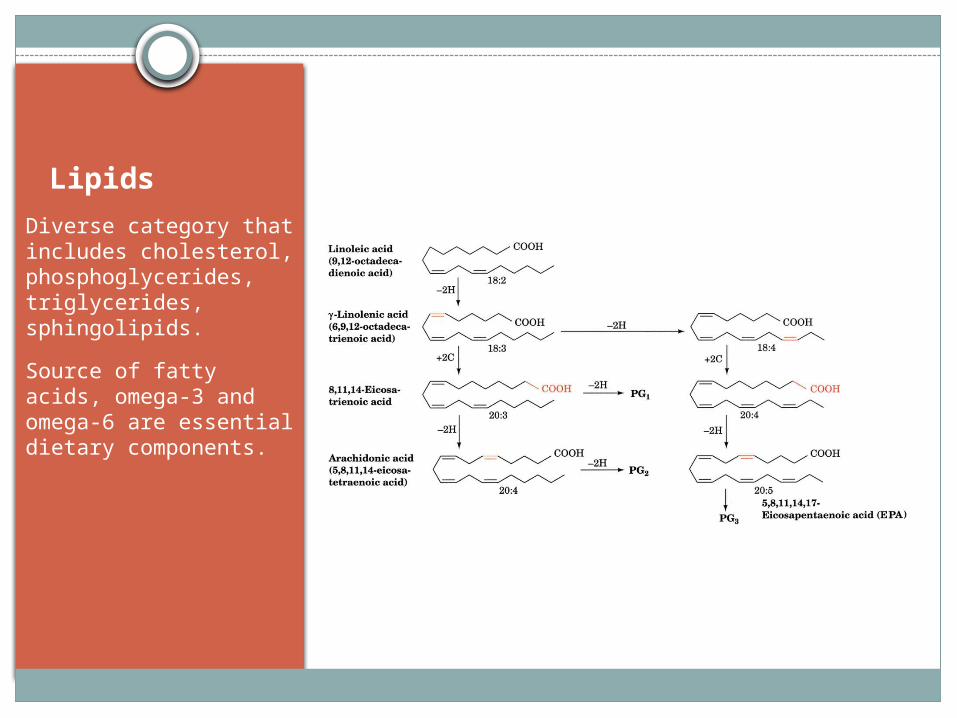
Lipids
Diverse category that includes cholesterol, phosphoglycerides, triglycerides, sphingolipids.
Source of fatty acids, omega-3 and omega-6 are essential dietary components.

Dietary Fats and Prostaglandins, Thromboxanes, and Leukotrienes.
Dietary intake influences precursors for synthesis of prostaglandins, thromboxanes, and leukotrienes.

Hormonal Role in Hunger
Cholecystokinin
Short-term satiety signal released from I-cells.
Leptin
Satiety signal released from adipose tissue.
Ghrelin
First identified circulating hunger-inducing hormone. Released from fundus and pancreatic epsilon cells.
NPY neuron
GI L
NPY

What Diet Is Best?
Weight Watchers
Zone
Atkins
Jenny CraigFlexitarian
LEARNVolumetrics
Mediterranean diet
Anti-Inflammatory diet
TLC diet
Engine 2 Diet
Biggest Loser diet
Eco-Atkins
Flat Belly diet
Spark Solution diet South Beach
diet
Macrobiotic
Raw Food diet
Slimfast
Acid Alkaline diet
Nutrisystem
New Glucose Revolution
Paleo Dukan
DASH
Mayo Clinic dietOrnish
Vegetarian
Vegan

The Debate
What type of diet is most effective for losing weight? Those that emphasize protein? Those that emphasize carbohydrates? Those that emphasize fats?
Variable studies: some show benefit with low-CHO, high-protein diets over high-CHO, low-fat diets, but other studies do not show this effect.
Other studies have shown benefit with vegetarian (high CHO, low fat) over conventional high CHO, low fat diet
Low fat vs. moderate fat: mixed reviews

Let’s Look at Some Studies

ARTICLE:
“Comparison of the Atkins, Zone, Ornish, and LEARN Diets for Change in Weight and Related Risk Factors Among Overweight Premenopausal Women: The A to Z Weight Loss Study: A Randomized Trial”
JAMA 2007
Outcomes: Weight loss Lipid profile Body fat Waist-hip ratio Fasting insulin and glucose levels Blood pressure
JAMA. 2007;297(9):969-977.doi:10.1001/
jama.297.9.969.

RESULTS
Atkins: lost more weight and experienced more favorable overall metabolic effects at 12 months.
Weight loss: (at 12 months) Atkins: 4.7kg LEARN 2.6kg Ornish 2.2kg Zone: 1.6kg

Date of download: 4/30/2014Copyright © 2014 American Medical Association.
All rights reserved.
From: Comparison of the Atkins, Zone, Ornish, and LEARN Diets for Change in Weight and Related Risk Factors Among Overweight Premenopausal Women: The A TO Z Weight Loss Study: A Randomized Trial
JAMA. 2007;297(9):969-977. doi:10.1001/jama.297.9.969
Baseline values were carried forward for any missing values. The overall diet group × time interaction was significant (P<.001). The analysis of variance test for differences among diet groups in weight change from baseline was significant at 2 and 6 months (P<.001), and at 12 months (P = .01). Analyses of all pairwise differences by the Tukey standardized range test (<.05) indicate that the Atkins diet group was significantly different than all other diet groups at 2 and 6 months and that the Atkins diet group was significantly different than the Zone diet group at 12 months. There were no significant differences among the Zone, LEARN, or Ornish diet groups at any time point. Error bars indicate standard error of the mean.
Figure Legend:

Mean Changes in Outcomes at 12 Months
Atkins Zone LEARN Ornish P value
Body mass
-1.65 -.53 -.92 -.12 0.01
Body fat %
-2.9 -1.3 -1.0 -1.5 0.07
Waist/hip ratio
-0.019 -0.013 -o.009 -0.012 .10
LDL-C 0.8 0.0 0.6 -3.8 .49
HDL-C 4.9 2.2 2.8 0 0.002
TG -29.3 -4.2 -14.6 -14.9 .01
Non HDLc
-5.1 -0.5 -4.0 -6.8 .36
Insulin -1.8 -1.5 -1.8 -0.2 .17
Glucose -1.8 -1.2 0.5 -0.8 .54
Systolic BP
-7.6 -3.3 -3.1 -1.9 <.001
Diastolic BP
-4.4 -2.1 -2.2 -0.7 .009

Very Low CHO diet vs. Calorie Restricted Low Fat diet
2003 study on very low CHO diet and calorie restricted low fat diet: (53 patients)
Very low CHO: lost more weight and body fat than the low fat diet.
Over 6 months: no deleterious effects noted for CV risks
Blood pressure, Glucose, lipids, Insulin : same changes in both groups
(J Clin Endocrinol Metab 88:1617–1623, 2003)

2005: Comparison Atkins, Ornish, Weight Watchers, Zone
2005 JAMA: (161#) Weight loss:
Atkins: 2.1kg Zone: 3.2kg Weight Watchers: 3.3kg Ornish 3.3kg
Each diet decreased LDL/HDL ratio by 10%. No effect on BP and glucose
JAMA. 2005;293(1):43-53. doi:10.1001/jama.293.1.43.
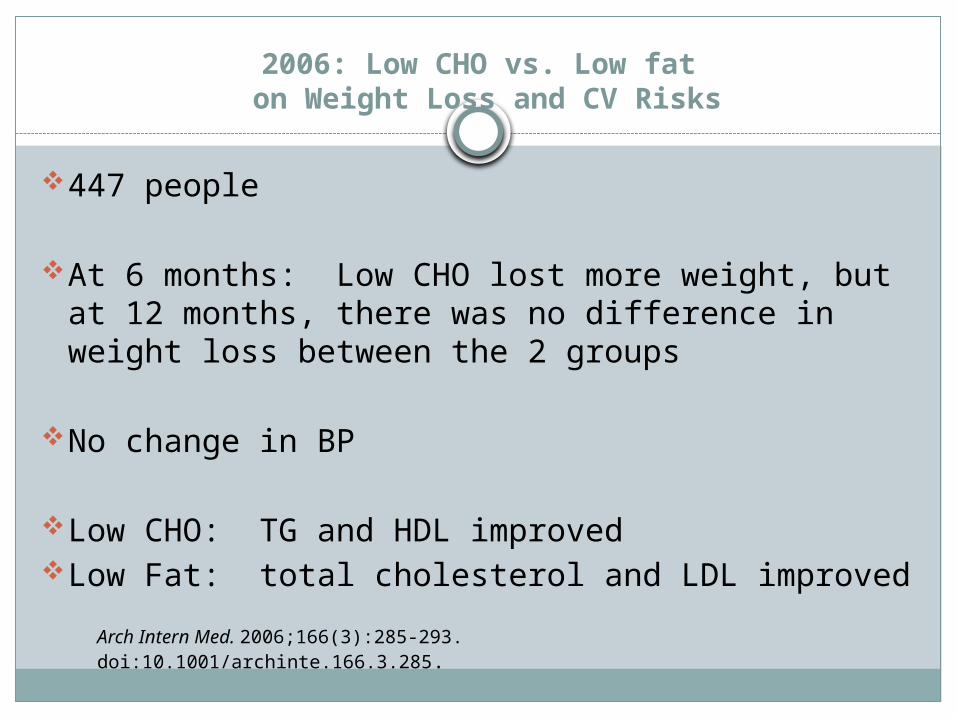
2006: Low CHO vs. Low fat on Weight Loss and CV Risks
447 people
At 6 months: Low CHO lost more weight, but at 12 months, there was no difference in weight loss between the 2 groups
No change in BP
Low CHO: TG and HDL improvedLow Fat: total cholesterol and LDL improvedArch Intern Med. 2006;166(3):285-293. doi:10.1001/archinte.166.3.285.

Conclusion:
“Low-carbohydrate, non–energy-restricted diets appear to be at least as effective as low-fat, energy-restricted diets in inducing weight loss for up to 1 year.
However, potential favorable changes in triglyceride and high-density lipoprotein cholesterol values should be weighed against potential unfavorable changes in low-density lipoprotein cholesterol values when low-carbohydrate diets to induce weight loss are considered.”
Arch Intern Med. 2006;166(3):285-293. doi:10.1001/archinte.166.3.285

“Effect of an energy-restricted, high-protein, low-fat diet relative to a conventional high-carbohydrate, low-fat diet on weight loss, body composition, nutritional status, and markers of cardiovascular health in obese women.”
2005 study
Weight loss: both diets: 7.3# in 12 weeks
High protein diet: Decreased TG Decreased body fat
Both diets improved LDL, HDL, glucose, insulin, C-reactive protein
Conclusion: “An energy-restricted, high-protein, low-fat diet provides nutritional and metabolic benefits that are equal to and sometimes greater than those observed with a high-carbohydrate diet.”
Am J Clin Nutr. 2005 Jun;81(6):1298-306

“A Dietary Quality Comparison of Popular Weight-Loss Plans”
Compared: New Glucose Revolution: low glycemic index Weight Watchers: point system based on energy, fat, fiber Atkins: low CHO, high fat diet (4 phases) South Beach: 3 phases (recommends certain CHO and fats) Zone: reduced CHO, low energy diet 40% CHO, 30%protein,
30% fat Ornish: <10% from fat. All animal products are excluded 2005 US Dept of Agriculture Food Guide Pyramid
Dietary quality was measured by the Alternate Healthy Eating Index (AHEI)
Purpose of study: compared dietary quality as well as other nutrients associated with CVD
J Am Diet Assoc. Oct. 2007: 107(10): 1786-1791

Dietary quality is defined as the degree to which a diet reduces risk for CVD disease
Obesity is associated with an increased risk for CV disease
Given that obesity is a risk factor for CVD, a weight loss plan that is optimal will not only facilitate weight loss, but will reduce CVD reduction.

AHEI
Was developed to improve the Health Eating IndexAHEI is twice as strong a predictor of CVD over the
HEINine components:
Fruit Vegetables Nuts and soy Ratio of white to red meat Ceral fiber Trans fat Ratio of polyunsaturated fat to saturated fat Alcohol Duration of multivitamin use
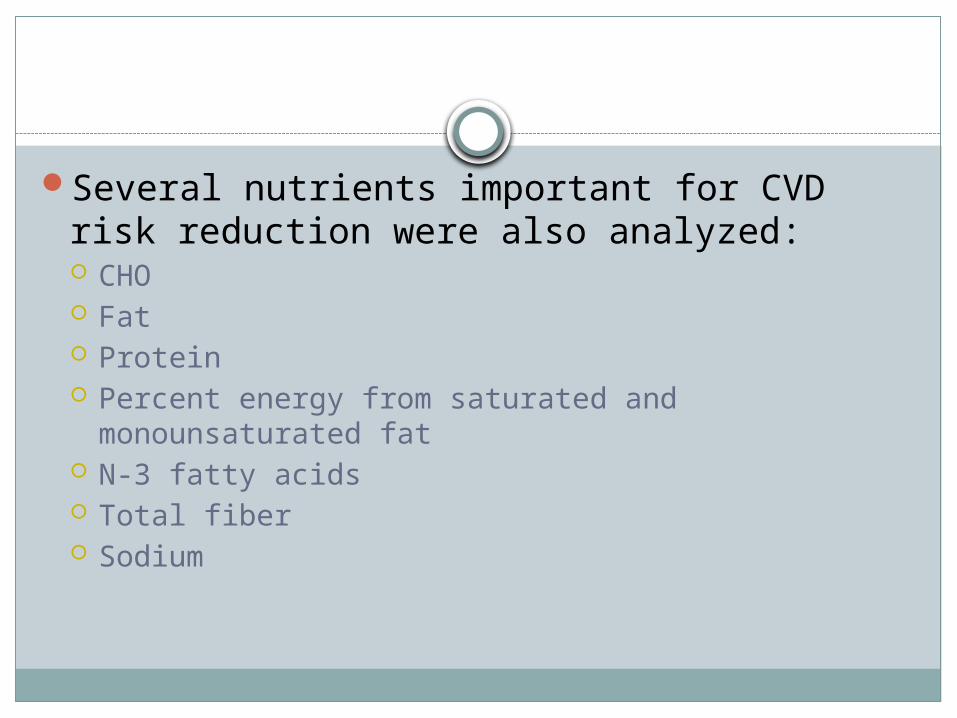
Several nutrients important for CVD risk reduction were also analyzed: CHO Fat Protein Percent energy from saturated and monounsaturated
fat N-3 fatty acids Total fiber Sodium
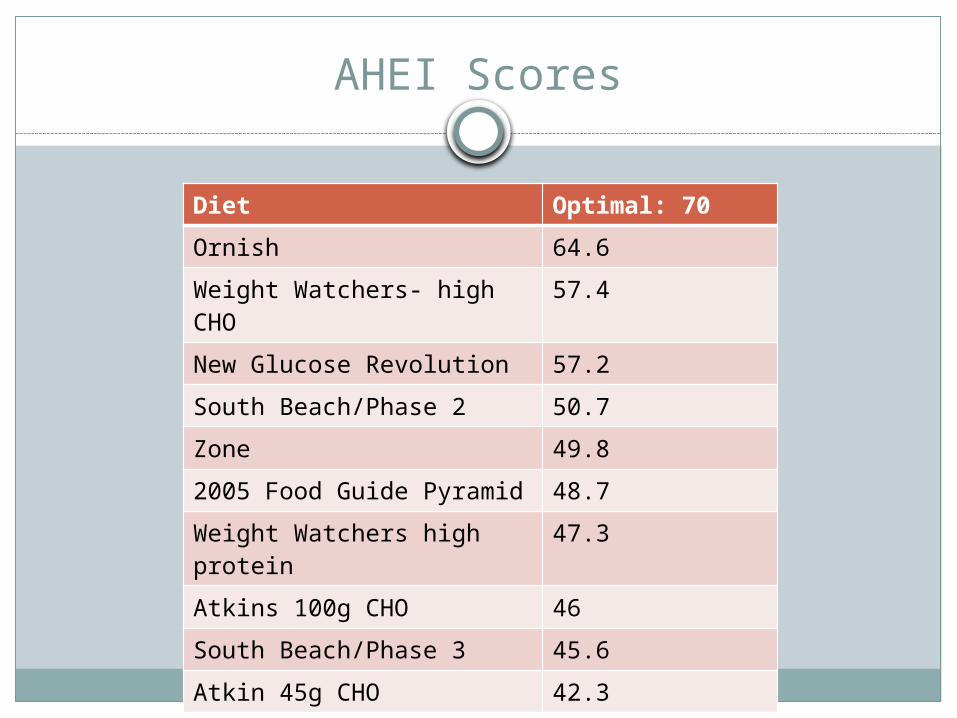
AHEI Scores
Diet Optimal: 70
Ornish 64.6
Weight Watchers- high CHO
57.4
New Glucose Revolution 57.2
South Beach/Phase 2 50.7
Zone 49.8
2005 Food Guide Pyramid 48.7
Weight Watchers high protein
47.3
Atkins 100g CHO 46
South Beach/Phase 3 45.6
Atkin 45g CHO 42.3

HEI vs. AHEI
HEI: created at first to identify dietary factors associated with reduced CVD risk and to evaluate a plan’s potential to improve lipid levels and obesity.
It did not predict CVD mortality however because it did not distinguish between the different types of CHO and fats
AHEI: found to be twice as good at predicting CVDHow is this helpful? The AHEI may help to establish
long term plans for weight loss and thus affecting CVD risks as well.
Most plans can lose weight in the short term, but it’s the long term effects over time that matters.

OmniHeart Study
Compared 3 diets: Carbohydrate-rich diet, similar to the DASH diet; Diet rich in protein, approximately half from plant
sources; Diet rich in unsaturated fat, predominantly
monounsaturated fat.Goal: all 3 diets are low in saturated fat. The
study looked at blood pressure and serum lipids
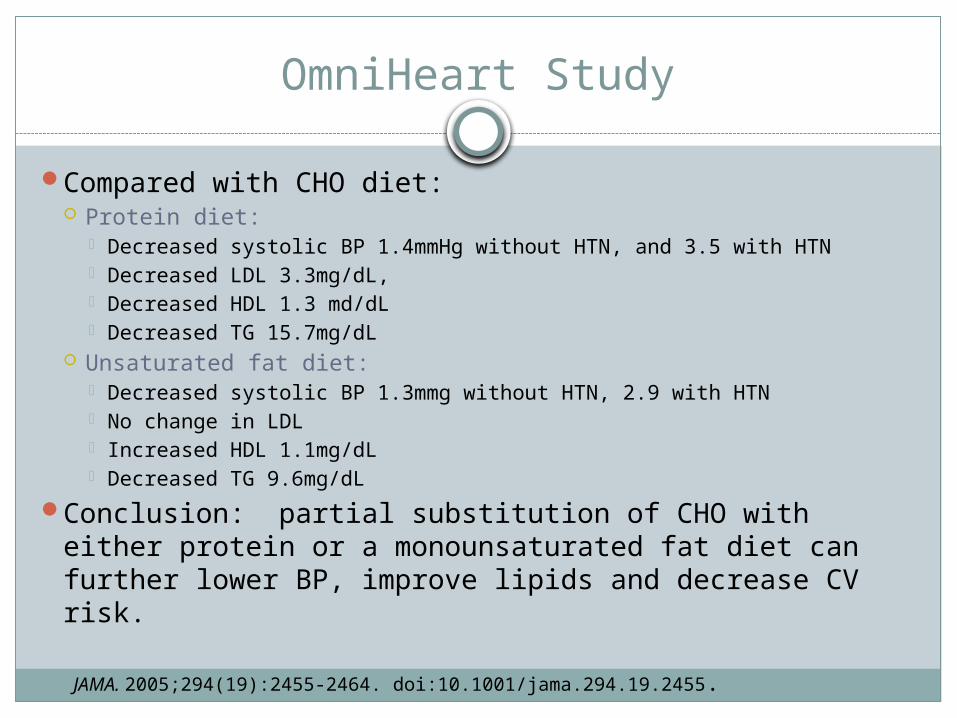
OmniHeart Study
Compared with CHO diet: Protein diet:
Decreased systolic BP 1.4mmHg without HTN, and 3.5 with HTN Decreased LDL 3.3mg/dL, Decreased HDL 1.3 md/dL Decreased TG 15.7mg/dL
Unsaturated fat diet: Decreased systolic BP 1.3mmg without HTN, 2.9 with HTN No change in LDL Increased HDL 1.1mg/dL Decreased TG 9.6mg/dL
Conclusion: partial substitution of CHO with either protein or a monounsaturated fat diet can further lower BP, improve lipids and decrease CV risk.
JAMA. 2005;294(19):2455-2464. doi:10.1001/jama.294.19.2455.

Lyon Heart Study
300 subjectsStudy stopped early because of benefits on
heart disease50-70% lower risk of recurrent heart diseaseThis is a secondary prevention trial
Circulation. 2001;103:1823-1825

PREDIMED Study
Primary Prevention of Cardiovascular Disease with a Mediterranean Diet
Studied efficacy of 2 Mediterranean diets: One supplemented with extra virgin olive oil and the
other supplemented with nuts. Compared with low fat diet
Conclusion: the results supported a Mediterranean diet for primary prevention of cardiovascular disease
N Engl J Med 2013; 368:1279-1290April 4, 2013DOI: 10.1056/NEJMoa1200303
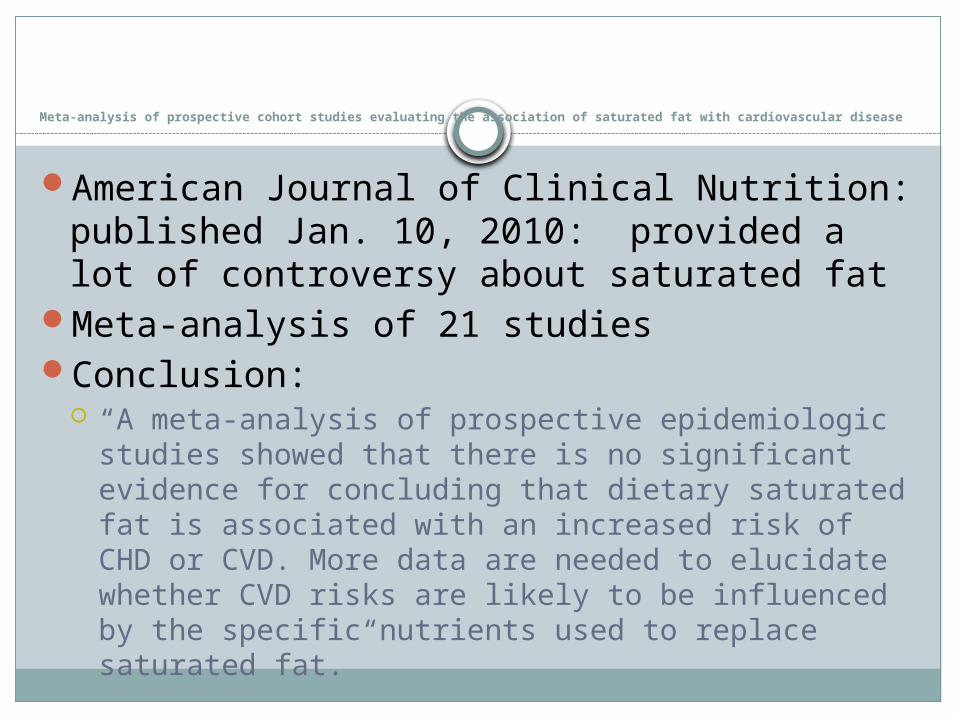
Meta-analysis of prospective cohort studies evaluating the association of saturated fat with cardiovascular disease
American Journal of Clinical Nutrition: published Jan. 10, 2010: provided a lot of controversy about saturated fat
Meta-analysis of 21 studiesConclusion:
“A meta-analysis of prospective epidemiologic studies showed that there is no significant evidence for concluding that dietary saturated fat is associated with an increased risk of CHD or CVD. More data are needed to elucidate whether CVD risks are likely to be influenced by the specific nutrients used to replace saturated fat.”

DASH Diet

“Comparison of Weight-Loss Diets with Different Compositions of Fat, Protein and Carbohydrates”
811 overweight subjectsAssigned to 4 dietsStudy : 2 yearsPrimary outcome: change in body weight
after 2 years comparing different diets
N Engl J Med 2009: 360: 859-873, Feb. 26, 2009

Diets Studied:
Diet Fat Protein CHO
1: low fat, average protein
20% 15% 65%
2: low fat, high protein
20% 25% 55%
3: high-fat, average protein
40% 15% 45%
4: high fat, high protein
40% 25% 35%

BMI 25-40-30-70 years old-2x2 factorial design: 2 diets low-fat, 2 diets high-fat, and
2 diets were average protein, and 2 were high protein-<8% saturated fat, 20 g fiber/day, 150mg cholesterol per
1000 kcalDiets were randomized, daily meal plans provided-deficit of 750 kcal per day from baselineGroup sessions/individual sessionsPhysical activity goal: 90 minutes moderate exercise per
weekBody weight and waist circumference measures

Primary outcome: change in body weight over 2 year period
Secondary outcome: change in waist circumferenceNote:
Most of the weight loss occurred in first 6 months (6.5kg) After 12 months, all groups on average, slowly regained body
weight 23% continued to lose weight from 6 months to 2 years
At 2 years: 31-37% had lost at least 5% of initial body weight 14-15% had lost at least 10% of their initial weight 2-4% lost 20kg or more

All diets reduced risk factors for CV disease and diabetes at 6 months and 2 years
The 2 low fat diets and highest CHO diet decreased LDL more than the high fat diet or lowest CHO diet
Lowest CHO diet increased HDL more than High CHO diet
All diets decreased TG similarlySerum insulin levels: all diets except high CHOBP decreased 1-2mmHg in all dietsMetabolic syndrome: present in 32% at start and
after 2 years 19-22% overall

HDL: increased in the lowest CHO diet than in highest CHO diet
Attendance at group sessions strongly predicted weight loss at 2 years
Principal finding: Diets were equally successful in promoting weight loss
that was clinically meaningful Adherence to the diets was the most challenging
Conclusion: “Reduced calorie diets result in clinically meaningful
weight loss regardless of which macronutrients they emphasize.”

Mean Change in Body Weight and Waist Circumference from Baseline to 2 Years According to Dietary Macronutrient Content.
Sacks FM et al. N Engl J Med 2009;360:859-873.

So what does this mean?
When looking at the studies, there is not clear evidence that one diet prevails over another for weight loss.
There are strong studies regarding the Mediterranean diet in both primary and secondary prevention in cardiovascular disease.

So what advice do I give to patients?
There are lots of “fad” diets out there. Become familiar with the popular diets and
be ready to discuss them with your patient. The key is finding something that the patient
will adhere to and stay withDIET is a 4 letter word and is not allowed!Rather, “lifestyle changes” is the goal!

US News and World Report: Best Diets
Best Diets OverallBest Weight LossBest Diabetes DietsBest Heart Healthy DietsBest Commercial Diet PlansBest Diets for Healthy EatingEasiest Diets to FollowBest Plant Based Diets

USDA Food Guide Pyramid
The original pyramid did not point the way to healthy eating
In 2005 it was replaced with My Pyramid: the old pyramid turned on it’s side, but it was vague and confusing
June 2011: replaced it with My PlateThe plate still falls short on the nutrition
advice they need to choose healthy diets.

Healthy Eating Pyramid/Healthy Eating Plate
Developed by Harvard School of Public Health, updated in 2008
Developed the Healthy Eating Plate to replace My Plate (2011)
Based on best available scientific evident about links between diet and health
The pyramid has a foundation of daily exercise and weight control.
Simple rule of energy balance: Weight change = calories in – calories out

Problems
Nutrition advice by law must be considered for revision every 5 years
Government seeks a panel of expertsThe panelists are subject to intense lobbying from
National Dairy Council, United Fresh Fruit and Vegetable Association, the Soft Drink Assn, the American Meat Institute, the National Cattlemen’s Beef Assn, the Salt Institute, and the Wheat Foods Council.
The guidelines can determine what food products Americans buy and determine how billions of dollars are spent.


“Can We Say What Diet is Best for Health?”
Drs. Katz and Dr. Meller: Ann Rev Public Health 2014. 34:83-103
There have been no long term studies comparing diets
The weight of evidence supports a theme of healthful eating, with variations among this theme.
Compared: Low CHO, Low fat, Low glycemic, Mediterranean, Mixed balanced, paleolithic, vegan, other

If diet denotes a set of rigid principles, then, no, we can’t say what diet is best.
However, if by diet, we mean a more general dietary pattern, then yes, we can say what diet is best:
Evidence supports: Diets consisting of minimally processed foods Diet of foods mostly direct from nature Diets with exaggerated emphasis on any one nutrient
or food is ill advised Diets need to consist of a complete dietary pattern

New Evidence: March 2014
“Fruit and vegetable consumption and all-cause, cancer and CVD mortality: analysis of Health Survey for England data” J Epidemiol Community Health doi: 10.1136/jech-
2013-203500 An inverse association exists between fruit and
vegetable consumption and mortality Benefits seen in up to 7+ portions daily

Fruit and vegetable consumption: associated with reduced cancer and CV mortality
Vegetables may have a stronger association with mortality than fruit
Fresh vegetables were most protective, while frozen/canned fruit showed increased mortality
Eating 7 or more portions of fruit and vegetables can reduce the risk of death by 42%
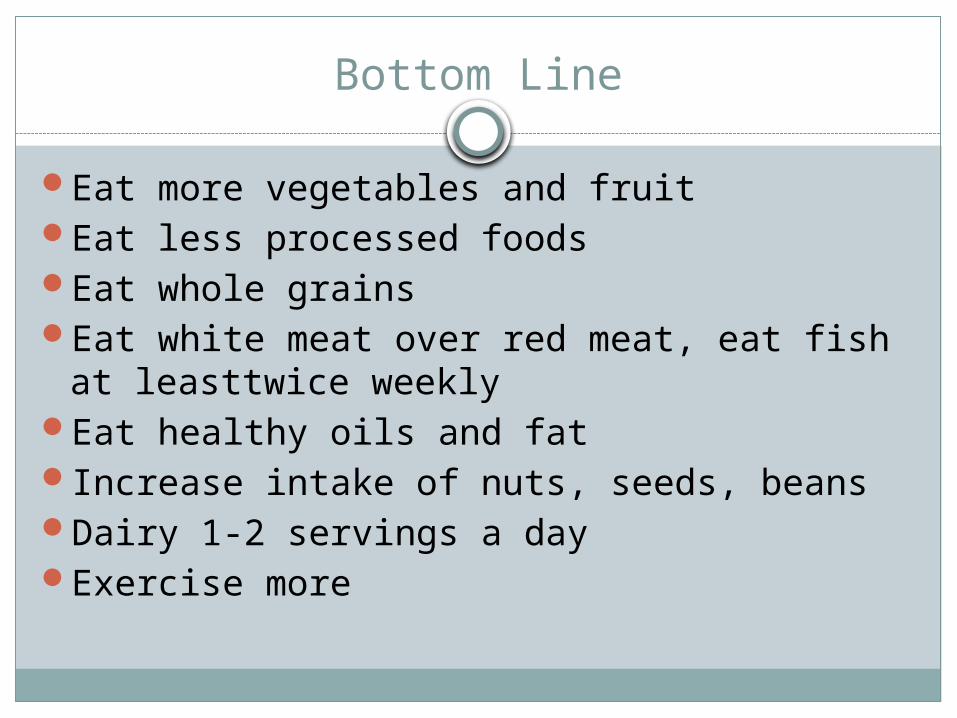
Bottom Line
Eat more vegetables and fruitEat less processed foodsEat whole grainsEat white meat over red meat, eat fish at
leasttwice weeklyEat healthy oils and fatIncrease intake of nuts, seeds, beansDairy 1-2 servings a dayExercise more

THANK YOU!
Questions?