melt inclusion evidence for magma evolution at mutnovsky volcano
TRANSCRIPT

Melt inclusion evidence for magma evolution at Mutnovskyvolcano, Kamchatka
K. ROBERTSON1, A . S IMON2, T. PETTKE3 , E . SMITH1, O. SELYANGIN4 , A . KIRYUKHIN5 ,
S . R . MULCAHY6 AND J . D. WALKER7
1Department of Geoscience, University of Nevada Las Vegas, Las Vegas, NV, USA; 2Department of Earth and Environmental
Sciences, University of Michigan, Ann Arbor, MI, USA; 3Institute of Geological Sciences, University of Bern, Bern,
Switzerland; 4Research Geotechnological Center, Far Eastern Division, Russian Academy of Sciences, Petropavlovsk-
Kamchatsky, Russia; 5Institute of Volcanology and Seismology Far East Branch, Russian Academy of Sciences, Petropavlovsk-
Kamchatsky, Russia; 6Department of Earth and Planetary Science, University of California Berkeley, Berkeley, CA, USA;7Department of Geology, University of Kansas, Lawrence, KS, USA
ABSTRACT
Mutnovsky Volcano, located in Kamchatka, Russia, is a young volcano that has formed a series of four overlap-
ping stratocones over its approximately 80 ka history. Erupted products at Mutnovsky range in composition from
basalts to dacites; basalts are the most common. In this study, melt inclusions from representative samples of all
erupted compositions from all four eruptive centers were analyzed to investigate the causes of the compositional
heterogeneity, melt evolution, and pre-eruptive magma dynamics. Melt inclusions from Mutnovsky were sampled
in olivine, plagioclase, orthopyroxene, and clinopyroxene. The melt inclusion data represent a wide range of melt
compositions, from basalt through rhyolite. Geochemical modeling of melt inclusion data, combined with field
evidence and chemical zoning of plagioclase phenocrysts, indicates that fractional crystallization and magma mix-
ing produced the range of erupted bulk rock compositions. The measured variability of melt inclusion composi-
tions in each host mineral phase indicates that different host minerals trapped unique melts that evolved
separately from one another. The melt inclusion data suggest that individual melt portions evolved by fractional
crystallization, perhaps in different magma chambers, within the Mutnovsky plumbing system, and were mixed
prior to eruption. Our data do not indicate whether the mixing events were the cause of eruption or are simply
the manifestation of the eruption process.
Key words: amphibole sponge, fractional crystallization, magma mixing, melt inclusion, partial melt, slab input,
underplated basalt, volcano
Received 11 August 2012; accepted 26 July 2013
Corresponding author: Adam Simon, Department of Earth and Environmental Sciences, University of Michigan,
2534 C.C. Little Building, 1100 N. University Avenue, Ann Arbor, MI 48109-1005, USA.
Email: [email protected]. Tel: +734 647 4245. Fax: +734 763 4690.
Geofluids (2013) 13, 421–439
INTRODUCTION
Arc volcanoes provide geochemical insight into the nature
of material transfer from ocean lithosphere and overlying
meta-sediments to the mantle and crust during subduction,
hence placing constraints on the cycling of material
among mantle, crust, and atmosphere (Manning 2004).
The fundamental geologic processes that result in the
formation of arc-related volcanic rocks, from partial melt-
ing of the mantle wedge above subducting ocean litho-
sphere to degassing-induced eruption, have been relatively
well constrained through a combined approach of field,
laboratory, and computational efforts (Putirka & Tepley
2008). What is lacking, however, is a general consensus on
the specific causes of compositional diversity (i.e., hetero-
geneity) observed among magmas erupted from individual
volcanoes. For example, it seems well recognized that com-
posite stratovolcanoes in continental arcs commonly erupt
magmas that are volumetrically dominated by one bulk
composition. That is, erupting dominantly basalt, andesite,
dacite, or rhyolite. However, the observation that arc vol-
canoes commonly erupt a range of compositions has stimu-
lated efforts to constrain the origin of these compositional
variations. A number of hypotheses have been put forth to
© 2013 John Wiley & Sons Ltd
Geofluids (2013) 13, 421–439 doi: 10.1111/gfl.12060

explain the eruption of compositionally diverse magmas
from individual volcanoes, that is, volcanoes erupted within
individual arc segments and volcanoes in distinct arc set-
tings (Plank & Langmuir 1988). These include formation
and ascent of unique aliquots of magma in the mantle,
each produced by variable degrees of partial melting from
of the mantle (Bacon et al. 1997), variable extents of mix-
ing, assimilation, storage, and homogenization of magmas
at the base of variably thickened crust (Leeman,1983;
Hildreth & Moorbath 1988; Annen et al. 2006), physical
and chemical mixing of magmas in mid- to upper-crustal
magma chambers (Kent et al. 2010), and variable contri-
butions from direct melting of the subducted slab (e.g.,
Kay 1978; Defant & Drummond 1990; Yogodzinski et al.
1995; Bryant et al. 2010).
Historically, a major challenge to investigating the com-
positional variability of magmas erupted from individual
volcanoes arose from the fact that one could sample only
the solidified end products of arc volcanism. That is, the
pre-eruptive silicate melt portion was accessible only for
magmas that erupted largely in their liquid state and
quenched to a glass. Over the past few decades, the recog-
nition that aliquots of silicate liquid are trapped as melt
inclusions in growing crystals has facilitated acquisition of
data that provide insight into the compositional variability
of silicate melts within and among individual erupted mag-
mas (Anderson 1976; Kent 2010). As such, melt inclusions
have become an increasingly important tool for improving
our understanding of the magmatic processes responsible
for compositional diversity among erupted magmas. Melt
inclusions provide much more detailed samples of melt
compositions than we can gain with whole-rock analyses
alone. The chemical composition of melt inclusions dem-
onstrate that melts within individual volcanic systems are
much more diverse than originally thought (e.g., Charlier
et al. 2007), that magma mixing in near-surface magma
chambers may be an important source of compositional
change and eruption triggering (Kent et al. 2010 and ref-
erences therein), and that there can be multiple popula-
tions of compositionally distinct melts present within one
volcanic system (Halter et al. 2004a). Melt inclusions also
provide the best possibility to determine quantitatively the
pre-eruptive volatile contents of melts, and how these are
related to degassing and eruption processes (Blundy &
Cashman 2005; Wallace 2005; M�etrich & Wallace 2008).
In this study, we take advantage of melt inclusions to
explore the compositional diversity among erupted mag-
mas from Mutnovsky Volcano, Kamchatka, a volcano in a
young, continental arc, which has erupted basalt, basaltic
andesite, andesite, and dacite. Mutnovsky is volumetrically
dominated by basalt and basaltic andesite, and discrete
eruptions of intermediate to felsic magmas have erupted
over the approximately 80 ka life of the volcano (Selyangin
1993). We quantified the major, minor, and trace element
chemistry, not including volatiles, of 215 melt inclusions
from 15 different whole-rock samples representing the
complete whole-rock compositional spectrum from Mut-
novsky. The measured Nd, Sr, and Pb isotope abundances
for the whole-rock samples (143Nd/144Nd ranges from
0.513060 to 0.513083, 87Sr/86Sr ranges from 0.703335
to 0.703387 206, Pb/204Pb ranges from 18.315 to
18.361, and 207Pb/204Pb ranges from 15.468 to 15.497)
demonstrate that the magmas are not affected by assimila-
tion of exotic material, and all share a common source.
This obviates the need to back out compositional changes
introduced by assimilation of rocks external to the magma
plumbing system.
The melt inclusion data provide information about com-
positionally discrete melt populations, how the different
melt populations relate to progressive magma evolution,
and how they are related to the phenocryst phases in Mut-
novsky samples. The relationship of the melt inclusion
compositions to whole-rock compositions elucidates the
importance of magmatic differentiation processes such as
fractional crystallization and magma mixing and improves
our understanding of the origin of the diversity of igneous
rocks.
GEOLOGICAL SETTING
Mutnovsky Volcano is a part of the Eastern Volcanic Front
in southern Kamchatka, about 75 km southwest of Petro-
pavlovsk-Kamchatsky (Fig. 1). Mutnovsky formed over the
past 80 ka by eruptions related to four stratocones,
referred to as Mutnovsky I, II, III, and IV. The eruptive
centers have been placed in a relative time sequence, with
Mutnovsky I the oldest and Mutnovsky IV the youngest,
based on glacial deposits and tephrochronology. There are
no radiogenic ages for Mutnovsky. The majority of the
erupted products in all the stratocones are basalt and basal-
tic andesite; however, Mutnovsky I, II, and III also
erupted andesite and dacite. A more detailed description of
Mutnovsky’s geologic setting is found in Robertson
(2011) and Selyangin (1993, 2009).
SAMPLE SELECTION AND METHODS
This article focuses on the chemistry of melt inclusions
from a subset of samples for which the whole-rock and
mineral chemistry were described in detail in Robertson
(2011). A total of 50 whole-rock samples were collected
from across the eruptive centers Mutnovsky I (oldest) to
IV (youngest). We petrographically characterized thin sec-
tions from all whole-rock samples and analyzed all whole-
rock samples for major and trace element abundances
(Robertson 2011). Whole-rock chemistry was performed
by crushing, pulverizing, and then powdering with a steel
disk mill a representative portion of each whole-rock
© 2013 John Wiley & Sons Ltd, Geofluids, 13, 421–439
422 K. ROBERTSON et al.

sample to ensure complete sample homogenization before
geochemical analysis. Major and trace element abundances
were quantified using inductively coupled plasma mass
spectrometry (ICP-MS) on whole-rock powders at Activa-
tion Laboratories, Ltd. in Ontario, Canada. Major element
abundances were determined using lithium metaborate/
tetraborate fusion of rock powders and analysis on either a
combination simultaneous/sequential Thermo-Jarrell-Ash
ENVIRO II or a Varian Vista 735 ICP-MS. Trace element
abundances were determined using lithium metaborate/
tetraborate fusion of rock powders, which were analyzed
by a Perkin Elmer Sciex ELAN 6000, 6100, or 9000
ICP-MS.
We used a JEOL JXA-8900 SuperProbe electron probe
microanalyzer (EPMA) to quantify the compositions of
plagioclase and pyroxene in all thin sections (Robertson
2011). Plagioclase analyses were performed with a 15 kV
accelerating voltage, a 10 nA Faraday cup current, and a
beam diameter of 5 lm for each spot. Line traverses were
set up across plagioclase grains, from rim to rim, with
7 lm spacing between spots (from the center of one spot
to the center of the next). Monte Carlo simulations of the
energy distribution for these EPMA beam conditions indi-
cate that >98% of the absorbed energy is retained within
the 5 lm spot size. Pyroxene analyses were performed with
a 15 kV accelerating voltage, a 10 nA Faraday cup current,
and a beam diameter of 10 microns for most crystals. We
used an appropriately sized beam for crystals measuring
<10 microns in maximum diameter. Most pyroxene crystals
were only large enough for one analysis per crystal, but
two analyses, core and rim, were performed on crystals lar-
ger than approximately 20 microns. The larger crystals
(i.e., >20 microns) displayed no measurable compositional
zoning, based on core and rim analyses and back-scattered
electron (BSE) imaging.
After petrographic characterization of thin sections for
all whole-rock samples, we selected 15 samples for the pur-
pose of our melt inclusion study. Four samples from Mut-
novsky I, II, and III, and three samples from Mutnovsky
IV were selected. The samples from Mutnovsky I, II, and
III include a basalt, basaltic andesite, andesite, and dacite,
and from Mutnovsky IV include two basalts and a basaltic
andesite. In each case, samples were selected to represent
the range of compositions present in each eruptive center
and for containing the greatest number of petrographically
discernible melt inclusions that met the criteria for LA-
ICP-MS analysis, described below.
We prepared new, double polished 200 lm thick sec-
tions from each of the 15 selected whole-rock samples.
Melt inclusions were selected from olivine, clinopyroxene,
orthopyroxene, and plagioclase, which together constitute
the major phenocryst phases among the Mutnovsky sam-
ples. The size of phenocrysts ranged from approximately
200 to approximately 3000 microns in diameter. Most
melt inclusions were recrystallized, but some partially de-
vitrified and purely glassy inclusions with a shrinkage bub-
ble were also identified and analyzed (Fig. 2). Only those
inclusions that measured ≥10 lm in diameter, located no
deeper in their host mineral than the melt inclusion diame-
ter (i.e., a 10 lm diameter inclusion was not deeper than
≤10 lm below the host mineral surface), and not exposed
at the surface of the thick section were targeted for analy-
sis, following principles outlined in Pettke (2006). When-
ever possible, melt inclusion assemblages (Halter et al.
2004a,b; Bodnar & Student 2006) were analyzed to pro-
vide multiple samples of the same generation of melt,
which is assumed to have been locally compositionally uni-
form at the time of inclusion assemblage formation. Care
was taken to avoid melt inclusions with obvious signs of
postentrapment modification such as alteration, leakage, or
proximity to cracks and/or cleavage traces. Melt inclusions
were not rehomogenized before analysis.
Entire, unexposed melt inclusions were analyzed using
LA-ICP-MS at the University of Bern, Switzerland. The
system is comprised of a GeoLas-Pro 193 nm ArF Excimer
laser ablation system (Lambda Physik, Germany) combined
with an Elan DRC-e quadrupole ICP-MS (Perkin Elmer,
Canada). Individual melt inclusion transient signals were
deconvolved from the host mineral signal using the proce-
dure developed and described by Halter et al. (2002,
2004b) and reviewed and evaluated in Heinrich et al.
156º 162º 168º
60º
KliuchevskoiKarymskyAvachinsky
Shiveluch
55º
50º
168º162º156º
50º
55º
60ºSea ofOkhotsk
Sred
inny
Ran
ge
Cent
ral K
amch
atka
Dep
ress
ion
East
ern
Volca
nic
Fron
t
Aleutian trench
Pacific subduction8.1 cm/yr
Kurile
-Kam
chatk
a tre
nch
Mutnovsky
Fig. 1. Schematic map of the Kamchatka peninsula showing the location of
subduction and major volcanic centers, including Mutnovsky. Subduction
rate from Moore et al. (1992).
© 2013 John Wiley & Sons Ltd, Geofluids, 13, 421–439
Evolution of Mutnovsky Volcano, Kamchatka 423

(2003), Pettke et al. (2004, 2012), and Pettke (2006)
through use of the Signal Integration for Laboratory Laser
Systems (SILLS) program (Guillong et al. 2008). The data
reduction strategy yields an uncertainty for each element of
the analyte menu for each melt inclusion and host pheno-
cryst, as described below.
Melt inclusion signal intervals were chosen manually for
each inclusion by visually examining the entire major and
trace element transient signal. Trace elements such as Zr,
Y, and Ce provided the best evidence for distinguishing
the melt inclusion portion of each transient signal relative
to the phenocryst host (Fig. 3). Compositions of the host
minerals and the mixed host plus inclusion signal intervals
were quantified by summing to 100% oxides (Leach &
Hieftje 2000; Halter et al. 2002). An internal standard is
required to determine the analysis-specific mass fraction of
inclusion relative to host mineral in the mixed inclusion
plus host signal interval of each LA-ICP-MS transient sig-
nal to calculate the pure melt inclusion composition. We
comprehensively evaluated four data reduction approaches.
Whole-rock values of K2O and MnO were finally employed
as internal standards: K2O for olivine- and pyroxene-hosted
melt inclusions and MnO for plagioclase-hosted melt inclu-
sions. These elements were chosen because they are incom-
patible in the host minerals for which they were used. The
data reduction approaches that we evaluated were (a) using
whole-rock values of Al2O3 for all melt inclusions (e.g.,
Aud�etat and Pettke, 2003, who employed it for highly
evolved systems); (b) using Al2O3 whole-rock values for
olivine and pyroxene and MgO whole-rock values for pla-
gioclase (e.g., Halter et al. 2002); (c) using Fe-Mg KD val-
ues; and (d) using the fractionation trends method of
Zajacz & Halter (2007). The results of each technique
were evaluated for plausibility of major element concentra-
tions, trace element ratios, and multiple KD mineral-melt
values (Fe-Mg in olivine, Mg in olivine, Ni in olivine, K in
plagioclase, and Mn in pyroxene).
Melt inclusion compositions calculated using both
whole-rock Al2O3 values and Al2O3 and MgO values
(approaches a and b) as an internal standard yielded high
total oxides (i.e., >102 wt.%) and often yielded implausible
values for major elements, such as SiO2, in the hundreds
of wt.% range. Olivine Fe-Mg KD values (approach c) were
used to calculate an internal standard for melt inclusions
hosted in olivine. The Fe/Mg ratio of each melt inclusion
was determined using the Fe/Mg ratio of the host olivine
and a KD value of 0.31, which was calibrated experimen-
tally for basalts at low pressures (0.1–0.3 GPa; Ulmer
1989). Melt inclusion compositions calculated using these
KD-determined internal standards were implausibly
enriched in Al2O3, that is, >60 wt.%, Al2O3. The fraction-
(A) (B)
(C) (D)
Fig. 2. Examples of recrystallized (A and B) and
partially devitrified (C and D) melt inclusions in
olivine (A), orthopyroxene (B), clinopyroxene
(C), and plagioclase (D). Circles show the
locations of melt inclusions analyzed in this
study, which are not visible in the photographs
in B and D. Other melt inclusions were not
analyzed because they did not meet criteria for
analysis (size, depth, quality).
Fig. 3. Example of an LA-ICP-MS signal (melt inclusion 15mrb12 from
sample CM-68). Areas shaded in gray are the gas background (which was
collected from 0 to 50 sec and 120 to 150 sec), areas shaded in blue are
the host mineral (plagioclase), and the area shaded in tan is the melt inclu-
sion signal.
© 2013 John Wiley & Sons Ltd, Geofluids, 13, 421–439
424 K. ROBERTSON et al.

ation method of Zajacz & Halter (2007) (approach d) is
based on the assumption that the melt inclusions trapped a
range of compositions along a liquid line of descent. In
this method, the mass fraction (x) of melt inclusion relative
to the host phenocryst phase is determined by the intersec-
tion of the regression line describing the liquid line of
decent whole-rock values and the trend of progressive sub-
traction of the host mineral from the mixed signal of host
plus melt inclusion. Incompatible versus compatible ele-
ments, in this case, FeO versus Al2O3 and CaO versus
MgO, are plotted to form regression lines. These two sets
of elements were chosen for comparison, and in each case,
there was a compatible and incompatible element for each
phenocryst phase. For both element pairs, the melt inclu-
sion compositions calculated with the fractionation method
often yielded calculated KD values that were much higher
or lower than experimentally determined published values.
We suspect that the failure of employing major elements as
the internal standard for melt inclusion plus host signal
deconvolution may result from postentrapment partial
re-equilibration of melt inclusion contents with host phe-
nocrysts or even surrounding melt (for detailed discussions
see e.g., Danyushevsky et al. 2002; Schiano 2003; Pettke
2006).
For all melt inclusion samples, the whole-rock K2O and
MnO incompatible element method consistently yielded
calculated values in terms of oxide totals that are
99–102 wt.% and simultaneously yielded olivine Fe-Mg KD
values within approximately 10% of published values.
MELT INCLUSION AND HOST PHENOCRYSTDATA
Table 1 contains the rock type, eruptive center, mineral
assemblage, major element, and Nd, Sr, Pb, and isotope
data for the 15 whole-rock samples analyzed during this
study. Also presented are the latitude and longitude coordi-
nates for samples where this information is known. Table 2
is presented as an online spreadsheet that contains the
chemical data (major, minor, trace elements) for whole
rocks, melt inclusions, and melt inclusion–host phenocrysts
for 215 melt inclusion and 215 host phenocryst samples
analyzed during this study. Each melt inclusion and its host
phenocryst were ablated together and compositionally de-
convolved as described above. Each individual laser ablation
analysis yielded the chemical composition of the targeted
melt inclusion and the surrounding host phenocryst. Thus,
in Table 2, there is one analysis number for a melt inclusion
(e.g., 17mrb06) and that specific melt inclusion host phe-
nocryst (e.g., 17mrb06). Each set of melt inclusion and
host phenocryst analyses is listed in Table 2 below their
respective whole-rock sample number, and the eruptive
center is indicated in parentheses following the whole-rock
sample number. Also presented in Table 2 is the specific
isotope measured for each element. The chemical data for
all melt inclusions are grouped together, as are the data for
the host phenocryst minerals. The compositional data for
samples from Mutnovsky I are followed by data from Mut-
novsky II, then Mutnovsky III, and finally Mutnovsky IV.
Table 1 Whole-rock major element, and Nd, Sr, and Pb isotope data for Mutnovsky samples. Major element data are in weight percent and trace elementdata are in parts per million (ppm).
Eruptive center MI MI MI MI MII MII MII MIISample CM-97a CM-5 M1-02-08 CM-47 CM-156 CM-142 CM-155 CM-113
Location N 52.469117°E 158.16235°
Rock Type Basalt Basaltic And. Andesite Dacite Basalt Basaltic And. Andesite RhyodaciteMineralogy P, Ol, Opx, Cpx P, Opx, Cpx P, Opx, Cpx P, Opx, Cpx P, Ol, Opx, Cpx P, Ol, Opx, Cpx P, Opx P, Opx143Nd/144Nd 0.513108 0.513060 0.513089 0.51307787Sr/86Sr 0.703387 0.703380 0.703355 0.703358206Pb/204Pb 18.32 18.32 18.35 18.33207Pb/204Pb 15.47 15.47 15.49 15.47208Pb/204Pb 38.02 38.01 38.08 38.03
Mg# 0.56 0.44 0.36 0.35 0.55 0.42 0.34 0.28SiO2 50.52 52.38 58.71 64.68 48.68 53.44 57.27 67.53Al2O3 17.75 18.18 16.48 16.04 18.65 17.33 15.73 14.63FeO (T) 9.83 8.91 6.87 5.34 9.51 9.29 9.35 4.72MnO 0.16 0.16 0.154 0.15 0.3 0.23 0.21 0.108MgO 7.16 3.88 2.21 1.62 6.4 3.8 2.65 1.05
CaO 8.62 8.36 5.56 4.02 10.82 8.14 5.94 3.31Na2O 2.41 3.08 3.79 3.76 2.09 3.49 3.88 4.55K2O 0.54 0.72 1.24 1.98 0.48 0.72 1.3 2.1TiO2 1.09 1.18 0.91 0.91 1.17 1.31 1.45 0.47P2O5 0.13 0.24 0.26 0.22 0.15 0.28 0.34 0.1LOI 0.96 1.46 2.81 0.85 0.93 0.49 0.97 0.21Total 100.29 99.54 99.74 100.16 100.24 99.55 100.13 99.33
P, plagioclase; Ol, olivine; Opx, orthopyroxene; Cpx, clinopyroxene.
© 2013 John Wiley & Sons Ltd, Geofluids, 13, 421–439
Evolution of Mutnovsky Volcano, Kamchatka 425

Melt inclusion and phenocryst host uncertainties
The uncertainty for each element of the analyte menu was
calculated individually for each melt inclusion and melt
inclusion host phenocryst. These data are reported in
Table 2. The average uncertainty and range of uncertain-
ties for major, minor, and trace elements in melt inclusions
and host phenocrysts are statistically small relative to the
measured concentrations for each analyte. For example, the
range of uncertainties for plagioclase-hosted melt inclu-
sions varies as follows: SiO2: 0.21–3.65 wt.%; Al2O3: range
0.20–3.14 wt.%; TiO2: 0.004–0.915; FeO: 0.03–2.07
wt.%; MnO: 0.001–0.87 wt.%; MgO: 0.01–3.64 wt.%;
CaO: 0.64–3.59 wt.%; Na2O: 0.011–1.33 wt.%; K2O:
0.002–1.94 wt.%. The values reported in gray in Table 2
represent the limit of detection, calculated for the melt
inclusions by following Halter et al. (2002) and for the
host mineral following Pettke et al. (2012); element con-
centrations in these samples are below the calculated limit
of detection.
Host phenocryst chemistry
Olivine, clinopyroxene, and orthopyroxene phenocrysts
each exhibit less compositional variability than plagioclase.
The Mg# (molar [Mg/(Mg+Fe)]) ranges from 60 to 76
for clinopyroxene, from 49 to 69 for orthopyroxene, and
from 68 to 81 for olivine. Plagioclase phenocrysts cover a
larger compositional range, from anorthite rich (e.g.,
An93Ab7; 17mrb24) to moderately albite rich (e.g., An35A-
b62Or3; 16mrb16) (Table 1). The EPMA data for plagio-
clase phenocrysts revealed normal (i.e., higher Ca in the
core than the rim of the crystal), reverse (i.e., lower Ca in
the core than the rim of the crystal), and oscillatory zoning
in phenocrysts from all eruptive centers (Robertson 2011).
Melt inclusion chemistry
The chemical compositions of melt inclusions range from
picrobasalt to rhyolite (Table 2, Fig. 4). Whole-rock and
melt inclusion total alkalis versus SiO2 concentrations for
each sample (Fig. 4) reveal a subalkaline composition as is
typical for subduction zone settings and indicate that
whole-rock compositions usually lie in between the com-
positions of individual melt inclusions from the same sam-
ple. Silica variations among melt inclusions from one rock
sample are as small as 10 wt.% (e.g., sample CM-113) to as
large as 24 wt.% (e.g., sample CM-8a). Major element con-
centrations of melt inclusions from all samples have larger
compositional ranges than the range of all whole-rock val-
ues, consistent with other melt inclusion studies (e.g., Kent
et al. 2010). Exceptions are samples M1-02-08, CM-5 and
CM-113 for which almost all analyzed individual melt
inclusions are more silicic than bulk rock values.
Table 2 Electronic Supplement is presented as an online spreadsheet that contains chemical data (major, minor, trace elements) for whole rocks, melt inclu-sions, and melt inclusion–host phenocrysts for 215 melt inclusion and 215 host phenocryst samples analyzed during this study. The chemical data for samples
from Mutnovsky I are followed by data from Mutnovsky II, then Mutnovsky III, and finally Mutnovsky IV. The chemical data for all melt inclusions aregrouped together in rows A28–A254, as are the data for the host phenocryst minerals in rows A256–A481. Melt inclusions and their host phenocryst wereablated together and deconvolved. Each laser ablation analysis yielded the chemical composition of a melt inclusion and the surrounding host phenocryst.The uncertainty for each melt inclusion and separately for each host phenocryst is reported for each analyze. Thus, in Table 2, there is one analysis numberfor a melt inclusion (e.g., 17mrb06) and that specific melt inclusion host phenocryst (e.g., 17mrb06).
Eruptive center MIII MIII MIII MIII MIV MIV MIV
Sample M3-08-08 CM-9a M3-09-08 CM-8a CM-206 CM-68 CM-62
Location N 52.4601°E158.161583°
N 52.463417°E158.167617°
Rock Type Basalt Basaltic And. Andesite Dacite Basalt Basalt Basaltic And.
Mineralogy P, Ol, Cpx P, Ol, Cpx P, Opx, Cpx P, Opx, Cpx P, Ol, Opx, Cpx P, Ol P, Ol, Cpx143Nd/144Nd 0.513101 0.513083 0.513079 0.51307787Sr/86Sr 0.703335 0.703342 0.703346 0.703340206Pb/204Pb 18.35 18.32 18.36 18.33207Pb/204Pb 15.48 15.47 15.50 15.50208Pb/204Pb 38.07 38.02 38.11 38.08Mg# 0.52 0.55 0.37 0.27 0.51 0.54 0.51
SiO2 48.85 52.8 58.83 69.4 51.08 50.46 54.02Al2O3 22.65 19 18.01 14.61 18 20.74 17.37FeO (T) 7.14 7.82 6.55 3.65 9.11 7.86 8.63MnO 0.131 0.14 0.126 0.1 0.2 0.18 0.15MgO 4.4 5.38 2.16 0.75 5.3 5.1 5CaO 12.42 9.18 7.23 3.09 10.22 11.06 8.95
Na2O 2.16 2.49 3.65 4.18 2.5 2.23 3.09K2O 0.28 0.66 1.62 3.18 0.6 0.54 1.2TiO2 0.59 0.79 0.84 0.63 1.11 0.77 1P2O5 0.09 0.15 0.21 0.12 0.17 0.1 0.18LOI 0.63 0.81 0.71 0.26 1.1 0.84 0.25Total 100.1 100.09 100.7 100.33 100.4 100.14 100.09
© 2013 John Wiley & Sons Ltd, Geofluids, 13, 421–439
426 K. ROBERTSON et al.

Fig. 4. Le Bas (Le Bas et al. 1986) diagram classifying whole-rock and melt inclusion samples by total alkalis and silica. Fields plotted on each diagram are
explained in the bottom right panel.
© 2013 John Wiley & Sons Ltd, Geofluids, 13, 421–439
Evolution of Mutnovsky Volcano, Kamchatka 427

Fig. 4b. Continued.
© 2013 John Wiley & Sons Ltd, Geofluids, 13, 421–439
428 K. ROBERTSON et al.

Melt inclusion major and trace element compositions are
broadly similar for all eruptive centers (Mutnovsky I-IV).
Melt inclusion trace element patterns are very similar to
their whole-rock trace element patterns, showing a typical
subduction signature. Melt inclusions are enriched in the
large ion lithophile elements (LILE) and, to a lesser
degree, in the light rare earth elements (LREE), and, are
depleted in the high field strength elements (HFSE), nota-
bly Nb (Fig. 5). When considering the incompatible trace
element ratios Rb versus Ba, Rb versus La, Rb versus Sr,
and Zr versus Th in samples CM-8a and CM-62, whole-
rock values plot close to mixing lines between the most
enriched and depleted (for the trace element of interest)
melt inclusion values (Fig. 6). Simple linear mixing lines
were calculated by choosing end points for the mixing lines
that best represent the extremes of the melt inclusion pop-
ulation for each sample. Note that Sr is the only element
that is somewhat compatible because of the presence of
plagioclase in the system. There are some melt inclusions
that plot outside the general trend of the melt inclusion
population and do not conform to a mixing trend. The
two samples portrayed in Fig. 6 are generally representative
of the entire sample population.
Melt inclusions by host mineral
The melt inclusion data indicate that different phenocryst
host minerals trapped different melt inclusion compositions
(Figs 4–8). Plagioclase is the most prevalent phenocryst
phase at Mutnovsky, occurring in all samples, and it has
the highest number of analyzed melt inclusions and the
widest range of melt inclusion compositions. When com-
pared with whole-rock compositions, clinopyroxene, ortho-
pyroxene, and plagioclase, all contain melt inclusions that
Fig. 5. Trace element abundances normalized to normal mid-ocean ridge basalt (Sun & McDonough 1989) for four representative samples, one from each
eruptive center and of each whole-rock type. CM-68 is a basalt from Mutnovsky IV, CM-5 is a basaltic andesite from Mutnovsky I, M3-09-08 is an andesite
from Mutnovsky III, and CM-113 is a dacite from Mutnovsky II.
© 2013 John Wiley & Sons Ltd, Geofluids, 13, 421–439
Evolution of Mutnovsky Volcano, Kamchatka 429

(A)
(B)
Fig. 6. Trace element plots for melt inclusions from two representative samples, CM-8a (A) and CM-62 (B). Mixing lines are plotted that were calculated by
choosing end points that best represent the extremes of the melt inclusion population for each sample between the most and least evolved melt inclusions;
each dot along the mixing line represents 10% mixing increments.
© 2013 John Wiley & Sons Ltd, Geofluids, 13, 421–439
430 K. ROBERTSON et al.

span the compositional range of the whole rocks and
extend to more silica-rich compositions (Fig. 7). Olivine-
hosted melt inclusions have compositions that overlap the
composition of the whole rock and also extend to more sil-
ica-poor compositions (Fig. 7).
The average concentration of SiO2 among melt inclu-
sions for each host mineral is compared in Fig. 8 with the
whole-rock SiO2 value for each sample. Plagioclase-hosted
melt inclusions have the highest SiO2 values, while olivine-
hosted melt inclusions have the lowest SiO2 values. Sam-
ples CM-206, CM-9a, CM-156, CM-113, and CM-5 have
whole-rock SiO2 concentrations that are lower than all of
the average melt inclusion SiO2 concentrations per host
phenocryst.
One important question in any melt inclusion study is
whether or not the measured variability of melt inclusion
compositions reflects postentrapment crystallization. We
assessed this possibility for each melt inclusion – host phe-
nocryst pair. For plagioclase, the compositions of melt
inclusions vary as follows: Al2O3: 7.42–24.77 wt.%; MgO:
0.33–8.33 wt.%; FeOT: 2.77–16.17 wt.%; SiO2: 48.7–
75.25 wt.%; K2O: 0.19–5.42 wt.%; CaO: 0.45–16.49 wt.%;
Na2O: 0.96–6.06 wt.%; and TiO2: 0.46–1.93 wt.%. We
evaluated whether or not the range of measured concentra-
tions of plagioclase-hosted melt inclusions reflect posten-
trapment modification by assessing the correlation between
highly incompatible elements in plagioclase (e.g., Fe, Ti,
Mg, Sc, Cr, Mn, Y; Aigner-Torres 2003) and the Al2O3
Fig. 7. Frequency diagrams showing the number of melt inclusions and whole rocks with different SiO2 compositions, by melt inclusion host phenocryst. The
whole-rock values plotted include all 50 samples reported in Robertson (2011) and not just the rocks with melt inclusions analyses.
© 2013 John Wiley & Sons Ltd, Geofluids, 13, 421–439
Evolution of Mutnovsky Volcano, Kamchatka 431

content of the melt inclusion. Figure 9 illustrates this rela-
tionship for the concentrations of FeO, MgO, TiO2, and Y
in plagioclase-hosted melt inclusions and the Al2O3 con-
centration of the melt inclusion. Postentrapment crystalliza-
tion should increase the concentrations of highly
incompatible elements as the concentration of Al2O3 in the
melt inclusion decreases, which occurs because of the crys-
tallization of plagioclase around the edges of the melt inclu-
sion (Streck & Wacaster 2006). This is not observed for the
majority of melt inclusions. Rather, the concentrations of
FeO, MgO, TiO2, and Y predominantly remain relatively
constant as a function of Al2O3 concentrations of the melt
inclusion. We interpret these data to indicate that the mea-
sured variability of plagioclase-hosted melt inclusion com-
positions reflects the actual diversity of melt compositions
during the evolution of the Mutnovsky magma system.
Similar observations can be made for cpx-, opx-, and
ol-hosted melt inclusions. The compositions of melt
inclusions and cpx-, opx-, and ol-host mineral phases con-
sistently yielded calculated values in terms of oxide totals
that are 99–102 wt.% and yielded olivine Fe-Mg KD values
within approximately 10% of published values. We interpret
these data to indicate that the measured variability of melt
inclusions in cpx-, opx-, and ol-hosted melt inclusions
likely reflects the compositional variability at the time of
entrapment.
DISCUSSION AND INTEPRETATION
Petrographic evidence, field evidence (Fig. 10A), and phe-
nocryst zonation patterns (Robertson 2011) are consistent
with magma mixing and mingling throughout the evolu-
tion of Mutnovsky igneous activity. Field evidence for
magma mingling includes mafic enclaves, interpreted to
have chilled margins, found in a more felsic Mutnovsky I
host (Fig. 10A). Resorbed and sieve-textured plagioclase
phenocrysts are abundant in samples from every eruptive
center and for every major rock composition (Fig. 10B).
EPMA traverses across plagioclase phenocrysts indicate that
plagioclase crystals are commonly zoned (Robertson
2011). Normally zoned and oscillatory-zoned plagioclase
phenocrysts are the most common in Mutnovsky samples,
and there are some reversely zoned plagioclase phenocrysts.
We note that rapid decompression is also a plausible expla-
nation for the observed sieve texture of plagioclase (Nelson
& Montana 1992) and that reverse zoning (i.e., Ca-
enriched rims on sodic plagioclase) can be caused by
decompression-induced resorption of clinopyroxene, which
effectively increases the Ca to Na ratio of the melt, or melt
devolatilization during ascent. The plagioclase dissolution
textures reported by Nelson & Montana (1992) were
reproduced by performing fluid absent, isothermal decom-
pression experiments from an initial pressure of 1.2 GPa to
final pressures of 1.0, 0.8, and 0.6 GPa. Kadik et al.
(1989) demonstrated experimentally that clinopyroxene is
not a stable phase in high-Al Kamchatkan basalts at pres-
sures > approximately 0.7 GPa. Thus, it seems unlikely
that the coarsely sieve-textured plagioclase cores formed by
strictly by decompression. Compositional variation among
plagioclase crystals may also reflect the effects of decom-
pression-induced volatile saturation and changing H2O
concentration of silicate melts. Crabtree & Lange (2011)
Fig. 8. Average SiO2 values for melt inclusions in every host mineral, compared with whole-rock values, for every sample. Each line represents the range in
average values for a given sample. Standard deviations for SiO2 values in melt inclusions from each host mineral are as follows: plagioclase: average 1.03,
range 0.21–3.65 wt.%; olivine: SiO2: average 1.02, range 0.32–3.24 wt.%; cpx: average 1.49, range 0.40–4.10 wt.%; opx: 1.78, range 0.63–4.55 wt.%.
Samples where the whole-rock composition is less evolved than all the average melt inclusion data provide unambiguous evidence for addition of a basaltic
magma just before eruption. Hence, magma mixing appears likely to trigger volcanic eruptions.
© 2013 John Wiley & Sons Ltd, Geofluids, 13, 421–439
432 K. ROBERTSON et al.

and Frey & Lange (2011) investigated the compositional
variability of plagioclase grains from andesites and dacites
erupted at the western Mexico volcanic belt and suggested
that the effect of higher H2O concentrations of silicate
melt is to reduce the activity of CaO relative to NaO0.5,
favoring higher sodium contents of crystallizing plagio-
clase. If the silicate melt reaches volatile saturation during
ascent, the loss of dissolved H2O from the melt increases
the activity of CaO and increases the Ca/Na ratio of crys-
tallizing plagioclase. The petrographic observations of
dusty, zoned plagioclase in the current study (Fig. 10B),
both normal and reverse chemical zoning of individual pla-
gioclase crystals, and the compositions of plagioclase-
hosted melt inclusion, seem most consistent with magma
mixing and likely also record variation in the pre-eruptive
H2O concentrations and decompression-induced degas-
sing, as the causes of the observed variation of plagioclase
compositions and morphologies. A detailed evaluation of
plagioclase phenocrysts was not considered during this
study.
The measured compositional heterogeneity of erupted
rocks at Mutnovsky was interpreted by Robertson (2011)
to reflect different amounts and variable depths of partial
melting in the subarc mantle source followed by closed sys-
tem fractional crystallization. The new melt inclusion data
presented here allow us to extend that study and further
investigate the cause(s) of the variability of whole-rock
geochemical compositions. The variability of melt inclusion
compositions among different host minerals provides infor-
mation on the pre-eruptive melt compositions as well as
crystallization history. Each host mineral (i.e., olivine, clin-
opyroxene, orthopyroxene, plagioclase) contains a different
range of melt inclusion compositions (Fig. 7), while indi-
vidual phenocrysts have rather uniform melt inclusion
compositions. Notably, some individual plagioclase pheno-
crysts contain multiple melt inclusions that vary in melt
SiO2 content by 6–15 wt.%. This variability likely reflects
the prevalence of plagioclase to crystallize continually
throughout the fractionation history of subvolcanic magma
reservoirs and during eruption. Such an extended period of
crystallization for plagioclase predicts that plagioclase
should trap a wider range of melt compositions relative to
other phases that are not stable throughout the entire crys-
tallization sequence.
Al2O3 (wt. %)
Al2O3 (wt. %) Al2O3 (wt. %)
Al2O3 (wt. %)6 8 10 12 14 16 18 20 22 24 26
FeO
(wt.
%)
2
4
6
8
10
12
14
16
18CM-5CM-8aCM-9aCM-47CM-62CM-68CM-97aCM-113CM-142CM-155CM-156CM-206MI-02-08M3-08-08M3-09-08
6 8 10 12 14 16 18 20 22 24 26
MgO
(wt.
%)
0
2
4
6
8
10CM-5CM-8aCM-9aCM-47CM-62CM-68CM-97aCM-113CM-142CM-155CM-156CM-206MI-02-08M3-08-08M3-09-08
5 10 15 20 25 30
TiO
2 (w
t. %
)
0.2
0.4
0.6
0.8
1.0
1.2
1.4
1.6
1.8
2.0CM-5CM-8aCM-9aCM-47CM-62CM-68CM-97aCM-113CM-142CM-155CM-156CM-206MI-02-08M3-08-08M3-09-08
6 8 10 12 14 16 18 20 22 24 26
Y (w
t. %
)
0
10
20
30
40
50
60
70
80CM-5CM-8aCM-9aCM-47CM-62CM-68CM-97aCM-113CM-142CM-155CM-156CM-206MI-02-08M3-08-08M3-09-08
Fig. 9. The concentrations of MgO, FeO, TiO2, and Y in plagioclase-hosted melt inclusions are plotted against the concentration of Al2O3 in the plagioclase
host. These elements (i.e., MgO, FeO, TiO2, and Y) are highly incompatible in plagioclase, and their variation as a function of Al2O3 in the plagioclase-hosted
melt inclusion indicates that the measured range of melt inclusion compositions trapped in plagioclase crystals reflects the compositional variability of melts at
the time of entrapment in plagioclase.
© 2013 John Wiley & Sons Ltd, Geofluids, 13, 421–439
Evolution of Mutnovsky Volcano, Kamchatka 433
We highlight that there is no correlation between host
phenocryst size and the range of melt inclusion composi-
tions. Individual plagioclase phenocrysts with large ranges
of melt inclusion compositions range in size from approxi-
mately 200 to 2000 lm diameter. Individual olivine and
pyroxene phenocrysts have similar size ranges, but do not
trap as large of a range in melt inclusion compositions
(e.g., Fig. 6). The ranges of melt inclusion SiO2 values as a
function of different host phenocryst sizes are shown in
Fig. 11. If fractional crystallization was the only differentia-
tion process responsible for the observed whole-rock
chemical variability, this predicts that small phenocrysts,
which likely represent late stage crystallization, would have
trapped the most chemically evolved (i.e., higher SiO2)
melts. However, for the Mutnovsky samples, small
(≤250 lm) phenocrysts also trapped a range of melt inclu-
sion compositions, which vary from basalt to rhyolite
(Fig. 11).
If the small phenocrysts represent crystals that nucle-
ated and grew closer to the time of eruption, then this
observation (i.e., size versus. composition variability) sug-
gests three possibilities. First, that magma mixing caused
some of the compositional heterogeneity of the whole
rocks. In this scenario, it is plausible that the small host
phenocrysts crystallized and trapped different melt inclu-
sion compositions in individual, separate magma batches
that were later mixed together to produce the erupted
whole-rock compositions. Second, that convection within
an evolving and compositionally zoned magma chamber
mechanically mixed together less-evolved and more evolved
magma zones. In this scenario, the bulk magma chamber
may have differentiated primarily by fractional crystalliza-
tion (consistent with the whole-rock data presented in
Robertson 2011), and convective mixing of composition-
ally variable portions of the chamber resulted in the
textural and compositional variability of the erupted rocks.
Third, there may have been periodic injection of mafic
magma into a compositionally evolving magma that was
differentiating primarily by fractional crystallization. This
process could cause convection, on at undefined scale, and,
if this also stimulates eruption, is predicted to yield ‘mixed’
compositions of erupted rocks, consistent with melt inclu-
sion evidence in this study.
Single melt inclusion outliers in plagioclase-hosted melt
inclusions in sample CM-142 can be explained by differ-
ences among melt inclusion assemblages. Melt inclusions
23mrc11-14 were all trapped in one plagioclase pheno-
cryst. The inclusions 23mrc11-13 were part of one melt
inclusion assemblage trapped in the outer portion of the
plagioclase phenocryst (i.e., closer to the crystal rim), and
inclusion 23mrc14 was trapped near the core of the plagio-
clase phenocryst. The measured concentrations of SiO2 in
inclusions 23mrc11-13 are lower than inclusion 23mrc14.
This finding is consistent with reverse zoning with respect
to trapped melt inclusion compositions. Another plagio-
clase phenocryst in the same thin section contained melt
inclusions 23mrc18-19. In that phenocryst, the melt inclu-
sion 23mrc18 was part of a low SiO2 melt inclusion assem-
blage located in the core of the phenocryst and melt
inclusion 23mrc19 was part of a high SiO2 melt inclusion
assemblage located in the rim of the phenocryst. These
compositional observations, that is, lower SiO2 in melt
inclusions in the crystal core and higher SiO2 in melt inclu-
sions in the crystal rim, are consistent with fractional crys-
tallization trends.
Halter et al. (2004a) suggested that different melt inclu-
sion compositions trapped by different host minerals indi-
cates that the phenocrysts did not crystallize from a single
melt that evolved via fractional crystallization. They sug-
gested that such a scenario requires compositionally dis-
tinct, separately evolving magmas (crystals + melt) where
melt was trapped as melt inclusions by the different pheno-
cryst phases. Accordingly, the measured variability of SiO2
concentrations in melt inclusions among different host
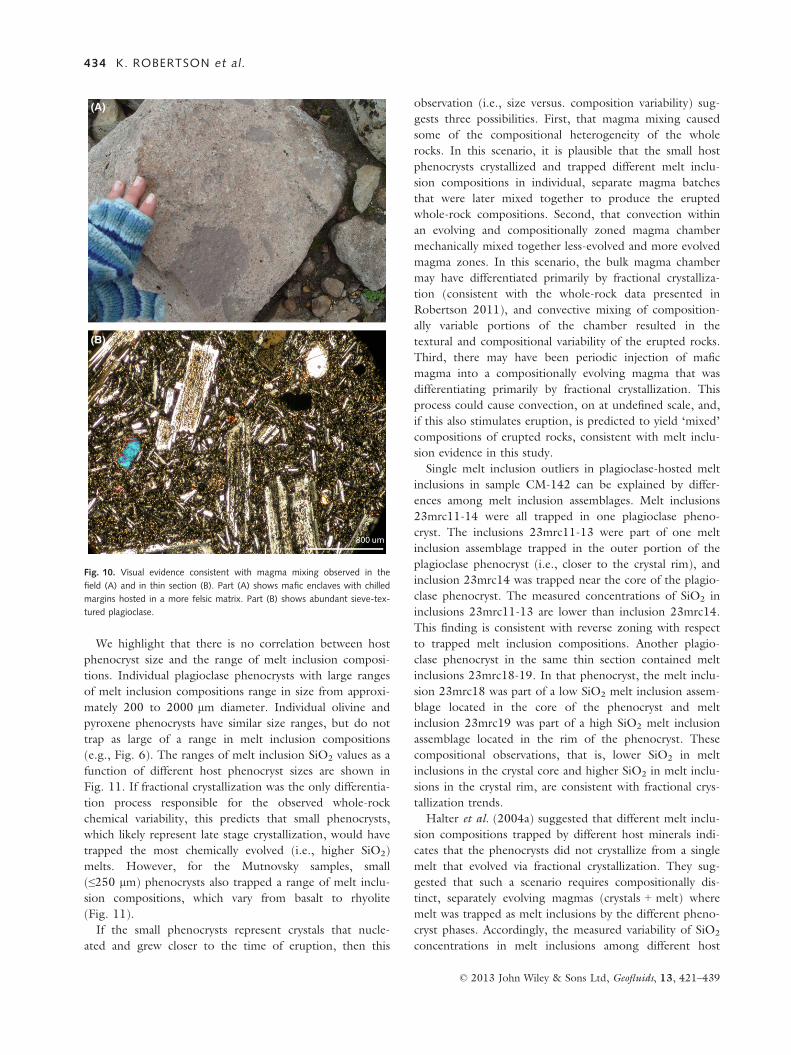
(A)
(B)
Fig. 10. Visual evidence consistent with magma mixing observed in the
field (A) and in thin section (B). Part (A) shows mafic enclaves with chilled
margins hosted in a more felsic matrix. Part (B) shows abundant sieve-tex-
tured plagioclase.
© 2013 John Wiley & Sons Ltd, Geofluids, 13, 421–439
434 K. ROBERTSON et al.

minerals helps constrain the compositions and evolutionary
stages of magmas involved in the formation of Mutnovsky
eruptive centers. The melt inclusions hosted in plagioclase
seem to record both prominent fractional crystallization
(i.e., increasing wt.% SiO2 in melt inclusions trapped from
core to rim, 23mrc18-19) and mixing of different magma
batches (i.e., decreasing wt.% SiO2 in melt inclusions from
core to rim, 23mrc11-14), data that are consistent with
the measured normal and reverse zoning of plagioclase
phenocryst compositions (Robertson 2011).
Olivine-hosted melt inclusions tend to have low silica
compositions (e.g., Fig. 8), suggesting that olivine was
crystallizing as the liquidus phase from a primitive melt
composition. Clinopyroxene-hosted melt inclusions contain
mostly basaltic through andesitic compositions, indicating
that clinopyroxene crystallized from a mafic to intermediate
melt. This could be a single melt evolving via fractional
crystallization or mixing of multiple magma compositions,
similar to magma mixing recorded in plagioclase melt
inclusions. Orthopyroxene-hosted melt inclusions predomi-
nately contain andesitic and dacitic compositions, indicat-
ing that orthopyroxene crystallized from an intermediate
to evolved melt.
Geochemical modeling of whole-rock fractional crystalli-
zation indicates that a normal fractionation sequence
occurred at Mutnovsky, with olivine crystallizing early as
the liquidus phase, clinopyroxene and orthopyroxene crys-
tallizing after olivine, and plagioclase crystallizing through-
out the crystallization sequence. Trace element fractional
crystallization geochemical modeling cannot produce the
range of compositions recorded by melt inclusions among
all the mineral phases combined. Additional evidence for
the primitive nature and early crystallization of olivine and
also clinopyroxene is the high Cr content of melt inclu-
sions hosted within those mineral phases (Fig. 12A; Wilson
1989). Chromium is compatible with respect to primitive
mantle minerals such as olivine, pyroxene, and spinel, so
high (>200 ppm) Cr content in melt inclusions signifies
that these minerals have not extensively crystallized prior
to entrapment. There is some overlap in the melt inclusion
compositions within each host mineral, but because of the
prevalence of different average melt inclusion compositions
for each host mineral and the trace element modeling
results, the data seem consistent with a model wherein dif-
ferent magma batches evolved by fractional crystallization,
with subsequent magma mixing occurring during or prior
to eruption. A lack of equilibrium among coexisting ortho-
pyroxene and clinopyroxene in some samples, assessed
using QUILF (Andersen et al. 1993), is consistent with
magma mixing for such samples. We propose that this is
the result of multiple injections of unique melt aliquots
from the same source, evinced by statistically overlapping
Fig. 11. Melt inclusion SiO2 compositions by host phenocryst size. Host phenocryst sizes are split into categories small (1; ≤250 lm), medium (2; 250–
400 lm), and large (3; ≥400 lm).
© 2013 John Wiley & Sons Ltd, Geofluids, 13, 421–439
Evolution of Mutnovsky Volcano, Kamchatka 435

Sr, Nd, and Pb isotopes (Table 1) that evolved separately
and not simply by fractional crystallization of one melt,
except in the case of intramineral melt variation. We note
that low Cr contents of plagioclase-hosted melt inclusions
(Table 1) indicate that plagioclase was not a liquidus phase
in the deep source magma.
Comparing the melt inclusion total alkalis versus silica
data to their host rocks (Fig. 4) further illustrates that the
compositions of whole rocks investigated in this study
likely represent a mixture of melts. In samples where oliv-
ine-hosted melt inclusions are present, these inclusions rep-
resent a mafic mixing end member. In all other samples,
plagioclase or orthopyroxene inclusions represent a felsic
mixing end member. Geochemical modeling of melt
inclusion trace element abundances (IgPet: Carr 2002)
indicates that the most felsic melt inclusions in each
whole-rock sample can be produced by varying degrees
(30–70%) of fractional crystallization (including olivine,
plagioclase, clinopyroxene, and orthopyroxene) of the most
mafic melt inclusions from the same sample. However,
fractional crystallization alone cannot explain the entire
range of melt inclusion compositions found in one pheno-
cryst type. Therefore, the data seem consistent with dis-
crete aliquots of melt that were trapped as fractional
crystallization occurred, prior to magma mixing events.
There are many examples of magma mixing in volcanic
systems discovered only after analyzing melt inclusions,
such as Mount Hood (Kent et al. 2010) and the Farall�on
Negro Volcanic Complex (Halter et al. 2004a), and indi-
vidual phenocrysts, such as the Fish Canyon Magmatic Sys-
tem (Charlier et al. 2007). In the aforementioned volcanic
systems, magma mixing was not apparent when looking at
large scale, whole-rock data, but became obvious after
examining small scale data such as melt inclusions and
chemical zoning of individual phenocrysts. These studies
all focused on volcanic systems that, at least in terms of the
bulk composition of erupted rocks, are largely andesitic
(Mount Hood and Farall�on Negro) or rhyolitic (Fish Can-
yon). Mutnovsky is a dominantly basaltic system that pre-
serves evidence consistent with the characteristics of
magma mixing described in the aforementioned studies.
Magma mixing has been demonstrated in a few basaltic
systems including Stromboli volcano (Francalanci et al.
1989) and mid-ocean ridge volcanism (Dungan & Rhodes
1978), but it is far less commonly observed than in more
intermediate to silicic systems (Izbekov et al. 2004; Kent
et al. 2010). This infrequency of observation should not
be interpreted to imply that magma mixing is not poten-
tially an important process in basaltic systems. Perhaps
magma mixing is simply less obvious because the mixing
inputs are closer in composition to one another, particu-
larly if they have overlapping isotopic compositions
(Table 1) as is the case at Mutnovsky. Similar observations
were reported by Izbekov et al. (2004) for mixing of basalt
and andesite prior to the 1996 eruption of Karymsky Vol-
cano, Kamchatka. Those authors used multiple lines of evi-
dence to suggest that injection of basalt magma into an
andesite reservoir triggered eruption of a poorly mixed
basalt–andesite magma. The earliest eruptions contain evi-
dence for disequilibrium between the basalt and andesite,
and progressively younger eruptions contain composition-
ally equilibrated materials. Several studies reported evi-
dence for magma mixing where the mixed magma was not
chemically homogenized at the time of eruption; for exam-
ple, Unzen, Japan (Nakamura 1995); Dutton, Alaska
(Miller et al. 1999); and Soufri�ere Hills (Murphy et al.
2000). Izbekov et al. (2004) postulated that compositional
homogeneity of mixed magmas is favored if, at the time of
(A)
(B)
Fig. 12. SiO2 versus Cr concentrations for melt inclusions hosted by (A)
minerals and (B) whole-rock samples from the four eruptive centers. The
limit of detection for Cr for each individual melt inclusions ranged from a
low of approximately 1 ppm to a high of approximately 27 ppm (Table 2).
Thus, the data plotted here indicate that ol- and cpx-hosted melt inclusions
trapped the compositionally least evolved melts.
© 2013 John Wiley & Sons Ltd, Geofluids, 13, 421–439
436 K. ROBERTSON et al.

mixing, the two magmas have similar temperatures, viscosi-
ties, and densities. As the differences in temperature, vis-
cosity, and density of the melts increase, this seemingly
prevents efficient magma mixing and should lead to erup-
tion of compositionally heterogeneous material where
(inefficient) magma mixing is more obvious.
A model for magma ‘chamber’ evolution at Mutnovsky
The melt inclusion and whole-rock chemistry data for sam-
ples from all eruptive centers at Mutnovsky are consistent
with the hypothesis that the erupted rocks represent the
crystallized products of multiple aliquots of different
magma compositions, possibly from different depths of the
shallow-level pre-eruptive plumbing system, that mixed
together prior to and/or during eruption. This is similar
to the model proposed for other arc volcanoes, for exam-
ple Mount St. Helens (Blundy & Cashman 2005), where
the minimum trapping pressure (determined from H2O
contents of melt inclusions) of melt inclusions from sam-
ples from individual eruptions indicate multiple depths of
magma storage from a plumbing system that spanned a
vertical distance on the order of several km. The melt
inclusions from Mutnovsky, as is the case for the whole
rocks, are enriched in the fluid mobile LILE and LREE
(Fig. 5), a finding that is consistent with fluid-driven melt-
ing of the mantle wedge at the base of the Mutnovsky
magma plumbing system, as proposed by Duggen et al.
(2007) based on their interpretation of Sr, Nd, and (dou-
ble-spike MC-ICP-MS) Pb isotope data. As individual
pulses of magma were emplaced into the near-surface envi-
ronment, each pulse differentiated by fractional crystalliza-
tion. The addition of new, hot, potentially volatile-rich,
less-evolved magma is a plausible eruption trigger (Sparks
et al. 1977; Venezky & Rutherford 1997; Eichelberger
et al. 2000; Murphy et al. 2000; Kent et al. 2010), which
could result in the eruption of an apparent single magma
that is in reality a composite of formerly discrete, fraction-
ally crystallized magmas. If input of basaltic magma and
concomitant mixing did not immediately result in erup-
tion, this could provide time sufficient for resorption of
mafic phenocrysts, hence enriching the bulk magma in
those components and decreasing the SiO2 content. This
process could obscure the mafic end member portion of
the melt record as we found via the absence of mafic melt
inclusions in some samples.
CONCLUSIONS
1 Melt inclusion compositions range from low silica (44
wt.%), hosted mainly in olivine, to high silica (75 wt.%),
hosted in plagioclase. Multiple melt populations are
required to explain the range of melt inclusion composi-
tions present in each of the melt inclusion host phases
(olivine, clinopyroxene, orthopyroxene, plagioclase). This
suggests that multiple magma batches were present
throughout the evolution of the Mutnovsky igneous
system.
2 The composition of Mutnovsky melt inclusions is consis-
tent with aqueous fluid-flux melting of the mantle wedge
and compositional differentiation via fractional crystalli-
zation during ascent. As the magmas ponded in the
near-surface subvolcanic environment, they continued to
evolve via fractional crystallization to produce the range
of melt inclusions compositions (basalt to rhyolite) sam-
pled in this study.
3 Periodic injection of new magma, which had undergone
fractional crystallization during ascent, ultimately was
likely responsible for driving volcanic eruptions. At pres-
ent, there are no quantitative constraints on the length
of time that elapsed between the input of individual
magma pulses, or the specific composition of the pre-
existing magma reservoir and the intruding magma.
However, we suggest that the lag time between magma
emplacement and eruption may have controlled the
degree to which erupted materials homogenized. This
conclusion is consistent with Izbekov et al. (2004) who
documented that injection of basalt into andesite magma
caused eruption of a mixed magma at Karymsky Vol-
cano, Kamchatka, with the reservoir returning to a
homogeneous composition within months of the first
eruption.
ACKNOWLEDGEMENTS
We thank Lindsey Clark for her help with pyroxene EPMA
analyses and Racheal Johnsen for her help with whole-rock
Sr, Nd, and Pb isotope analyses. Tatiana Rychkova, Anatol-
y Mushinsky, and Denise Honn all provided valuable assis-
tance in the field. This work was supported by the
University of Nevada Las Vegas President’s Research
Award to Simon and Smith, and the University of Nevada
Las Vegas President’s Graduate Fellowship, the Nevada
Stars Graduate Fellowship, and ExxonMobil Scholarship to
Robertson. We sincerely appreciate reviews from Pavel Iz-
bekov, one anonymous reviewer, and Editor Craig Man-
ning, all of which significantly improved the manuscript
substantively and stylistically.
REFERENCES
Aigner-Torres M (2003) Iron, magnesium and other highly
incompatible elements partitioning between plagioclase andbasaltic melts. PhD Dissertation, Naturwissenschaften ETH
Z€urich, Nr. 15026.
Andersen DJ, Lindsley DH, Davidson PM (1993) QUILF: aPASCAL program to assess equilibria among Fe-Mg-Ti oxides,
pyroxenes, olivine, and quartz. Computers in Geosciences, 19,1333–50.
© 2013 John Wiley & Sons Ltd, Geofluids, 13, 421–439
Evolution of Mutnovsky Volcano, Kamchatka 437

Anderson AT (1976) Magma mixing: petrological process and
volcanological tool. Journal of Volcanology and GeothermalResearch, 1, 3–33.
Annen C, Blundy JD, Sparks RSJ (2006) The genesis of
intermediate and silicic magmas in deep crustal hot zones.
Journal of Petrology, 47, 505–39.Aud�etat A, Pettke T (2003) The magmatic-hydrothermalevolution of two barren granites: a melt and fluid inclusion
study of the Rito del Medio and Canada Pinabete plutons in
Northern New Mexico (USA). Geochimica et CosmochimicaActa, 67, 97–122.
Bacon CR, Bruggman PE, Christiansen RL, Clynne MA,
Donnelly-Nolan JM, Hildreth W (1997) Primitive magmas at
five cascades volcanic fields: melts from hot, heterogeneous sub-
arc mantle. The Canadian Mineralogist, 35, 397–423.Blundy J, Cashman K (2005) Rapid decompression-driven
crystallization recorded by melt inclusions from Mount St.
Helens volcano. Geology, 33, 793–6.Bodnar RJ, Student JJ (2006) Melt inclusions in plutonic rocks:
petrography and microthermometry. In: Melt Inclusions inPlutonic Rocks Mineralogical Association of Canada Short
Course Series (ed Webster JD), 36, pp. 1–25. MineralogicalAssociation of Canada, Qu�ebec.
Bryant JA, Yogodzinski GM, Churikova TG (2010) High-Mg#
andesitic lavas of the Shisheisky Complex, Northern Kamchatka:
implications for primitive calc-alkaline magmatism. Contributionsto Mineralogy and Petrology, 161, 791–810.
Carr MJ (2002) IGPET Software. Terra Softa Inc, Somerset, NJ.
Charlier BLA, Bachmann O, Davidson JP, Dungan MA, MorganDJ (2007) The upper crustal evolution of a large silicic magma
body: evidence from crystal-scale Rb-Sr isotopic heterogeneities
in the Fish Canyon Magmatic System, Colorado. Journal ofPetrology, 48, 1875–94.
Crabtree SM, Lange RA (2011) Complex phenocryst textures
and zoning patterns in andesites and dacites: Evidence of
degassing-induced rapid crystallization. Journal of Petrology,52, 3–38.
Danyushevsky LV, McNeill AW, Sobolev AV (2002) Experimental
and petrological studies of melt inclusions in phenocrysts from
mantle-derived magmas: an overview of techniques, advantagesand complications. Chemical Geology, 183, 5–24.
Defant MJ, Drummond MS (1990) Derivation of some modern
arc magmas by melting of young subducted lithosphere.
Nature, 347, 662–5.Duggen S, Portnyagin M, Baker J, Ulfbeck D, Hoernle K, Garbe-
Sch€onberg D, Grassineau N (2007) Drastic shift in lava
geochemistry in the volcanic-front to rear-arc region of the
Southern Kamchatkan subduction zone: evidence for thetransition from slab surface dehydration to sediment melting.
Geochimica et Cosmochimica Acta, 71, 452–80.Dungan MA, Rhodes JM (1978) Residual glasses and melt
inclusions in basalts from DSDP legs 45 and 46: evidence formagma mixing. Contributions to Mineralogy and Petrology, 67,417–31.
Eichelberger JC, Chertkoff DG, Dreher ST, Nye CJ (2000)Magmas in collision: rethinking chemical zonation in silicic
magmas. Geology, 28, 603–6.Francalanci L, Manetti P, Peccerillo A (1989) Volcanological and
magmatological evolution of Stromboli volcano (AeolianIslands): the roles of fractional crystallization, magma mixing,
crustal contamination and source heterogeneity. Bulletin ofVolcanology, 51, 355–78.
Frey HM, Lange RA (2011) Phenocryst complexity in andesitesand dacites from the Tequila volcanic field, Mexico: resolving
the effects of degassing vs. magma mixing. Contributions toMineralogy and Petrology, 162, 415–45.
Guillong M, Meier DL, Allan MM, Heinrich CA, YardleyBWD (2008) SILLS: a MATLAB-based program for the
reduction of laser ablation ICP-MS data of homogeneous
materials and inclusions. In: Laser Ablation ICP-MS in theEarth Sciences: Current Practices and Outstanding IssuesMineralogical Association of Canada Short Course Series (ed
Sylvester P), 40, pp. 328–33. Mineralogical Association of
Canada, Qu�ebec.
Halter WE, Pettke T, Heinrich CA, Rothen-Rutishauser B (2002)Major to trace element analysis of melt inclusions by laser-
ablation ICP-MS: methods of quantification. Chemical Geology,183, 63–86.
Halter WE, Heinrich CA, Pettke T (2004a) Laser-ablation ICP-MS analysis of silicate and sulfide melt inclusions in an andesitic
complex II: evidence for magma mixing and magma chamber
evolution. Contributions to Mineralogy and Petrology, 147, 397–412.
Halter WE, Pettke T, Heinrich CA (2004b) Laser-ablation ICP-
MS analysis of silicate and sulfide melt inclusions in an andesitic
complex I: analytical approach and data evaluation.Contributions to Mineralogy and Petrology, 147, 385–96.
Heinrich CA, Pettke T, Halter WE, Aigner-Torres M, Aud�etat A,
Gunther D, Hattendorf B, Bleiner D, Guillong M, Horn I
(2003) Quantitative multi-element analysis of minerals, fluidand melt inclusions by laser-ablation inductively-coupled-plasma
mass spectrometry. Geochimica et Cosmochimica Acta, 67,3473–97.
Hildreth W, Moorbath S (1988) Crustal contributions to arc
magmatism in the Andes of central Chile. Contributions toMineralogy and Petrology, 98, 455–89.
Izbekov PE, Eichelberger JC, Ivanov BV (2004) The 1996eruption of Karymsky Volcano, Kamchatka: Historical record of
basaltic replenishment of andesite reservoir. Journal of Petrology,45, 2325–45.
Kadik AA, Rozenkhauer M, Lukanin OA (1989) Experimentalstudy of effect of pressure on crystallization of high-Mg and
high-Al basalts of Kamchatka. Geochemistry, 12, 1748–62.Kay RW (1978) Aleutian magnesian andesites: melts fromsubducted Pacific crust. Journal of Volcanology and GeothermalResearch, 4, 117–32.
Kent AJR (2010) Melt inclusions in basaltic and related
volcanic rocks. Reviews in Mineralogy and Geochemistry, 69,273–332.
Kent AJR, Darr C, Koleszar AM, Salisbury MJ, Cooper KM
(2010) Preferential eruption of andesitic magmas through
recharge filtering. Nature Geoscience, 3, 631–6.Le Bas MJ, Le Maitre RW, Streckeisen A, Zanettin B (1986) A
chemical classification of volcanic rocks based on the total alkali-
silica diagram. Journal of Petrology, 27, 745–50.Leach AM, Hieftje GM (2000) Methods for shot-to-shotnormalization in laser ablation with an inductively coupled
plasma time-of-flight mass spectrometer. Journal of AnalyticalAtomic Spectrometry, 15, 1121–4.
Leeman WP (1983) The influence of crustal structure on
subduction-related magmas. Journal of Volcanology andGeothermal Research, 87, 561–88.
Manning CE (2004) The chemistry of subduction-zone fluids.Earth and Planetary Science Letters, 223, 1–16.
M�etrich N, Wallace PJ (2008) Volatile abundances in basaltic
magmas and their degassing paths tracked by melt inclusions.
In: Minerals, Inclusions and Volcanic Processes . Reviews inMineralogy and Geochemistry (eds Putirka KD, Tepley FJ), 69,
© 2013 John Wiley & Sons Ltd, Geofluids, 13, 421–439
438 K. ROBERTSON et al.

pp. 363–402. Mineralogical Society of America, Geochemical
Society, USA.
Miller TP, Chertkoff DG, Eichelberger JC, Coombs ML (1999)Mount Dutton Volcano, Alaska: Aleutian Arc analog to Unzen
Volcano, Japan. Journal of Volcanology and Geothermal Research,89, 275–301.
Moore GW, Bogdanov NA, Drummond KJ, Golovchenko X,Larson RL, Pitman WC III, Rinehart WA, Siebert L, Simkin T,
Tilman SM, Uyeda S (1992) Plate-tectonic map of the Circum-
Pacific Region, Arctic Sheet, in Circum-Pacific Map Series, pp.
20, United States Geological Survey.Murphy MD, Sparks RSJ, Barclay J, Carroll MR, Brewer TS
(2000) Remobilization of andesite magma by intrusion of mafic
magma at the Soufriere Hills Volcano, Montserrat, West Indies.
Journal of Petrology, 41, 21–42.Nakamura M (1995) Continuous mixing of crystal much and
replenished magma in the ongoing Unzen eruption. Geology,23, 807–10.
Nelson ST, Montana A (1992) Sieve-textured plagioclase in
volcanic rocks produced by rapid decompression. AmericanMineralogist, 77, 1242–9.
Pettke T (2006) In situ laser-ablation ICP-MS analysis of meltinclusions and prospects for constraining subduction zone
magmatism. In: Melt Inclusions in Plutonic Rocks. Contributionsto Mineralogy and Petrology (eds Webster JD), 36, pp. 51–80.Mineralogical Association of Canada, Qu�ebec.
Pettke T, Halter WE, Webster JD, Aigner-Torres M, Heinrich CA
(2004) Accurate quantification of melt inclusion chemistry
by LA-ICP-MS: a comparison with EMP and SIMS andadvantages and possible limitations of these methods. Lithos, 78,333–61.
Pettke T, Oberli F, Aud�etat A, Guillong M, Simon AC, Hanley JJ,
Klemm LM (2012) Recent developments in elementconcentration and isotope ratio analysis of individual fluid
inclusions by laser ablation single and multiple collector ICP-
MS. Ore Geology Reviews, 44, 10–38.Plank TP, Langmuir CH (1988) An evaluation of the globalvariations in the major element chemistry of arc basalts. Earthand Planetary Science Letters, 90, 349–70.
Putirka KD, Tepley F.J III. (2008) Minerals, inclusions and volcanicprocesses. Reviews in Mineralogy and Geochemistry, 69, 1–8.
Robertson K (2011) Magma chamber processes at Mutnovsky
Volcano, Kamchatka. University of Nevada Las Vegas, PhD
Dissertation, 336 pp. Available online: http://digitalscholarship.unlv.edu/thesesdissertations/1378/
Schiano P (2003) Primitive mantle magmas recorded as silicate
melt inclusions in igneous minerals. Earth-Science Reviews, 63,121–44.
Selyangin OB (1993) Mutnovsky Volcano, Kamchatka: new
evidence on structure, evolution, and future activity. Volcanologyand Seismology, 15, 17–38.
Selyangin OB (2009) Wonderful World of Mutnovsky and GorelyVolcanoes: Volcanologic and Travelers Guide. Novaja Kniga,
Petropavlovsk-Kamchatsky.
Sparks SRJ, Sigurdsson H, Wilson L (1977) Magma mixing—mechanism for triggering acid explosive eruptions. Nature, 267,315–8.
Streck MJ, Wacaster S (2006) Plagioclase and pyroxene hosted
melt inclusions in basaltic andesites of the current eruption ofArenal volcano, Costa Rica. Journal of Volcanology andGeothermal Research., 157, 236–53.
Sun SS, McDonough WF (1989) Chemical and isotopic systematic
of oceanic basalts: implications for mantle compositions andprocesses. In: Magmatism in the Ocean Basins (eds Saunders
AD, Norry MJ), 42, pp. 313–345. Geological Society of
London, Bath.Ulmer P (1989) The dependence of the Fe2+-Mg cation-
partitioning between olivine and basaltic liquid on pressure,
temperature and composition—an experimental-study to 30 k
bars. Contributions to Mineralogy and Petrology, 101, 261–73.Venezky DY, Rutherford MJ (1997) Preeruption conditions and
timing of dacite-andesite magma mixing in the 2.2 ka eruption
at Mount Rainier. Journal of Geophysical Research – Solid Earth,102, 20069–86.
Wallace PJ (2005) Volatiles in subduction zone magmas:
concentrations and fluxes based on melt inclusion and volcanic
gas data. Journal of Volcanology and Geothermal Research, 140,217–40.
Wilson M (1989) Igneous Petrogenesis: A Global TectonicApproach. Unwin Hyman, London, Boston.
Yogodzinski GM, Kay RW, Volynets ON, Koloskov AV, Kay SM(1995) Magnesian andesite in the Western Komandorsky
region: Implications for slab melting and processes in the
mantle wedge. GSA Bulletin, 107, 505–19.Zajacz Z, Halter W (2007) LA-ICP-MS analyses of silicate meltinclusions in co-precipitated minerals: quantification, data
analysis and mineral/melt partitioning. Geochimica etCosmochimica Acta, 71, 1021–40.
SUPPORTING INFORMATION
Additional Supporting Information may be found in the
online version of this article:
Table S1. Bulk rock, melt inclusion and host mineral
element concentrations.
© 2013 John Wiley & Sons Ltd, Geofluids, 13, 421–439
Evolution of Mutnovsky Volcano, Kamchatka 439

Volume 13, Number 4, November 2013ISSN 1468-8115
Geofluids
This journal is available online at Wiley Online Library. Visit onlinelibrary.wiley.com to search the articles and register for table of contents and e-mail alerts.
Geofluids is abstracted/indexed in Chemical Abstracts
CONTENTS
395 EDITORIAL: Introduction to thematic issue on fluid and melt inclusionsR.J. Bodnar, T.P. Mernagh, I.M. Samson and C.E. Manning
398 Role of fluid and melt inclusion studies in geologic researchS.E. Kesler, R.J. Bodnar and T.P. Mernagh
405 Nanogranite inclusions in migmatitic garnet: behavior during piston-cylinder remelting experimentsO. Bartoli, B. Cesare, S. Poli, A. Acosta-Vigil, R. Esposito, A. Turina, R.J. Bodnar, R.J. Angel and J. Hunter
421 Melt inclusion evidence for magma evolution at Mutnovsky volcano, KamchatkaK. Robertson, A. Simon, T. Pettke, E. Smith, O. Selyangin, A. Kiryukhin, S.R. Mulcahy and J.D. Walker
440 Investigation of long-term geochemical variations and magmatic processes at Mount St. HelensM.J. Severs, K.J. Gryger, S.A. Makin, R.J. Bodnar and W.B. Bradford
453 Zircon-bearing, crystallized melt inclusions in peritectic garnet from the western Adirondack Mountains, New YorkState, USAR.S. Darling
460 Are silicate-rich inclusions in spodumene crystallized aliquots of boundary layer melt?A.J. Anderson
467 Observations on the crystallization of spodumene from aqueous solutions in a hydrothermal diamond-anvil cellJ. Li, I.-M. Chou, S. Yuan and R.C. Burruss
475 Fluid inclusion evidence for a genetic link between simple antimony veins and giant silver veins in the Coeur d’Alene mining district, ID and MT, USAA.H. Hofstra, E.E. Marsh, T.I. Todorov and P. Emsbo
494 An evaluation of hydrogen sulfide in orogenic gold fluids and the uncertainties associated with vapor-rich inclusionsT.P. Mernagh and E.N. Bastrakov
506 Geology, fluid inclusion, and isotope constraints on ore genesis of the Neoproterozoic Jinshan orogenic golddeposit, South ChinaC. Zhao, P. Ni, G.-G. Wang, J.-Y. Ding, H. Chen, K.-D. Zhao, Y.-T. Cai and Y.-F. Xu
528 Fluid inclusions at different depths in the Sanshandao gold deposit, Jiaodong Peninsula, ChinaF.F. Hu, H.R. Fan, X.H. Jiang, X.C. Li, K.F. Yang and T. Mernagh
542 Boiling as a mechanism for colour zonations observed at the Byrud emerald deposit, Eidsvoll, Norway: fluid inclusion, stable isotope and Ar–Ar studiesL. Loughrey, D. Marshall, P. Ihlen and P. Jones
559 A fluid inclusion study of diagenetic fluids in Proterozoic and Paleozoic carbonate rocks, Victoria Island, NWTJ. Mathieu, D.J. Kontak and E.C. Turner
579 Acid saline fluid inclusions: examples from modern and Permian extreme lake systemsK.C. Benison
594 Multiple hydrocarbon charging events in Kuh-e-Mond oil field, Coastal Fars: evidence from biomarkers in oil inclusionsZ. Shariatinia, S. Feiznia, A. Shafiei, M. Haghighi, A. Mousavi Dehghani, M. Memariani and N. Farhadian
gfl_13_4_Issue toc_OC 10/25/2013 3:46 PM Page 1