melting and equilibrium shape of icosahedral gold nanoparticles
TRANSCRIPT

www.elsevier.com/locate/cplett
Chemical Physics Letters 394 (2004) 257–261
Melting and equilibrium shape of icosahedral gold nanoparticles
Yanting Wang a, S. Teitel a,*, Christoph Dellago b
a Department of Physics and Astronomy, University of Rochester, Rochester, NY 14627, USAb Institute for Experimental Physics, University of Vienna, Boltzmanngasse 5, 1090 Vienna, Austria
Received 9 March 2004; in final form 8 June 2004
Available online 27 July 2004
Abstract
We use molecular dynamics simulations to study the melting of gold icosahedral clusters of a few thousand atoms. We pay par-
ticular attention to the behavior of surface atoms, and to the equilibrium shape of the cluster. We find that the surface of the cluster
does not pre-melt, but rather remains ordered up to the melting Tm. However, the increasing mobility of vertex and edge atoms
significantly softens the surface structure, leading to inter- and intra-layer diffusion, and shrinking of the average facet size, so that
the average shape of the cluster is nearly spherical at melting.
� 2004 Elsevier B.V. All rights reserved.
Gold particles consisting of ten to thousands of
atoms have unique optical and mechanical properties
and hold great promise as building blocks for nanobio-
electronic devices [1,2], catalysts [3], and sensors [4]. It is
therefore natural that the physics and chemistry of these
materials are a current research subject of great interest
[5]. For future applications knowledge of the structure
and stability of gold nanoparticles of different size andmorphology is particularly important.
While bulk gold has an fcc crystal structure, the com-
petition between bulk and surface energies in nanometer
sized gold crystallites can result in several different com-
peting structures [6,7]. Depending on cluster size and ex-
ternal conditions transitions between these structures
have been observed [7,8]. One such structure which
has been observed both in simulations [9,10] and in ex-periments [11,12], is the �Mackay icosahedron� [13,14],consisting of 20 slightly distorted fcc tetrahedra, with
four {111} faces each, meeting at the center to form
an icosahedral shaped cluster. The internal faces of the
tetrahedra meet at strain inducing twin grain boundaries
with hcp structure, leaving the cluster with 20 external
0009-2614/$ - see front matter � 2004 Elsevier B.V. All rights reserved.
doi:10.1016/j.cplett.2004.06.139
* Corresponding author. Fax: +1 585 273 3237.
E-mail address: [email protected] (S. Teitel).
{111} facets. Theoretical models [15–18] have predicted
different limits for the stability of such icosahedral clus-
ters, and it is unclear whether their formation is an equi-
librium or rather a kinetic process [11,17–21].
Nevertheless, it is natural to suppose that formation of
this structure is related to the very high stability of the
{111} external surfaces. Simulations [22] and experi-
ments [23] on bulk slab-like geometries with exposed{111} surfaces have shown that, unlike the {100} and
{110} surfaces which melt below the bulk melting tem-
perature Tm, the {111} surface neither melts nor rough-
ens but remains ordered up to and above Tm, and can in
fact lead to superheating of the solid [25]. In light of this
observation it is interesting to consider how the high sta-
bility of the {111} facets effects the melting and equilib-
rium shape of such icosahedral nanoclusters.In order to address this issue, we have performed de-
tailed numerical simulations of icosahedral gold nano-
clusters of a few thousand atoms, obtained by cooling
from the melt. We pay particular attention to the behav-
ior of the surface atoms and to the equilibrium shape.
We find a sharp first-order melting transition Tm. Unlike
earlier results on smaller cuboctahedral clusters [24],
which include non {111} facets that pre-melt belowTm, we find no surface pre-melting of the {111} facets

-3.50
-3.45
-3.40
-3.35
-3.30
-3.25
200 400 600 800 1000 1200
Pote
ntia
l Ene
rgy
(eV
)
T (K)
Tm
≈1075 K
Fig. 1. Potential energy vs. T for a 2624 atom gold cluster. The sharp
jump at T = 1075 K indicates the first-order melting transition.
258 Y. Wang et al. / Chemical Physics Letters 394 (2004) 257–261
of our icosahedral cluster. Nevertheless, we find that
there is a considerable softening of the cluster surface
roughly �200 K below Tm due to the motion of atoms
along the vertices and edges of the cluster. In this region
we find both intra-layer and inter-layer diffusion of
atoms, which increases considerably asTm is approached.The equilibrium shape progresses from fully faceted, to
faceted with rounded edges, to nearly spherical just be-
low Tm. Throughout this region, the interior atoms of
the cluster remain essentially perfectly ordered, until
Tm is reached.
Using the many-body �glue� potential [26] to model
interactions among gold atoms, we carry out molecular
dynamics simulations, integrating the classical equationsof motion with the velocity Verlet algorithm [27] with a
time step of 4.3 fs. The results presented here are for a
2624 atom cluster, with a diameter of �40 A, but we
have also considered other sizes. We start our simula-
tions at a high T = 1500 K > Tm, and cool using the An-
dersen thermostat method [27] to 1000 K. We then cool,
in intervals of 100 K, down to 200 K, using 5 · 106 steps
(21 ns) at each temperature. Even though our N = 2624atoms is not a �magic number� for a perfect icosahedral
structure (the nearest such number being 2868), the clus-
ter structure we find with this method is nevertheless
clearly a Mackay icosahedron consisting of slightly dis-
torted tetrahedra with different number of atoms, but
with a missing central atom. Similar icosahedral struc-
tures were obtained in runs with different particle num-
bers. Such a central vacancy, postulated for copper andaluminum but not for gold [28], has been considered
previously [29] as a means of partially relieving the
strain caused by the hcp twin grain boundaries between
the fcc tetrahedra.
To study melting and the equilibrium shape, we next
heat the cluster up using constant temperature molecu-
lar dynamics [30]. To compute equilibrium properties,
we take at each temperature 106 steps (4.3 ns) for equi-libration, followed by 107 steps (43 ns) to compute aver-
ages. We take fine temperature increments in the vicinity
of the cluster melting transition. In Fig. 1 we show our
results for the average potential energy vs. temperature.
We found the cluster to melt at Tm = 1075 K, with a dis-
continuous jump in potential energy. Over the whole
temperature range from 200 to 1200 K gold atoms were
never observed to evaporate from the cluster.To characterize the structure of the cluster, we meas-
ure the standard bond orientational order parameters
Q6; W 6; Q4 and W 4 [31] which are often used to distin-
guish between different phases of condensed materials
[30,32]. These bond order parameters, designed to probe
the degree and type of crystallinity, are sensitive to the
orientational correlations of �bonds� i.e. the vectors join-ing pairs of neighboring atoms. In the liquid phase, suchcorrelations decay quickly with growing distance and
the bond order parameters vanish. In crystalline solids,
on the other hand, orientational bond correlations per-
sist over large distances leading to order parameterswith finite values. We refer the reader to the work of
[31] for the definition of these quantities, and their val-
ues in common crystal structures. To distinguish be-
tween bulk and surface behavior, we first identify all
atoms on the surface of the cluster, then the atoms in
the first sub layer below the surface, and so on; the clus-
ter has nine such layers. We label as �interior� atoms
those lying below the fourth sub layer (our results areessentially unchanged if we define the �interior� as all
atoms below the first sub layer). In Fig. 2a we plot the
bond order parameters averaged over only bonds be-
tween the interior atoms. We see Q4; W 4 � 0 at all T,
while Q6 and W 6 take finite values for T < Tm appropri-
ate to the Mackay icosahedron. Q6 and W 6 remain
essentially constant, decreasing only slightly just below
Tm, indicating that the bulk ordering remains stableup until melting. In contrast, Fig. 2b shows the bond
order parameters averaged over only bonds between
the surface atoms. Again Q4; W 4 � 0 at all T, while
Q6 and W 6 take finite values for T < Tm. However, here
we see a much more pronounced decrease, particularly
in Q6 starting well below Tm, until both vanish at melt-
ing (the finite value of Q6 above melting is a finite size
effect that decreases as the cluster size increases). Thus,while the surface remains ordered below Tm, i.e.
jQ6j; jW 6j > 0, the surface order softens to a much
greater extent than does the bulk as Tm is approached.
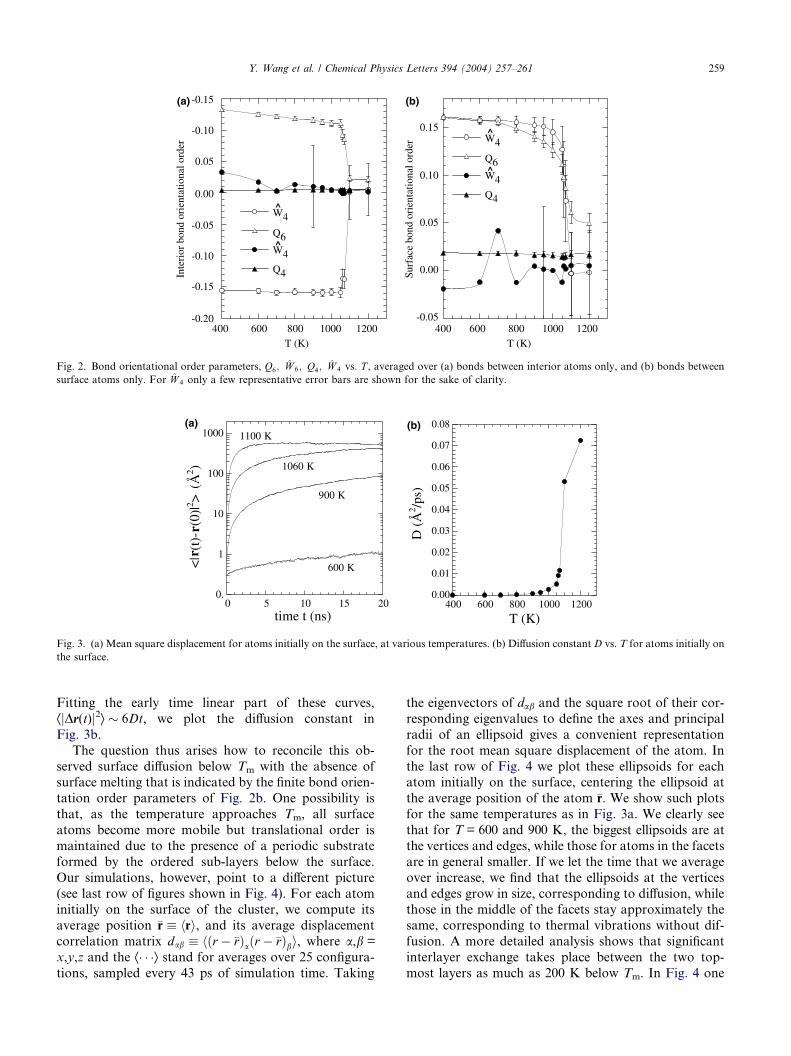
Next we consider the diffusion of the surface atoms.
In Fig. 3a we plot, for several different temperatures,
the average mean square displacement ÆjDr(t)j2æ ”Æjr(t)�r(0)j2æ vs. time t, where the average is over all
the atoms which were initially on the surface of the clus-ter. At T = 600 K, diffusion is very slow, with displace-
ments after 20 ns remaining less than one atomic
separation. At T = 900 K, almost 200 K below Tm, dif-
fusion is significant. At T = 1060 K, 15 K below Tm, the
mean square displacement saturates at large t, indicating
that atoms now diffuse the entire length of the cluster.
-0.20
-0.15
-0.10
0.05
-0.10
-0.15
-0.05
-0.05
0.00
0.00
0.05
0.10
0.15
400 600 800 1000 1200
Inte
rior
bon
d or
ient
atio
nal o
rder
Surf
ace
bond
ori
enta
tiona
l ord
er
T (K)400 600 800 1000 1200
T (K)
Q4
W4
W4
Q6
Q4
W4
W4
Q6
(a) (b)
^
^
^
^
Fig. 2. Bond orientational order parameters, Q6; W 6; Q4; W 4 vs: T , averaged over (a) bonds between interior atoms only, and (b) bonds between
surface atoms only. For W 4 only a few representative error bars are shown for the sake of clarity.
0.00
0.01
0.02
0.03
0.04
0.05
0.06
0.07
0.08
400 600 800 1000 1200
T (K)
D (
Å2 /p
s)(b)
0.
1
10
100
1000
0 5 10 15 20time t (ns)
1100 K
1060 K
900 K
600 K
(Å2 )
<|
(t)-
(0)
|2 >r
r
(a)
Fig. 3. (a) Mean square displacement for atoms initially on the surface, at various temperatures. (b) Diffusion constant D vs. T for atoms initially on
the surface.
Y. Wang et al. / Chemical Physics Letters 394 (2004) 257–261 259
Fitting the early time linear part of these curves,
ÆjDr(t)j2æ � 6Dt, we plot the diffusion constant in
Fig. 3b.
The question thus arises how to reconcile this ob-
served surface diffusion below Tm with the absence ofsurface melting that is indicated by the finite bond orien-
tation order parameters of Fig. 2b. One possibility is
that, as the temperature approaches Tm, all surface
atoms become more mobile but translational order is
maintained due to the presence of a periodic substrate
formed by the ordered sub-layers below the surface.
Our simulations, however, point to a different picture
(see last row of figures shown in Fig. 4). For each atominitially on the surface of the cluster, we compute its
average position �r � hri, and its average displacement
correlation matrix dab � hðr � �rÞaðr � �rÞbi, where a,b =
x,y,z and the Æ� � �æ stand for averages over 25 configura-
tions, sampled every 43 ps of simulation time. Taking
the eigenvectors of dab and the square root of their cor-
responding eigenvalues to define the axes and principal
radii of an ellipsoid gives a convenient representation
for the root mean square displacement of the atom. In
the last row of Fig. 4 we plot these ellipsoids for eachatom initially on the surface, centering the ellipsoid at
the average position of the atom �r. We show such plots
for the same temperatures as in Fig. 3a. We clearly see
that for T = 600 and 900 K, the biggest ellipsoids are at
the vertices and edges, while those for atoms in the facets
are in general smaller. If we let the time that we average
over increase, we find that the ellipsoids at the vertices
and edges grow in size, corresponding to diffusion, whilethose in the middle of the facets stay approximately the
same, corresponding to thermal vibrations without dif-
fusion. A more detailed analysis shows that significant
interlayer exchange takes place between the two top-
most layers as much as 200 K below Tm. In Fig. 4 one

Fig. 4. For the indicated temperatures, top row: average cluster shape for a simulation time of 43 ns; middle row: histogram of the maximal local
curvatures of the average shape; bottom row: ellipsoids indicate root mean square displacements of atoms on the cluster surface over a simulation
time of 1.075 ns.
260 Y. Wang et al. / Chemical Physics Letters 394 (2004) 257–261
can see ellipsoids oriented normal to the cluster surface,corresponding to this interlayer diffusion. For the higher
temperatures, T = 1060 K just below melting, and
T = 1100 K just above melting, diffusion is pronounced
throughout the entire surface.
Finally, we consider the effects of the vertex and edge
atom diffusion on the equilibrium shape of the cluster.
Because of the small cluster size, the instantaneous
shapes fluctuate significantly at high temperatures. Butsince our simulation algorithm conserves angular mo-
mentum, and the angular momentum is zero, our sample
does not rotate as a whole. Hence we can compute a well
defined average equilibrium shape at each temperature.
We measure this equilibrium shape by averaging over
the instantaneous shapes as follows. We divide space
up into 842 approximately equal solid angles [33], corre-
sponding roughly to the number of surface atoms. Wethen average the position of the surface atoms found
in each solid angle over 1000 configurations sampled
at equal times throughout the simulation of total time
43 ns. This defines the average radial position of the
cluster within each solid angle, and hence the average
cluster shape. In the top row of Fig. 4 we show the re-
sulting equilibrium shapes for several temperatures.
We see that the shape is rounding out as the temperature
increases, assuming a nearly perfect spherical shapeabove Tm.
To quantify this, we compute the curvature distribu-
tion of the surface as follows. Using the average position
of the surface in a given solid angle and its nearest neigh-
bors, we fit to determine the best tangent plane to these
points. Defining the normal to this plane as the z axis,
we then find the best paraboloid that fits through the
points. The principal curvatures of this paraboloid thengive our approximation for the two principal curvatures
of the surface at the given solid angle. We define j to be
the maximum of these two principal curvatures. In the
middle row of Fig. 4 we plot histograms of j as one
varies over all the solid angles defining the average sur-
face. At T = 600 and 900 K we see a sharp peak at j = 0
corresponding to the points on flat facets, and a high jtail corresponding to higher curvatures on the edges andvertices. At T = 1060 K, just below Tm = 1075 K, the
peak at j = 0 has essentially vanished, and one has a
broad distribution centered about j . 1/R with
R = 21.5 A, the radius of the spherical liquid drop above
Tm. At T = 1100 K, just above Tm, the distribution
becomes very sharply peaked about j = 1/R.
To conclude, we have found that gold nanoparticles
of a few thousand atoms form a Mackay icosahedral

Y. Wang et al. / Chemical Physics Letters 394 (2004) 257–261 261
structure, with missing central atom, when cooled from
a liquid. Upon slow heating, we find that this bulk struc-
ture remains stable up to a sharp first-order melting. The
surface remains ordered with no pre-melting below Tm,
however it softens considerably with increasing diffusion
due to mobile vertex and edge atoms. As Tm is ap-proached, this diffusion of edge atoms leads to signifi-
cant shrinkage of the {111} facet sizes in the average
cluster shape, leading to an almost spherical shape just
below Tm. In addition to the cluster of 2624 atoms re-
ported upon here, we have also considered clusters of
different sizes with 603 and 1409 atoms. While the melt-
ing temperature Tm was observed to increase with in-
creasing cluster size, we continued to find the samegeneral features, with the surface softening tracking
the increase in Tm. It would be interesting to know
how this surface softening is related to morphological
transitions observed in gold nanorods at temperatures
below the melting temperature [30,34].
Acknowledgement
This work was funded in part by DOE grant
DE-FG02-89ER14017.
References
[1] M.G. Warner, J.E. Hutchison, Nat. Mater. 2 (2003) 272.
[2] Y. Xiao, F. Patolsky, E. Katz, J.F. Hainfeld, I. Willner, Science
299 (2003) 1877.
[3] A.T. Bell, Science 299 (2003) 1688.
[4] S.O. Obare, R.E. Hollowell, C.J. Murphy, Langmuir 18 (2002)
10407.
[5] D.L. Feldheim, C.A. Foss (Eds.), Metal Nanoparticles; Synthesis,
Characterization, and Applications, Dekker, New York, 2002.
[6] S. Iijima, T. Ichihashi, Phys. Rev. Lett. 56 (1986) 616.
[7] C.L. Cleveland, W.D. Luedke, U. Landman, Phys. Rev. B 60
(1999) 5065.
[8] L.J. Lewis, P. Jensen, J.-L. Barrat, Phys. Rev. B 56 (1997) 2248.
[9] Y.G. Chushak, L.S. Bartell, J. Phys. Chem. B 105 (2001) 11605.
[10] H.-S. Nam, Nong M. Hwang, B.D. Yu, J.-K. Yoon, Phys. Rev.
Lett. 89 (2002) 275502.
[11] L.D. Marks, Rep. Prog. Phys. 57 (1994) 603.
[12] J.A. Ascencio, C. Gutierrez-Wing, M.E. Espinosa, M. Martın, S.
Tehuacanero, C. Zorrilla, M. Jose-Yacaman, Surf. Sci. 396 (1998)
349.
[13] A.L. Mackay, Acta Cryst. 15 (1962) 916.
[14] T.P. Martin, Phys. Rep. 273 (1996) 199.
[15] G. Wulff, Z. F. Kristallogr. 34 (1901) 449.
[16] C. Herring, Phys. Rev. 82 (1931) 87.
[17] S. Ino, J. Phys. Soc. Jpn. 27 (1969) 941.
[18] C.L. Cleveland, U. Landman, M.N. Shafigullin, P.W. Stephens,
R.L. Whetten, Z. Phys. D 40 (1997) 503.
[19] C.L. Cleveland, U. Landman, T.G. Schaaff, M.N. Shafigullin,
P.W. Stephens, R.L. Whetten, Phys. Rev. Lett. 79 (1997) 1873.
[20] K. Michaelian, N. Rendon, I.L. Garzon, Phys. Rev. B 60 (1999)
2000.
[21] L.D. Marks, Philos. Mag. 49 (1984) 81.
[22] P. Carnevali, F. Ercolessi, E. Tosatti, Phys. Rev. B 36 (1987)
6701.
[23] K.D. Stock, B. Grosser, J. Cryst. Growth 50 (1980) 485.
[24] F. Ercolessi, W. Andreoni, E. Tosatti, Phys. Rev. Lett. 66 (1991)
911.
[25] F.D. Di Tolla, E. Tosatti, F. Ercolessi, in: K. Binder, G. Ciccotti
(Eds.), Monte Carlo and Molecular Dynamics of Condensed
Matter Systems, Societa Italiana di Fisica, Bologna, 1996, pp.
345–398.
[26] F. Ercolessi, M. Parrinello, E. Tosatti, Philos. Mag. A 58 (1988)
213.
[27] D. Frenkel, B. Smit, Understanding Molecular Simulation, second
edn., Academic Press, 2002.
[28] C. Mottet, G. Treglia, B. Legrand, Surf. Sci. 383 (1997) L719.
[29] L.L. Boyer, J.Q. Broughton, Phys. Rev. B 42 (1990) 11461.
[30] Y. Wang, C. Dellago, J. Phys. Chem. B 107 (2003) 9214.
[31] P.J. Steinhardt, D.R. Nelson, M. Ronchetti, Phys. Rev. B 28
(1983) 784.
[32] P.R. ten Wolde, M.J. Ruiz-Montero, D. Frenkel, J. Chem. Phys.
104 (1996) 9932.
[33] R.H. Hardin, N.J.A. Sloane, W.D. Smith, Tables of Spherical
Codes with Icosahedral Symmetry, published electronically at
http://www.research.att.com/~njas/icosahedral.codes/.
[34] S. Link, Z.L. Wang, M.A. El-Sayed, J. Phys. Chem. B 104 (2000)
7867.