mem seminar series 2001/2002 school of design and environment national university of singapore...
TRANSCRIPT

MEM Seminar Series 2001/2002School of Design and EnvironmentNational University of Singapore
August 25, 2001
Overcoming Barriersto EHS
Presentation Outline
Profile Jebsen & Jessen The First EHS Efforts Formal EHS Management Achievements and Failures “Spoon Feeding” Approach Benefits and Shortcomings Achieving Lasting Consistency The Next Chapter: Sustainability
Jebsen & Jessen SEA
A Brief Corporate Profile

ASEAN Regional Network
40 companies operating under seven activity-related divisions
Areas of operation: ASEAN
Number of employees: 2,500

Regional Coverage
Philippine
sManilaCebu
Thailand
BangkokChiengm
ai
Indonesia Jakarta
Surabaya Medan
Semarang Bandung
Ujung Pandang
Singapore
VietnamHo Chi Minh
(Saigon)Hanoi
BruneiBandar SeriBagawan
Kuala Belait
SarawakKuching
SabahKota Kinabalu
W. Malaysia
Kuala Lumpur
Penang Johore Bahru
Kuantan Ipoh
Malacca

Regional Businesses
Chemicals Communications Industrial Products Marketing Material Handling Packaging Process Technology

Chemicals
Chemicals Nutrition Metals
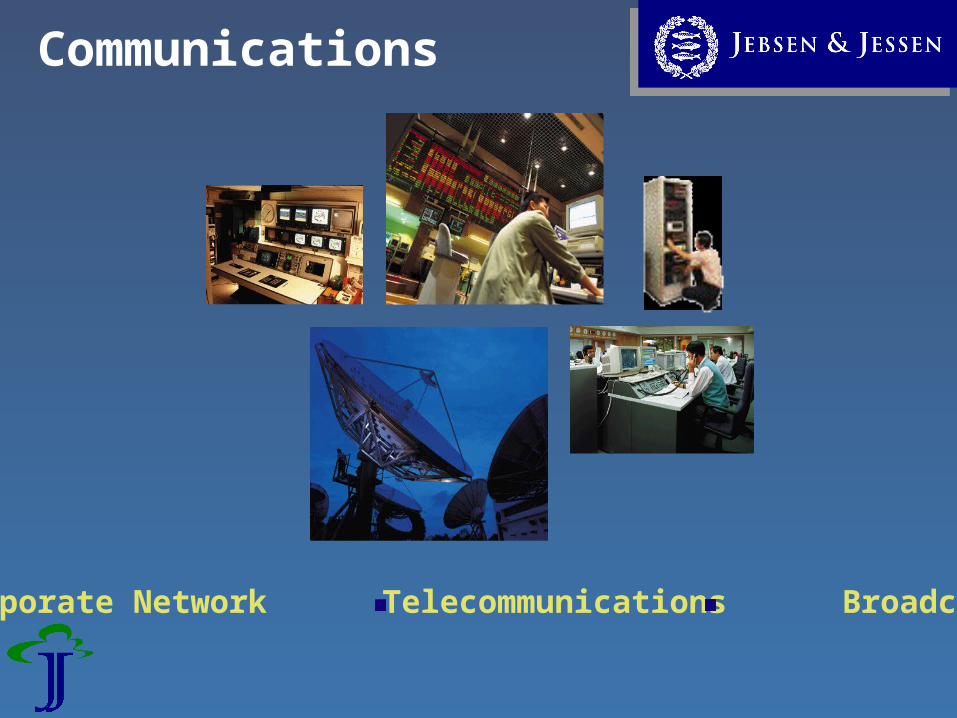
Communications
Corporate Network Telecommunications Broadcast
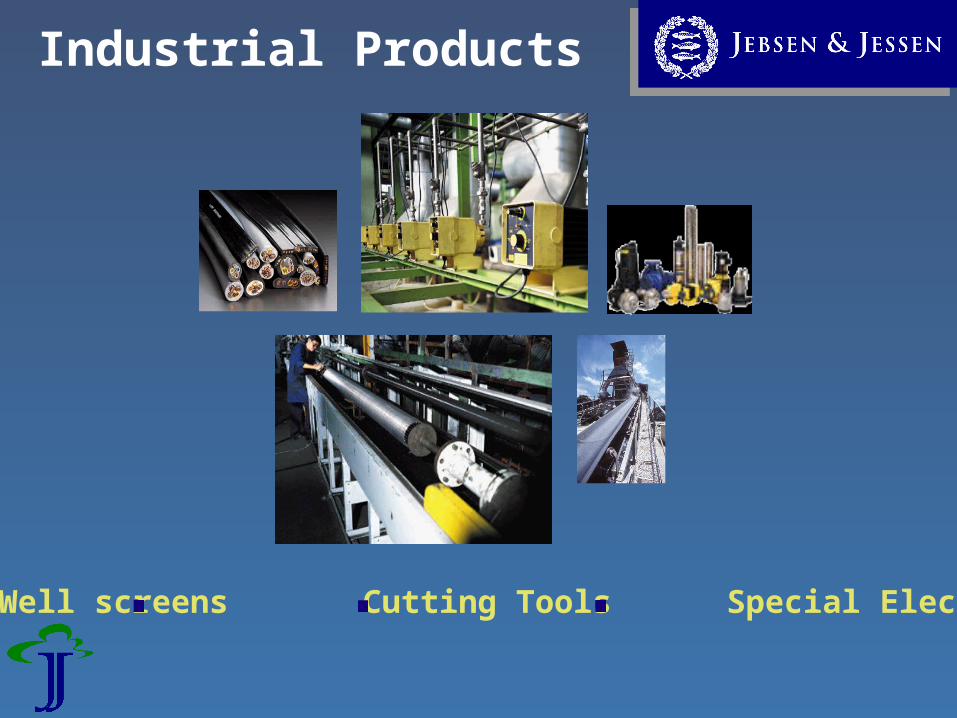
Industrial Products
Pumps Well screens Cutting Tools Special Electric Cables

Marketing
Consumer Medical & Scientific Textiles Automotive Spares

Material Handling
Cranes & Hoists Logistic Systems IPD Spares & Services

Packaging
Moulded Foam Packaging Integrated Packaging Construction

Process Engineering
Industrial Plant Marketing Industrial Plant Contracting

Group Statistical Profile
Revenue by country Revenue by regional business unit
Employees by regional business unitEmployees by country
IND 9%
SIN42%
MY27%
TH18%
PH 4%
SIN29%
PH 6%
IND18%
MY31%
TH15%
MHE 32%
HLD 7%
COM 7%
CHE9%
PRT 7%
PKG 11%
IPD 12%
MKT14%
IPD 9%
PKG 7%
PRT 7%
CHE 22 %MKT 19%
COM 12%
MHE 25%
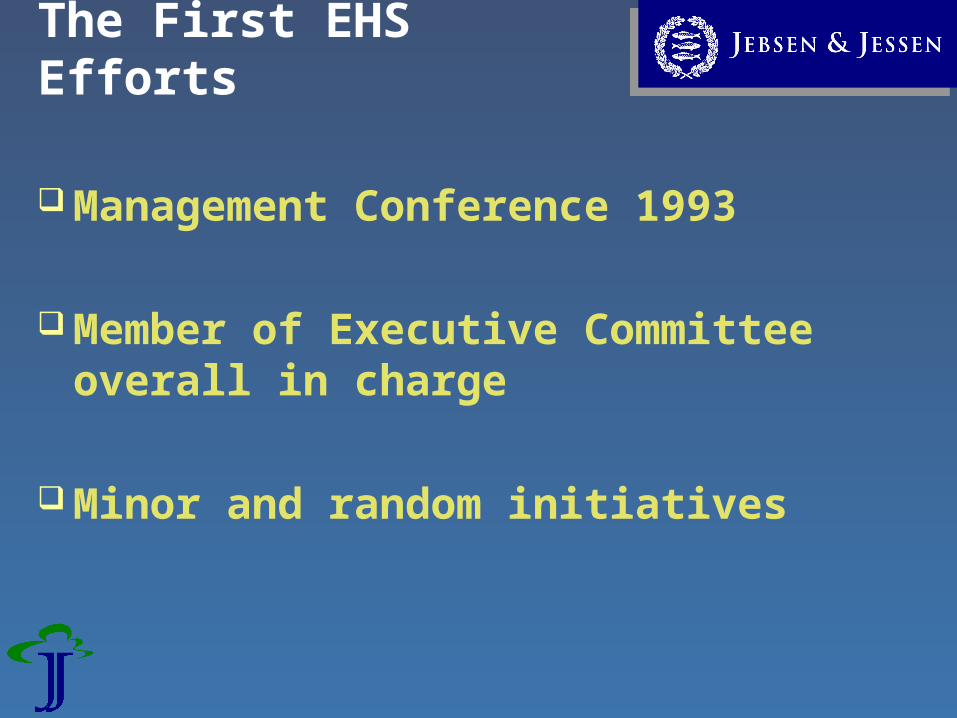
The First EHS Efforts
Management Conference 1993
Member of Executive Committee overall in charge
Minor and random initiatives

Corporate Commitment To be a leading provider within ASEAN of quality products and
services dedicated to fulfilling customer needs with professionalism and integrity.
To maintain an environment that attracts, develops, retains, rewards and motivates talent and productivity.
To establish environmental excellence in all our business enterprises and actively promote environmentally responsible behaviour at all levels of our organisations and in customers, suppliers and principals.
To strive for an outstanding corporate and individual behaviour to maintain lasting trust and confidence of our customers, employees and suppliers.
To maintain a level of profitability that sustains growth, ensures quality and provides generous rewards to staff and an adequate return to shareholders

The Background
EHS awarenessPublic Moderate Low, growingEmployees Moderate MixedRetail customers Moderate LimitedIndustrial customers Moderate Moderate
Intrinsic mgmt interest Mixed Low
Strategic mgmt interest Mixed Low
ISO 14001 Low/Moderate Moderate
Japan/US/EU ASEAN

Regulations Strong Strong
Reg enforcement Strong Low - Moderate
Media focus Bad/shock newsGood / bad news- Pollution, injuries - Govt
influence
NGOs Large memberships Limited role
Labour unions Moderate size Limited role
Shareholders Special interests Limited interest
Japan/US/EU ASEAN
The Background

Formal EHS Management
1995

EHS as a Central Service
Executive Management
Finance & Treasury
Corporate & Legal Affairs
Human Resources
Environment, Health & Safety
Corporate Communication
Information Technology
Internal Audit & Taxation
40 Member
Companies
Providing Central Services
Providing Central Services

EHS ManagementEnvironment, Health & Safety Organisation
Executive Board
Operational Effectiveness
Director - Env.,Health & Safety
Internal AuditDepartment
Manager - Env.,Health & Safety
Regional ManagingDirectors
EHS Chairs
CompanyManagers
Joint-VentureBoards
EHS CommitteesConsultants
----------------------------------------------------------------
||||||
----
----
||||||||||||||||||||||||||||
----
Central Services Unit EHS
Central Services Unit EHS
EHS ChairEHS Chair
EHS CommitteeEHS Committee
CSU Audit

Decentralised Approach
Within overall EHS policies, each member company was expected to pursue its own initiatives

Accomplishments 1995-19971.EHS audits and understanding of weaknesses
2.Group EHS Policy
3.Network of EHS chairs and committees
4.Review of EHS laws in our 5 major countries
5.Training materials and programmes
6.Network of EHS expertise (consultants, organisations)
7.Audit checklists, facility checklists, procurement guide
8. Awareness campaign
9. Various EHS performance improvement projects

Idealism vs. Pragmatism
CFC Business TBTO Hazardous Wastes Paint Furniture Polystyrene
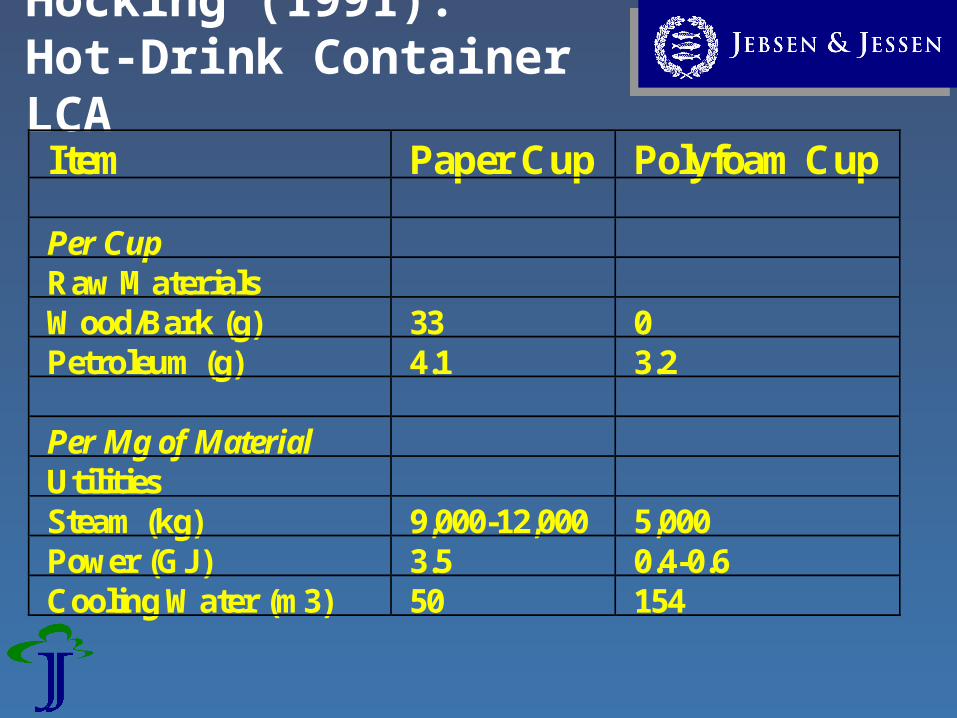
Hocking (1991): Hot-Drink Container LCA
Item Paper Cup Polyfoam Cup
Per CupRaw MaterialsWood/Bark (g) 33 0Petroleum (g) 4.1 3.2
Per Mg of MaterialUtilitiesSteam (kg) 9,000-12,000 5,000Power (GJ) 3.5 0.4-0.6Cooling Water (m3) 50 154

Hocking (1991): Hot-Drink Container LCA
Item Paper Cup Polyfoam Cup
Per Mg of MaterialWater EffluentVolume (m3) 50-190 0.5-2TSS (kg) 35-60 TraceBOD (kg) 30-50 0.07Organochlorides (kg) 5-7 0Metal Salts 1-20 20

Hocking (1991): Hot-Drink Container LCA
Item Paper Cup Polyfoam Cup
Per Mg of MaterialAir EmissionsChlorine (kg) 0.5 0Sulfides (kg) 2.0 0Particulates (kg) 5-15 0.1Pentane (kg) 0 35-50
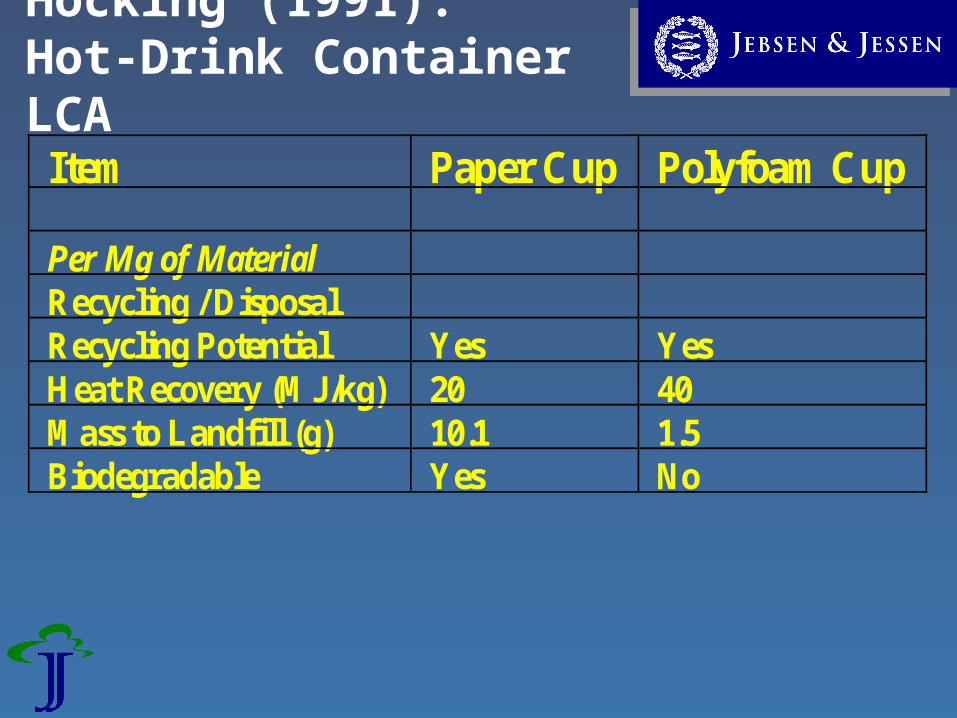
Hocking (1991): Hot-Drink Container LCA
Item Paper Cup Polyfoam Cup
Per Mg of MaterialRecycling / DisposalRecycling Potential Yes YesHeat Recovery (MJ/kg) 20 40Mass to Landfill (g) 10.1 1.5Biodegradable Yes No

Hub & Spoke EHS ServiceOperating in the environment prior to the RBU structure, the approach CSU EHS pursued was hub & spoke
CSU EHS
JJMM
JJDP
JJDS
JJMS
JJCM
JJCT
JJMT
MDM
MDS
MDTMDP
MDS
MDI
JJCS
JJCT
JJPS
JJPMJJHM
JJHS
JJDT
JJDI
JJIPT JJPTI JJIPSJJPTT
Customised attention to each company
Fast communication
Benefits

Huge effort required to service and monitor 40 individual clients
Confusion as to what was required
Difficult to leverage opportunities within and across: RBUs, facilities, and countries due to exclusive reliance on CSU EHS
Drawbacks

Continuous “fire drills” limit time to think and plan strategically
Little incentive for member companies to generate their own agenda
Drawbacks
1997
“Spoon Feeding” Approach

Major goals:
– Formal standards and action plans– Improve effectiveness– Mandatory minimum standards
Leveraging information and resources in 3 ways:
1. Within regional business groups2. Among facilities3. Within countries
The tool: EHS Programmes – Assign responsibilities– Provide information and tools
The tool: EHS Programmes – Assign responsibilities– Provide information and tools
“Spoon Feeding” Approach

EHS by Regional Business
Proposed RBU-Based Support
CSU EHS and RMDs
PKG Group
IPD Group
MHE Group
CHE Group
PRT GroupMKT Group
COM Group
The Group’s new regional business framework identified a need to address common issues within common businesses.
Benefits include:•EHS training for specific regional business

EHS by Type of FacilityThe regional businesses use four common types of facilities:
– 48 Offices– 5 Hazardous warehouses– 12 Factories– 13 Stores and workshops
Benefits include:•Aligns management effort to risk level •Leverages synergies across businesses
Central EHS
!

EHS by Country
The Group has up to seven business locations within each country, revealing potential opportunities for synergy.
CSU EHS and RMDs
Malaysia Group
Singapore Group
Thailand Group
Indonesia Group
Philippines Group Japan
Group
VietnamGroup
Benefits include:•Providing common EHS legal advice
•Shared local training providers•Centralised EHS procurement
Central EHS

EHS Programmes
Part 1. Compliance with EHS Laws &
Regulations
Part 2. Emergency Preparedness & Response
Part 3. Occupational Health
Part 4. Worker Safety
Part 5. Environment
Part 6. Administration

EHS Legal Compliance
An important part of the group's commitment to managing our EHS issues is our compliance with EHS laws and regulations. Some of the regulations may impact the standards that are outlined below. In such cases, the more stringent standard should apply. The EHS committee is responsible for:
•Reviewing periodically the EHS Laws & Regulations binder to maintain familiarity with the laws and regulations that apply to the company
•Reporting to CSU EHS their status of regulatory compliance by 1 May using the format suggested in Appendix A
•Co-ordinating with company management and CSU EHS to ensure that the company remains in compliance with EHS laws and regulations
Resp
on
sib
ilit
ies
Sta
nd
ard
s

Emergency Preparedness & Response
Smoke detectors Fire evacuation
drills First aid training First aid kits Fire fighting
training
Fire fighting equipment
Illuminated exit signs
Fire doors Housekeeping Sign-posting No-smoking areas

Occupational Health
Sufficient lighting Noise testing Manual lifting Ergonomics Health monitoring

Occupational Health
LUX Locations
50 Passageways
100 Storage areas
200 Welding, rough machining
300 Drilling, cutting
500 Offices, detailed inspection
750 Conference rooms
Ergonomics Diagram Lighting Recommendations

Occupational Safety
Incident/accident reporting EHS training manual Forklift training Permit-to-work programme Site security Personal protective equipment (PPE) Tools and equipment Hazardous substances training

X
X
Occupational Safety

Environment
Recycling Energy conservation Paper reuse EHS Procurement Guide Technical monitoring EHS monitoring programme Ad-hoc improvements

Administration
Budgets Monthly EHS meetings Annual EHS audits Periodic self-assessment Risk management New employee induction

I have received a copy of the Group EHS Policy I have received a copy of the booklet "Our
Commitment to Preserving the Environment" I have been informed about the date of the
next fire drill I have been informed about the location of the
First Aid Kit nearest to my workplace I have been informed about the location of fire
extinguishers and evacuation routes nearest to my workplace
Employee Signature
Administration

Enablers
Availability of Useful Guidelines Vigorous Training Nurturing Champions (e.g. Regional
Trainers) EHS in Job Descriptions (e.g. Chemicals) Incentives (e.g. EHS Pot) Quantitative Focus (e.g. Accident
Statistics) Peer Pressure (e.g. EHS Audits) Group IT Infrastructure (SAP, Lotus Notes)

Facts Talk!
1999 Number of Accidents By Category
Arm5%
Back10%
Eye5%
Foot10%
Hands44%
Heads13%
Legs3%
Property Damage
10%
2000 Number of Accidents By Category
Legs20%
Property Damage24%
Near Miss8%
Fire Smoke4%
Arm4%
Hands40%
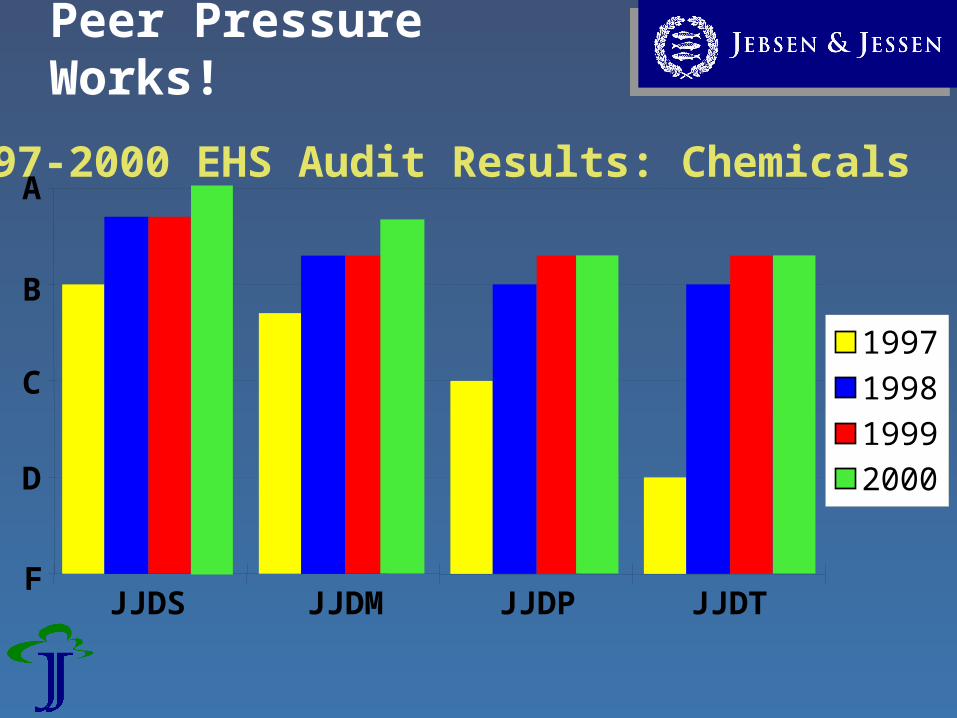
Peer Pressure Works!
1997-2000 EHS Audit Results: Chemicals
JJDS JJDM JJDP JJDT
1997
1998
1999
A
B
C
D
F
2000

IT Infrastructure
Lotus Notes SAP

Improving EHS management in the Chemicals RBU through SAP:– Recording chemical EHS
properties: Hazard class (toxic, flammable, etc.)
Storage climate (cool, dry, etc.)
IT Infrastructure

Improving EHS management in the Chemicals RBU through SAP:– Recording regulatory
requirements: Must customers have a poisons
license to buy this product?
Which customers have a poisons license?
IT Infrastructure

Improving EHS management in the Chemicals RBU through SAP:– Emergency contact details of
vendors– MSDS distribution:
When did we last send an MSDS to the customer?
What is the current version of each product’s MSDS?
IT Infrastructure

Resource Consumption Measured in SAP:– Electricity, in kWh– Water, in cubic metres– Fuel oil, in litres– Various raw materials, by
size/weight– Waste / scrap, by size/weight
IT Infrastructure

Drivers
Image, Corporate Citizenship

Bottom-Line Drivers
Lower Risk of Legal Liability Lower Insurance Premiums Enhanced Resource & Energy
Efficiency New Market Opportunities, First
Mover Advantage Anticipation of Trends, ISO 14001 Image, Corporate Citizenship

Bottom-Line Drivers
The Cost Iceberg

1997-1998: 27% reduction1998-1999: 18% reduction1999-2000: 11% reduction
Insurance Premiums Down!

“Hidden” Costs!

Risk Reduction!

Business Opportunities?
One Failure After Another:– Allerguard / Green Cotton– Water & Wastewater Treatment– Moulded Pulp Packaging

Benefits of “Spoon Feeding”
• Facilitates synergies acrossthe group
• Facilitates synergies within RBUs
• Facilitates synergies within facility types
• Facilitates synergies within metropolitan areas
• Facilitates CSU support and monitoring of EHS programme implementation
• One EHS data collection tool• Centralised PPE
procurement
• Combining ERP training within CHE group
• One permit-to-work programme in workshops, factories, warehouses
• Haze mask ordering & distribution
• Preferred supplier lists
• EHS Audits
1. Region-wide EHS standards

2. EHS responsibilities more clearly articulated
– Improves efficiency and effectiveness of EHS committees
– Provides ready access to necessary contacts (e.g., first aid trainers)
– "No more excuses"
3. Enables CSU EHS to allocate its efforts to facilities based on level of EHS risk
– Prioritise factories and chemical warehouses
Benefits of “Spoon Feeding”

Limitations of “Spoon Feeding”
Laggards still got away Local management not always
committed “Cost-consciousness” Bottom-line benefits long-term,
indirect and “too strategic”
Achieving Lasting Consistency
2000
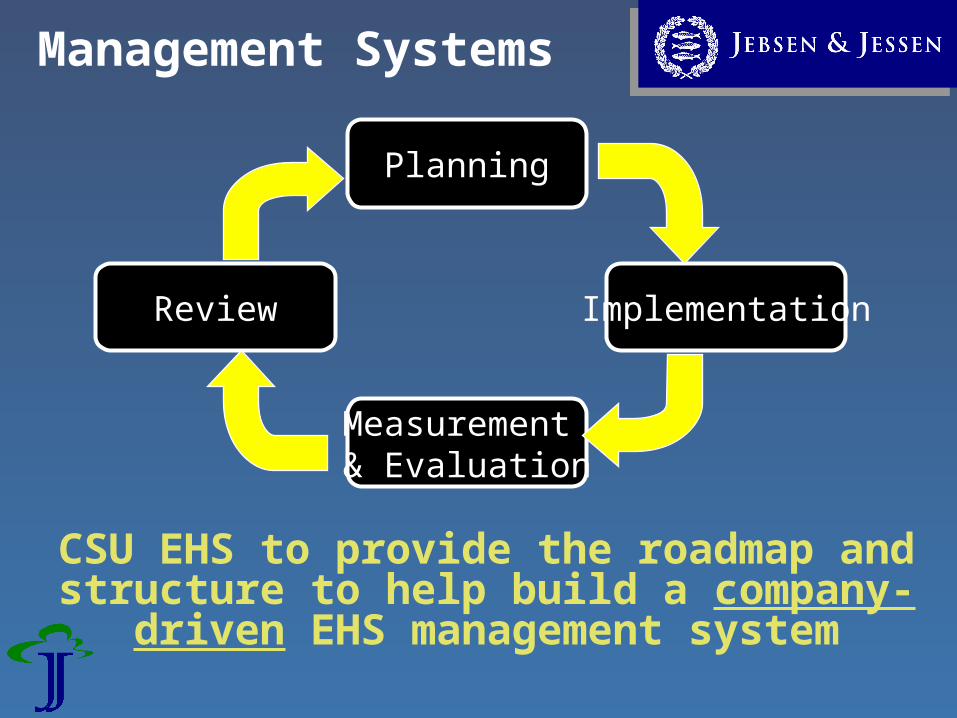
Management Systems
CSU EHS to provide the roadmap and structure to help build a company-driven EHS management system
Review
Planning
Implementation
Measurement & Evaluation

Management Systems
1. Planning– EHS aspects & impacts– Legal requirements– Objectives and targets– Programme
3. Measurement & evaluation
4. Review 2.Implementation

Planning
Aspect ImpactActivity, Product or Service
1. Cleaning bulk oil storage vault
Hazardousatmosphere
Temporary to severe health impact
2. Solvent cleaningoperation VOC emissions to air
Ground level ozone occupational exposure
3. Bulk acidtransportation and
storage
Accidental spillage
4. Battery chargingExploding battery
5. Office operationDocument printing
Surface water contamination
Acid burns
Consumption of renewable natural resources
Aspects & Impacts

Planning
An objective for each aspect / impact
An activity for each objective
Improve safety while installing/servicing pumps
Objective• Create work procedure• Develop service checklist• Obtain required PPE/tools• Develop checklist to maintain
PPE/tools• Train staff on procedures and
checklists• Inspect checklists to ensure they
are being used
Activity

Key Performance Indicators (KPI) are used to demonstrate progress for each activity
Improve safety while installing/servicing pumps
• Develop checklist to maintain PPE/tools
• Train staff on procedures and checklists
• Inspect checklists to ensure they are being used
Objective Activity• Checklist
• Training quiz
• Feedback to be documented in EHS minutes.
KPI
Planning

Targets are the deadlines or numbers related to the KPI
• Develop checklist to maintain PPE/tools
• Train staff on procedures and checklists
• Inspect checklists to ensure they are being used
Activity• Checklist
• Training quiz
• Feedback to be documented in EHS minutes.
KPI• May
• 80% score for all technicians - June
• 3 times
Target for 2000
Planning

Resources are the people, supplies, and funding required to meet the targets
• Develop checklist to maintain PPE/tools
• Train staff on procedures and checklists
Activity• Checklis
t
• Training quiz
KPI• May
• 80% score for all technicians - June
Target• Budi
• Material -Budi
• Trainer - Lee• Logistics -
Sam
Resources
Planning

1. Planning
3. Measurement & evaluation
4. Review2. Implementation
– Structure and responsibility
– Training, awareness, and competency
– Operational control– Emergency preparedness
& response
Management Systems

Training Plans
Training Topic Instructor J F M A M J J A S O N DParticipants
Forklift Inspection Loo TK XAll forklift
drivers
PPE Use Vincent XWrhs staff & Procurement
Noise & Hearing Conservation
Suguna XAll production
workers

1. Planning
3. Measurement & evaluation– Monitoring – Audits– (Corrective actions)– (Records)
4. Review 2.Implementation
Management Systems
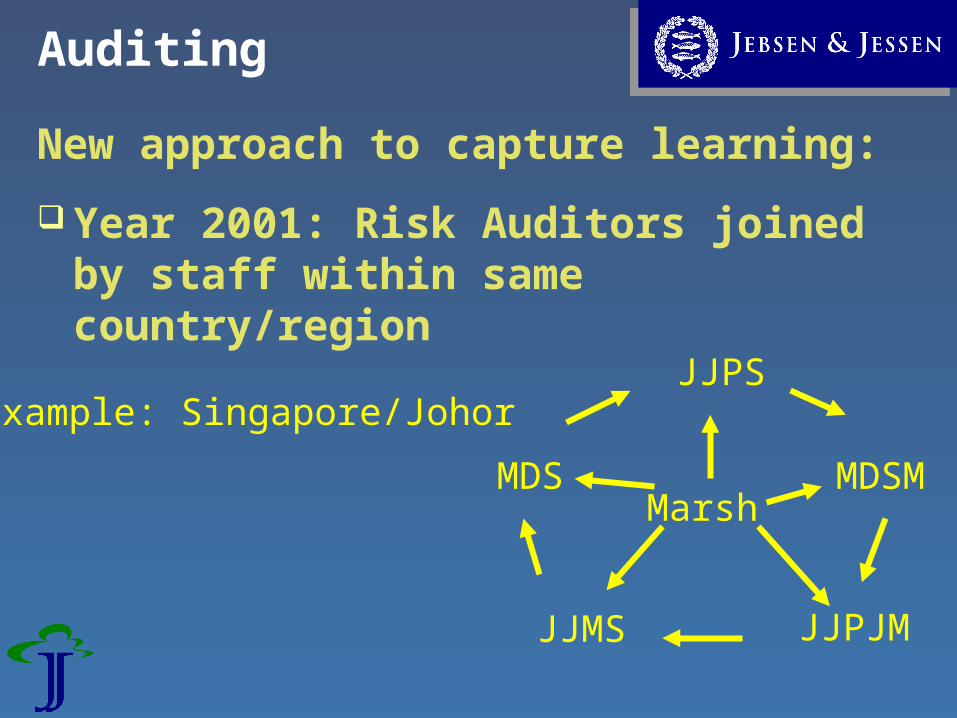
New approach to capture learning:
Year 2001: Risk Auditors joined by staff within same country/region
JJPS
MDSMMDS
JJPJMJJMS
Example: Singapore/Johor
Marsh
Auditing

MDI
MDS
MDMMDSM
MDT
MDP
Example: MHE
Auditing
New approach to capture learning:
2002 and beyond: internal process performed by staff of another company within same RBU

1. Planning
3. Measurement & evaluation
2.Implementation
4. Review–Investigate process deviations
–Continuous improvement
Management Systems

EHS Monitoring
Water Consumption - Per Capita
21.448.7
18.5
102.4
471.7
0.0
100.0
200.0
300.0
400.0
500.0
CHE IPD,PRT,COM,JJSEA
MHE MKT PKG
cu
bic
me
ters
Paper Consumption – Per Capita
0.0
1.0
2.0
3.0
4.0
5.0
6.0
7.0
CHE IPD,PRT,COM,JJSEA
MHE MKT PKG
ream
s
Electricity Consumption and Cost (Per capita)
0
5,000
10,000
15,000
20,000
25,00030,000
35,000
CHE IPD,PRT,COM,JJSEA
MHE MKT PKG
kw
h (
bar)
05001,0001,5002,0002,5003,0003,5004,000
S$
(d
ots
)

Energy Intensity
0
0.5
1
1.5
2
2.5
1998 1999 2000
mkWh/$100m

Office Paper Intensity
0
5
10
15
20
25
1997 1998 1999 2000
Reams / S$mturnover

Accidents
38
40
42
44
46
48
50
52
1997 1998 1999 2000
Number ofAccidentsReported
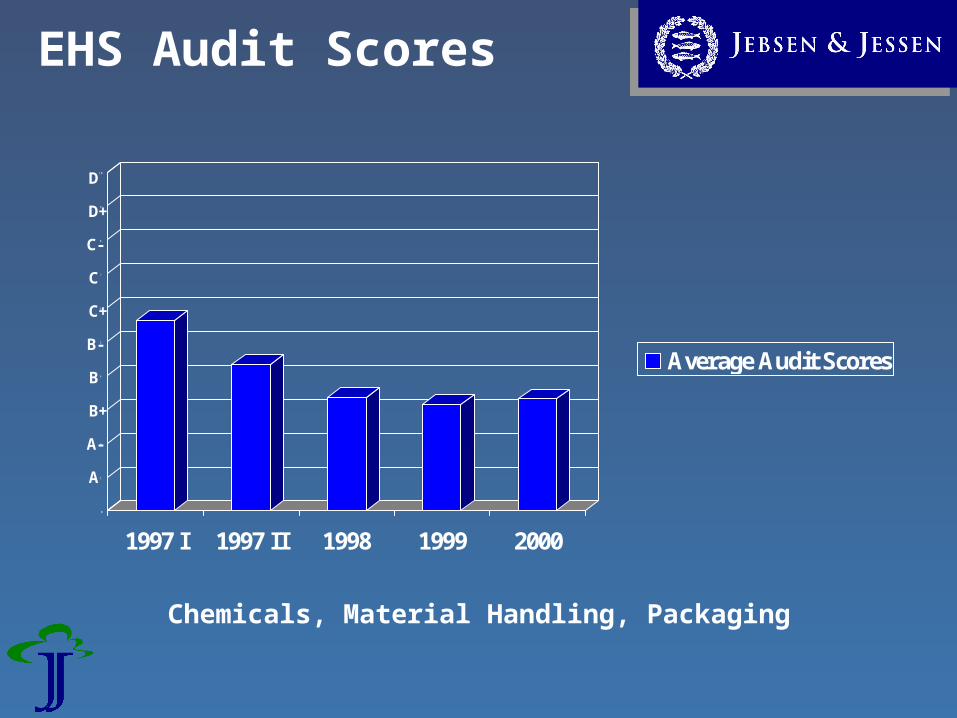
EHS Audit Scores
0
1
2
3
4
5
6
7
8
9
10
1997 I 1997 II 1998 1999 2000
Average Audit Scores
A
B-
C
A-
B+
B
C+
C-
D+
D
Chemicals, Material Handling, Packaging

Between 1999 and 2000:
Three companies improved their score
Three companies worsened
EHS Audit Scores

0
1
2
3
4
5
6
7
8
9
10
1997 I 1997 II 1998 1999 2000
Average Audit Scores
A
B-
C
A-
B+
B
C+
C-
D+
D
EHS Audit Scores

Variation = Surprises
Mean score: A- Variation: 9
Mean score: A- Variation: 0
AD AD

The Challenge
Achieving consistently high
performance, consistently across the Group
No more surprises! Self-managed EHS Committees
and Management Systems

What does this require? EHS must truly become part of business processes EHS ceases to become an afterthought Doing it right every time and all the time Greater spread of responsibility Elimination of delays in follow-up Systematic approach Formal set of performance indicators Documenting what we do and doing what we document Third-party verification Beyond CHE, MHE, PKG
==> Group-wide EHS Management Systems==> Group-wide Organisational Excellence

Group-Wide Certification
ISO 14001
(Environmental Management System)
OHSAS 18001
(Health & Safety Management System)

ISO 14001 / OHSAS 18001 EHS Management Systems Nothing new! Scope of Compliance:
– Adherence to regulatory standards– Adherence to own standards– Continual improvement

MS Components
Forming an EHS Committee and nominating an MR Establishing an EHS Policy Reviewing compliance with EHS laws and regulations Identifying EHS aspects and impacts Prioritising aspects and impacts Establishing corresponding procedures and WIs Training, creating awareness, building competence Setting objectives and targets Employee consultation & Stakeholder communication Documentation; document and data control Establishing KPI measurement and monitoring systems

CHE, IPD, MKT (Textiles), MHE,
PKG, PRE PRE: OHSAS 18001 only 31 member companies COM, MKT, HLD: Adherence to J&J
EHS standards
Scope

Roll-Out
Full implementation by
December 31, 2003
CHE IPD TXT MHE PKG PRT

CSU EHS Role
Provides full-time assistance in implementation
After 2003:– Oversees EHS Monitoring Programme– Participates in annual ISO/OHSAS Review
Meetings– Assists in annual RB target-setting– EHS policies for non-certified, low-impact
companies– Decides on future certifications

Benefits Organisational attention EHS becomes an integral part of daily work Things will get done! On time! Systematic and thorough (aspects and impacts) Impact ranking and prioritised actions More comprehensive staff awareness and engagement Immunity from personnel movements International recognition & credibility Peer pressure! Professionalism and integrity A logical extension of what we already have
==> Proven Success (JJPS)!

1993
What’s in a Decade?
Commitment Ad-Hoc Activities
International Centralised Standards Service
Management Formal Systems Programmes
1993
1995
19972000
2003

Done!

Done?

0
20
40
60
80
100
120
1980 1985 1990 1995 2000 2005 2010
Asia
US
Europe
Global SO2 Emissions

Global Forest Loss

Accumulation of Human-Made Toxins
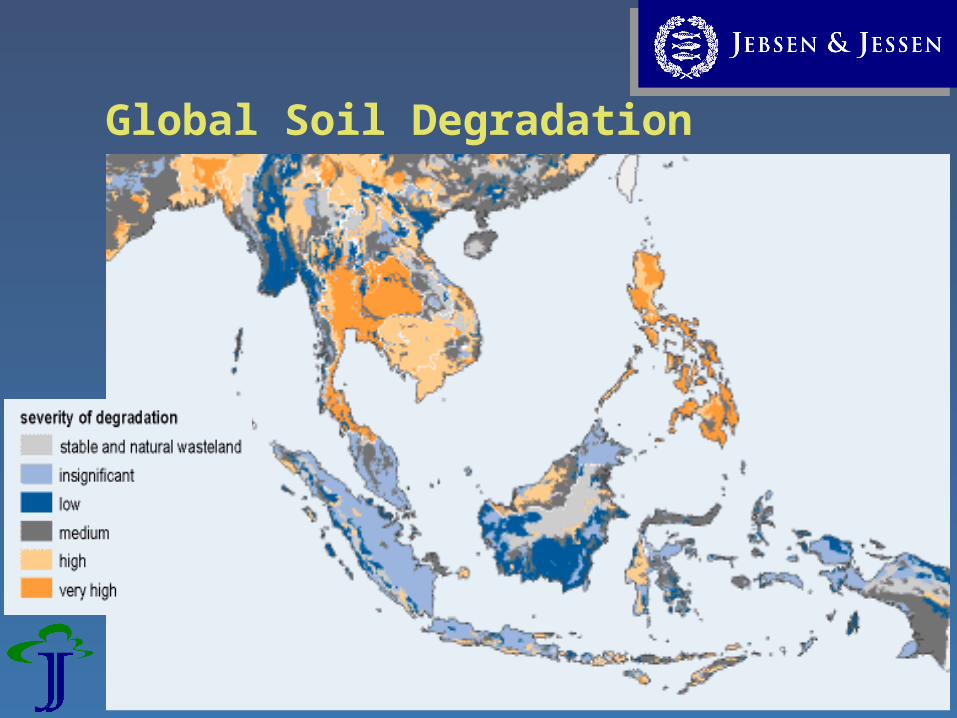
Global Soil Degradation

Fresh Water Availability
Water Stress
High
Medium/High
Moderate
Low

CO2 Concentrations Highest Levels in 160,000 Years
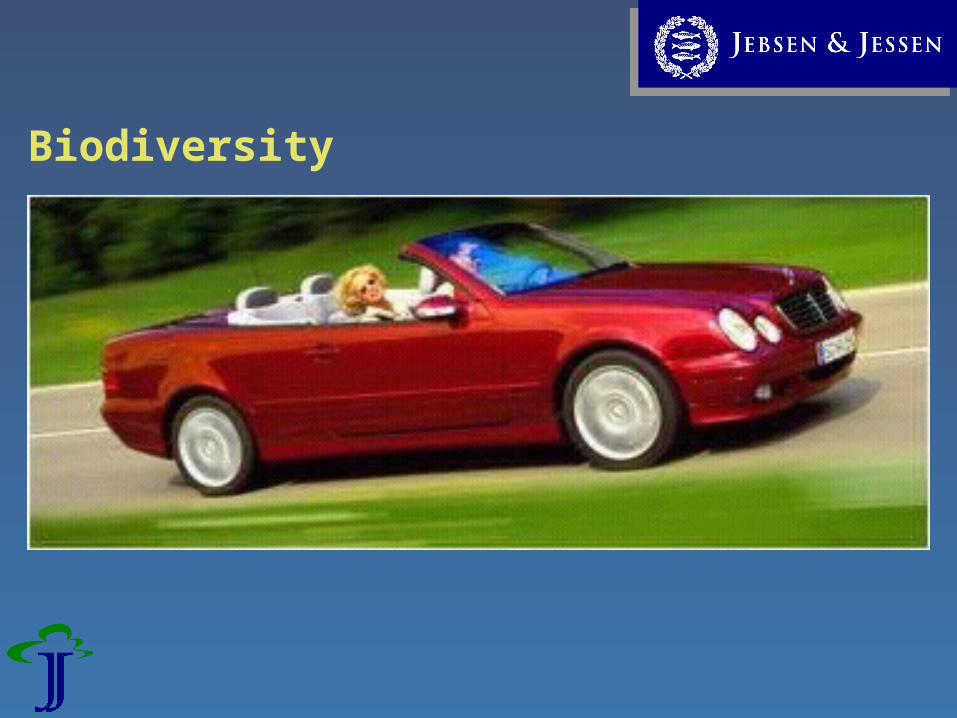
Biodiversity
Sustainability
Major Impacts and Risks Remain!

Sustainability
We’re not done yet!

Sustainability
In nature, everything is cyclical
waste = food

Sustainability
Today, we live in a linear society

Two Systems
Technical cycle
Natural cycle
Waste Feedstock Waste Nutrients

Four Conditions for Sustainability
1In a sustainable society, materials from the earth’s crust must not systematically increase in nature

Four Conditions for Sustainability
2In a sustainable society, man-made materials that don’t biodegrade must not systematically increase in nature

Four Conditions for Sustainability
3In a sustainable society, the physical basis for the productivity and diversity of nature must not be systematically deteriorated

Four Conditions for Sustainability
4A sustainable society must ensure resources are distributed fairly and efficiently

What would Sustainability Require of us?
Ensure that everything that reaches nature can be transformed into new resources
Reduce toxic and persistent chemicals
High recycling of technical products
Manage natural resource consumption to not degrade the source
Preserve biodiversity Renewable energy sources

Life-Sustaining Natural Resources
TimeToday 2050?
Earth’s capacity (“supply curve”)

Human Need (“demand curve”)
TimeToday 2050?
Earth’s capacity (“supply curve”)Earth’s capacity (“supply curve”)
Life-Sustaining Natural Resources

Population
0246810
0 500 1000 1500 2000

Master Equation
Population + Technology =EnvironmentalDecline

Potential Conflict
TimeToday 2050?
Human Need (“demand curve”)
Earth’s capacity (“supply curve”)
Life-Sustaining Natural Resources

Food
TimeToday 2050?
Human Need (“demand curve”)
Earth’s capacity (“supply curve”)
Life-Sustaining Natural Resources

Fresh Water
TimeToday 2050?
Human Need (“demand curve”)
Earth’s capacity (“supply curve”)
Life-Sustaining Natural Resources

TimeToday 2050?
Human Need (“demand curve”)
Earth’s capacity (“supply curve”)
Potential Conflict
Life-Sustaining Natural Resources

Time
Window of Opportunity
Today 2050?
Human Need (“demand curve”)
Earth’s capacity (“supply curve”)
Margin for action{
Life-Sustaining Natural Resources

Sustainability
Sustainability Defined
when society learns to create a long-term stable physical relationship with the environment

Sustainability
Strategy: Pursue businesses that meet the four system conditions
Action: Develop options on how to improve the sustainability of our businesses

Sustainability
The Natural Step
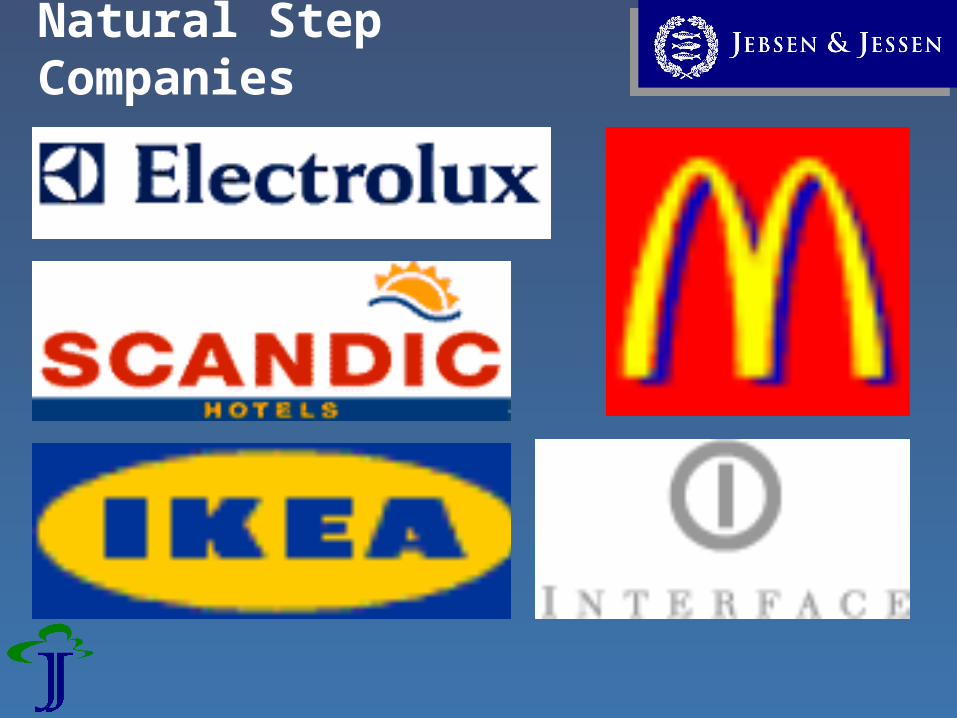
Natural Step Companies

The Natural Step
Interface, Inc.

Take:
44 million lbs face fibre10 million lbs backing
226 million lbs chemicals13 million lbs auxiliary materials
Total: 294 million lbs
8,000,000 million BTU energy
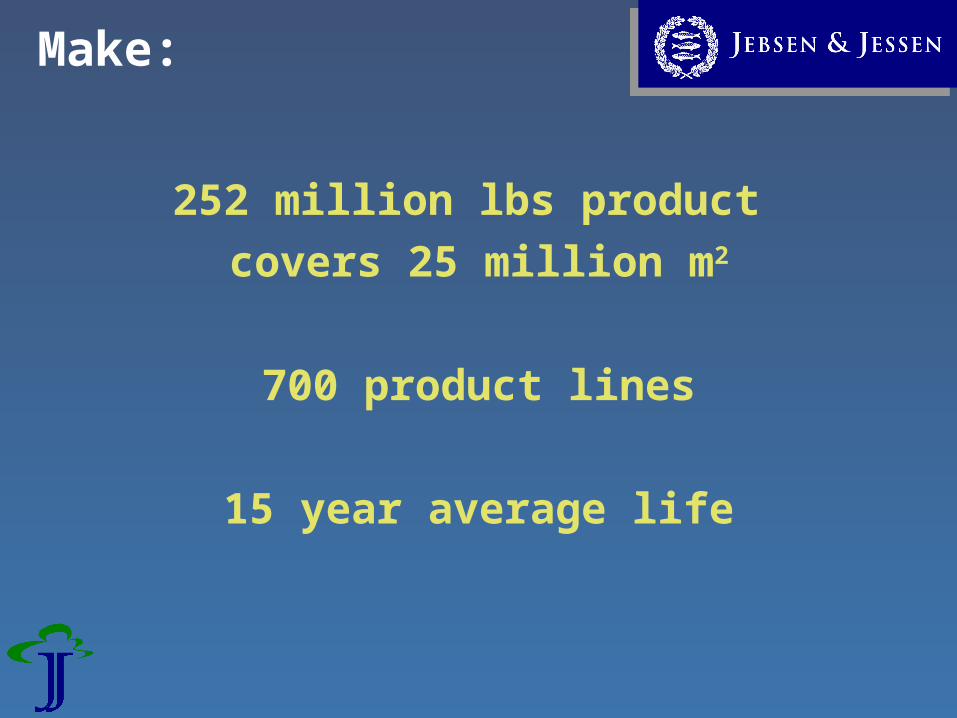
Make:
252 million lbs product covers 25 million m2
700 product lines
15 year average life

Waste:
13 million lbs solid waste
22 million gallons waste water
200,000 lbs regulated air pollutants
3.8 million lbs CO2 emissions

Interface’s Plan
1. Eliminate waste2. Benign emissions3. Renewable energy4. Close the loop5. Resource efficient transportation6. Sensitivity hook-up7. Redesign commerce

Sustainability
The Natural Step:
A never-ending to-do list

Sustainability
The Natural Step:
A truly strategic approach

Sustainability
The Natural Step:
The most meaningful EHS programme
Sustainability
The Natural Step:
The toughest challenge!

Thank You!