membrane-based separations for solid/liquid clarification
TRANSCRIPT

Graduate Theses and Dissertations Iowa State University Capstones, Theses andDissertations
2010
Membrane-based separations for solid/liquidclarification and protein purificationMatthew Thomas AspelundIowa State University
Follow this and additional works at: https://lib.dr.iastate.edu/etd
Part of the Biological Engineering Commons, and the Chemical Engineering Commons
This Dissertation is brought to you for free and open access by the Iowa State University Capstones, Theses and Dissertations at Iowa State UniversityDigital Repository. It has been accepted for inclusion in Graduate Theses and Dissertations by an authorized administrator of Iowa State UniversityDigital Repository. For more information, please contact [email protected].
Recommended CitationAspelund, Matthew Thomas, "Membrane-based separations for solid/liquid clarification and protein purification" (2010). GraduateTheses and Dissertations. 11771.https://lib.dr.iastate.edu/etd/11771

Membrane-based separations for solid/liquid clarification and protein purification
by
Matthew Thomas Aspelund
A dissertation submitted to the graduate faculty
in partial fulfillment of the requirements for the degree of
DOCTOR OF PHILOSOPHY
Major: Chemical Engineering
Program of Study Committee: Charles E. Glatz, Major Professor
Peter J. Reilly Rodney O. Fox
James E. Alleman Theodore J. Heindel
Iowa State University
Ames, Iowa
2010
Copyright © Matthew Thomas Aspelund, 2010. All rights reserved.

ii
For my family and my wife Sender who makes all things possible

iii
Table of Contents
CHAPTER I. General Introduction 1 CHAPTER II. Improving Permeate Flux and Product Transmission 24
in the Microfiltration of a Bacterial Cell Suspension by Flocculation with Cationic Polyelectrolytes
CHAPTER III. Clarification of Aqueous Corn Extracts 76
by Tangential Flow Microfiltration CHAPTER IV. Purification of Recombinant Plant-Made 103
Proteins from Corn Extracts by Ultrafiltration
CHAPTER V. General Conclusions 140

1
Chapter I: General Introduction
Organization
This thesis is divided into five chapters. Chapter I provides an overview of the research
discussed in this thesis along with a literature review on membrane separations including
factors that influence filtration performance for both microfiltration and ultrafiltration and
previous studies involving flocculation and crossflow microfiltration. Chapter II is a
paper published in the Journal of Membrane Science and describes the results of the
experimental work examining polyelectrolyte flocculation as a feed pretreatment to
improve the filtration performance during the microfiltration of an industrial fermentation
broth. The experiments for Chapter II were performed both at Iowa State and Genencor,
International. The Genencor co-authors contributed to the work by technical discussions
regarding the design of experiments and by their comments on the manuscript. Chapters
III and IV focus on solid/liquid clarification and purification of recombinant proteins
from transgenic corn tissues by microfiltration and ultrafiltration using green fluorescent
protein (GFP) and rCollagen as model proteins. Chapter III is a manuscript to be
submitted to the Journal of Membrane Science and examines the effectiveness of
microfiltration for the solid/liquid clarification of transgenic corn tissues in both dead-end
and tangential flow. Different membrane chemistries were examined for their effect on
membrane fouling and product rejection. Chapter IV is a journal article in press to be
published in the Journal of Membrane Science and describes the use of ultrafiltration as a
technique to purify recombinant proteins from aqueous extracts of transgenic corn
tissues. The chapter also describes a strategy for the purification of rCollagen from

2
transgenic corn extracts using only precipitation and ultrafiltration. Finally, Chapter V
summarizes the major conclusions emerging from the work described in this thesis.
Project Objective
Recombinant protein technology has become increasingly important in recent years.
Recombinant proteins can be found in everything from pharmaceuticals to detergents.
The increasing demand and the high cost associated with the production and purification
of recombinant proteins highlights the need to develop efficient and inexpensive methods
for the solid/liquid clarification and purification of these proteins. Membrane
technologies, which offer the advantage of high throughput and ever-improving
selectivity, have the potential to meet the increased demands placed on the downstream
processing of recombinant proteins. The overall objective of this work was to develop
methods for the solid/liquid clarification and purification of recombinant proteins using
membrane based separations.
First, we explored the use of polyelectrolyte flocculation to improve the microfiltration of
an industrial fermentation broth. We evaluated the effectiveness of several cationic
polyelectrolytes of differing repeating unit, molecular weight, and charge density for the
flocculation of an industrial Bacillus subtilis fermentation and the subsequent effect on
the permeate flux and product rejection in both dead-end and tangential flow
microfiltration. We also investigated the effect of crossflow rate on the permeate flux,
product rejection, and the rate of floc breakup. Finally, we used flocculation to examine

3
particle deposition in the highly variable shear environment that occurs in flow through a
spacer filled channel.
Then, we investigated microfiltration for the solids/liquid clarification of transgenic corn
extracts. Within this work we characterized the resistance and compressibility of filter
cakes formed in dead-end microfiltration of endosperm- and germ-rich extracts. In
tangential flow microfiltration the effects of crossflow rate and transmembrane pressure
(TMP) on the permeate flux and rejection of corn host cell proteins (HCP), recombinant
Type 1 human collagen (rCollagen), and GFP were investigated. We also examined both
a ceramic and a poly (vinylidene fluoride) (PVDF) membrane for the extent of membrane
fouling and the subsequent effect on the rejection of HCP, GFP, and rCollagen.
Finally, we examined ultrafiltration for the purification of recombinant proteins from
transgenic corn extracts. We investigated the effects of membrane pore size, crossflow
rate, TMP, filtration pH, and corn tissue (i.e. endosperm or germ) on the permeate flux
and protein sieving in ultrafiltration. We also developed a purification strategy to purify
rCollagen from transgenic corn extracts using only acid salt precipitation and
ultrafiltration.
Literature Review
Here we review the state and the limits of the current knowledge relevant to
microfiltration and ultrafiltration conditions and their effect on the filtration performance.

4
The literature review introduces several parameters that can be manipulated to improve
permeate flux, product transmission, and selectively of these membrane separation
processes.
Microfiltration
A key early step in the production of recombinant proteins is the removal of cells and
other large particulates from the production medium. Several techniques have been
developed to accomplish this separation, including centrifugation, depth filtration, rotary
drum vacuum filtration (RDVF), expanded bed adsorption, and microfiltration [1].
Microfiltration is a pressure driven membrane separation technique, using microporous
membranes that have average pore sizes that range between 0.05 µm and 10 µm [2]. It is
performed using low transmembrane pressures, typically less than 50 psi. High
permeation fluxes are achieved compared to other pressure driven separation techniques
such as ultrafiltration and reverse osmosis. Some advantages in using microfiltration for
the removal of suspended solids from a proteins production medium are (1) the same
equipment can be used for different production mediums, (2) low energy requirements
[3], (3) elimination of filter aids, (4) relatively mild operating conditions that minimize
protein denaturation, and (5) using a 0.2 µm filter results in a particle-free permeate that
can be used in subsequent purification processes without further clarification [4].
However, there are several drawbacks associated with microfiltration. Chief among these
is the development of large transport resistances that can severely reduce the permeate
flux and product transmission [5], making microfiltration an uneconomical option. The

5
following review focuses on the sources of these transport resistances and general
changes that can be made to improve the microfiltration process.
Sources of Transport Resistance
The two main transport resistances that occur in membrane filtration are caused by the
membrane (Rm) and the formation of a layer of rejected particles deposited on the
membrane surface (Rc) (i.e. the cake layer). The resistance of the membrane and the cake
layer can be treated as a resistance in series with the permeate flux described by Darcy’s
law:
∆
(1)
where J is the permeate flux rate, Vperm is the permeate volume, A is the membrane area
available for filtration, ∆p is the transmembrane pressure drop, and µ is the permeate
viscosity. Permeate flux is typically expressed in terms of liters/ square meter – hour
(LMH). The resistance of the cake layer can be expressed in terms of a specific cake
resistance shown in equation 2,
(2)
where α is the specific cake resistance and δc is the height of the cake layer. The specific
cake resistance is a convenient way to compare the intrinsic transport resistance of filter
cakes independent of the height of the cake layer [6].
Membrane Resistance

6
The resistance due to the membrane depends on the membrane thickness, pore size, and
other morphological features of the membrane [3]. Membrane resistance can increase due
to internal fouling of the membrane pores. The adsorption of feed components onto the
internal surface of the membrane pores can reduce the effective radius of the pore
(constriction) or completely block the pore (blockage) [2, 3]. Typically internal
membrane fouling is caused by small particles and multilayer adsorption of soluble feed
components (i.e. proteins and proteins aggregates) on the pore walls [7-9]. Internal
fouling of the membrane pores reduces the permeate flux and the transmission of the
desired product. Membrane chemistry and pore size can influence the amount of internal
membrane fouling that occurs [10]. In general, hydrophilic membranes absorb less
protein than hydrophobic membranes [11].
Cake Layer Formation and the Effect of Particle Size on Cake Resistance
Particles are transported to the membrane surface in a manner depending on the type of
filtration module used. Dead-end filtration is operated in batch mode with the bulk flow
directed perpendicular to the membrane. As shown in Figure 1, the bulk flow carries
particles to the membrane surface which results in the continual growth of the cake layer.
[3].

7
Figure 1. Schematic representation of fluid flow and particle deposition in dead-end
filtration
For dead-end filtrations, the cake resistance is expressed in terms of the specific cake
resistance as shown in equation 3,
(3)
where ρc is the mass of dry filter cake per unit volume of permeate. The effect of particle
size can be related to the specific cake resistance using the Carmen-Kozeny equation
[12],
!"#
(4)

8
where ε is the porosity of the cake, ρ is the density of the filter cake, k2 is the Kozeny
constant associated with the morphology of the feed particles and is typically assumed to
be 5 [13], ΦS is the shape factor, and dp is the particle diameter, which shows that the
specific cake resistance decreases with the square of the particle size.
In crossflow filtration, the bulk feed flow is tangential to the membrane surface and a
pressure differential across the membrane drives the permeate flow as shown in Figure 2.
Particles are convected to the membrane surface by the pressure driven flow through the
membrane and swept from the membrane surface by the tangential feed flow.
Figure 2. Schematic representation of fluid flow and particle deposition in crossflow
filtration. Mass transfer directions C: convective, B: back diffusive, and A: axial.
The presence of the tangential feed flow causes the particles to be transported away from
the membrane by shear-moderated back-transport, or axially along the surface of the
membrane [3]. Proposed back diffusion mechanisms for crossflow filtration are shear-
Feed Flow
Permeate
Membrane
C A
B

9
induced diffusion [14] and inertial lift [15] for larger particles (>0.1µm), and Brownian
diffusion for small particles (< 0.1 µm) such as proteins [16]. The rolling or sliding of
particles along the membrane surface in the presence of the axial crossflow is described
by surface transport [17].
The four transport mechanisms above can be used to examine the parameter dependence
of the permeate flux as shown in equation 5, assuming that the feed consists of dilute
non-adhesive spherical particles [3],
$%&'()*+,-./&0 (5)
where γo the wall shear rate, dp is the particle diameter, φb is the particle concentration, L
is the length of the flow channel, and ηo is the dynamic viscosity of the feed. The values
of the constants c, n, m, q, r, z vary depending on the particle transport mechanism. The
models for surface transport, inertial lift, and shear-induced diffusion mechanisms have m
equal to or greater than 1 (1, 3, and 1.33 respectively), and predict a positive correlation
between permeate flux and particle size, whereas Brownian diffusion predicts a declining
flux with increasing size [3, 14, 15]. Therefore, in both dead-end and crossflow
filtrations, the particle size has an integral role in determining the flux, with larger
particle size leading to higher flux when dp exceeds ca. 0.1 µm.
Effect of Operating Conditions
Transmembrane Pressure

10
In crossflow filtration, the effect of transmembrane pressure (TMP) on the permeate flux
is dependent on whether the filtration is operated in the pressure dependent or pressure
independent part of the flux curve (Figure 3).
Figure 3. Schematic representation of the effect of transmembrane pressure on permeate
flux during microfiltration. Region 1. cake consolidation and formation; Region 2.
Pressure independent flux.
In the pressure dependent region, the permeate flux varies linearly with the TMP because
the low value of the TMP results in a permeate flux that is not sufficient to transport the
particles to the membrane surface in the presence of the bulk feed flow. This results in
either no cake formation or sparse deposition of particles on the membrane surface
(Figure 3). Operation in the pressure independent region results in the formation of a cake

11
layer, where increasing the TMP no longer results in an increase in the permeate flux rate
(Figure 3) [18, 19].
Typically, in both dead-end and crossflow filtrations increasing the TMP will increase the
resistance of the cake layer for biological feeds [20-23], due to an increase in the solids
packing density. Specific cake resistance and TMP are most commonly correlated using
the following equation,
&12' (6)
where α0 is the zero pressure specific cake resistance, and n is the compressibility index.
A value of zero for n represents an incompressible cake and increasing value of n
represents increasing cake compressibility [13]. For both dead-end and crossflow
filtrations of these compressible feeds, the porosity of the cake layer varies with position
within the cake. The minimum porosity of the cake occurs near the filter cake-membrane
interface and a maximum porosity occurs at the surface of the cake layer. The porosity
decreases near the membrane surface because of an increase in compressive pressure
caused by drag on the deposited particles in the direction of the permeate flow [24-26].
The presence and packing density of the cake layer may reduce protein transmission [27-
29].
Crossflow Rate
In general, increasing the crossflow rate tends to increase permeate flux and decrease the
protein rejection by reducing the height of the deposited cake layer for monodisperse

12
suspensions [5, 30-33]. The reduction in the cake height and subsequent increase in the
permeate flux rate are caused by the increased sweeping of particles from the cake layer.
Increasing the crossflow rate does not always increase the permeate flux and, in fact, can
increase the transport resistance of the cake layer [33-35]. In polydisperse suspensions,
cake resistance increases with increasing crossflow rate because the high crossflow rate
decreases the size of the particles that deposit on the cake layer due to greater shear-
mediated back diffusion and inertial lift of the larger particles [33, 36, 37]. In filtrations
of rod-shaped particles, the presence of the crossflow results in the alignment of the
particles in the direction of the bulk flow, increasing the resistance of the cake layer [38,
39]. The increased shear stress associated with high crossflow rate can cause cells to
break, which can increase the transport resistance by decreasing the average particle size
of the suspension [40, 41]. The formation of a gel layer of proteins and polysaccharides
on the cake surface increases the resistance significantly. Raising the crossflow rate
increases the rate at which this gel layer forms [34]. Protein rejection increases with high
crossflow velocity despite the decrease in the height of the cake layer during the filtration
of yeast cells and BSA. This increase in BSA rejection is attributed to the increased
sweeping of the crossflow, transporting proteins out of the concentration polarization
layer and into the bulk feed [42].
Module Design and Operation
Changes in filtration module design and operation to improve permeate flux and product
transmission are aimed at disrupting the cake layer by increasing shear and back transport
of particles from the membrane. Some mechanical changes that have been shown to

13
improve filtration performance are the addition of a rotating disc above the membrane
[43, 44] and vibration of the membrane [45, 46]. In spiral-wound membrane modules, a
mesh of non-woven crossed cylinders is placed between the adjacent membrane layers
with the purposes of creating the flow path, promoting unsteady flow, and enhancing the
mass transport to disrupt the formation of the cake layer [47]. Disruption of the cake layer
can also be achieved by the introduction of Taylor and Dean vortices created in the feed
flow using a helically shaped flow path [48, 49]. Back pulsing (i.e. temporary reversal) of
the permeate flow [50, 51] also improves the permeate flux and product transmission by
disruption of the cake layer.
Effect of Feed Conditions
The pH and ionic strength of the feed can have a strong effect on filtration behavior by
modulating the charge and electrostatic interactions of the feed components and the
membrane. Change of pH can improve permeate flux by increasing the surface charge of
the cells in the suspension, increasing the pore size of the cake layer by electrostatic
repulsion of like charged particles [52]. Changes in pH can also induce particle
aggregation, increasing the particle size in the feed, leading to an improved permeate flux
as shown by equation 4 for dead-end and equation 5 for crossflow filtrations [6, 21]. The
effect of pH changes on the cell surface properties is strongly influenced by the other
media components. In a filtration of Bacillus subtilis grown in complex media, Graves et
al. found that cell aggregation was not dependent on pH, while in the filtration of
Bacillus subtilis grown in defined media, pH-dependent cell aggregation was observed
[6]. High ionic strength in the feed suspension can shield the charges of the particles,

14
decreasing electrostatic interactions. This charge shielding can aid in aggregation of the
feed particles [21, 53, 54] and decrease rejection of the desired product [55]. Changes in
pH can decrease protein rejection by reducing cell-cell, protein-cell, and protein-
membrane electrostatic interactions [54, 56]. Rejection of desired proteins is significantly
reduced by performing the filtration near the isoelectric point (i.e. net neutral charge; pI)
of the desired protein [55, 57]. Adjustment of the pH can reduce the rejection of the
desired product by aggregating the feed particles, forming a cake layer with larger pores
[42].
Polyelectrolyte Flocculation in Crossflow Microfiltration
Flocculation is the process by which particles in suspension form aggregates with the
addition of a flocculating agent. It has become an increasingly important step in
solid/liquid separation processes. Flocculation is employed extensively in the waste water
treatment and biotechnology industries to aid in separation techniques such as filtration,
flotation, sedimentation [58], and centrifugation [59], which become more effective with
larger suspended particle size. Flocculation can occur naturally in some microbial
suspensions such as yeast cultures [60-62], aggregation of which is influenced by various
genetic and environmental factors and synthetically by the addition of flocculants such as
metal salts [63] and polyelectrolytes.
Previous studies have shown that the addition of a polyelectrolyte flocculants increases
permeate fluxes for the crossflow microfiltration of yeast [64, 65] and CHO cells [66] in
simple defined media and titanium oxide suspensions in DI water [67], but not in

15
complex microbial media. In the experiments with yeast cells, the flocculated particles
were exposed to average wall shear rates as high as 6000 s-1; however, the flocculated
particles were not disrupted and the particle size distribution of the bulk feed remained
the same throughout the course of the filtration [66]. The effect of operating conditions
on the microfiltration of flocculated yeast particles was examined using the direct
observation through the membrane technique and deposition of the larger flocculated
yeast particles increased with higher permeate flux at a constant crossflow rate. This
result indicates that operation at high transmembrane pressures (i.e. high initial permeate
flux) and low crossflow rates produces the greatest flux improvements with flocculant
addition in the microfiltration of yeast suspensions by increasing the size of the
depositing particles [64]. Wickramasinghe et al. found that flocculation increases the
rejection of a viral contaminant [68], and studies to examine the effect of flocculation on
the rejection of a desired protein product in microfiltration are yet to be reported.
Ultrafiltration
Ultrafiltration (UF) has been widely used in pharmaceutical processes for many years
primarily for concentration and buffer exchange. Recent work has focused on the use of
UF for protein purification [69]. Typically retention of the desired protein and subsequent
purification of proteins are based on size. Studies have shown that careful control of
filtration conditions (i.e. crossflow rate and TMP) and exploitation of electrostatic
interactions can be used to enhance the ultrafiltration process [70-73]. Traditional
ultrafiltration processes are usually limited to separation of solutes that differ by ten-fold
in size due to the high pore size distribution in the UF membranes. Careful control of the

16
operating conditions (i.e. crossflow rate and TMP) and exploiting electrostatic
interactions can take advantage of solute membrane and solute concentration polarization
layer interactions to accentuate the passage of neutral solutes and the retention of the
charged solutes [71]. The fractionation of proteins by ultrafiltration can be optimized in
the following three ways: 1) controlling the filtration operation conditions (i.e. crossflow
rate and TMP), 2) optimizing the pH and ionic strength of the filtration buffer, and 3)
using charged membranes [70-73].
Crossflow and Transmembrane Pressure
Rejection of the solutes convected towards the membrane by the permeate flow during
ultrafiltration results in the development of a region of elevated solute concentration at
the membrane surface. Development of this layer of increasing concentration is referred
to as concentration polarization. Operation of the filtration under conditions of high
concentration polarization may result in the formation of a gel layer, which can reduce
the permeate flux and selectivity of an ultrafiltration process as well as cause solute
aggregation [74-76]. The extent of concentration polarization and gel layer formation is
controlled in UF by varying the crossflow rate and TMP such that operation is in the
pressure dependent part of the filtrate flux curve (Figure 3) [71, 75, 77, 78]. Proper
control of the extent of concentration polarization significantly improves the selectivity
of a UF process [73, 77-80]. Several studies have shown that the effects of crossflow rate
and TMP can be combined to yield high transmission of the larger molecular weight
solute and high rejection of the low molecular weight solute (i.e. reverse separation) [55,
75, 77, 81]. Operation below the critical TMP reduces the internal membrane fouling [82,

17
83]. Internal fouling of the membrane pores reduces the permeate flux and the
transmission of the desired product [84]. Also, to reduce the effect of the change in
concentration polarization and solute permeation with variations in TMP, filtrations may
be operated with a co-current filtrate flow to maintain constant TMP along the length of
the membrane [70, 78].
Electrostatic Interactions
Protein-protein, protein-concentration polarization layer, and protein-membrane
interactions significantly affect protein separation by UF [75, 77, 78, 81]. Solution pH
and ionic strength can drastically alter the hydrodynamic volume, charge, and diffusion
coefficients of proteins in solution. Operating the filtration with low ionic strength has
the potential to accentuate the electrostatic effects [78]. Filtration at low ionic strength
and a pH close the pI of the protein that is to permeate enhances selectivity by reducing
the hydrodynamic volume of the permeating solute [71, 73, 75, 85]. However, operating
under the above conditions may aggregate proteins and increase membrane fouling [78].
The charge of the membrane can also selectively increase protein retention by increasing
repulsive electrostatic forces between the membrane and solute of the same charge [71,
78, 86].
Microfiltration and ultrafiltration are useful methods for the solid/liquid clarification and
purification of proteins when sufficiently high permeate flux, product
transmission/rejection, and protein selectivity are attained.

18
References:
1 M. Mondor and C. Moresoli, Experimental verification of the shear-induced hydrodynamic diffusion model of crossflow microfiltration, with consideration of the transmembrane pressure axial variation, J. Membr. Sci., 175(2000) 119-137.
2 L. J. Zeman and A. L. Zydney, Microfiltration and Ultrafiltration: Principles and Applications, first ed., Marcel Dekker Inc., 1996, New York.
3 G. Belfort, R. H. Davis and A. L. Zydney, The behavior of suspensions and macromolecular solutions in cross-flow microfiltration, J. Membr. Sci., 96(1994) 1-58.
4 R. van Reis and A. Zydney, Membrane separations in biotechnology, Curr. Opin. Biotechnol., 12(2001) 208-211.
5 B. Riesmeier, K. H. Kroner and M. R. Kula, Studies on secondary layer formation and its characterization during cross-flow filtration of microbial-cells, J. Membr. Sci., 34(1987) 245-266.
6 K. Graves, G. Rozeboom, M. Heng and C. Glatz, Broth conditions determining specific cake resistance during microfiltration of Bacillus subtilis, Biotechnol. Bioeng., 94(2006) 346-352.
7 S. T. Kelly and A. L. Zydney, Mechanisms for BSA fouling during microfiltration, J. Membr. Sci., 107(1995) 115-127.
8 C. Guell and R. H. Davis, Membrane fouling during microfiltration of protein mixtures, J. Membr. Sci., 119(1996) 269-284.
9 N. Singh and M. Cheryan, Fouling of a ceramic microfiltration membrane by corn starch hydrolysate, J. Membr. Sci., 135(1997) 195-202.
10 J. Mueller and R. H. Davis, Protein fouling of surface-modified polymeric microfiltration membranes, J. Membr. Sci., 116(1996) 47-60.
11 W. R. Bowen, T. A. Doneva and J. A. G. Stoton, Protein deposition during cross-flow membrane filtration: AFM studies and flux loss, Colloids and Surfaces B-Biointerfaces, 27(2003) 103-113.
12 W. L. McCabe, J. C. Smith and P. Harriott, Unit operations in chemical engineering, sixth ed., McGraw Hill 2001, New York.
13 G. Foley, A review of factors affecting filter cake properties in dead-end microfiltration of microbial suspensions, J. Membr. Sci., 274(2006) 38-46.
14 A. L. Zydney and C. K. Colton, A concentration polarization model for the filtrate flux in cross-flow microfiltration of particulate suspensions, Chem. Eng. Commun., 47(1986) 1-21.
15 G. Green and G. Belfort, Fouling of ultrafiltration membranes - lateral migration and the particle trajectory model, Desalination, 35(1980) 129-147.
16 C. A. Romero and R. H. Davis, Global-model of cross-flow microfiltration based on hydrodynamic particle diffusion, J. Membr. Sci., 39(1988) 157-185.
17 R. H. Davis and S. A. Birdsell, Hydrodynamic model and experiments for cross-flow microfiltration, Chem. Eng. Commun., 49(1987) 217-234.
18 R. W. Field, D. Wu, J. A. Howell and B. B. Gupta, critical flux concept for microfiltration fouling, J. Membr. Sci., 100(1995) 259-272.

19
19 J. A. Howell, Subcritical flux operation of microfiltration, J. Membr. Sci., 107(1995) 165-171.
20 A. A. McCarthy, P. K. Walsh and G. Foley, Characterising the packing and dead-end filter cake compressibility of the polymorphic yeast Kluyveromyces marxianus var. marxianus NRRLy2415, J. Membr. Sci., 198(2002) 87-94.
21 K. Ohmori and C. E. Glatz, Effects of pH and ionic strength on microfiltration of C-glutamicum, J. Membr. Sci., 153(1999) 23-32.
22 S. L. Li, K. S. Chou, J. Y. Lin, H. W. Yen and I. M. Chu, Study on the microfiltration of Escherichia coli-containing fermentation broth by a ceramic membrane filter, J. Membr. Sci., 110(1996) 203-210.
23 P. Blanpain, J. Hermia and M. Lenoel, Mechanisms governing permeate flux and protein rejection in the microfiltration of beer with a cyclopore Membrane, J. Membr. Sci., 84(1993) 37-51.
24 W. Leu, Principles of compressible cake filtration, in Encyclopedia of fluid mechanics, N. P. Cheremisinoff (Eds.). 1986, Gulf Publishing Co.: Houston. p. 866-903.
25 V. V. Tarabara, I. Koyuncu and M. R. Wiesner, Effect of hydrodynamics and solution ionic strength on permeate flux in cross-flow filtration: direct experimental observation of filter cake cross-sections, J. Membr. Sci., 241(2004) 65-78.
26 M. Meireles, M. Clifton and P. Aimar, Filtration of yeast suspensions: experimental observations and modelling of dead-end filtration with a compressible cake, Desalination, 147(2002) 19-23.
27 G. L. Baruah and G. Belfort, Optimized recovery of monoclonal antibodies from transgenic goat milk by microfiltration, Biotechnol. Bioeng., 87(2004) 274-285.
28 G. L. Baruah and G. Belfort, A predictive aggregate transport model for microfiltration of combined macromolecular solutions and poly-disperse suspensions: Model development, Biotechnol. Prog., 19(2003) 1524-1532.
29 C. Harscoat, M. Y. Jaffrin, R. Bouzerar and J. Courtois, Influence of fermentation conditions and microfiltration processes on membrane fouling during recovery of glucuronane polysaccharides from fermentation broths, Biotechnol. Bioeng., 65(1999) 500-511.
30 K. J. Hwang and H. C. Liu, Cross-flow microfiltration of aggregated submicron particles, J. Membr. Sci., 201(2002) 137-148.
31 K. J. Hwang and Y. H. Cheng, The role of dynamic membrane in cross-flow microfiltration of macromolecules, Sep. Sci. Technol., 38(2003) 779-795.
32 A. Ould-Dris, M. Y. Jaffrin, D. Si-Hassen and Y. Neggaz, Analysis of cake build-up and removal in cross-flow microfiltration of CaCO3 suspensions under varying conditions, J. Membr. Sci., 175(2000) 267-283.
33 R. J. Baker, A. G. Fane, C. J. D. Fell and B. H. Yoo, Factors affecting flux in cross-flow filtration, Desalination, 53(1985) 81-93.
34 T. Tanaka, K. Usui and K. Nakanishi, Formation of the gel layer of polymers and its effect on the permeation flux in crossflow filtration of Corynebacterium glutamicum broth, Sep. Sci. Technol., 33(1998) 707-722.

20
35 T. Tanaka, Y. Yamagiwa, T. Nagano, M. Taniguchi and K. Nakanishi, Relationship between cake structure and membrane pore size in crossflow filtration of microbial cell suspension containing fine particles, J. Chem. Eng. Japan, 34(2001) 1524-1531.
36 A. A. McCarthy, P. K. Walsh and G. Foley, Experimental techniques for quantifying the cake mass, the cake and membrane resistances and the specific cake resistance during crossflow filtration of microbial suspensions, J. Membr. Sci., 201(2002) 31-45.
37 G. Foley, D. M. Malone and F. Macloughlin, Modeling the effects of particle polydispersity in cross-flow filtration, J. Membr. Sci., 99(1995) 77-88.
38 G. Foley, A. A. McCarthy and P. K. Walsh, Evidence. for shape-dependent deposition in crossflow microfiltration of microbial cells, J. Membr. Sci., 250(2005) 311-313.
39 T. Tanaka, K. Usui, K. Kouda and K. Nakanishi, Filtration behaviors of rod-shaped bacterial broths in unsteady-state phase of cross-flow filtration, J. Chem. Eng. Japan, 29(1996) 973-981.
40 B. Maiorella, G. Dorin, A. Carion and D. Harano, Cross-flow microfiltration of animal-cells, Biotechnol. Bioeng., 37(1991) 121-126.
41 Y. Shimizu, K. Matsushita and A. Watanabe, Influence of shear breakage of microbial-cells on cross-flow microfiltration flux, J. Ferment. Bioeng., 78(1994) 170-174.
42 K. J. Hwang and H. C. Hwang, The purification of protein in cross-flow microfiltration of microbe/protein mixtures, Sep. Purif. Technol., 51(2006) 416-423.
43 U. Frenander and A. S. Jonsson, Cell harvesting by cross-flow microfiltration using a shear-enhanced module, Biotechnol. Bioeng., 52(1996) 397-403.
44 J. H. Vogel and K. H. Kroner, Controlled shear filtration: A novel technique for animal cell separation, Biotechnol. Bioeng., 63(1999) 663-674.
45 J. A. Wilson, J. Postlethwaite, J. D. Pearce, G. Leach, G. J. Lye and P. A. Shamlou, Vibrating membrane filtration for recovery and concentration of insect killing nematodes, Biotechnol. Bioeng., 83(2003) 235-240.
46 G. Genkin, T. D. Waite, A. G. Fane and S. Chang, The effect of vibration and coagulant addition on the filtration performance of submerged hollow fibre membranes, J. Membr. Sci., 281(2006) 726-734.
47 J. Schwinge, P. R. Neal, D. E. Wiley, D. F. Fletcher and A. G. Fane, Spiral wound modules and spacers - Review and analysis, J. Membr. Sci., 242(2004) 129-153.
48 H. B. Winzeler and G. Belfort, Enhanced performance for pressure-driven membrane processes - the argument for fluid instabilities, J. Membr. Sci., 80(1993) 35-47.
49 S. Luque, H. Mallubhotla, G. Gehlert, R. Kuriyel, S. Dzengeleski, S. Pearl and G. Belfort, A new coiled hollow-fiber module design for enhanced microfiltration performance in biotechnology, Biotechnol. Bioeng., 65(1999) 247-257.
50 C. S. Parnham and R. H. Davis, Protein recovery from bacterial cell debris using crossflow microfiltration with backpulsing, J. Membr. Sci., 118(1996) 259-268.

21
51 J. A. Levesley and M. Hoare, The effect of high frequency backflushing on the microfiltration of yeast homogenate suspensions for the recovery of soluble proteins, J. Membr. Sci., 158(1999) 29-39.
52 R. M. McDonogh, A. G. Fane and C. J. D. Fell, Influence of polydispersity on the hydraulic behaviour of colloidal fouling layers on membranes - perturbations on the behaviour of the "ideal" colloidal layer, Colloids and Surfaces a-Physicochemical and Engineering Aspects, 138(1998) 231-244.
53 R. Chan and V. Chen, The effects of electrolyte concentration and pH on protein aggregation and deposition: critical flux and constant flux membrane filtration, J. Membr. Sci., 185(2001) 177-192.
54 K. Ohmori, K. Hoshida and E. Iritani, Interactions between cells, proteins, and salts in microfiltration of Corynebacterium glutamicum slurry, J. Chem. Eng. Japan, 37(2004) 1497-1503.
55 A. Persson, A. S. Jonsson and G. Zacchi, Transmission of BSA during cross-flow microfiltration: influence of pH and salt concentration, J. Membr. Sci., 223(2003) 11-21.
56 A. Persson, A. S. Jonsson and G. Zacchi, Separation of lactic acid-producing bacteria from fermentation broth using a ceramic microfiltration membrane with constant permeate flow, Biotechnol. Bioeng., 72(2001) 269-277.
57 A. Venkiteshwaran, P. Heider, S. Matosevic, A. Bogsnes, A. Staby, S. Sharfstein and G. Belfort, Optimized removal of soluble host cell proteins for the recovery of met-human growth hormone inclusion bodies from Escherichia coli cell lysate using crossflow microfiltration, Biotechnol. Prog., 23(2007) 667-672.
58 J. Gregory, Fundamentals of flocculation, Critical Reviews in Environmental Control, 19(1989) 185-230.
59 A. C. Bentham, J. Bonnerjea, C. B. Orsborn, P. N. Ward and M. Hoare, The separation of affinity flocculated yeast-cell debris using a pilot-plant scroll decanter centrifuge, Biotechnol. Bioeng., 36(1990) 397-401.
60 M. J. Beavan, D. M. Belk, G. G. Stewart and A. H. Rose, Changes in electrophoretic mobility and lytic enzyme-activity associated with development of flocculating ability in saccharomyces-cerevisiae, Can. J. Microbiol., 25(1979) 888-895.
61 K. Esser and U. Kues, Flocculation and its implication for biotechnology, Process Biochem., 18(1983) 21-23.
62 C. Sieiro, N. M. Reboredo, P. Blanco, A. Diaz and T. G. Villa, The genetics and molecular biology of flocculation in Saccharomyces cerevisiae: An overview, Food Technol. Biotechnol., 36(1998) 31-36.
63 B. Y. Gao, H. H. Hahn and E. Hoffmann, Evaluation of aluminum-silicate polymer composite as a coagulant for water treatment, Water Res., 36(2002) 3573-3581.
64 S. R. Wickramasinghe, B. B. Han, S. Akeprathumchai, V. Chen, P. Neal and X. Qian, Improved permeate flux by flocculation of biological feeds: comparison between theory and experiment, J. Membr. Sci., 242(2004) 57-71.
65 S. R. Wickramasinghe, Y. L. Wu and B. B. Han, Enhanced microfiltration of yeast by flocculation, Desalination, 147(2002) 25-30.

22
66 J. S. Kim, S. Akeprathumchai and S. R. Wickramasinghe, Flocculation to enhance microfiltration, J. Membr. Sci., 182(2001) 161-172.
67 M. T. Nguyen and S. Ripperger, Investigation on the effect of flocculants on the filtration behavior in microfiltration of fine particles, Desalination, 147(2002) 37-42.
68 S. R. Wickramasinghe, B. B. Han, J. O. Carlson and S. M. Powers, Clearance of minute virus of mice by flocculation and microfiltration, Biotechnol. Bioeng., 86(2004) 612-621.
69 R. van Reis and A. Zydney, Bioprocess membrane technology, Journal of Membrane Science, 297(2007) 16-50.
70 R. vanReis, S. Gadam, L. N. Frautschy, S. Orlando, E. M. Goodrich, S. Saksena, R. Kuriyel, C. M. Simpson, S. Pearl and A. L. Zydney, High performance tangential flow filtration, Biotechnology and Bioengineering, 56(1997) 71-82.
71 R. van Reis, J. M. Brake, J. Charkoudian, D. B. Burns and A. L. Zydney, High-performance tangential flow filtration using charged membranes, Journal of Membrane Science, 159(1999) 133-142.
72 S. Saksena and A. L. Zydney, Effect of solution pH and ionic-Strength on the separation of albumin from immunoglobulins (Igg) by Selective filtration, Biotechnology and Bioengineering, 43(1994) 960-968.
73 R. H. C. M. Vaneijndhoven, S. Saksena and A. L. Zydney, Protein fractionation using electrostatic interactions in membrane filtration, Biotechnology and Bioengineering, 48(1995) 406-414.
74 E. Rosenberg, S. Hepbildikler, W. Kuhne and G. Winter, Ultrafiltration concentration of monoclonal antibody solutions: development of an optimized method minimizing aggregation, J. Membr. Sci., 342(2009) 50-59.
75 R. van Reis, S. Gadam, L. N. Frautschy, S. Orlando, E. M. Goodrich, S. Saksena, R. Kuriyel, C. M. Simpson, S. Pearl and A. L. Zydney, High performance tangential flow filtration, Biotechnol. Bioeng., 56(1997) 71-82.
76 P. Bacchin, P. Aimar and R. W. Field, Critical and sustainable fluxes: Theory, experiments and applications, J. Membr. Sci., 281(2006) 42-69.
77 S. Saksena and A. L. Zydney, effect of solution ph and ionic-Strength on the separation of albumin from immunoglobulins (IGG) by selective filtration Biotechnol. Bioeng., 43(1994) 960-968.
78 G. L. Baruah, A. Nayak, E. Winkelman and G. Belfort, Purification of monoclonal antibodies derived from transgenic goat milk by ultrafiltration, Biotechnology and Bioengineering, 93(2006) 747-754.
79 S. Metstamuronen and M. Nystrom, Critical flux in cross-flow ultrafiltration of protein solutions, Desalination, 175(2005) 37-47.
80 T. Y. Chiu, M. V. L. Dominguez and A. E. James, Critical flux and rejection behaviour of non-circular-channelled membranes - Influence of some operating conditions, Sep. Purif. Technol., 50(2006) 212-219.
81 S. Saksena and A. L. Zydney, Influence of protein-protein interactions on bulk mass transport during ultrafiltration, J. Membr. Sci., 125(1997) 93-108.
23
82 J. A. Howell, T. C. Arnot, H. C. Chua, P. Godino, D. Hatziantoniou and S. Metsamuuronen, Controlled flux behaviour of membrane processes, Macromol. Symp., 188(2002) 23-35.
83 N. Hilal, O. O. Ogunbiyi, N. J. Miles and R. Nigmatullin, Methods employed for control of fouling in MF and UF membranes: A comprehensive review, Sep. Sci. Technol., 40(2005) 1957-2005.
84 Z. Li, A. H-Kittikun and W. Youravong, Purification of protease from pre-treated tuna spleen extract by ultrafiltration: An altered operational mode involving critical flux condition and diafiltration, Sep. Purif. Technol., 66(2009) 368-374.
85 D. B. Burns and A. L. Zydney, Effect of solution pH on protein transport through ultrafiltration membranes, Biotechnol. Bioeng., 64(1999) 27-37.
86 C. Christy, G. Adams, R. Kuriyel, G. Bolton and A. Seilly, High-performance tangential flow filtration: a highly selective membrane separation process, Desalination, 144(2002) 133-136.

24
Chapter II: Improving Permeate Flux and Product Transmission in the Microfiltration of a Bacterial Cell Suspension by Flocculation with
Cationic Polyelectrolytes
A paper published in the Journal of Membrane Science 324(2008) 198-208
Matthew T. Aspelund1, Glenn Rozeboom3, Meng Heng2, Charles E. Glatz1*
1. Department of Chemical Engineering, Iowa State University, Ames, IA 50011 2. Genencor, A Danisco Division, Palo Alto, CA 94304
3. Genencor, A Danisco Division, Cedar Rapids, IA 52404
Abstract:
Microfiltration is an attractive method for the clarification of fermentation broths
provided that sufficiently high permeate flux and product transmission can be achieved.
Several polyelectrolytes were screened for flocculated particle size and permeate flux
enhancement in unstirred and stirred dead-end filtrations. Larger flocculated particles
were formed by flocculation with polyelectrolytes of longer chain length. Increase in
particle size of the feed generally resulted in an increase in the permeate flux, but the
largest particle size did not result in the greatest permeate flux enhancement. In crossflow
filtrations, long-term permeate flux improvements occurred despite complete disruption
of the floc in the recycled feed and the extent of the improvements were dependent on
both the polyelectrolyte dose and crossflow rate. The size of the particles comprising the
cake layer closely resembled that of the particles in the initial flocculated feed, indicating
that the particles that initially deposited on the cake surface avoided disruption during
filtration. Additionally, a decrease in subtilisin rejection was observed with filtration of

25
the flocculated feed. Thus, flocculation with cationic polyelectrolytes increased permeate
flux and reduced product rejection in the microfiltration of a complex industrial
fermentation broth.
Keywords: Microfiltration; Flocculation; Fouling; Rejection; Flux
Introduction:
One of the most costly steps in the production of industrial enzymes by fermentation is
the removal of cells and other particulates from the fermentation media. Traditionally,
this separation has been performed using centrifugation, depth filtration, or rotary drum
vacuum filtration [1]. Microfiltration is an attractive alternative to these methods because
of its low energy requirements, ability to treat different feeds with the same equipment,
generally nondenaturing operating conditions, and relatively contained and safe
operation. Additionally, unlike centrifugation, membrane filtration using a pore size less
than 0.2 µm requires no further clarification. Although microfiltration offers many
advantages over other clarification methods, fouling of the membrane by soluble feed
components and the buildup of a compressible layer of rejected biomass on the
membrane surface (i.e. cake layer) can lead to decreases in permeate flux and increased
product rejection, consequently making microfiltration uneconomical compared to other
clarification options [2, 3].
The cake resistance, Rc, influences permeate flux J, as seen in Darcy’s law,

26
J =dVperm
Adt=
∆p
µ0 Rm + Rc( ) (1)
where Vperm is the volume of the permeate, µ0 is the permeate viscosity, Rm is the
resistance of the membrane, ∆p is the transmembrane pressure, and A is the area available
for filtration. The resistance of the cake layer can be expressed in terms of the specific
cake resistance, α, where
Rc =αm (2)
and m is the mass of the cake layer per membrane area.
For unstirred dead-end filtrations, the cake resistance is expressed in terms of the volume
permeated, Vperm,
A
VR perm
cc αρ= (3)
where ρc is the mass of dry filter cake per unit volume of permeate. The specific cake
resistance is a convenient way to compare the intrinsic transport resistances of filter cakes
independently of the mass of the cake layer [4]. Combining Eqns. 1 and 3 and integrating
for constant pressure drop give [5]

27
p
R
A
V
pV
tA mopermoc
perm ∆+
∆=
µαµρ2
(4)
The specific cake resistance for unstirred dead-end filtrations can be obtained from the
slope of a plot of tA/Vperm versus Vperm/A. For compressible feeds, the specific cake
resistance varies with position in the cake [6]; therefore, use of equation 4 gives a specific
cake resistance averaged over the entire thickness of the cake layer.
For unstirred dead-end filtrations, the mass of the deposited cake layer is continually
increasing during the filtration, while in the absence of settling, the remaining suspension
has constant solids concentration. In stirred dead-end filtrations, the concentration of the
retained solids in the feed increases as the filtration progresses. This increase in the mass
of the deposited cake layer or the solids concentration of the feed will result in a decrease
in the permeate flux rate. Therefore, comparisons of the permeate fluxes are best done at
the same feed concentration factor, CF, where
CF =V feed
V feed −Vperm
(5)
and Vfeed is the initial volume of the feed. Differences in permeate flux at the same
concentration factor can be attributed to differences in transport resistances.

28
The cake layer is often the largest hydraulic resistance in the microfiltration of bacterial
suspensions because of the highly compressible nature of the cell cake [4, 7]. Several
methods have been developed to reduce specific cake resistance, mass of the deposited
cake layer, and product rejection. These methods include changes to hydrodynamics via
filtration module design [8-10], introduction of periodic back pulsing to break up the cake
layer [11, 12], and feed pretreatments such as pH adjustment [4, 13].
We have previously reported on the effects of pH, temperature, and transmembrane
pressure (TMP) on the dead-end filtration of a Bacillus fermentation broth where the cake
layer was the dominant flux resistance [4]. Specific cake resistance increased with TMP
and pH in a complex medium. Interestingly, in simple defined medium, increase of pH
caused cell aggregation, which was not observed in the complex medium, resulting in a
large decrease in the specific cake resistance. This result is expected as the particle size of
the feed suspension has been shown to affect the permeate flux in both dead-end and
crossflow filtrations.
The effect of particle size can be related to the specific cake resistance using the Carman-
Kozeny equation [14],
( )( ) ppS d
k
ρεε
α32
2 1
Φ
−= (7)

29
where ε is the porosity of the cake, ρp is the density of the particles, k2 is the Kozeny
constant associated with the morphology of the feed particles and typically assumed to
have a value of 5 [15], ΦS is the shape factor, and dp is the particle diameter/size. In
crossflow microfiltration, the same relationship would be expected for the cake that
forms; however, which particles are deposited depends on particle size as well as
crossflow hydrodynamics resulting in ‘quasi’-steady state flux relations of the following
form [2];
zo
rqb
mp
no LdcJ ηφγ= (8)
where γo is the wall shear rate, φb is the particle concentration, L is the length of the flow
channel, and ηo is the feed viscosity. The values of the constants c, n, m, q, r, z depend on
the dominant particle transport mechanism. The models for surface transport, inertial lift,
and shear-induced diffusion mechanisms have m equal to or greater than 1 (1, 3, and
1.33, respectively) and predict a positive correlation between permeate flux and particle
size. Therefore, in both dead-end and crossflow filtrations, the particle size has an
integral role in determining the flux, with larger particle size leading to higher flux, all
else being equal. This suggests flocculation could be an effective treatment for the
complex broth [4].
Flocculation has found extensive use in the waste water and biotechnology industries to
aid in separation techniques, such as filtration, flotation, sedimentation [16], and

30
centrifugation [17], where rate improves with the size of the suspended particles.
Previous studies have shown that the addition of a polyelectrolyte flocculant results in
increased permeate flux rates for the crossflow microfiltration of yeast cells [18, 19],
CHO cell suspensions [20] in simple media, bentonite [21], and titanium oxide in
deionized water [22], but microfiltration of a complex media broth has not been
examined.
However, flocculation of cell suspensions by cationic polyelectrolytes also leads to a
widening of the particle size distribution that can negate benefits of increased size. The
reduced benefit is likely due to selective deposition of smaller particles because of greater
shear-induced back diffusion of larger particles [18, 21, 23-25].
The factors that can affect flocculation by polyelectrolyte addition are polyelectrolyte
properties, such as structure, charge density, and molecular weight; polyelectrolyte dose;
solution conditions, such as pH, ionic strength, and solution composition; and the shear
environment [26-28]. In studies using yeast and mammalian cell suspensions, cationic
polyelectrolytes have been shown to be the most effective flocculants [20, 29] due to the
negative charge on the cells. The amount of polyelectrolyte that must be added to the
suspension to obtain the desired degree of flocculation depends strongly on the
characteristics of the suspension [26-28] and the polyelectrolyte. The primary mechanism
for flocculation with low molecular weight polyelectrolytes is charge neutralization,
where flocculation occurs due to neutralization of charges on the surface of the
suspended particles [16]. Higher molecular weight polyelectrolytes generally require

31
lower doses compared to lower molecular weight polyelectrolytes, most likely because
the flocs form via a bridging mechanism [30-33], where a single polyelectrolyte chain is
absorbed onto two or more particles. Increasing the polymer charge density can result in
a decrease in optimal polyelectrolyte dose [26].
Flocculated particles are very sensitive to their shear environment both during and after
their formation. Initial high-shear mixing is sometimes required to ensure even
distribution of polyelectrolyte. The duration of this period of intense initial mixing can
have a strong effect on the final floc formed [34]. However, after the initial mixing,
continued high shear can cause floc breakage that could lower permeate flux.
In microfiltration, the presence of the cake layer can also result in an increase in product
rejection [35, 36] defined as
R =1−Cperm
C feed
(9)
where Cfeed is the concentration of the product in the feed and Cperm is the concentration of
the product in the permeate. Wickramasinghe et al. [37] found that flocculation increased
the rejection of a viral contaminant; however, no studies have examined the effect of
flocculation on the rejection of a protein during microfiltration.

32
In this study, several cationic polyelectrolytes were screened to determine their
effectiveness in increasing permeate flux via flocculation for a complex industrial
fermentation broth containing an engineered protease, subtilisin. Simultaneous effects on
subtilisin rejection were also investigated. To examine the effect of shear on the filtration
performance of the flocculated particles, the filtrations were performed in three filtration
modules with differing shear rates. These were the no-shear environment of an unstirred
dead-end filter cell, the relatively low shear environment of a stirred dead-end cell, and
the relatively high shear environment of a lab scale, crossflow filtration unit.
Materials and Methods:
Membrane Preparation and Cleaning:
The membranes were flat-sheet polyethersulphone (PES) with a nominal pore size of 0.2
µm (Koch Membrane Systems, Wilmington, MA). Circular (~4.45 cm diameter) and
rectangular membranes (~22 x 17 cm) were cut from a larger sheet for dead-end and
crossflow filtrations, respectively. New membranes were initially cleaned by permeation
at 240 kPa using consecutive washes of 40 ml Ultrasil 11 (pH 11.5) (Ecolab, St. Paul,
MN), 20 ml DI water, 40 ml Ultrasil 76 (pH 1.5) (Ecolab, St. Paul, MN), 20 ml DI water,
40 ml Ultrasil 11, and 20 ml DI water for each dead-end cell filtration. Before and after
each crossflow filtration, wash steps were performed using the same series of cleaning
fluids as used for the dead-end cell membrane washes as follows: Ultrasil 11 for 30 min,
DI water for 15 min, Ultrasil 76 for 30 min, DI water for 15 min, Ultrasil 11 for 30 min,
and water for 15 min at a crossflow rate of 2.4 m/s and a TMP of 240 kPa in total recycle.

33
Membranes were reused for subsequent filtrations and clean water flux was taken before
each filtration to determine cleaning efficiency. Typical cleaning efficiencies (i.e.
recovery of clean water flux compared to new membrane) were 99-100% and the
membranes were replaced after 15 filtrations if this criterion was still being met.
Feed Preparation:
Industrial Bacillus subtilis broth (supplied by Genencor, A Danisco Division, Cedar
Rapids, IA) from production of engineered subtilisin from a complex medium containing
soymeal, glucose, and salts was used for all filtrations. The broth and enzyme were
stabilized via pH adjustment and calcium chloride addition and screened through a #250
mesh screen to remove any large residual media components. The solids concentration of
the fermentation broth after screening through the #250 mesh was approximately 15 g/L
on a dry basis, broth conductivity was equivalent to that of a 0.15 M NaCl solution.
Under these conditions the cells had a zeta potential of ~-24 mV. Batch to batch
variability in the fermentation broth was controlled by using broth from the same
fermentation for all of the experiments where direct comparisons were made; however,
several batches of fermentation broth were used with similar results obtained for different
broths at the same experimental conditions. The engineered subtilisin has a molecular
weight of 28 kDa and a pI of 6.8 giving it a positive charge at the filtration pH of 6.5
[38].
Flocculation:

34
Table 1 gives the characteristics of the cationic polyelectrolytes used for these
experiments (Kemira Water Solutions, Lakeland, FL). C-577, C-581, and C-591 were
provided as liquid cationic polymers, and C-4224 was provided as an oil-free emulsion.
For the same dose all polyelectrolytes provided, within a factor of two, the same charge
equivalences (Table 1). One part fermentation broth was added to three parts
polyelectrolyte in deionized water and mixed for 10 minutes at 300 rpm on a magnetic
stir plate during which the pH of the flocculated broth was adjusted to pH 6.5 using
calcium hydroxide (Fisher Scientific, Itasca, IL). The extended chain length of the
polyelectrolyte was estimated from the bond lengths and the number of repeating units
determine if the extended conformations of these polyelectrolytes were sufficient to
flocculate these particles by a bridging mechanism (Table 1).The polyelectrolyte doses
ranged from 0 to 0.035 g polyelectrolyte/g undiluted broth (henceforth expressed as 0 to
3.5 wt%). The reproducibility of floc formation was determined by measuring the particle
size before the filtration. Flocculated broth was rejected if the volume average particle
diameter (D4,3) did not fall within 10% of the average D4,3 (determined experimentally)
obtained with a given polyelectrolyte at a specific dose.
Unstirred and Stirred Dead-end Filtrations:
All dead-end filtrations were performed in an Amicon dead-end filtration cell (Model
8050, Millipore Corp. Billerica MA) with an effective membrane area of 13.4 cm2. The
filtration cell’s stir bar was removed for the unstirred dead-end filtrations. Fifty milliliters
of diluted broth was added to the filtration cell, which was then pressurized with nitrogen
gas. All filtrations were performed with a 240 kPa TMP. Samples of the feed and final

35
retentate were collected for determination of the particle size distribution at the beginning
and end of the filtration.
Permeate mass was measured using an electronic balance (Mettler-Toledo PG 6002-S,
Columbus, OH). For unstirred, dead-end filtrations, flux data were collected during the
linear range of the plot of tA/Vperm versus Vperm/A following the procedure of Graves et al.
[4]. The mass of permeate was recorded at a frequency of 0.5 to 5 minutes depending on
the flux (higher frequency for higher flux). Filtrations were run for two hours or until the
mass of permeate collected reached 20 g. The filter cake was collected and allowed to air
dry overnight to determine the dry cake mass.
For stirred, dead-end filtrations, the stirring rate was set to 200 rpm, which corresponds to
a shear rate of approximately 300 s-1. The average shear rate (γ) was estimated as being
equivalent to fully developed, laminar flow in a rectangular slit with the top surface
moving at the velocity of the tip of the stir bar, using equation 10.
d
RΩ=
πγ
2 (10)
where R is the radius of the stir bar (16 mm), Ω is the rotational velocity, and d is the
distance between the stir bar and the membrane surface (1.15 mm). Permeate flux was
determined by measuring the change in permeate mass over time at 1, 2, 3, 4, 5, 8, and 10

36
minutes and then every 5 minutes thereafter, up to one hour or when air began to
permeate the membrane from the bottom of the vortex (i.e. 27 g of collected permeate).
The viscosity of the cumulative permeate was measured using an Ostwald viscometer.
After the filtration, the membrane was gently washed with DI water to remove all visible
deposited cake, and a water flux was taken to determine the resistance of the fouled
membrane.
Crossflow Membrane Experiments:
Crossflow experiments were performed in a Sepa CF II flat sheet crossflow filtration unit
(Sterlitech Corporation, Kent, WA) with an effective membrane area of 140 cm2. A 65
mil (1.6 mm) thick zig-zag (alternating spacer filaments touching opposite channel walls)
spacer was placed in the feed channel as an eddy promoter. C-581 polymer doses were 0,
0.5, 1, and 2.0 wt%. The crossflow velocities (reported as the maximum superficial
velocity occurring at the constriction between the spacer filament and the membrane
surface) were 1.75 and 2.4 meters per second (m/s) and were controlled using a positive
displacement diaphragm pump (Hydracell, Wanner Engineering, Minneapolis, MN). Cao
et al. found by simulation of two dimensional flow around similar spacer filaments that
the wall shear stresses vary widely with position for such configurations, with the peak
shear stresses located in the constriction between the spacer filaments and the channel
wall and the lowest shear stress located between the channel walls [39]. The shear rate
magnitudes estimated from their results vary between approximately 1,000 and 80,000 s-1
for the 1.75 m/s crossflow rate, and between approximately 2,000 and 200,000 s-1 for the

37
2.4 m/s crossflow rate [39]. The TMP was maintained at 240 kPa using needle valves on
the outlet retentate and permeate streams. The retentate and permeate were recycled to
the feed tank to maintain constant feed concentration. The permeate flux was determined
using an electronic balance (Mettler-Toledo PG 6002-S, Columbus, OH) to measure the
change in permeate mass over time. A 10 ml sample of the 2 L feed was collected at the
beginning of the filtration and 10 ml samples of permeate were collected at 10, 20, 40,
and 55 minutes. The volume of permeate removed never exceeded 2% of the total feed
volume; therefore, the operation was considered to be constant volume. Several 1 ml
samples of the feed were taken at different times throughout the filtration for particle size
distribution and zeta potential determination.
Upon completion of the filtration, the membrane was removed from the filter housing
without any washing. The membrane was imaged using a Canon Digital Rebel XTi
(Cannon INC., Lake Success, NY). The particles of the cake attached to the membrane
surface were then collected for particle size determination by gently rinsing the
membrane with deionized water into a 50 ml centrifuge tube so as not to change particle
size during cake transfer. The zeta potential and particle size distribution were then
determined..
Polyelectrolyte and Particle Size and Particle Zeta Potential:
The hydrodynamic diameters of the polyelectrolyte flocculants were measured by
dynamic light scattering at conditions similar to that of the flocculation (pH of 6.5, 0.1 M
NaCl to match conductivity; 25 °C) using the Zetasizer Nano ZS90 (Malvern

38
Instruments, Southborough, MA). The polyelectrolyte solutions were prepared by adding
0.5 g of polyelectrolyte to 50 ml of a 0.1 M NaCl solution and mixing for 1 hour. The pH
was then adjusted to 6.5 with NaOH addition.
To determine the particle size distribution and zeta potential during the filtration, 1 ml of
the sample was diluted in 50 ml of DI water. The particle size distribution was measured
using the Malvern Mastersizer E laser diffraction particle size instrument (Malvern
Instruments, Southborough, MA) and the zeta potential was measured using a Zetasizer
Nano ZS90 (Malvern Instruments, Southborough, MA). It was found that no change in
the measured particle size or zeta potential occurred when the dilution was performed
using a diluent with the pH and ionic strength adjusted to match that of the fermentation
broth. The mass fractal dimension was calculated from the light scattering data obtained
from the Mastersizer E, using the procedure outlined by Bushnell et al. [40] in order to
determine the morphology of the flocculated particles.
Rejection Coefficient and Enzyme Assay:
For stirred and unstirred dead-end filtrations, 3 ml samples of the initial feed and the final
cumulative permeate were collected for determination of subtilisin activity, from which
the average membrane rejection was calculated using equation 6. In the crossflow
filtrations, 10 ml samples of the initial feed together with permeate samples taken at 20,
40, and 55 minutes were analyzed for subtilisin activity. Reported crossflow times were
corrected for the approximately 5 minute (~ 25 ml holdup volume) permeate hold up
time. Permeate samples collected in the first 20 minutes of the actual filtration were

39
inaccurate due to dilution by the water in the hold up volume. Since the crossflow
filtration was operated in total recycle mode, the subtilisin activity in the retentate was
constant and equation 6 was used to determine the instantaneous membrane rejection.
Subtilisin activity was determined using spectrophotometric detection of the enzymatic
cleavage of p-nitroanalide from the substrate N-succinyl-Ala-Ala-Ala-p-nitroanalide
(AAA, Bachem Bioscience, King of Prussia, PA) at 405 nm. The substrate for the assay
was prepared from a stock solution containing 30 mg/ml AAA in dimethyl sulfoxide
(DMSO). All permeate and feed samples were prepared in triplicate with a dilution of 1:1
in Tris buffer (0.1 M Tris, 0.01 M CaCl2, 0.005% Triton X-100, pH 8.6). Cells were
removed from the feed samples by centrifugation for 2 minutes at 12,000 rpm. Feed
supernatants and permeate samples were loaded onto the COBAS FARA II centrifugal
analyzer (Roche, Basel Switzerland) for determination of subtilisin activity. All
chemicals for the enzyme assay were purchased from Fisher Scientific (Itasca, IL), with
the exception of Tween 80 and DMSO (Sigma Chemical Company, St. Louis, MO).
Results and Discussion:
Floc size and Polyelectrolyte Properties:
The addition of C-4224, C-577, and C-581 resulted in a significant increase (p < 0.05) in
volume-averaged particle size (D4,3) of the flocculated broth (Table 2). Flocculation with
the addition of C-591 did not result in a significant increase in D4,3 relative to the
unflocculated broth; however, there was a significant increase in the fractal dimension of

40
the particles in the flocculated suspension (Df ~1.6) compared to the unflocculated broth
(Df ~1) indicating that some degree of flocculation occurred. The largest flocs were
formed by flocculation with C-4224, with C-581 forming the second largest flocs. This
result is consistent with findings from the flocculation of other suspensions where high
molecular weight polyelectrolytes caused the highest degree of flocculation [26, 30-33,
41, 42]. The higher molecular weight of C-4224 and C-581 provided a large extended
chain length relative to the diameter of the Bacillius particles (~ 2 µm), providing the
potential for bridging flocculation. However, higher polyelectrolyte molecular weight did
not always result in larger flocs. The addition of C-577, the lowest molecular weight
polymer tested, resulted in a higher D4,3 than that of the flocs formed with the addition of
C-591, a much higher molecular weight polyammonium flocculant. Smaller floc sizes
were obtained by flocculation with C-577 and C-591. Since the extended chain lengths of
C-577 and C-591 (Table 1) are smaller, charge neutralization, rather than bridging is
likely the dominant flocculation mechanism, resulting in the smaller floc size obtained by
flocculation with these polyelectrolytes. These results indicate that the structure of the
repeating unit and the conformation that the polyelectrolyte acquires in solution has a
greater influence on the final size of the flocculated particles than the molecular weight
[26, 32, 43].
A typical particle size distribution of the unflocculated feed and the feed flocculated with
a 0.5 wt% dose of C-581 is shown in Figure 1. Unflocculated particles had a fairly
narrow distribution with the majority of particles between 1 and 8 µm in diameter, similar
to the typical ~2 µm size of Bacillus subtilis cells. Additionally, a small amount of larger
41
particles, as large as 150 µm, were also observed. These were likely residual soymeal
solids that passed through the #250 mesh screen. The size range of was considerably
wider (Figure 1). At the low shear level of the stirred dead-end cell module, there was no
significant decrease in floc size over the time (1 h) of filtration (Table 2).
Based on these three polymers, polymer size was more important than charge density in
determining particle size. This was confirmed when C-581, having the same chemistry
and charge density as C-577 but higher molecular weight, was evaluated. It also resulted
in larger flocs (Table 3).
Stirred and Unstirred Dead-End Filtrations:
The average permeate fluxes in dead-end filtration for feeds flocculated with three
polyelectrolytes are shown in Figure 2 (unstirred) and Figure 3 (stirred). All flocculated
broths showed higher flux to varying degrees, but the enhancements declined with time in
the stirred cell. C-577, a low molecular weight, high charge density, linear quaternary
polyamine, with the charged group located in the polymer backbone, provided the
greatest improvement. The addition of C-4224, a high molecular weight, low charge
density, polyacrylamide, resulted in the smallest increase in permeate flux of the
polyelectrolytes tested, despite the fact that it resulted in the largest initial flocculated
particle size (Table 2). Flocculation with C-591, a mid-range molecular weight,
quaternary polyammonium, with the charged group located in a ring structure in the
repeating unit, resulted in greater permeate flux than that obtained with the larger floc-
producing C-4224 but lower flux than with C-577. In the stirred cell, only the addition of

42
C-577 resulted in a significant increase (p < 0.05) in the permeate flux relative to that of
the unflocculated suspension.
Fouling, as measured by the reduction in clean water flux, was the same for all broths (ca.
50% reduction), so the enhancement is attributed to cake properties. Of these, the
increase in the particle size of the feed suspension is likely the dominant factor. However,
as shown in Figures 2 and 3, the filtration with the initial largest flocculated particle size
(C-4224) resulted in the smallest increase in the permeate flux. Comparison of average
sizes could overlook increased resistance from greater numbers of smaller particles
present or higher permeate viscosity. However, permeate viscosity was unchanged and
examination of the number distribution (more sensitive to the presence of smaller
particles) also showed no significant difference at the small particle end. Based on the
fractal dimension of the flocs (Table 2), particle morphology was also similar for all
flocculants. It may be that the chain length of C-4224 increases cake resistance.
Polyelectrolyte doses in all cases were much less than required to neutralize particle
charge so levels of unbound polyelectrolyte should be low, but extended chains may have
added an additional sieving resistance within the cake offsetting the benefit of the
increased particle size..
Polyelectrolyte Molecular Weight and Dose:
Since the polyamine repeating unit of C-577 showed the greatest increase in the permeate
flux of the polyelectrolytes tested, the effects of the polyelectrolyte molecular weight and
dose were examined further by flocculating the feed with C-577 and C-581, a high

43
molecular weight polyelectrolyte of the same repeating unit and charge density as C-577
(Table 1).
Flocculation with either C-577 or C-581 increased the permeate flux for all doses tested
both in stirred (Figure 4 as reduced cake resistance) and unstirred (Figure 5 as flux
enhancement) dead-end filtrations. The flux enhancement (F ),is defined as
F =J floc
Jnofloc
(11)
where, Jfloc is the permeate flux resulting from the flocculated feed and Jnofloc is that of the
unflocculated feed. Highest fluxes were obtained with the higher molecular weight C-
581. Since the flux enhancement changes with extent of filtration, Figure 5 is presented
for a CF of 1.18 at which point the relative fluxes have obtained a fairly constant value.
For these two polyelectrolytes, differing only in molecular weight, there is a correlation
between increased floc size with the higher molecular weight and decreased cake
resistance and greater flux enhancement. The correlation of flux measures with floc size
persists for dosages up to 1 wt% but not beyond. The fractal dimension of the flocs
remains close to 1.8 for all nonzero dosages. This is similar to the observation with C-
4224 flocculation of low permeate flux despite a larger particle size, although this occurs
at higher polyelectrolyte doses for C-577 and C-581 than C-4224.
44
This eventual decrease in flux at the highest dosages was not accompanied by increases
in permeate viscosity or internal membrane fouling. However, the zeta potential of the
flocculated particles was ~-21 mV for all doses of C-581, greater than 0.2 wt% indicating
that some excess flocculant may be free in solution which could add to the cake and
increase the transport resistance.
Product Rejection:
Subtilisin rejection averaged over the entire filtration was measured for all of the stirred
and unstirred dead-end experiments by comparing the subtilisin activity of the initial feed
to that of the final cumulative permeate. The subtilisin rejection averaged over all of the
polyelectrolytes and doses tested was higher in the stirred dead-end filtrations (R = 0.24)
than the unstirred filtrations (R = 0.09). There were no significant difference (p < 0.05) in
the rejection among the different polyelectrolytes and doses. The lack of any
polyelectrolyte/dosage effect in the unstirred filtrations would indicate that the cake itself
is not a factor in rejection. More puzzling is the increased rejection for the stirred dead-
end filtrations. The only factor that would seem to lead to increased rejection would be
that preferential deposition of smaller particles seen in crossflow [44, 45] leading to a
cake or pore plugging capable of rejection.
Crossflow Experiments:
The crossflow filtration experiments were performed using C-581 as this polyelectrolyte
flocculant resulted in the greatest increase in the permeate flux in the stirred and unstirred
dead-end filtrations. In the crossflow experiments, which varied flow rate and

45
polyelectrolyte dose, declines in clean water flux were approximately 50% as they had
been in the earlier dead-end experiments.
Particle Size:
For all of the polyelectrolyte doses, the size of the flocculated particles was reduced to
that of the unflocculated suspension within the first 30 minutes of the filtration (Figure
6). The flocs were exposed to much higher shear rates in this device than in the stirred
cell where there was little breakage. The evolution of the particle size distributions
provides evidence for a dosage-dependent breakage mode. For the 0.5 wt% dose, the
decreasing intensity with filtration time of the peak associated with the large flocs and the
increasing intensity with time of the peaks associated with smaller particles (Figure 7A)
is characteristic of erosion. For higher doses, the movement of a monomodal distribution
to progressively smaller sizes is indicative of fragmentation (Figure 7B). Similar results
were obtained for the 2.4 m/s crossflow rate (results not shown); however, the flocs
formed by the 2 wt% polymer dose break down faster at the higher crossflow rate and
their size reaches that of the unflocculated suspension after about 20 minutes.
Permeate Flux:
Flocculation by the addition of C-581 increased in permeate flux compared to the
unflocculated feed for all of the polyelectrolyte doses and crossflow rates tested (Figures
8 - 10). Improvements in F were small during the period of rapid flux decline (the first 5-
10 min) then increased until the permeate flux became ‘quasi’ - steady approximately 30
minutes into the filtration (Figure 10). The longer-term flux improvements persisted well

46
beyond the point (ca. 5-10 min) at which the flocculated particles in the recycled retentate
were fully disrupted (Figure 6). At the lower crossflow, flux enhancement increased with
each dosage increase; however, at the higher crossflow, a dosage of 1% was optimal.
Though the relative enhancements were greater at lower crossflow (Figure 10), the actual
fluxes were greater at the higher crossflow (Figures 8 and 9).
While flocs suspended in the retentate were disrupted well before completion of the
filtration, flocs remaining on the membrane at the end of the run were nearly the same
size as in the initial feed both as regards D4,3 (Table 4) and size distribution (Figure 11).
For the unflocculated feeds, the deposited particles were larger than the feed particles
(Table 4 and Figure 12). While the initial unflocculated feed had little total volume in the
10-100 µm range (and that likely residual soy meal), most of the deposited cake was of
that size (Figure 12). Thus this final cake likely consists of cell aggregates formed by
cake compression and residual soy meal. As with the flocculated feed cake, the
unflocculated feed cake had somewhat larger particles at the lower crossflow. While the
particles were larger, it is also likely that the cake was thicker at lower crossflow and the
latter factor would have caused the lower fluxes. However, gravimetric measurement of
cake mass was not sufficiently accurate to verify this conclusion.
The large particles in the cake likely deposited early in the lower shear regions of the
spacer-filled feed channel, while the high shear region coverage would have been thinner
and populated by small particles less mobilized by shear-induced back diffusion and
more prevalent as the filtration proceeded. This is seen in the pattern of deposited cake

47
(Figure 13), which is very similar to the pattern seen in the simulation of flow through a
spacer of similar geometry by Koutsou et al. [46]. The locations of the thicker deposits
(the dark regions of Figure 13) correspond to the low shear regions in their simulation.
The higher shear regions would be expected to have deposits renewed from the lower size
particles that increasingly predominate with time. Hence, a fraction of the membrane
area would permeate with the initial higher flux while the remainder would provide
declining flux.
For the crossflow experiments, the changes in flux (Figures 8-10) and deposited particle
size (Table 4) do correspond well providing an explanation for dosage-dependent trends.
The observed presence of the larger particles characteristic of the filtration feed in the
cake layer is in contrast to the result expected from microfiltration of widely polydisperse
feeds, where smaller particles preferentially deposit in higher shear regions [23-25]. The
larger particles in the cake layer are likely a result of both the early deposition of the full
ranged flocculated feed particles in the low shear regions and compaction of the particles
on the membrane surface. The decrease in the size of the particles in the cake layer with
increasing crossflow rate indicates that, at the low crossflow the shear-induced diffusion
in the low shear regions is insufficient to keep the larger particles off the membrane;
whereas, at the higher crossflow rate the increased shear-induced diffusion is able to
prevent deposition. Additionally, the zeta potential of the cake layer particles of the
flocculated feeds were lower than that of the original feed (Table 4) indicating that some
rearranging of the flocculated particles or the adsorbed polyelectrolytes occurred in the
particles that are compacted on the membrane surface.
48
Product Rejection in Crossflow:
Flocculation was advantageous for recovery of subtilisin in the permeate. Flocculation
decreased the rejection of subtilisin for all flocculant doses and crossflow rates examined,
with a greater decrease in rejection for flocculant doses greater than 0.5 wt% (Figures 14
and 15). Possibly relevant factors affecting rejection would be the cake pore structure
(smaller particles/pores increasing rejection), electrostatic interactions of proteins with
the cells in the cake (assisting rejection) [35], and flux-dependent polarization
(decreasing apparent rejection). Since flux (Figure 8 and 9) and particle size (Table 4)
vary oppositely with crossflow, the particle size effect must have dominated to account
for the lower rejection at lower crossflow. This flow-dependent aspect of rejection
behavior is the same as that observed in the dead-end filtrations where crossflow
increased rejection.
Given the lower cake particle zeta potential after flocculation (Table 4) reduced
electrostatic interaction may also be reducing rejection [47, 48]. Rejection of subtilsin
was roughly equivalent at flocculant doses greater than 0.5 wt% for both the 1.75 and 2.4
m/s crossflow rate.
A final advantage of flocculation is that subtilisin rejection did not increase with filtration
time as did happen when no polyelectrolyte flocculant was used (Figure 14 and 15). At
the 2 wt% dose there is actually a decrease between 20 and 40 minutes. These

49
experiments did not allow for determination of whether the changes with time resulted
from changes in the membrane or changes in the cake.
Conclusions:
Flocculation with cationic polyelectrolytes increased the permeate flux in unstirred dead-
end, stirred dead-end, and crossflow filtrations, and decreased product rejection in
crossflow filtration. Larger flocs were formed with longer-chain polyelectrolytes. In
unstirred and stirred dead-end filtrations the optimal polyelectrolyte dose was 0.5 wt%
for both C-577 and C-581.While particle size plays a significant role in the permeate flux,
larger particle size did not always result in an increase in the permeate flux. The different
polyelectrolyte repeating units influenced flux in ways that could not be accounted for by
floc size, polyelectrolyte molecular weight, membrane fouling, or solution properties.
In crossflow filtrations, long-term increases in the permeate flux were observed with
flocculation, despite complete disruption of the flocculated particles in the recycled
retentate, a result explained by the apparent persistence of the initially formed cake in
lower shear regions of the spacer-filled feed channel. The optimal polyelectrolyte dose
for flux enhancement was dependent on the crossflow rate and flux increased with
crossflow rate.
Acknowledgments:
This work was funded by Genencor, A Danisco Division. The authors thank Kevin
Graves, Iowa State University graduate student, for performing the unstirred dead-end

50
polyelectrolyte screening filtrations and Pete Keyes and Marci Baldwin from Genencor,
A Danisco Division for providing assistance with the subtilisin assay.
Symbols:
Cperm, activity of the permeate
Cfeed, activity of the feed
CF, concentration factor
J, permeate flux (LMH)
Jfloc, permeate flux of the flocculated suspension
Jnofloc, permeate flux of the unflocculated suspension
A, membrane area (m2)
∆p, transmembrane pressure (kPa)
µ0, permeate viscosity (cP)
R , overall product rejection
m, mass of the cake layer in dead-end filtrations (g)
F , Flux enhancement
Rm, membrane resistance (cm-1)
Rc, cake resistance (cm-1)
α, specific cake resistance (cm/g)
ρc, mass of dry cake per volume of permeate (g/cm3)
t, filtration time (s)
Vperm, volume of permeate (ml)
Vfeed, volume of the feed (ml)
51
ε, porosity of the cake layer
dp, particles diameter (µm)
γ0, wall shear rate (s-1)
φb, particle concentration in the bulk
Φs, particle shape factor
L, length of the filter channel (m)
η0, viscosity of the feed (cP)
R, radius of the stir bar in the stirred dead-end filtration unit (m)
d, gap distance between the stir bar and the membrane in the stirred dead-end filtration
unit (m)
Ω, rotational velocity of the stir bar (rev/s)
References: [1] R. van Reis and A. Zydney, Membrane separations in biotechnology. Curr. Opin.
Biotechnol., 12 (2) (2001) 208-211. [2] G. Belfort, R. H. Davis and A. L. Zydney, The behavior of suspensions and
macromolecular solutions in cross-flow microfiltration. J. Membr. Sci., 96 (1-2) (1994) 1-58.
[3] G. Russotti and K. E. Goklen, Crossflow membrane filtration of fermentation
broth, in W. W. Wang (Ed.), Membrane separations in biotechnology, Marcel Dekker, New York, 2001, pp. 85-159.
[4] K. Graves, G. Rozeboom, M. Heng and C. Glatz, Broth conditions determining
specific cake resistance during microfiltration of Bacillus subtilis. Biotechnol. Bioeng., 94 (2) (2006) 346-352.
[5] R. G. Harrison, P. Todd, S. R. Rudge and D. Petrides, Bioseparations science and
engineering, Oxford University Press, 2001.

52
[6] W. Leu, Principles of compressible cake filtration, in N. P. Cheremisinoff (Ed.), Encyclopedia of fluid mechanics, Gulf Publishing Co., Houston, 1986, pp. 866-903.
[7] P. Blanpain, J. Hermia and M. Lenoel, Mechanisms governing permeate flux and
protein rejection in the microfiltration of beer with a cyclopore membrane. J. Membr. Sci., 84 (1-2) (1993) 37-51.
[8] S. Luque, H. Mallubhotla, G. Gehlert, R. Kuriyel, S. Dzengeleski, S. Pearl and G.
Belfort, A new coiled hollow-fiber module design for enhanced microfiltration performance in biotechnology. Biotechnol. Bioeng., 65 (3) (1999) 247-257.
[9] J. H. Vogel and K. H. Kroner, Controlled shear filtration: A novel technique for
animal cell separation. Biotechnol. Bioeng., 63 (6) (1999) 663-674. [10] A. Torang, A. S. Jonsson and G. Zacchi, Separation of cells and proteins from
fermentation broth in a shear-enhanced cross-flow ultrafiltration module as the first step in the refinement of lactic acid. Appl. Biochem. Biotechnol., 76 (2) (1999) 143-157.
[11] H. Mallubhotla and G. Belfort, Semiempirical modeling of cross-flow
microfiltration with periodic reverse filtration. Ind. Eng. Chem. Res., 35 (9) (1996) 2920-2928.
[12] J. A. Levesley and M. Hoare, The effect of high frequency backflushing on the
microfiltration of yeast homogenate suspensions for the recovery of soluble proteins. J. Membr. Sci., 158 (1-2) (1999) 29-39.
[13] K. Ohmori and C. E. Glatz, Effects of ph and ionic strength on microfiltration of
c-glutamicum. J. Membr. Sci., 153 (1) (1999) 23-32. [14] W. L. McCabe, J. C. Smith and P. Harriott, Unit operations in chemical
engineering, McGraw-Hill 2001. [15] G. Foley, A review of factors affecting filter cake properties in dead-end
microfiltration of microbial suspensions. J. Membr. Sci., 274 (1-2) (2006) 38-46. [16] J. Gregory, Fundamentals of flocculation. Crit. Rev. Environ. Cont., 19 (3) (1989)
185-230. [17] A. C. Bentham, J. Bonnerjea, C. B. Orsborn, P. N. Ward and M. Hoare, The
separation of affinity flocculated yeast-cell debris using a pilot-plant scroll decanter centrifuge. Biotechnol. Bioeng., 36 (4) (1990) 397-401.

53
[18] S. R. Wickramasinghe, B. B. Han, S. Akeprathumchai, V. Chen, P. Neal and X. Qian, Improved permeate flux by flocculation of biological feeds: Comparison between theory and experiment. J. Membr. Sci., 242 (1-2) (2004) 57-71.
[19] S. R. Wickramasinghe, Y. L. Wu and B. B. Han, Enhanced microfiltration of
yeast by flocculation. Desalination, 147 (1-3) (2002) 25-30. [20] J. S. Kim, S. Akeprathumchai and S. R. Wickramasinghe, Flocculation to enhance
microfiltration. J. Membr. Sci., 182 (1-2) (2001) 161-172. [21] K. Chellappah, E. S. Tarleton and R. J. Wakeman, Effect of flocculation on
critical flux during crossflow microfiltration of bentonite suspensions. Sep. Sci. Technol., 43 (1) (2008) 29-44.
[22] M. T. Nguyen and S. Ripperger, Investigation on the effect of flocculants on the
filtration behavior in microfiltration of fine particles. Desalination, 147 (1-3) (2002) 37-42.
[23] S. Chellam and M. R. Wiesner, Evaluation of crossflow filtration models based on
shear-induced diffusion and particle adhesion: Complications induced by feed suspension polydispersivity. J. Membr. Sci., 138 (1) (1998) 83-97.
[24] H. B. Dharmappa, J. Verink, R. Benaim, K. Yamamoto and S. Vigneswaran, A
comprehensive model for cross-flow filtration incorporating polydispersity of the influent. J. Membr. Sci., 65 (1-2) (1992) 173-185.
[25] J. Kromkamp, M. van Domselaar, K. Schroen, R. van der Sman and R. Boom,
Shear-induced diffusion model for microfiltration of polydisperse suspensions. Desalination, 146 (1-3) (2002) 63-68.
[26] Y. Zhou and G. V. Franks, Flocculation mechanism induced by cationic polymers
investigated by light scattering. Langmuir, 22 (16) (2006) 6775-6786. [27] R. K. Iler, Relation of particle size of colloidal silica to amount of a cationic
polymer required for flocculation and surface coverage. J. Colloid Interface Sci., 37 (2) (1971) 364-373.
[28] W. Chen and J. C. Berg, The effect of polyelectrolyte dosage on floc formation in
protein precipitation by polyelectrolytes. Chem. Eng. Sci., 48 (10) (1993) 1775-1784.
[29] J. G. Aunins and D. I. C. Wang, Induced flocculation of animal-cells in
suspension-culture. Biotechnol. Bioeng., 34 (5) (1989) 629-638.

54
[30] W. E. Walles, Role of flocculant molecular weight in coagulation of suspensions. J. Colloid Interface Sci., 27 (4) (1968) 797-803.
[31] J. Gregory, Flocculation of polystyrene particles with cationic polyelectrolytes.
Trans. Faraday Soc., 65 (560P) (1969) 2260-2268. [32] J. Gregory, Rates of flocculation of latex particles by cationic polymers. J. Colloid
Interface Sci., 42 (2) (1973) 448-456. [33] J. Gregory, Effect of cationic polymers on colloidal stability of latex-particles. J.
Colloid Interface Sci., 55 (1) (1976) 35-44. [34] M. A. Yukselen and J. Gregory, The effect of rapid mixing on the break-up and
re-formation of flocs. J. Chem. Technol. Biotechnol., 79 (7) (2004) 782-788. [35] A. Persson, A. S. Jonsson and G. Zacchi, Transmission of bsa during cross-flow
microfiltration: Influence of ph and salt concentration. J. Membr. Sci., 223 (1-2) (2003) 11-21.
[36] K. J. Hwang and H. C. Hwang, The purification of protein in cross-flow
microfiltration of microbe/protein mixtures. Sep. Purif. Technol., 51 (3) (2006) 416-423.
[37] S. R. Wickramasinghe, B. B. Han, J. O. Carlson and S. M. Powers, Clearance of
minute virus of mice by flocculation and microfiltration. Biotechnol. Bioeng., 86 (6) (2004) 612-621.
[38] C. R. Pearson, M. Heng, M. Gebert and C. E. Glatz, Extracellular enzyme loss
during polyelectrolyte flocculation of cells from fermentation broth. Biotechnol. Bioeng., 87 (1) (2004) 61-68.
[39] Z. Cao, D. E. Wiley and A. G. Fane, Cfd simulations of net-type turbulence
promoters in a narrow channel. J. Membr. Sci., 185 (2) (2001) 157-176. [40] G. Bushell and R. Amal, Measurement of fractal aggregates of polydisperse
particles using small-angle light scattering. J. Colloid Interface Sci., 221 (2) (2000) 186-194.
[41] F. Mabire, R. Audebert and C. Quivoron, Flocculation properties of some water-
soluble cationic copolymers toward silica suspensions - a semiquantitative interpretation of the role of molecular-weight and cationicity through a patchwork model. J. Colloid Interface Sci., 97 (1) (1984) 120-136.

55
[42] J. K. Dixon, V. K. Lamer, C. Li, Messinge.S and H. B. Linford, Effect of structure of cationic polymers on flocculation and electrophoretic mobility of crystalline silica. J. Colloid Interface Sci., 23 (4) (1967) 465- 473.
[43] W. S. Kim, I. Hirasawa and W. S. Kim, Effects of experimental conditions on the
mechanism of particle aggregation in protein precipitation by polyelectrolytes with a high molecular weight. Chem. Eng. Sci., 56 (23) (2001) 6525-6534.
[44] R. J. Baker, A. G. Fane, C. J. D. Fell and B. H. Yoo, Factors affecting flux in
cross-flow filtration. Desalination, 53 (1-3) (1985) 81-93. [45] G. Foley, D. M. Malone and F. Macloughlin, Modeling the effects of particle
polydispersity in cross-flow filtration. J. Membr. Sci., 99 (1) (1995) 77-88. [46] C. P. Koutsou, S. G. Yiantsios and A. J. Karabelas, Direct numerical simulation
of flow in spacer-filled channels: Effect of spacer geometrical charateristics. J. Membr. Sci., 291 (2007) 53-69.
[47] G. L. Baruah and G. Belfort, Optimized recovery of monoclonal antibodies from
transgenic goat milk by microfiltration. Biotechnol. Bioeng., 87 (3) (2004) 274-285.
[48] D. B. Burns and A. L. Zydney, Effect of solution pH on protein transport through
ultrafiltration membranes. Biotechnol. Bioeng., 64 (1) (1999) 27-37.

56
Tables: Table 1. Cationic polyelectrolytes used for flocculation.
a Properties reported by manufacturer bAMD: acrylamide cQ9: acryloyloxyethyltrimethylammonium chloride dQE9: acryloyloxyethyltrimethylammonium chloride eDMA: dimethylamine fEPI: epichlorohydrin gDADMAC: diallyldimethylammonium chloride h molecular weight reported by manufacturer from viscosity measurements

57
Table 2. Particles size (D4,3) and mass fractal dimension at start and finish of stirred-cell filtrations. The polyelectrolyte doses were 0.2 wt% (g polymer/ g undiluted broth). The error represents 95% confidence intervals.

58
Table 3. Initial particle size by volume (D4,3) measured for C-577 and C-581 at different polymer doses used for unstirred dead-end, stirred dead-end, and crossflow filtrations.
a For these values a portion of the by volume particle size distribution was larger than the limit of detection of the instrument (600 µm) so the actual D4,3 values is larger than the reported value.

59
Table 4. D4,3 for particles collected from the membrane surface after crossflow filtration with C-581 at two crossflow rates (1.75 and 2.4 m/s). Initial feed particle sizes can be found in Table 3. Error represents a 95% confidence interval.
a Zeta potential of the initial flocculated feed was -21 mV ± 1 for all of the polyelectrolyte dose levels from 0.5 – 2 wt% and -24 mV ± 1 for the broth before flocculation b A large portion of the by volume particle size distribution was larger than the limit of detection of the instrument (600 µm) for this measurement so the actual D4,3 values is larger than the reported value.

60
Figures
Particle Diameter (µ(µ(µ(µm)
0.1 1 10 100 1000
% v
olu
me
0
2
4
6
8
10
12
14
No Polyelectrolyte 0.5 wt% C-581
Figure 1. Typical particle size distribution of the unflocculated suspension and the suspension flocculated with a polyelectrolyte dose of 0.5 wt% C-581.

61
Concentration Factor
1.15 1.20 1.25 1.30 1.35 1.40
Per
mea
te F
lux
(LM
H)
0.0
0.5
1.0
1.5
2.0
2.5
3.0
3.5
4.0
No Polyelectrolyte0.2 wt% C-42240.2 wt% C-5910.2 wt% C-577
Figure 2. Comparison of different polyelectrolytes for their enhancement of permeate flux rates for unstirred dead-end filtrations.

62
Concentration Factor
1.0 1.1 1.2 1.3 1.4 1.5 1.6
Per
mea
te F
lux
(LM
H)
0
5
10
15
20
25
30
35
40
45
50
No Polyelectrolyte0.2 wt% C-42240.2 wt% C-5910.2 wt% C-577
Figure 3. Effect of polyelectrolyte properties on the permeate flux in stirred dead-end filtration. Error bars represent a 95% confidence interval.

63
Polyelectrolyte Dose (%wt)
0.0 0.5 1.0 1.5 2.0 2.5 3.0 3.5 4.0Sp
ecif
ic C
ake
Res
ista
nce
(cm
/g*1
0-13 )
0
1
2
3
4
5
6
7
8
9
10
C-577C-581
Figure 4. Effect of concentration of C-577 and C-581 on the average specific cake resistance in unstirred dead-end filtrations.

64
Polyelectrolyte Dose (%wt)
0.0 0.5 1.0 1.5 2.0 2.5 3.0 3.5 4.0
FF FF
3
4
5
6
7
8
9
10
C-577C-581
Figure 5. The effect of polymer dose on the flux enhancement of the flocculated permeate flux to the unflocculated permeate for C-577 and C-581 at a concentration factor (CF) of 1.18 in stirred dead-end filtrations.

65
Time (min)
0 10 20 30 40 50 60 70
D4,
3 ( µµ µµ
m)
0
50
100
150
200
250
300
350
No Polyelectrolyte 1.75 m/s0.5 wt% 1.75 m/s1.0 wt% 1.75 m/s2.0 wt% 1.75 m/s
Figure 6. The effect of filtration time on the by volume-averaged particle diameter D4,3
(µm) in crossflow filtration for polyelectrolyte doses of, 0.5, 1.0, and 2.0 wt% C- 581 polymer doses C-581 at a crossflow rate of 1.75 m/s.

66
Particle Diameter (µµµµm)
1 10 100 1000
% v
olu
me
0
2
4
6
8
10
12
Feed1 min4 min60 min
A

67
Particle Diameter (µµµµm)
1 10 100 1000
% v
olu
me
0
2
4
6
8
10
12
14
Feed1 min4 min60 min
B Figure 7. The development of the particle size distribution during microfiltration of the flocculated feed at a crossflow rate of 1.75 m/s . A: 0.5 wt% C-581 and B: 2 wt% C-581.

68
Time (min)
0 10 20 30 40 50 60 70
Per
mea
te F
lux
(LM
H)
0
10
20
30
40
50
60
No Polyelectrolyte 1.75 m/s0.5 wt% 1.75 m/s1.0 wt% 1.75 m/s2.0 wt% 1.75 m/s
Figure 8. Average permeate flux at a crossflow rate of 1.75 m/s at at 0, 0.5, 1.0, and 2.0 wt% C- 581 polymer doses. Experiments were replicated three times with a 95% confidence interval of ± 0.5 LMH.

69
Time (min)
0 10 20 30 40 50 60 70
Per
mea
te F
lux
(LM
H)
0
10
20
30
40
50
60
No Polyelectrolyte 2.4 m/s0.5 wt% 2.4 m/s1.0 wt% 2.4 m/s2.0 wt% 2.4 m/s
Figure 9. Average permeate flux at a crossflow rate of 2.4 m/s at 0, 0.5, 1.0, and 2.0 wt% C- 581 polymer doses. Experiments were replicated three times with a 95% confidence interval of ± 0.5 LMH.

70
Time (min)
0 20 40 60
FF FF
1.0
1.2
1.4
1.6
1.8
2.0
2.2
2.4
2.6
2.80.5 wt% 1.75 m/s1.0 wt% 1.75 m/s2.0 wt% 1.75 m/s0.5 wt% 2.4 m/s1.0 wt% 2.4 m/s2.0 wt% 2.4 m/s
Figure 10. Observed flux enhancement during crossflow microfiltration after flocculation of the feed with the addition of C-581. Solid lines represent 1.75 m/s crossflow rate and dashed lines represent 2.4 m/s crossflow rate.

71
Particle Size (µµµµm)
0.1 1 10 100 1000
% v
olu
me
0
2
4
6
8
10
0.5 wt% C-581 Feed0.5 wt% C-581 Cake 1.75 m/s0.5 wt% C-581 Cake 2.4 m/s
Figure 11. Typical particle size distributions of the feed and the cake layers formed during a filtration with a 1.75 and 2.4 m/s crossflow rate at a 0.5 wt% dose of C-581.

72
Particle Size (µµµµm)
1 10 100 1000
% v
olu
me
0
2
4
6
8
10
12
14
No Polyelectrolyte FeedNo Polyelectrolyte Cake 1.75 m/sNo Polyelectrolyte Cake 2.4 m/s
Figure 12. Typical particle size distributions of the feed and the cake layers formed during a filtration with a 1.75 and 2.4 m/s crossflow rate of the unflocculated feed.

73
A B Figure 13. Images (with background digitally reduced to improve contrast) of a segment of the membrane surface showing the distribution of particles deposited on the membrane surface at the end of the filtration. Arrows indicate the direction of the bulk crossflow and the lines indicate the approximate location of the spacer filaments, solid and dashed lines represent where spacer filaments contacted the membrane surface and the opposite channel wall respectively. A: Unflocculated feed with a crossflow rate of 2.4 m/s. B: Flocculated feed with a 0.5 wt% C-581 dose and a crossflow rate of 2.4 m/s.

74
Time (min)
15 35 50
Rej
ecti
on
0.00
0.05
0.10
0.15
0.20
0.25
0.30
0.35
0.40No Polyelectrolyte 1.75 m/s0.5 wt% 1.75 m/s1.0 wt% 1.75 m/s2.0 wt% 1.75 m/s
Figure 14. Rejection of subtilisin over short time intervals throughout the filtration for a crossflow rate of 1.75 m/s and 0, 0.5, 1, and 2 wt% C-581 doses. Error bars represent a 95% confidence interval.

75
Time (min)
15 35 50
Rej
ecti
on
0.00
0.05
0.10
0.15
0.20
0.25
0.30
0.35
0.40No Polyelectrolyte 2.4 m/s0.5 wt% 2.4 m/s1.0 wt% 2.4 m/s2.0 wt% 2.4 m/s
Figure 15. Rejection of subtilisin over short time intervals throughout the filtration for a crossflow rate of 2.4 m/s and 0, 0.5, 1, and 2 wt% C-581 doses. Error bars represent a 95% confidence interval.

76
Chapter III: Clarification of Aqueous Corn Extracts by Tangential Flow Microfiltration
A paper to be submitted to the Journal of Membrane Science
Matthew T. Aspelund1 and Charles E. Glatz1*
Abstract
The effectiveness of tangential flow microfiltration for the solid/liquid clarification of
aqueous corn endosperm and germ extracts was examined using recombinant type I
human collagen (rCollagen) and green fluorescent protein (GFP) as model proteins. We
identified the effects of transmembrane pressure (TMP), crossflow rate, protein molecular
weight, and membrane chemistry on permeate flux, protein rejection, and internal
membrane fouling in microfiltration. In dead-end filtrations, both endosperm and germ
extracts formed highly compressible cakes that provided the dominant hydraulic
resistance. For tangential flow filtration using a ceramic membrane, increasing the
crossflow rate had a significant beneficial effect on the permeate flux for all TMPs
examined. High fouling of the ceramic membrane occurred during the filtration and this
was likely due to the presence of soluble corn starch in the feed. Filtration with a ceramic
membrane resulted in low rejection (<10%) of both the host cell proteins (HCP) and GFP
and very high rejection (~90%) of rCollagen. In contrast to the ceramic membrane,
tangential flow filtration using a poly(vinylidene fluoride) membrane resulted in much
less internal fouling and no measurable rejection of HCP, GFP, or rCollagen.
Microfiltration was an effective method for the solid/liquid clarification of corn protein

77
extracts, except in cases where high internal membrane fouling resulted in increased
rejection of large molecular weight proteins.
Keywords: Tangential flow filtration; Microfiltration; Clarification; Transgenic corn;
Protein rejection; Membrane chemistry; Recombinant collagen
Introduction
Production of high-volume, lower-value recombinant proteins in transgenic corn seed
offers an economic alternative to protein production from cell culture and animal sources.
Plant-based production avoids the risk of contamination from mammalian-associated
infectious agents (i.e. prions, and viruses) and retains considerable capability for post-
translational modifications similar to those occurring in mammalian cell cultures [1].
Plant hosts also have the ability to target the expression of recombinant proteins to
specific tissues or organs, including those which allow for prolonged storage (seeds).
Extraction of only the targeted tissue reduces the extraction volume and impurity level
[1].
Among plant-based recombinant-protein production systems, corn seed offers the
advantages of low water-soluble protein content and well-established methods for genetic
manipulation, transformation, cultivation, and processing by bio-refining into multiple
industrial products. Corn has been explored as an expression host for several
recombinant proteins including dog gastric lipase [2], monoclonal antibodies [3],
vaccines [4], aprotinin [5], and, more recently, collagen-related proteins [6, 7], which

78
have also been expressed in tobacco [8, 9] and barley [10]. Corn seed consists largely of
endosperm (83% dry weight), which is comprised mainly of starch and water-insoluble
proteins, along with germ (11% dry weight), which contains most of the seed’s oil and
water-soluble protein. Combining endosperm-targeted expression with dry-milling to
isolate an endosperm rich fraction provides an extract with the lowest host cell protein
(HCP) burden [1]. While issues of contamination of non-GMO corn with transgenes has
delayed large-scale use of corn for recombinant protein production, methods of risk
reduction that would enable future adoption are being developed [11].
The low cost that is associated with the production of recombinant proteins in plants and
the potential for coupling protein production to current crop-based biorefineries makes
the plant host system ideal for the production of low-value/high-volume proteins (e.g.
protein-based materials, industrial enzymes) [7]. However, the purification process
becomes the major cost, comprising up to 90% of the overall production cost of
recombinant proteins in plants [12]. Thus, development of efficient and inexpensive
methods for the clarification of plant extracts and purification of recombinant proteins
from the host plants is crucial.
A major step that is required in the purification process is the solid/liquid clarification of
the protein extracts. Currently, most of the work regarding the clarification of
recombinant proteins from corn extracts has used centrifugation [2, 5], rotary drum
vacuum filtration (RVDF), or expanded bed chromatography [13, 14] as the solid/liquid
clarification step. Impediments to the alternative of microfiltration include membrane

79
fouling by soluble feed components and the buildup of a compressible layer of rejected
particles on the membrane surface (i.e. cake layer), both of which can decrease permeate
flux and increase protein rejection [15, 16]. However, microfiltration offers the
advantages of low cost operation, the elimination of filter aids [17], the ability to handle
the high solids content (10 - 25% w/w) and large particle size range (sub-micron to
millimeter) associated with corn extracts [18], and relatively mild operating conditions,
which minimize protein denaturation.
Formation of a cake layer often provides the greatest hydraulic resistance to permeate
flux in microfiltration. In tangential flow microfiltration, the formation of the cake layer
is affected by the filtration operating conditions (crossflow rate and TMP) as well as the
feed conditions (particle size, pH, and ionic strength). Several methods exist to reduce the
resistance and formation of the cake layer. Increasing the crossflow rate generally
increases the permeate flux by reducing the mass of the deposited cake layer due to
increased sweeping of the particles from the membrane surface [19-23]. Also, larger feed
particle size can help form a more porous cake layer, thus, increasing the permeate flux
[15, 24, 25]. Reduction of cake layer formation and solute rejection by the cake layer can
also be achieved by operating the filtration below the critical TMP (i.e. in the pressure-
dependent permeate flux regime) [26-28].
In this study, the suitability of tangential flow microfiltration for the solid/liquid
clarification of corn protein extracts from endosperm- and germ-rich dry milling fractions
was examined. We used triple helical type I recombinant human collagen (rCollagen, 265
80
kDa) and green fluorescent protein (GFP, 27 kDa) as model proteins to assess the effect
of protein molecular weight on rejection during microfiltration of corn protein extracts.
The effect of crossflow rate, TMP, and membrane chemistry on the permeate flux,
product transmission, and membrane fouling during tangential flow microfiltration of
corn extracts was examined. In addition, the compressibility of the filter cake that formed
during the filtration of corn extracts was determined in dead-end microfiltration.
Materials and Methods
Materials
All chemicals were reagent grade and purchased from Fisher Scientific (Itasca, IL) unless
noted otherwise. Preparation of rCollagen, expression of GFP in transgenic corn, and
methods for rCollagen spiking, dry milling, protein extraction are described by Aspelund
and Glatz [29].
Corn Defatting
GFP-expressing germ- and endosperm-rich fractions were milled a burr-type coffee mill
(KitchenAid model KPCG100) with 400 grams of fractionated grain in each batch. The
resultant flours had particle sizes ranging from 0.01 mm to >1 mm for both the
endosperm-and germ-rich fraction, as determined by dry sieving. Oil was extracted from
the milled endosperm- and germ-rich fractions as described in Aspelund and Glatz [29].
Solids Settling and Clarification

81
All dead-end and tangential flow filtrations described in this work were performed using
either the suspension that remained after settling or clarified extracts. To prevent
clogging of the filtration modules used in these experiments, a solids settling step was
performed as follows. Subsequent to extraction, the corn slurry was allowed to settle for
30 seconds, from a maximum settling distance of 15 cm, and the supernatant was
decanted to separate the rapidly settling solids from the solids that remained in
suspension. Alternatively, the extracts were clarified by centrifugation at 3000 × g and 4
°C for 15 minutes, followed by filtration through a 0.2 µm syringe filter (Sigma-Aldrich;
St. Louis, MO).
Unstirred Dead-end Filtration
Dead-end filtrations were performed using a 0.2 µm pore size flat-sheet polyethersulfone
(PES) membrane (Koch Membrane Systems, Wilmington, MA ) in a dead-end filtration
cell (Model 8050, Millipore Corp. Billerica MA) with an effective membrane area of 13.4
cm2. Circular (4.45 cm diameter) membranes were cut from a larger sheet. Fifty ml of
endosperm or germ extract was added to the filtration cell, which was then pressurized to
the desired filtration pressure using compressed nitrogen. Dead-end filtrations were
performed at several TMPs between 0.34 and 3.4 bar. Permeate mass was measured using
an electronic balance (Mettler-Toledo PG6002-S, Columbus Ohio). The specific cake
resistance, α, for unstirred dead-end filtrations can be obtained from the slope of a plot of
tA/Vperm versus Vperm/A using the following equation:

82
#3 456 7
8 9 6 (1)
where Vperm is the permeate volume, µ0 is the dynamic viscosity of the permeate, Rm is the
membrane resistance, ∆p is the transmembrane pressure, A is the filtration area, m is the
mass of the cake layer per membrane area, and ρc is the mass of dry filter cake per unit
volume of permeate [30]. For compressible cakes, the specific cake resistance varies with
position in the cake [31]; therefore, equation 1 estimates a specific cake resistance
averaged over the entire thickness of the cake layer. The compressibility index, n, of the
filter cake was calculated using equation 2
&12' (2)
where α0 is the zero-pressure specific cake resistance. A value of zero for n represents an
incompressible cake and an increasing value of n represents increasing cake
compressibility. Flux data were collected during the linear range of the plot of tA/Vperm vs.
Vperm/A, determined experimentally, for both endosperm and germ extracts. Samples of
the feed and final permeate were collected and assayed for HCP, GFP, and rCollagen
concentration. The filter cake was collected and allowed to air dry for 24 hours to
determine the dry cake mass. Each filtration was performed in duplicate.
The protein rejection coefficient was calculated as,

83
1 ; <<=>
(3)
where Cfeed is the concentration of the protein in the feed and Cperm is the concentration of
the protein in the permeate [32, 33].
Tangential Flow Filtration
Tangential flow microfiltration was performed using a Membralox 0.2 µm pore size
tubular (7 mm diameter) ceramic membrane with an effective membrane area of 50 cm2
(Pall Filtration, Port Washington, NY). The crossflow rate and inlet and outlet pressure
on the feed side of the membrane were adjusted using a peristaltic pump (Masterflex,
7518, Cole Parmer, Chicago, IL) and a pinch valve that was located downstream of the
filtration module. Pressure on the feed side was monitored using two pressure gauges
(glycerin filled, 0 – 60 psi, Pall Filtration, East Hills, NY), located upstream and
downstream of the filtration module. Additionally, filtrations of clarified extracts were
performed using both the ceramic filtration module and a lab-scale tangential flow
filtration system (Millipore; Billerica, MA) with a 0.2 µm Durapore poly(vinylidene
fluoride) (PVDF) Pellicon XL membrane cassette that has a membrane surface area of 50
cm2 (Millipore; Billerica, MA). Only clarified extracts were used with the Pellicon
filtration module because the filtration cassettes were clogged by the corn solids. Prior to
filtration, the membranes were conditioned by filtering 500 ml of a 0.1 M sodium
phosphate / 0.15 M sodium chloride buffer at pH 2. Permeate flux was obtained by

84
measurement of the change in the permeate mass over time using an electronic balance
(Mettler-Toledo, PG6002-S, Columbus, OH) interfaced with a computer using
LABVIEW (National Instruments, Austin, TX).
Filtrations were performed in total recycle mode at three crossflow rates (0.5, 0.8, 1.2
m/s) and three TMPs (0.2, 0.8, and 1.6 bar). The uppermost crossflow rate and TMP were
the highest attainable in the filtration module used for this work. Desired combinations of
crossflow rate and TMP were set and operated in total recycle mode for 20 minutes or
until 50 ml of permeate passed through the membrane, upon which time the permeate
flux was measured and 1-ml samples of the recycled feed and permeate were collected
for determination of HCP, GFP and rCollagen concentration. Protein rejection was
calculated using equation 3. Subsequently, the permeate flow was stopped to allow for
the disruption of the deposited cake by the crossflow. The process was repeated for the
next condition in the set of randomly ordered operating conditions. All filtrations were
performed in duplicate.
The ceramic membrane was cleaned using reversed permeate flow with 4 L of 0.5 N
sodium hydroxide and 250 ppm bleach at 55 °C and a TMP of 0.3 bar. The PVDF
membrane was cleaned by washing the membrane for one hour with 250 ppm bleach at
25 °C and a TMP 0.3 bar. The clean-water flux was measured pre and post filtration and
upon completion of membrane cleaning. After membrane cleaning, clean-water flux
recoveries of greater than 90% were achieved for all of the filtrations.
85
Particle Size Distribution
The particle size distribution of the corn solids was measured using a Malvern
Mastersizer 2000 laser diffraction particle size instrument (Malvern Instruments,
Southborough, MA)
Protein and Soluble Starch Determinations
The concentration of rCollagen, total HCP, and GFP were determined using size
exclusion chromatography (SEC-HPLC) and fluorescent spectrophotometry as described
by Aspelund and Glatz [29] using a BioBasic SEC-300 size exclusion column 300 x 7.8
mm and a BioBasic guard column 30 x 7.8 mm (Thermo Scientific) for the SEC-HPLC
assay.
The presence of soluble starch in the clarified filtration fractions was determined by the
addition of 0.3 v/v% iodine. The development of a blue black color indicated the
presence of soluble starch.
Results and Discussion
Filtration Feed Particle Size
Dry milling of the GFP grain resulted in a germ-rich fraction consisting of 38% germ,
22% endosperm, and 40% bran, and an endosperm-rich fraction containing >99%
endosperm [29]. The particles in both the germ- and the endosperm-rich fractions had a
very wide particle size distribution, ranging from smaller than 1 µm to greater than 1000

86
µm (Figure 1). The majority of the particles (~82 % by mass) before extraction were
smaller than 710 µm, with 23% of the endosperm-rich and 19% of the germ-rich fractions
by mass having a particle size less than 250 µm as determined by dry sieving. Removal
of the rapidly settling particles in the extract reduced the solids concentration from 0.1
g/ml extract to 0.051 g/ml extract for the endosperm extracts and to 0.026 g/ml in the
germ extracts. The settling step also resulted in the removal of a large portion of the
particles that had sizes greater than ~500 µm from both the endosperm and the germ
extracts (Figure 1). The volume averaged particle size (D4,3) of the endosperm and germ
extracts were 57 and 53.4 µm, respectively. The majority of the particles in the
endosperm extract after settling were between 10 and 100 µm, in which the germ extract
had considerably more small particles < 10 µm (Figure 1). Both extracts contained
particles that were smaller than 1 µm, thus a small pore size membrane is required to
prevent passage of these small particles. Particles that remained in suspension after the
settling step stayed in suspension over the experimental period for all of the subsequent
filtrations of both the endosperm- and germ-rich extracts.
Protein Extraction
The amounts of HCP and GFP extracted from both the endosperm- and germ-rich
fractions were similar to what was reported previously by Aspelund and Glatz [29].
Further extraction of the endosperm and germ solids after the initial 2 hours added
negligible amounts of protein, indicating that complete extraction of soluble corn proteins
from the endosperm- and the germ-rich fraction was achieved in the first 2 hours.
Extraction from the germ-rich fraction resulted in greater extraction of HCP (18 mg/g
87
solid) and GFP (0.018 mg/g solid) compared to 7 and 0.006 mg/g solid, respectively, for
extraction from the endosperm-rich fraction. The proteins extracted from the germ-rich
fraction had a higher molecular weight range (10 - 80 kDa) compared to the proteins
from endosperm extracts (10 - 45 kDa) [29].
Dead-end Filtration and Cake Compressibility
In dead-end filtrations, the filter cake provided the greatest hydraulic resistance for both
the post-settling endosperm and germ extract suspensions. The resistance of the fouled
membrane after a 90-minute filtration at 1.4 bar was 9.06 × 109 cm-1, compared to
resistances of 6.19 × 1010 cm-1 and 7.43 × 1010 cm-1 for the endosperm and germ filter
cakes, respectively. This indicates that treatments should be made to reduce both the
formation and resistance of the cake layer. The filter cakes that formed during the
filtration of the endosperm extracts were notably stable compared to the loose and fragile
cakes that formed during the filtration of germ extracts.
The average specific cake resistance was higher for germ than for endosperm extracts for
all of the TMPs examined (Figure 2). This is likely due to the presence of a greater
amount of smaller particles (< 10 µm), which tend to form a cake of lower porosity, in
the germ extract suspension after settling (Figure 1). The average specific cake resistance
of both corn tissues increased with rising TMP (Figure 2). Fitting the data in Figure 2 to
equation 2 resulted in compressibility indices of 1.28 for the germ material and 1.05 for
endosperm material, showing the germ to be the more compressible of the two materials.
These compressibility indices correspond to the higher end of the compressibilities

88
reported for microbial and clay suspensions, which typically range from 0.5 to 1.2 [34-
36].
The rejection coefficient of rCollagen was between 0.85 and 0.90 for all of the conditions
studied in dead-end filtration. rCollagen rejection was not affected by either the corn
tissues used for extraction or the TMP. On the other hand, the rejection of HCP and GFP
were found to depend on the tissue from which the proteins were extracted and the TMP
at which the filtration was operated (Figure 3 A and B). The rejection coefficients of HCP
and GFP were similar for the filtration of both the endosperm- and germ-rich extracts.
Despite the high compressibility of the filter cake that formed during the filtration of the
endosperm extract, increasing the filtration TMP resulted in a decrease in the rejection of
HCP and GFP from the endosperm extract (Figure 3 A and B). The decrease in the
rejection at the higher TMP is likely a result of the higher permeate flux increasing the
concentration of the proteins in the concentration polarization layer. Rejection
coefficients of both HCP and GFP were lower for the germ extracts compared to the
endosperm extracts and had no dependence on the filtration TMP (Figure 3 A and B),
indicating that rejection is controlled by the membrane rather than the filter cake.
Tangential Flow Filtration
The effect of the filtration TMP and crossflow rate on the permeate flux of endosperm
and germ extracts using a ceramic membrane is shown in Figures 4 and 5. At the two low
crossflow rates (0.5 and 0.8 m/s), the critical TMP was approximately 0.85 bar as above
0.85 bar, no significant dependence of the permeate flux on the TMP was observed for

89
either the endosperm or the germ extracts (Figures 4 and 5). The observed critical TMP
resulted in permeate flux values of approximately 20 and 25 LMH for the 0.5 and 0.8 m/s
crossflow rates, respectively, for both the endosperm and germ extracts (Figures 4 and 5).
Filtrations at the higher crossflow rate were operated below the critical TMP for both the
endosperm and germ extracts as the permeate flux improved with increasing TMP for all
of the TMP values examined (Figures 4 and 5). However, the non-linear increase in the
permeate flux with TMP at the highest crossflow rate indicates that the high TMP was
close to the critical TMP of the endosperm and germ material.
Increasing the crossflow rate resulted in a rise in the permeate flux for all of the TMPs
studied, suggesting that a significant cake layer formed in all of the tested filtration
conditions. The crossflow rates that were tested in the tubular ceramic membrane channel
correspond to Reynolds numbers of 3640, 5810, and 8540. This indicates that the
filtration flow was in the transition between laminar and turbulent flow at the low
crossflow rate (0.5 m/s), whereas at the higher crossflow rates (0.8 and 1.22 m/s), the
filtration flow was likely turbulent due to the presence of solids and the rough channel
wall [37]. Increasing the crossflow rate at high TMP resulted in a greater increase in the
permeate flux than that observed at low TMP due to enhanced cake layer formation at
high TMP (Figures 4 and 5). Raising the crossflow rate from 0.8 m/s to 1.2 m/s improved
the permeate flux greater than when the crossflow rate was raised from 0.5 to 0.8 m/s for
each of the TMPs examined in endosperm and germ extracts (Figures 4 and 5). This
improvement in the permeate flux at the highest crossflow rate is likely caused by the
higher turbulence in the crossflow sweeping the particles from the cake layer.

90
Under the same filtration conditions, permeate flux of the endosperm extract was similar
to the permeate flux of the germ extract (Figures 4 and 5) despite the endosperm extract
having a solids concentration that is approximately twice that of the germ extract. This
result is consistent with the germ material being more compressible and forming a cake
layer with higher specific resistance than the endosperm material.
Membrane Fouling
Filtration of post-settling endosperm and germ extract suspensions with rCollagen using a
ceramic membrane was followed by measurement of the clean water flux. The resulting
clean water flux was only 8% of the pre-filtration value, indicating that significant
internal membrane fouling occurred. Similar flux reductions were observed with the
ceramic membrane when the extracts did not contain rCollagen and/or were clarified by
high speed centrifugation and filtration with a 0.2 µm cellulose membrane, suggesting
that the membrane fouling was caused by soluble compounds in the corn extract rather
than corn solids or rCollagen. Since HCP and GFP transmission were also unaffected, the
fouling was most likely caused by non-protein components. Under the same conditions,
the clean water flux through the PVDF membrane was up to 70% of the pre-filtration
value, indicating that the PVDF membrane fouled less than the ceramic membrane.
Hence, we tested for the presence of soluble starch in the feed and the permeate for both
membrqanes. Starch transmission was significant through the PVDF membrane but was
negligible through the ceramic membrane, suggesting that the presence of starch in the
corn extracts may be responsible for the internal fouling of the ceramic membrane. Singh

91
and Cheryan reported similar fouling caused by soluble starch components during
microfiltration with a ceramic membrane for clarification of a corn starch hydrolysate and
found that the fouling was reduced by increasing the pH of the feed from 4.2 to 10 [38].
However, due to the low solubility of rCollagen at high pH, filtration at higher pH was
not attempted, but alkaline cleaning was used remove fouling.
Protein Rejection in Tangential flow filtration
Rejection of HCP and GFP was low in the filtration of post-settling endosperm and germ
extract suspensions with a ceramic membrane. To examine the dependence of rejection
on the presence of the solids and the formation of a cake layer, clarified extracts were
prepared by high speed centrifugation coupled with filtration through a 0.2 µm filter.
With clarified extracts, rejection of HCP and GFP by the ceramic membrane was also
low. Average HCP rejection coefficient was ~ 0.10 and GFP rejection coefficient was
~0.12 from both the post-settling and the clarified endosperm and germ extracts. HCP
and GFP rejection was not affected by either the TMP or crossflow rate. Analysis of
permeate samples by SEC-HPLC showed that the rejection of HCP was not dependent on
the molecular weight of the HCP for either the endosperm or germ extracts. The rejection
of the high molecular weight rCollagen was much greater (0.85 < R < 0.95) and was also
independent of crossflow rate and TMP. The lack of dependence of rejection on TMP,
crossflow, and presence of corn solids indicates that rejection is not caused by a cake
layer of solids and is likely controlled by the membrane and its fouling. The combination
of flux reduction and rCollagen rejection may indicate internal fouling that reduces pore
size.

92
In contrast to the ceramic membrane, filtration with the PVDF membrane had much
lower flux reduction and negligible rCollagen rejection. The PVDF membrane also had
negligible rejection of HCP and GFP. These results are consistent with lower internal
fouling of the PVDF membrane.
Conclusions This study is the first to examine the solid/liquid clarification of aqueous corn extracts by
tangential flow microfiltration. Microfiltration of corn protein extracts produces the
formation of a highly compressible cake layer that has the potential to form the
controlling resistance to permeate flux. Our results indicate that microfiltration with a
PVDF membrane was most suitable for the recovery of rCollagen during the solid/liquid
clarification of endosperm and germ extracts as the PVDF membrane had lower internal
membrane fouling and rCollagen rejection when compared to the ceramic membrane.
Permeate flux was greatly improved with increasing crossflow rate during tangential flow
filtration of endosperm and germ extracts with a ceramic membrane. Rejection of HCP,
GFP, and rCollagen was independent of the filtration operating conditions and rejection
by the cake layer was negligible. High rejection of the large molecular weight rCollagen
that was observed during filtration with a ceramic membrane was likely caused by
soluble corn starch fouling the membrane. Filtration at higher pH may reduce the fouling
of the ceramic membrane. Microfiltration was an effective method for the solid/liquid
clarification of corn extracts when a ceramic membrane was used for the recovery of

93
lower molecular weight proteins (< 80 kDa) and a PVDF membrane was used for the
recovery of a larger molecular weight protein.
Acknowledgements
We thank Julio Baez and Sheri Almeda of FibroGen Inc. for several technical discussions
and supplying the recombinant collagen and a protocol for the collagen HPLC assay. J.
Baez also made useful comments on the manuscript. The authors would also like to thank
Ken Wiley from Enpro Inc., Rick Mumley from Pall Filtration for lending the
Membralox ceramic membrane filter holder as well as technical discussions in support of
this study, Paul Scott for development and production of the transgenic corn lines used in
this study, and the Center for Crops Utilization Research at Iowa State University for the
use of the seed processing equipment. Funding for this work was provided by the USDA
CREES Grants #2008-34496-19348 and #2009-34496-19899.
References
1 T. J. Menkhaus, Y. Bai, C. M. Zhang, Z. L. Nikolov and C. E. Glatz,
Considerations for the recovery of recombinant proteins from plants, Biotechnol. Prog., 20(2004) 1001-14.
2 Q. Zhong, Z. Gu and C. E. Glatz, Extraction of recombinant dog gastric lipase from transgenic corn seed, J. Agric. Food Chem., 54(2006) 8086-92.
3 J. Baez, Biopharmaceuticals derived from transgenic plants and animals, in Modern Biopharmaceuticals, J. Knäblein (Eds.). 2005, Wiley-VCH Verlag GmbH & Co. KGaA: Weinhiem, Germany. p. 833-892.
4 R. Chikwamba, J. McMurray, H. X. Shou, B. Frame, S. E. Pegg, P. Scott, H. Mason and K. Wang, Expression of a synthetic E-coli heat-labile enterotoxin B sub-unit (LT-B) in maize, Mol. Breed., 10(2002) 253-265.
5 Q. X. Zhong, L. Xu, C. Zhang and C. E. Glatz, Purification of recombinant aprotinin from transgenic corn germ fraction using ion exchange and hydrophobic interaction chromatography, Appl. Microbiol. Biotechnol., 76(2007) 607-613.

94
6 C. Zhang, J. Baez and C. E. Glatz, Purification and Characterization of a Transgenic Corn Grain-Derived Recombinant Collagen Type I alpha I, Biotechnol. Prog., 25(2009) 1660-1668.
7 C. Zhang, J. Baez and C. E. Glatz, Purification and Characterization of a 44-kDa Recombinant Collagen I alpha 1 Fragment from Corn Grain, J. Agric. Food Chem., 57(2009) 880-887.
8 F. Ruggiero, J. Y. Exposito, P. Bournat, V. Gruber, S. Perret, J. Comte, B. Olagnier, R. Garrone and M. Theisen, Triple helix assembly and processing of human collagen produced in transgenic tobacco plants, FEBS Lett., 469(2000) 132-136.
9 C. Merle, S. Perret, T. Lacour, V. Jonval, S. Hudaverdian, R. Garrone, F. Ruggiero and M. Theisen, Hydroxylated human homotrimeric collagen I in Agrobacterium tumefaciens-mediated transient expression and in transgenic tobacco plant, FEBS Lett., 515(2002) 114-118.
10 K. Eskelin, A. Ritala, T. Suntio, S. Blumer, H. Holkeri, E. H. Wahlstrom, J. Baez, K. Makinen and N. A. Maria, Production of a recombinant full-length collagen type I alpha-1 and of a 45-kDa collagen type I alpha-1 fragment in barley seeds, Plant Biotechnol. J., 7(2009) 657-672.
11 F. Torney, E. Frame and K. Wang, Maize, in Biotechnology in Agriculture and Forestry, E. C. Pua and M. Davey (Eds.). 2007, Springer-Verlag: Berlin. p. 73-105.
12 R. L. Evangelista, A. R. Kusnadi, J. A. Howard and Z. L. Nikolov, Process and economic evaluation of the extraction and purification of recombinant beta-glucuronidase from transgenic corn, Biotechnol. Prog., 14(1998) 607-14.
13 T. J. Menkhaus and C. E. Glatz, Compatibility of column inlet and adsorbent designs for processing of corn endosperm extract by expanded bed adsorption, Biotechnol. Bioeng., 87(2004) 324-36.
14 T. J. Menkhaus and C. E. Glatz, Antibody capture from corn endosperm extracts by packed bed and expanded bed adsorption, Biotechnol. Prog., 21(2005) 473-85.
15 G. Belfort, R. H. Davis and A. L. Zydney, The Behavior of Suspensions and Macromolecular Solutions in Cross-Flow Microfiltration, J. Membr. Sci., 96(1994) 1-58.
16 G. Russotti and K. E. Goklen, Crossflow Membrane Filtration of Fermentation Broth, in Membrane Separations in Biotechnology, W. W. Wang (Eds.). 2001, Marcel Dekker: New York. p. 85-159.
17 N. Singh and M. Cheryan, Process design and economic analysis of a ceramic membrane system for microfiltration of corn starch hydrolysate, J. Food Eng., 38(1998) 57-67.
18 T. J. Menkhaus and C. E. Glatz, Compatibility of column inlet and adsorbent designs for processing of corn endosperm extract by expanded bed adsorption, Biotechnology and Bioengineering, 87(2004) 324-336.
19 R. J. Baker, A. G. Fane, C. J. D. Fell and B. H. Yoo, Factors Affecting Flux in Cross-Flow Filtration, Desalination, 53(1985) 81-93.

95
20 B. Riesmeier, K. H. Kroner and M. R. Kula, Studies on Secondary Layer Formation and Its Characterization during Cross-Flow Filtration of Microbial-Cells, J. Membr. Sci., 34(1987) 245-266.
21 A. Ould-Dris, M. Y. Jaffrin, D. Si-Hassen and Y. Neggaz, Analysis of cake build-up and removal in cross-flow microfiltration of CaCO3 suspensions under varying conditions, J. Membr. Sci., 175(2000) 267-283.
22 K. J. Hwang and H. C. Liu, Cross-flow microfiltration of aggregated submicron particles, J. Membr. Sci., 201(2002) 137-148.
23 K. J. Hwang and Y. H. Cheng, The role of dynamic membrane in cross-flow microfiltration of macromolecules, Sep. Sci. Technol., 38(2003) 779-795.
24 M. T. Aspelund, G. Rozeboom, M. Heng and C. E. Glatz, Improving permeate flux and product transmission in the microfiltration of a bacterial cell suspension by flocculation with cationic polyelectrolytes, J. Membr. Sci., 324(2008) 198-208.
25 Y. Shimizu, K. Matsushita and A. Watanabe, Influence of Shear Breakage of Microbial-Cells on Cross-Flow Microfiltration Flux, J. Ferment. Bioeng., 78(1994) 170-174.
26 R. W. Field, D. Wu, J. A. Howell and B. B. Gupta, Critical Flux Concept for Microfiltration Fouling, J. Membr. Sci., 100(1995) 259-272.
27 A. Persson, A. S. Jonsson and G. Zacchi, Use of microfiltration as first step in recovery of protein A from fermentation broth, Appl. Biochem. Biotechnol., 112(2004) 151-162.
28 J. A. Levesley, M. Seggianni and M. Hoare, Microfiltration of protein precipitate from clarified yeast cell homogenate for the recovery of a soluble product, Sep. Sci. Technol., 35(2000) 633-649.
29 M. T. Aspelund and C. E. Glatz, Purification of Recombinant Plant-Made Proteins from Corn Extracts by Ultrafiltration, J. Membr. Sci., (In Press).
30 R. G. Harrison, P. Todd, S. R. Rudge and D. Petrides, Bioseparations Science and Engineering, ed., Oxford University Press, 2001, New York.
31 W. Leu, Principles of compressible cake filtration, in Encyclopedia of fluid mechanics, N. P. Cheremisinoff (Eds.). 1986, Gulf Pubilishing Co.: Houston. p. 866-903.
32 A. Persson, A. S. Jonsson and G. Zacchi, Transmission of BSA during cross-flow microfiltration: influence of pH and salt concentration, J. Membr. Sci., 223(2003) 11-21.
33 K. J. Hwang and H. C. Hwang, The purification of protein in cross-flow microfiltration of microbe/protein mixtures, Sep. Purif. Technol., 51(2006) 416-423.
34 K. Nakanishi, T. Tadokoro and R. Matsuno, On the Specific Resistance of Cakes of Microorganisms, Chem. Eng. Commun., 62(1987) 187-201.
35 G. Foley, A review of factors affecting filter cake properties in dead-end microfiltration of microbial suspensions, J. Membr. Sci., 274(2006) 38-46.
36 J. Mendret, C. Guigui, R. Schmitz and C. Cabassud, In situ dynamic characterisation of fouling under different pressure conditions during dead-end filtration: Compressibility properties of particle cakes, J. Membr. Sci., 333(2009) 20-29.

96
37 Y. A. Çengel, Heat Transfer: A Practical Approach, ed., WCB McGraw-Hill, 1998, Boston.
38 N. Singh and M. Cheryan, Fouling of a ceramic microfiltration membrane by corn starch hydrolysate, J. Membr. Sci., 135(1997) 195-202.

97
Figures
Figure 1. Particle size distributions of the endosperm- and germ-rich material for both the original extract suspension and the material remaining in suspension after settling.
Particle Size (µµµµm)
0.1 1 10 100 1000
%vo
lum
e
0
2
4
6
8
10Germ Extract Before SettlingGerm Extract After SettlingEndosperm Extract Before SettlingEndosperm Extract After Settling

98
Figure 2. Dependence of the average specific cake resistance of both the endosperm and germ extracts on the transmembrane pressure in dead-end microfiltration.
Transmembrane Pressure (bar)
0 1 2 3 4
Ave
rag
e S
pec
ific
Cak
e R
esis
tan
ce (
cm/g
x 1
012)
0
20
40
60
80
100
Endosperm ExtractsGerm Extracts

99
A
TMP (bar)
0.3 1.4 2.4 3.5
Rej
ecti
on
Co
effi
cien
t
0.0
0.1
0.2
0.3
0.4
0.5
0.6
Endosperm ExtractsGerm Extracts

100
B Figure 3. Rejection coefficients of A) total HCP and B) GFP during the dead-end filtration of both the endosperm- and germ-rich extracts. Rejection coefficients of rCollagen were between 0.85 and 0.90 for all of the filtrations and were not affected by the filtration conditions.
TMP (bar)
0.3 1.4 2.4 3.5
Rej
ecti
on
Co
effi
cien
t
0.0
0.1
0.2
0.3
0.4
0.5
0.6
0.7
Endosperm ExtractGerm Extract

101
Figure 4. The effect of TMP on the permeate flux of the unclarified endosperm-rich extract at several crossflow rates using the ceramic membrane. 95% confidence interval for the permeate flux was ± 1 LMH .
TMP (bar)
0.2 0.4 0.6 0.8 1.0 1.2 1.4 1.6 1.8
Per
mea
te F
lux
(LM
H)
10
20
30
40
50
0.5 m/s 0.8 m/s 1.2 m/s

102
Figure 5. The effect of TMP on the permeate flux of the unclarified germ-rich extract at several crossflow rates using the ceramic membrane. 95% confidence interval for the permeate flux was ± 1 LMH.
TMP (bar)
0.2 0.4 0.6 0.8 1.0 1.2 1.4 1.6 1.8
Per
mea
te F
lux
(LM
H)
15
20
25
30
35
40
45
50
55
0.5 m/s0.8 m/s1.2 m/s

103
Chapter IV: Purification of Recombinant Plant-Made Proteins from Corn Extracts by Ultrafiltration
A paper in press to be published in the Journal of Membrane Science
Matthew T. Aspelund1 and Charles E. Glatz1*
1. Department of Chemical and Biological Engineering, Iowa State University, Ames, IA
50011
Abstract:
The effectiveness of ultrafiltration for the purification of recombinant proteins from
aqueous corn endosperm and germ extracts was examined using model proteins of two
different sizes, recombinant type I human collagen (rCollagen, 265 kDa) and green
fluorescent protein (GFP, 27 kDa), to evaluate the effects of membrane pore size,
transmembrane pressure (TMP), crossflow rate, and filtration pH on permeate flux and
protein sieving. Using a 300 kDa MWCO membrane resulted in a significant loss of
rCollagen, whereas a 100 kDa MWCO membrane completely retained rCollagen.
Increasing the filtration crossflow rate and TMP resulted in a higher permeate flux
without significantly altering the sieving of the host cell proteins (HCP) or GFP. The
greatest HCP sieving was observed in the endosperm extract filtration at low pH and,
compared to endosperm, the filtration of germ extracts had lower HCP sieving. GFP
exhibited similar sieving as the average HCP for all filtration conditions. rCollagen
purity of 89% was achieved with only diafiltration of endosperm extracts and, when
preceded by precipitation, a purity of >99% was attained. Thus, ultrafiltration is a
valuable method to separate and purify corn-hosted recombinant proteins >100 kDa,
particularly when the expression is targeted to the endosperm.

104
Keywords: Tangential flow filtration; Ultrafiltration; Protein purification; Transgenic
corn; Concentration polarization; Protein precipitation; Collagen
Introduction:
The low cost associated with the production of recombinant proteins in corn seed and the
potential for coupling protein production to current crop-based biorefineries makes the
corn host system ideal for the production of low-value and high volume proteins (e.g.
protein-based materials, industrial enzymes) [1]. Purification steps comprise up to 90%
of the overall production cost of recombinant proteins from plants [2]. Therefore, there is
a need to develop efficient and inexpensive methods for the purification of recombinant
proteins from corn seed.
Corn seed consists largely of germ (11% dry weight), which contains most of the seed’s
oil and water-soluble protein, and endosperm (83% dry weight) comprised mainly of
starch and water-insoluble proteins. Combining endosperm-targeted protein expression
with dry-milling to isolate an endosperm-rich fraction has been shown to provide an
extract with the lowest host cell protein (HCP) burden [3]. Several techniques have been
applied for the recovery of recombinant proteins from corn germ and endosperm extracts,
including packed bed chromatography [1, 4], expanded bed chromatography [5, 6], and
aqueous two phase partitioning [7]. Compared to these methods, ultrafiltration offers the
advantages of lower cost, generally nondenaturing operating conditions, and easy
scalability. Additionally, the selectivity of protein fractionation by ultrafiltration has
improved recently due to improvements in the design of both membranes and filtration

105
modules [8] as well as an enhanced understanding of the factors that can affect protein
retention [9].
Ultrafiltration/diafiltration (UF/DF) has been widely used in pharmaceutical processes,
primarily for concentration and buffer exchange. Recent work has focused on the use of
UF/DF for protein purification [10]. The protein retention characteristics of the UF
operation are affected by filtration conditions (crossflow rate and transmembrane
pressure (TMP)), solution conditions (pH and ionic strength), and membrane
characteristics (pore size and membrane charge) [11-14]. Crossflow rate and TMP
control the extent of gel layer formation. The formation of a gel layer can reduce the
permeate flux and the selectivity of a membrane by changing the solute concentration at
the membrane surface [11, 13]. Co-current flow of retentate and permeate enables
operation at constant TMP along the length of the membrane, reducing the effects of the
changes in solute permeation and gel layer formation with changes in TMP [15]. Protein
transmission can be improved by performing the filtration at a pH close to that of the pI
of the proteins, limiting the interactions between the protein and the membrane as long as
precipitation of the proteins in the feed and increased membrane fouling can be avoided
[16, 17].
Protein transmission can be characterized by the instantaneous observed membrane
sieving coefficient of a protein species, i (Si);
@A <C,EF<C,GHIJ
(1)

106
where Ci,permeate is the concentration of species, i, in the permeate, and Ci,bulk is the bulk
concentration of species, i, in the retentate. For constant volume diafiltration a mass
balance on species i is given by:
K <C,GHIJ ;LMA,N.)NON (2)
where V is the volume of the feed, J is the permeate flux, A is the membrane area, and t is
the filtration time. Combining equations 1 and 2 and integrating, with assumption of
constant S gives [18]:
@A ; P ln S<C,F
<C,T (3)
where Ci,t is the concentration of species, i, in the feed at time t, during the filtration, Ci,0
is the concentration of species, i, in the initial filtration feed, and N is the number of
diavolumes used in the filtration given by:
U V (4)
The selectivity (ψ) of the preferably permeated protein i, relative to that of protein j, is
W XCXY
(5)
The fractional purity, pi, of a protein component, i, in any stream is calculated as:
2A Z [C [F4FEI
(6)
where Ctotal is the total protein concentration. The purification factor, PF, is the ratio of
initial and final purities:

107
\]A C,FC,
(7)
In this study, the product-size-dependent suitability of ultrafiltration for the purification
of recombinant proteins from corn germ and endosperm extracts was examined using as
model products, triple-helical type I recombinant human collagen (rCollagen, 265 kDa)
and green fluorescent protein (GFP, 27 kDa). The effects of membrane pore size, TMP,
crossflow rate, and pH on permeate flux and protein sieving were assessed. Additionally,
a purification process utilizing UF/DF was developed for recovery of rCollagen that was
spiked into corn germ and endosperm fractions, as gelatin derived from collagen could be
made as a co-product of corn biorefining.
Materials and Methods:
Materials:
All chemicals used in these experiments were reagent grade and were purchased from
Fisher Scientific (Itasca, IL) unless otherwise noted.
Collagen:
Because available early generation corn-based expression levels have been low [4] and
grain with higher levels of GFP expression was available, for this study yeast-derived
rCollagen was spiked into endosperm and germ extracts of transgenic corn expressing
GFP. The collagen used in the spiking studies was produced by Pichia pastoris
fermentation and consisted of two α1 subunits and one α2 subunit forming a triple-helical

108
collagen molecule with molecular weight of 265 kDa and pI of 9.2, as calculated from the
amino acid sequence. rCollagen was purified to >95% purity by pepsin digestion of
Pichia extracts followed by two acid salt precipitation steps. The rCollagen was provided
in its purified form by FibroGen Inc. (San Francisco, CA) at a concentration of 2.53
mg/ml in 10 mM hydrochloric acid.
GFP Grain:
The preparation of transgenic corn expressing the S65T variant of GFP was described by
Shepherd et al. [19]. This GFP variant has a molecular weight of 27 kDa and a pI of 5, as
calculated from the amino acid sequence. Germ-targeted expression of GFP was obtained
using the maize Glb1 promoter and endosperm-targeted expression was obtained with the
maize 27zn promoter [19]. The grain used for this study was produced in a 2007 field
trial at Iowa State University. After harvest, the seeds were stored at 4±1 °C in sealed and
moisture-proof containers. GFP expression levels determined by extraction at pH 7 were
115 µg GFP/g grain and 42 µg GFP/g grain for the germ- and endosperm-targeted grain,
respectively.
Dry Milling:
Kernels were dry milled into germ- and endosperm-rich fractions. Kernels were first
tempered in a sealed bag for 2.5 hours with deionized water to achieve a moisture content
of 21%, then ground using a laboratory Beal-type drum degermer and a series of
corrugated Witt mills (Witt Corrugating Inc., Wichita, KS) using the method and mill
settings optimized for fractionation of recombinant dog gastric lipase-containing corn

109
[20], and finally separated into fractions by screening. The purity of the fractions was
calculated using the methods reported by Shepherd et al. [21, 22], but with GFP being
assayed after extraction from the solids at pH 7 rather than directly on the solids. The
germ-rich fraction contained 38% germ, 22% endosperm, and 40% bran while the
endosperm-rich fraction was >99% endosperm.
Corn Defatting:
GFP-expressing germ- and endosperm-rich fractions were milled for 1 min in a
household coffee mill (GE model 169028) with 150g of fractionated grain in each batch.
The resultant flours had particle sizes ranging from 0.01 mm to >2 mm for the
endosperm-rich fraction and 0.1 mm to >3 mm for the germ-rich fraction, as determined
by dry sieving. Oil was twice-extracted from both germ- and endosperm-rich fractions
with hexane at a ratio of 1:5 flour:hexane on ice for 1 h. Flour was separated from the
hexane by centrifugation at 3000 × g at 4 °C. After the second extraction, flour was dried
overnight in a fume hood to remove residual hexane.
Protein Extraction:
Proteins were extracted from the defatted flours with continuous stirring on a magnetic
stir plate for 2 hours at 4 °C with a ratio of 1:10 (w/v) flour: buffer. The extraction buffer
consisted of a 0.1 M phosphate buffer, with 0.15 M sodium chloride, and 0.1 mg/ml of
rCollagen. Collagen inclusion in the extraction buffer allowed simulation of any
partitioning that might occur between the solids. The rCollagen spiking level was in the
range that could be expected for established transgenic lines (1 g of rCollagen/kg dry

110
grain) and sufficient to accurately assay throughout the experiment. Extracts were
clarified by centrifugation at 3000 × g and 4 °C for 15 minutes, followed by filtration
through a 0.2 µm syringe filter (Sigma-Aldrich; St. Louis, MO). Extract pH was adjusted
to the desired pH for UF/DF by adding 5 M sodium hydroxide slowly with mixing.
Collagen Precipitation:
One volume of 5 M sodium chloride was added to four volumes of clarified extract (final
salt concentration of 1.12 M and pH 2.1). The solution was mixed on a magnetic stir plate
for 2 hours at 4 °C before separation of precipitated proteins by centrifugation (30 minute
at 14,600 × g and 4 °C). The precipitate was dissolved in the same volume of rCollagen-
free extraction buffer as the original corn extract. Samples of the corn extract,
supernatant, and dissolved precipitate were assayed for collagen, GFP, and total protein
concentration.
Ultrafiltration/Diafiltration:
UF/DF was performed using a Millipore lab-scale, tangential-flow filtration system
(Millipore; Billerica, MA) and Pellicon XL membrane cassettes. The membranes were
100 kDa (PXB100C50) and 300 kDa (PXB300C50) molecular weight cut-off (MWCO)
flat sheet polyethersulfone (PES) membrane cassettes with a total membrane surface area
of 50 cm2 (Millipore; Billerica, MA). UF/DF was operated in a co-current flow
configuration with a carrier fluid on the permeate side of the membrane. Inlet and outlet
pressure on the permeate side of the membrane was adjusted by the permeate pump
(Masterflex, 7518, Cole Parmer, Chicago, IL) speed and a needle valve that was located

111
downstream of the permeate outlet in order to maintain a constant TMP along the length
of the membrane. Pressure on the permeate side was monitored using two glycerin filled
pressure gauges with a 0 – 60 psi range (Pall filtration, East Hills, NY), located upstream
and downstream of the filtration module. The permeate loop was initially filled with 100
ml of rCollagen-free extraction buffer that was adjusted to the filtration pH.
Diafiltrations were kept at constant volume with the continuous addition of a 0.1 M
phosphate/0.15 M sodium chloride buffer, which was adjusted to the pH of the feed.
Samples of feed and permeate were collected at each half diavolume or each fold
concentration factor and were analyzed for collagen and total protein concentration.
Permeate flux was calculated from the change in the permeate mass over time with an
electronic balance (Mettler-Toledo, PG6002-S, Columbus, OH) and recorded to a
computer using LABVIEW (National Instruments, Austin, TX).
Membranes were cleaned by flushing for 30 minutes with 0.5 N sodium hydroxide at 45
°C, followed by recycling 0.2 % Terg-a-Zyme (Alconox, White Plains, NY) at 45 °C for
one hour and by a final rinse with 500 ml of 0.5 N sodium hydroxide at 45 °C. The clean
water flux was measured before and after the filtration and after the membrane cleaning.
Experimental Design and Statistical Analysis:
UF experiments were designed as a single replicate of a randomized, full factorial design
combining 4 treatment variables at 2 levels each (see Table 1). Crossflow rates were
selected to represent the upper and lower limits of the desired operating conditions

112
suggested by Millipore for the Pellicon XL cassettes [23]. The 4th order interaction was
taken as the measure of variability in the ANOVA. The Bonferroni correction was used
to adjust the required p-value for significance for measurement of multiple outcomes
[24]. Statistical analysis was performed using the statistical software package JMP (SAS,
Cary, NC) to determine the effect of the treatments on the permeate flux, and sieving of
rCollagen, HCP, and GFP.
Protein Determinations:
The concentration of rCollagen was determined using a denaturing size exclusion
chromatography HPLC assay with 2 M guanidine HCl as the mobile phase. Samples were
prepared by equivolume dilution with 4 M guanidine HCl. For HPLC, a BioSilect size
exclusion column 300 mm x 7.8 mm (Bio-Rad, Cat. #1250477) and a BioSilect guard
column 50 mm x 7.8 mm (BioRad, Cat. #1250480) was used at a flow rate of 1 ml/min
on an Agilent 1200 series HPLC (Agilent Technologies Inc., Santa Clara, CA). The
protein elution was monitored at 220 and 280 nm. Collagen’s negligible aromatic amino
acid content results in no significant absorbance at 280 nm but absorbance is observed at
220 nm due to the peptide bonds. Thus, a peak with very low A280/A220 indicates
collagen.
Injections of samples of known rCollagen concentration between 0.01 and 1 mg/ml
established the correlation between the A220 peak area and collagen concentration.
Injection of a known concentration (between 0 and 2.5 mg/ml) of corn extract proteins
(determined by BCA assay using BSA as the standard; Pierce Biotechnology, Rockford,

113
IL) provided the corresponding correlation of the A220 area and the concentration for
HCP. The peaks integrated for HCP concentration included the co-eluting GFP, which
was separately assayed so that its concentration could be deducted to calculate the HCP
concentration. The standard curves for both rCollagen and corn proteins always showed a
high linear correlation with an R2 > 0.99 for concentration ranges of both proteins.
The concentration of GFP in each sample was determined by fluorescence (Versafluor
spectrofluorometer; BioRad, Hercules, CA) with an excitation wavelength of 390 nm and
an emission wavelength of 520 nm. A standard curve was prepared using recombinant
GFP of identical adsorption and emission spectra as the S65T GFP variant expressed in
the transgenic corn (Clontech, Cat. #632373; Mountain View, CA). Because GFP
fluorescence can depend on the solution pH, a standard curve was generated for each pH
values used for filtration (i.e. 2.1, 3.1, and 3.5). The fluorescence yield was 0.2% greater
at pH 3.5 than at pH 2.1. The GFP standard curves were linear (R2 > 0.97) over the
concentration range 0 - 2 µg/ml.
SDS – PAGE:
Samples were characterized by one dimensional SDS-PAGE using a Mini – PROTEAN
II electrophoresis cell and precast 4 – 20 % Tris-HCl gels from Bio-Rad (Bio-Rad;
Hercules, CA). Samples were mixed with loading buffer and heated to 100 °C for 30
seconds. Loss of the rCollagen bands occurred when heating the samples at pH 2-3.5 for
longer than 30 seconds. Samples were loaded using the same loading volume (20 µL) in
each well and gels were stained using Coomassie stain (G-250, Pierce Biotechnology,

114
Rockford, IL) or silver stain (Silver Stain Plus; Bio-Rad, Hercules, CA). Coomassie-
stained gels were analyzed by densitometry using ImageJ (NIH, Bethesda, MD).
Results and Discussion:
Protein Extraction:
Similar to previous studies [1, 25], HCP showed a lower solubility in low pH extractions.
Low pH preferentially extracts the acid-soluble collagen [26] over corn HCP (esp. germ
fraction) and GFP, which have higher solubility at neutral pH. Extractions performed at
pH 7 resulted in HCP concentrations of 8 and 44 mg/g grain from endosperm and germ,
respectively. At pH 2, extractions of endosperm and germ resulted in HCP concentrations
of 7 and 18 mg/g grain, respectively. GFP likewise showed better extraction at neutral pH
for both the germ and endosperm tissues. At pH 7, the GFP concentration was 0.043
mg/g grain from the endosperm and 0.115 mg/g from the germ, while extractions at pH 2
resulted in GFP concentrations of 0.006 and 0.018 mg/ g grain, respectively. The quantity
of GFP extracted at pH 2 from both tissues was sufficient to accurately assay throughout
the experiments. Higher molecular weight HCP were extracted better at higher pH for
both germ- and endosperm-rich extracts (Figure 1). The acid-soluble corn proteins had a
molecular weight range from 10 to 45 kDa for the endosperm extracts and between 10
and 80 kDa for the germ extracts (Figure 1: lanes A and C). Additionally, previous work
has shown that acid-soluble germ HCP have pI values that range between 3 and 10 with a
significant number of proteins with pI’s between 3 and 5 [27]. The higher molecular
weight proteins would be harder to separate from collagen using UF, a situation

115
exacerbated if any of these bands are multimeric subunits. Therefore, all UF/DF
experiments were performed using pH 2 extractions from both germ- and endosperm-rich
fractions.
Inclusion of 0.1 mg/ml of rCollagen with the pH 2 extractions resulted in clarified
extracts with an initial rCollagen purities of ca. 17 % and 7 % in the endosperm and germ
extracts, respectively. GFP comprises only 0.12% of the total protein extracted from both
the germ and endosperm at pH 2 and was evidenced in the band appearing at 27 kDa in
the SDS-PAGE gel (Figure 1: lanes A and C). Based on densitometry, however, only 1%
of this band was GFP in the endosperm extract and 1.8% in the germ extract with the
remainder being corn proteins of similar molecular weight. Adjusting the pH of the
proteins that were extracted at pH 2 resulted in some protein aggregation at a pH of
approximately 3.6 for the germ extracts and approximately 3.2 for the endosperm
extracts. Thus, a filtration pH of 3.1 for endosperm extracts and 3.5 for germ extracts
were used as the upper limit of pH adjustment for the all subsequent experiments.
Diafiltration - Screening of pore size and critical TMP:
Initial experiments were performed to determine the conditions that are necessary for
operation of diafiltrations above and below the critical TMP and to screen membranes of
different pore sizes for the retention of rCollagen and transmission of HCP.
Critical TMP:

116
Whether operation of the filtration was above or below the critical TMP was determined
by observing the pressure dependence of the permeate flux during diafiltration for each
filtration. The pressure on the feed side of the membrane was adjusted throughout the
filtration to maintain a consistent TMP either above or below the critical TMP. Figure 2
shows a typical permeate flux curve for a filtration operated below the critical TMP. At
an average TMP of about 0.5 bar, the permeate flux curve showed significant dependence
on the TMP fluctuations, and permeate flux did not exhibit the initial period of rapid flux
decline commonly associated with the formation of a gel layer (Figure 2). On the other
hand, at an average TMP of 1.1 bar, a period of rapid flux decline was observed during
the first 10 minutes of the filtration and permeate flux was independent of the TMP
fluctuations, indicating gel layer formation (Figure 3). These results of filtrations under
conditions that were expected to yield the lowest and the highest critical TMP established
that filtrations operated at a TMP of 0.5 bar were below and 1.1 bar were above the
critical TMP.
Membrane Pore Size:
Two membranes, with MWCO of 300 and 100 kDa, were initially screened for their
effect on the retention of rCollagen in an endosperm extract. Significant sieving of
rCollagen occurred during diafiltration with the 300 kDa membrane, whereas, the 100
kDa membrane provided complete retention of rCollagen over three diavolumes (Table
2). The complete retention of rCollagen observed with the 100 kDa MWCO membrane
showed that the filtration can be performed for many diavolumes with no decrease in the
rCollagen yield.

117
The sieving coefficients of HCP and GFP were approximately equivalent for both
membrane pore sizes, resulting in similar collagen purities and purification factors (Table
2). Although the 300 kDa membrane had a greater permeate flux, the improved retention
of rCollagen in the 100 kDa membrane provided higher collagen yield without loss of
purity as relatively minor differences were observed between the sieving coefficients of
HCP for the two MWCO membranes. Hence, the 100 kDa MWCO membrane was used
in the remainder of the experiments.
Factorial Design Experiments:
Experiments were performed to determine the effect of the filtration conditions on the
retention of rCollagen and the permeation of GFP and the HCP. The operational variables
described in Table 1 were combined in a full factorial design and examined for their
effect on permeate flux and sieving of HCP and GFP.
Permeate Flux:
The permeate flux had significant dependence on the crossflow rate, TMP, and their
interaction. No significant dependence of the permeate flux on the tissue from which the
HCP were extracted was found (Table 3). Additionally, significant 2nd order interaction
effects between the filtration pH, the crossflow rate, and TMP on permeate flux were
found, although no first order dependence of the permeate flux on filtration pH was
observed (Table 3).

118
Increasing both the TMP and the crossflow rate increased the permeate flux with the
greatest flux improvement occurring above the critical TMP (Table 4 and Figure 4). The
interaction between the crossflow rate and TMP (Table 3) indicated that the highest
permeate flux was achieved above the critical TMP at high crossflow rate (Table 4). This
improvement in the permeate flux was caused by the greater TMP increasing the driving
force for fluid flow across the membrane and the larger shear on the feed side of the
membrane reducing the thickness of the gel layer.
The permeate flux was greatest above the critical TMP and at the lower pH. Operating
the filtration at the higher pH resulted in a slight decrease in the permeate flux at the low
crossflow rate. However, at the high crossflow rate, this effect of high pH on permeate
flux was not observed. Such effect of pH on permeate flux cannot be attributed to
changes in the feed protein concentration because extractions were all performed under
the same conditions and subsequently adjusted to the filtration pH. The results indicate
that operating the filtration at a pH close to the pI results in aggregation of some of the
HCP worsening the fouling/gel layer flux resistance.
Protein Sieving:
Operating the filtration below or above the critical TMP did not significantly alter the
retention of rCollagen, which was completely retained in all conditions with the 100 kDa
MWCO membrane (Table 2). Previous studies found that filtrations above critical TMP
increase the sieving of partially retained proteins as a result of the greater concentration
of the proteins accumulating at the membrane surface [16]. However, in our study,

119
increase in the TMP did not result in a significant change in the sieving of the HCP or
GFP (Table 3). Since rCollagen, HCP, and GFP sieving did not depend on TMP, our
study suggests that the optimal TMP value would be close to the critical TMP, where a
high permeate flux can be achieved with the lowest pressure and pumping requirements.
In contrast to its effect on flux, the crossflow rate did not have a significant effect on the
sieving of either the HCP or GFP (Tables 3). Decrease in the gel layer associated with the
increased crossflow rate may result in a diminished sieving of proteins through the
membrane by lowering the protein concentration at the membrane surface. However, no
effect of either the TMP or crossflow rate on the sieving of the HCP and GFP was noted,
indicating that the presence of the gel layer does not have a strong effect on the protein
sieving over the range of operating conditions examined.
The sieving of the endosperm HCP was significantly higher than that of the germ HCP
(Table 3). The average corn protein sieving was 0.64 (±0.05, 95% CI) from the germ
extracts and 0.77 (±0.05) from the endosperm extracts (Table 4). Densitometry showed
that the sieving coefficient of the proteins ≤ 25 kDa in the germ extract was similar to
that in the endosperm extract. Therefore, the reduction in HCP sieving from germ
extracts compared to the endosperm extracts is due to the significantly greater
concentration of large molecular weight proteins (≥ 25 kDa) in the germ extract (Figure
1, lane C) compared to the endosperm extract (Figure 1, lane A).
While the filtration pH alone showed no significant effect on HCP sieving, a significant
interaction between the filtration pH and the extracted corn tissue was observed (Table

120
3). At the low pH, the endosperm had a significantly greater sieving coefficient than the
germ extract. At the higher pH, the germ HCP sieving coefficient increased to the level of
the endosperm. This effect of pH was not observed for the endosperm extracts, which had
similar HCP sieving coefficients for both the low and higher pH filtrations.
Sieving coefficients GFP and HCP were similar for all filtration conditions (Table 4).
Thus, we propose GFP to be good representative model protein for sieving of acid-
soluble corn proteins. The similar sieving of GFP and HCP also indicates that separation
of low molecular weight proteins (>25 kDa) from corn extracts by ultrafiltration is not
feasible under the conditions in this study. However, use of a lower MWCO membrane
(i.e. 30 or 50 kDa) may allow for better selectivity of GFP or other recombinant proteins
of similar size.
The greatest impact of the examined filtration conditions was seen on the permeate flux,
which showed significant dependence on the crossflow rate, TMP and 2nd order
interactions between the crossflow rate, TMP, and filtration pH. The greatest permeate
flux was achieved during filtration at the 0.28 m/s crossflow rate above the critical TMP.
The highest HCP sieving coefficient was observed during the filtration of endosperm
extracts at low filtration pH. The desired operating conditions require high permeate flux
and HCP sieving, which entails a short processing time. Therefore, the experiments
performed to determine the extent of rCollagen purification that is attainable by UF/DF
were conducted using endosperm extractions at low filtration pH and high crossflow rate
and TMP.

121
Purification of rCollagen:
Diafiltration:
Diafiltration resulted in the removal of 96% of the HCP from the retentate of endosperm
extracts and 91.3% from the germ extract. This resulted in an average final purity of
rCollagen in the retentate of 84.3% in the endosperm extracts and 38.1% in the germ
extracts after only three diavolumes. The greater initial purity of the endosperm extracts
results in higher final rCollagen purity for the same purification factor (Table 4). The
rCollagen yield for all filtrations was >95%. The yield of GFP in the permeate was
comparably high for both endosperm (92.7%) and germ extracts (82.2%). Targeted
expression of recombinant proteins to the endosperm would be the most advantageous for
the purification of recombinant proteins because UF/DF of the endosperm extracts had
lower initial concentration of HCP and greater permeate flux, HCP sieving coefficients,
and rCollagen final purity as compared to the purification from germ extracts.
In an effort to increase the final purity of rCollagen, diafiltration was performed up to
eight diavolumes. The average permeate flux of 84.4 LMH over the eight diavolumes
was similar to that obtained in the factorial experiment under similar conditions (Table
4). Major improvement in rCollagen purity (from 17% to 75%) was achieved during the
first three diavolumes and similar results were obtained in the factorial experiment (17%-
83%). However, we observed only a small improvement in the rCollagen purity from
75% to 89% over the last five diavolumes as a result of reduced HCP sieving in the latter

122
part of the filtration. The HCP sieving coefficient was 0.65 for the first three diavolumes
and dropped to approximately 0.2 after the fourth diavolume (Figure 5). Under similar
conditions of the factorial experiment, HCP sieving coefficient was 0.77 for three
diavolumes (Table 4). At these later stages (>3 diavolumes), HCP sieving is largely
governed by the larger molecular weight HCP, since the smaller HCP are, for the most
part removed, in the early stages. Such selective removal of smaller proteins was
confirmed by densitometric analysis of the Coomassie stained SDS-PAGE gels (Figure
6). After eight diavolumes, bands >20 kDa were reduced by only 40 % in the retentate,
whereas, bands <20 kDa were reduced by as much as 80 % in the retentate and were
present in the permeate. This demonstrates that the application of UF to the purification
of proteins larger than 100 kDa from corn extracts can result in high purities of the large
molecular weight protein. Extending the application of UF to lower molecular weight
proteins will likely yield significant purification of proteins between 20 and 100 kDa,
particularly if a lower MWCO membrane is used.
Collagen Concentration by Ultrafiltration:
Complete retention of rCollagen over a 10X concentration of the initial feed was
observed in a filtration operated in concentration mode. The average permeate flux and
HCP sieving coefficient (equation 1) were 64.7 LMH and 0.55, respectively. However,
co-precipitation of rCollagen and corn proteins occurred once the feed was concentrated
to approximately 6X, at which point, the total protein concentration was 2.8 mg/ml. This
limits the greatest achievable concentration factor to approximately 5X. Diafiltration
with three diavolumes following 10X concentration produced a final purity of 44.4%. An

123
initial diafiltration before concentration could avoid the precipitation limitation by
reducing the initial HCP concentration and this could lead to purity higher than that
achieved with diafiltration alone. However, the larger diavolumes required for non-
concentrated feed will increase the processing time; therefore, this alternative was not
attempted.
Collagen Precipitation and Diafiltration:
Diafiltration of a resuspended rCollagen precipitate from an endosperm extract resulted
in >99% purity of rCollagen based on HPLC, BCA, and densitometry of Coomassie
stained SDS-PAGE gels (gel not shown) and an 87% yield after just three diavolumes
(Table 5). After precipitation, 97% of the total HCP remained in the supernatant and the
majority of these proteins were >10 kDa (Table 5 and Figure 7: lanes B-D). The
resuspended pellet had a rCollagen purity of 85%. During diafiltration, the average
permeate flux was 1 37.5 LMH and the average corn protein sieving coefficient for the
first three diavolumes was 0.62, which was consistent with the sieving coefficient for the
low molecular weight HCP. After three diavolumes, the recycled feed contained no
detectable amount of HCP when assayed by HPLC, BCA, and Coomassie stained SDS-
PAGE (gel not shown). Similarly, GFP was completely removed after the precipitation
step. The high permeate flux (137.5 LMH) during diafiltration of the precipitated feed
most likely resulted from the low protein concentration of the feed and flux could
decrease if the feed were concentrated by resuspending the precipitate in a smaller
volume than used in this study.

124
Silver staining was used to reveal the remaining impurities and showed the most
prominent band in the retentate at about 10 kDa (Figure 7). The low molecular weight
HCP contaminant may be removed by further purification steps. Overall, our results
demonstrate that high rCollagen purity can be achieved using salt precipitation followed
by diafiltration.
Conclusions:
The 100kDa MWCO membrane was most suitable for purification of rCollagen from
corn extracts. Permeate flux was greatly improved when high crossflow rates (0.25 m/s)
and a higher TMP were employed. The low filtration pH (2.1) resulted in the greatest
sieving of HCP from endosperm extracts. The sieving of GFP and HCP were similar for
each of the filtration conditions examined indicating that ultrafiltration is suitable only for
the purification of proteins rejected by the 100 kDa MWCO membrane under the
filtration conditions studied. Use of a lower MWCO membrane would likely give
improved selectivity for GFP. Initial DF may be a necessary step before concentration of
rCollagen by UF from an endosperm extract, because precipitation occurs with direct six-
fold concentration. Diafiltration alone resulted in rCollagen purities of as high as 89%
and an even greater purity of >99% was achievable when an initial precipitation of
collagen from the endosperm extract was introduced. Taken together, our results show
UF/DF can be an effective purification strategy when coupled with targeted expression of
a large, acid-soluble recombinant protein, such as rCollagen, to corn endosperm.

125
Acknowledgements:
We thank FibroGen Inc. for supplying the recombinant rCollagen used in this study with
special thanks to Julio Baez and Sheri Almeda for providing the collagen HPLC assay
and for technical discussions throughout this work, Ryan Nielsen for help conducting
experiments, Chris Setina for advice on the selection of precipitation conditions for the
recovery of collagen from corn extracts, Paul Scott for development and production of
the transgenic corn lines used in this study, and the Center for Crops Utilization Research
at Iowa State University for the use of the seed processing equipment. Funding for this
work was provided by the USDA CREES Grants #2006-34496-17122 and #2008-34496-
19348.
References: 1 C. Zhang, J. Baez and C. E. Glatz, purification and characterization of a 44-kDa
recombinant collagen I alpha 1 fragment from corn grain, J. Agric. Food Chem., 57(2009) 880-887.
2 R. L. Evangelista, A. R. Kusnadi, J. A. Howard and Z. L. Nikolov, Process and economic evaluation of the extraction and purification of recombinant beta-glucuronidase from transgenic corn, Biotechnol. Prog., 14(1998) 607-14.
3 T. J. Menkhaus, Y. Bai, C. M. Zhang, Z. L. Nikolov and C. E. Glatz, Considerations for the recovery of recombinant proteins from plants, Biotechnol. Prog., 20(2004) 1001-14.
4 C. Zhang, J. Baez and C. E. Glatz, purification and characterization of a transgenic corn grain-derived recombinant collagen type I alpha I, Biotechnol. Prog., 25(2009) 1660-1668.
5 T. J. Menkhaus and C. E. Glatz, Antibody capture from corn endosperm extracts by packed bed and expanded bed adsorption, Biotechnol. Prog., 21(2005) 473-85.
6 T. J. Menkhaus and C. E. Glatz, Compatibility of column inlet and adsorbent designs for processing of corn endosperm extract by expanded bed adsorption, Biotechnol. Bioeng., 87(2004) 324-36.
7 Z. Gu and C. E. Glatz, Aqueous two-phase extraction for protein recovery from corn extracts, J. Chromatogr. B: Analyt. Technol. Biomed. Life Sci., 845(2007) 38-50.

126
8 G. Gehlert, S. Luque and G. Belfort, Comparison of ultra- and microfiltration in the presence and absence of secondary flow with polysaccharides, proteins, and yeast suspensions, Biotechnol. Prog., 14(1998) 931-42.
9 A. Saxena, B. P. Tripathi, M. Kumar and V. K. Shahi, Membrane-based techniques for the separation and purification of proteins: an overview, Adv. Colloid Interf. Sci., 145(2009) 1-22.
10 R. van Reis and A. Zydney, Bioprocess membrane technology, J. Membr. Sci., 297(2007) 16-50.
11 R. van Reis, S. Gadam, L. N. Frautschy, S. Orlando, E. M. Goodrich, S. Saksena, R. Kuriyel, C. M. Simpson, S. Pearl and A. L. Zydney, High performance tangential flow filtration, Biotechnol. Bioeng., 56(1997) 71-82.
12 R. van Reis, J. M. Brake, J. Charkoudian, D. B. Burns and A. L. Zydney, High-performance tangential flow filtration using charged membranes, J. Membr. Sci., 159(1999) 133-142.
13 S. Saksena and A. L. Zydney, effect of solution pH and ionic-strength on the separation of Albumin from immunoglobulins (IGG) by selective filtration Biotechnol. Bioeng., 43(1994) 960-968.
14 R. Vaneijndhoven, S. Saksena and A. L. Zydney, protein fractionation using electrostatic interactions in memberane filtration, 7th International Conference on Recovery of Biological Products, San Diego, Ca, 1994.
15 R. vanReis, S. Gadam, L. N. Frautschy, S. Orlando, E. M. Goodrich, S. Saksena, R. Kuriyel, C. M. Simpson, S. Pearl and A. L. Zydney, High performance tangential flow filtration, Biotechnol. and Bioeng., 56(1997) 71-82.
16 G. L. Baruah, A. Nayak, E. Winkelman and G. Belfort, Purification of monoclonal antibodies derived from transgenic goat milk by ultrafiltration, Biotechnol. Bioeng., 93(2006) 747-754.
17 R. Ibanez, A. Guadix, E. Guadix and M. Almecija, Effect of pH on the fractionation of whey proteins with a ceramic ultrafiltration membrane, J. Membr. Sci., 288(2007) 28-35.
18 R. vanReis and S. Saksena, Optimization diagram for membrane separations, J. Membr. Sci., 129(1997) 19-29.
19 C. T. Shepherd, N. Vignaux, J. M. Peterson, L. A. Johnson and M. P. Scott, Green fluorescent protein as a tissue marker in transgenic maize seed, Cereal Chem., 85(2008) 188-195.
20 N. Vignaux, D. Octaviani and L. Johnson, Efficiencies of different types of dry mills in recovering a fraction rich in recombinant protein expressed in endosperm, Annu. Meet. Am. Assoc. Cereal Chem. Tortilla Ind. Assoc., St. Paul, MN, 2004.
21 C. T. Shepherd, N. Vignaux, J. M. Peterson, M. P. Scott and L. A. Johnson, Dry-milling and fractionation of transgenic maize seed tissues with green fluorescent protein as a tissue marker, Cereal Chem., 85(2008) 196-201.
22 C. T. Shepherd, N. Vignaux, J. M. Peterson, M. P. Scott and L. A. Johnson, Dry-milling and fractionation of transgenic maize seed tissues with green fluorescent protein as a tissue marker (vol 85, pg 196, 2008), Cereal Chem., 85(2008) 711.
23 Millipore, Pellicon XL Device Operating Instructions, ed. Series Ed. 2001.

127
24 G. W. Cobb, Introduction to design and analysis of experiments, ed. Series Ed. Springer-Verlag 1998, New York.
25 Q. Zhong, Z. Gu and C. E. Glatz, Extraction of recombinant dog gastric lipase from transgenic corn seed, J. Agric. Food Chem., 54(2006) 8086-92.
26 D. I. Zeugolis, B. Li, R. R. Lareu, C. K. Chan and M. Raghunath, Collagen solubility testing, a quality assurance step for reproducible electro-spun nano-fibre fabrication. A technical note, J. Biomater. Sci. Polym. Ed., 19(2008) 1307-1317.
27 Z. R. Gu and C. E. Glatz, A method for three-dimensional protein characterization and its application to a complex plant (corn) extract, Biotechnol. Bioeng., 97(2007) 1158-1169.

128
Tables: Table 1. Treatments and levels explored for the full factorial diafiltration experiments.
Levels
Treatment 1 2
Corn Tissue Endosperm Germ
Transmembrane Pressure (bar)
0.5 (±0.1) 1.1 (±0.1)
Crossflow Rate (m/s)
0.12 0.28
pH 2.1 3.1 and
3.5

129
Table 2. Diafiltration performance for endosperm extracts. Conditions: crossflow velocity 0.12 m/s, TMP 0.45 bar, and a pH of 2.1. Values are averages of 2 runs over three diavolumes.
Membrane Pore Size (MWCO)
Permeate Flux
(LMH)
rCollagen Sieving Coeff.
HCP Sieving Coeff.
GFP Sieving Coeff.
rCollagen Yield (%)a
Final rCollagen
Purity (%)a
rCollagen Purification
factora
100 27.7 0 0.80 0.70 95.0 88 5.3
300 50.9 0.31 0.77 0.71 61.7 76 4.2 a Retentate values.

130
Table 3. ANOVA Results for factors affecting the diafiltration of corn extracts with 100 kD MWCO membrane.
Source p-value Permeate Flux
p-value HCP sieving
Coeff.
p-value GFP sieving Coeff.
TMP <0.0001a 0.16 0.22 Crossflow rate <0.0001a 0.74 0.25
pH 0.39 0.34 0.08 Tissue 0.03 0.018b 0.036
TMP*Crossflow rate <0.0001a 0.89 0.59 TMP*pH 0.011a 0.51 0.53
TMP*Tissue 0.091 0.79 0.86 Crossflow rate*Tissue 0.114 0.73 0.17
Crossflow rate*pH 0.003a 0.55 0.86 Tissue*pH 0.17 0.016a 0.065
Crossflow rate*pH*TMPc 0.018 0.59 0.72 a Statistically significant treatments using the Bonferroni correction for multiple comparisons (α = 0.05/the number of responses = 0.017) b Included as significant treatment because of proximity to the Bonferroni p-value c Other 3rd order interactions not reported as they showed no significant effect on any of the responses.

131
Table 4. Summary of results for the factorial experiment.
Corn Tissue
Crossflow rate (m/s)
Average TMP (bar)
pH Average Permeate
Flux (LMH)
Average HCP
Sieving Coeff.
Average GFP Sieving
Coeff.
Yield (%)
Final Purity
(%)
Purification Factor
Endosperm 0.12 0.5 2.1 27.7 0.90 0.82 94 87.9 5.31 Endosperm 0.12 1.1 2.1 49.1 0.74 0.68 82 87.8 5.10 Endosperm 0.28 1.2 2.1 71.2 0.77 0.69 91 85.6 4.44 Endosperm 0.28 0.5 2.1 37.0 0.90 0.82 107 89.8 4.83 Endosperm 0.12 0.5 3.1 28.5 0.70 0.62 105 72.4 3.96 Endosperm 0.28 1.3 3.1 78.2 0.69 0.68 100 86.3 5.77 Endosperm 0.12 1.1 3.1 37.1 0.77 0.72 91 85.3 4.78 Endosperm 0.28 0.5 3.1 46.0 0.75 0.67 94 81.5 4.61 Germ 0.12 0.5 2.1 23.3 0.62 0.64 100 42.0 4.21 Germ 0.12 1.3 2.1 52.7 0.58 0.60 93 45.9 4.18 Germ 0.28 1.3 2.1 70.4 0.51 0.53 101 26.8 3.67 Germ 0.28 0.6 2.1 34.9 0.52 0.64 104 27.1 3.64 Germ 0.12 0.5 3.5 24.7 0.76 0.61 99 40.8 6.15 Germ 0.12 1.1 3.5 37.0 0.67 0.61 97 50.3 7.02 Germ 0.28 1.3 3.5 71.5 0.72 0.62 94 32.0 5.05 Germ 0.28 0.5 3.5 36.5 0.78 0.54 93 39.6 5.94

132
Table 5. Purification of rCollagen from corn endosperm extract by acid salt precipitation followed by diafiltration.
Fraction Volume (ml)
rCollagen Concentration
(mg/ml)
rCollagen Purity
(%)
Step Yield (%)
Step Purification
Factor
Overall Yield (%)
Overall Purification
Factor
Extract 60 0.12 17.5 Resuspended Precipitate 60 0.11 85 88 4.9 88 4.9
Diafiltration Retentate 65.5 0.1 99 98 1.2 87 5.66

133
Figures:
Figure 1. Coomassie stained SDS-PAGE of corn proteins extracted at pH 2 and pH 7 without the addition of rCollagen loaded with 20 µL of sample in each lane. Lane A: endosperm extract at pH 2, lane B: endosperm extract at pH 7, lane C: germ extract at pH 2, and Lane D: is germ extract at pH 7. Lanes A and C are the extraction conditions used in the UF/DF experiments.

134
Figure 2. The permeate flux for a filtration of an rCollagen containing germ extract at low TMP and a crossflow rate of 0.12 m/s. Change of permeate flux with TMP shows the filtration was operated below the critical TMP. Permeate flux data was smoothed using a 4 period moving average.
Time (min)
0 20 40 60
Per
mea
te F
lux
(LM
H)
16
18
20
22
24
26
28
30
32
34
36
Tra
nsm
embr
ane
Pre
ssur
e (b
ar)
0.2
0.3
0.4
0.5
0.6
Permeate Flux Transmembrane Pressure

135
Figure 3. The permeate flux for a filtration of an rCollagen containing endosperm extract at high TMP and a crossflow rate of 0.25 m/s. The rapid permeate flux decline with filtration time at constant TMP indicates that the filtration is operated above the critical TMP. Permeate flux data was smoothed using a 4 period moving average.
Time (min)
0 10 20 30 40
Per
mea
te F
lux
(LM
H)
32
34
36
38
40
42
44
46
48
50
52
Tra
nsm
emb
ran
e P
ress
ure
(b
ar)
0.4
0.6
0.8
1.0
1.2
1.4
Permeate Flux Transmembrane Pressure

136
Figure 4. Effect of filtration conditions on the average permeate flux observed during diafiltration. Level 1 corresponds to low crossflow rate and TMP (0.12 m/s and ~0.5 bar, respectively) and endosperm extract. Level 2 corresponds to high crossflow rate and TMP (0.25 m/s and ~1.1 bar, respectively) and germ extract.
Treatment Level
Level 1 Level 2
Ave
rag
e P
erm
eate
Flu
x (L
MH
)
25
30
35
40
45
50
55
60
65
Crossflow rate TMPTissue

137
Figure 5. Change in the average corn protein sieving coefficient with the number of diavolumes during the filtration of a corn endosperm extract at high crossflow and TMP, and a filtration pH of 2.1.
Diavolumes
0 2 4 6 8
HC
P S
ievi
ng
Co
effi
cien
t
0.0
0.1
0.2
0.3
0.4
0.5
0.6
0.7
0.8

138
Figure 6. Coomassie stained SDS-PAGE gel of filtration samples collected during an eight diavolume filtration of rCollagen in an endosperm extract. Lane A: 0.5 mg/ml rCollagen standard used for spiking, lane B: initial filtration feed, lane C: retentate after 1 diavolume, lane D: retentate after five diavolumes, lane E: retentate after three diavolumes, lane F: retentate after seven diavolumes, lane G: retentate after eight diavolumes, lane H: final retentate, lane I: final permeate. Each lane was loaded with 20 µL of sample.
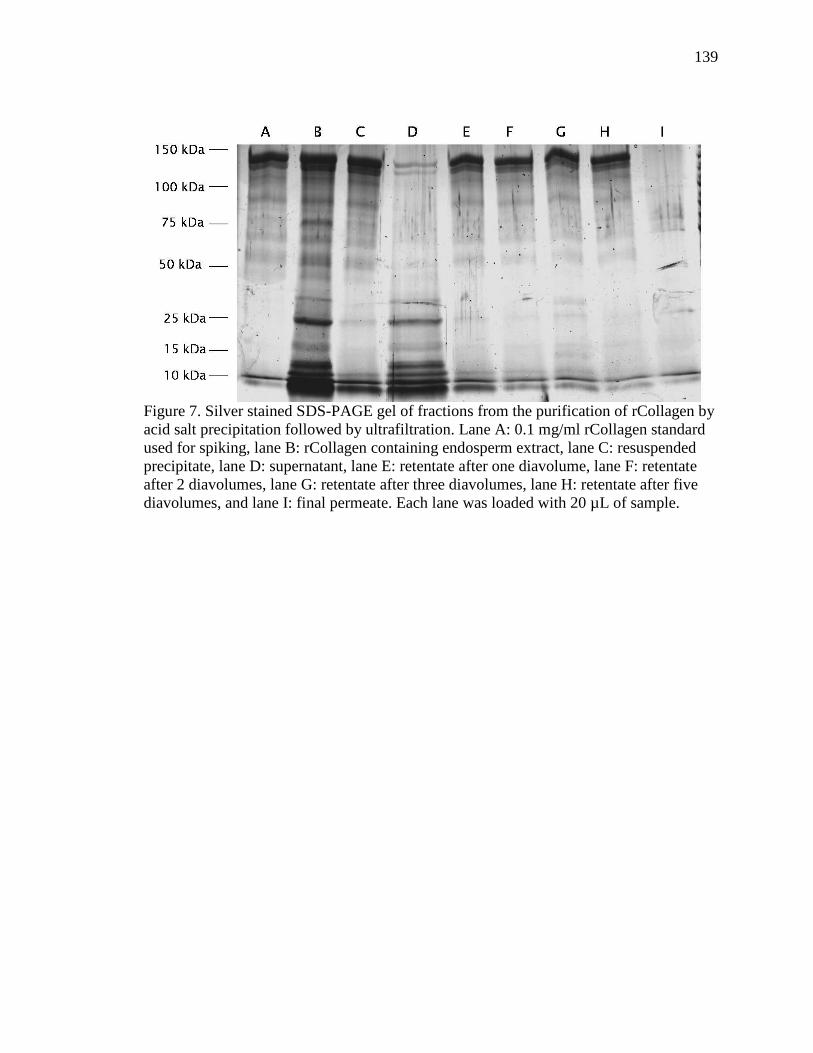
139
Figure 7. Silver stained SDS-PAGE gel of fractions from the purification of rCollagen by acid salt precipitation followed by ultrafiltration. Lane A: 0.1 mg/ml rCollagen standard used for spiking, lane B: rCollagen containing endosperm extract, lane C: resuspended precipitate, lane D: supernatant, lane E: retentate after one diavolume, lane F: retentate after 2 diavolumes, lane G: retentate after three diavolumes, lane H: retentate after five diavolumes, and lane I: final permeate. Each lane was loaded with 20 µL of sample.

140
Chapter V: General Conclusions
The high priority placed on the downstream purification processes increases the demand
for high throughput and high yield purification methods. The overall objective of the
research presented in this thesis was to develop membrane-based separation methods for
solid/liquid clarification and purification of recombinant proteins to meet this demand.
The work presents a framework that can be used in the implementation and evaluation of
membrane-based separation methods. The effect of polyelectrolyte flocculation on the
permeate flux and product rejection during the microfiltration of an industrial
fermentation was examined, including a detailed analysis of the effect of the shear
environment on the flocculated particles in the filtration. For the first time, a
comprehensive study on the solid/liquid clarification of aqueous corn extracts by
microfiltration was carried out, incorporating an analysis of the compressibility of the
filter cake and the effect of filtration conditions on the permeate flux and product
rejection. Finally, purification of recombinant proteins from aqueous corn endosperm and
germ extracts by ultrafiltration was assessed.
In the work described in chapter II, polyelectrolyte flocculation was examined as a feed
pretreatment to improve the permeate flux and product transmission during the
microfiltration of an industrial fermentation broth. The use of cationic flocculation as a
feed pretreatment has applications in many areas of the waste water treatment and
biotechnology industries. Flocculation is likely to become an important step for

141
improving not only microfiltration but also centrifugation in the biotechnology industry,
particularly in the recovery of protein inclusion bodies from bacterial lysates. This work
establishes a method to efficiently screen many flocculants and provides a framework for
conducting a detailed analysis of the factors affecting the microfiltration of flocculated
particles. In our study, several polyelectrolytes were screened for flocculated particle size
and permeate flux enhancements in unstirred and stirred dead-end filtrations. Larger
flocculated particles were formed by flocculation with polyelectrolytes of longer chain
length. Increase in particle size of the feed generally resulted in an improvement in the
permeate flux, but the largest particle size did not result in the greatest permeate flux
enhancement. In crossflow filtrations, for the first time it was observed that long term
improvements in the filtration performance can be achieved despite complete floc
disruption that was observed early in the filtration. The results indicate that flocculation
of the filtration feed can significantly reduce the rejection of a recombinant protein. This
work provides a foundation for the application of cationic flocculation to other filtration
feeds and filtration modules (e.g. flat-sheet, hollow-fiber).
The use of plants as recombinant protein production systems is rapidly moving from the
early development stages to large scale implementation, with several companies on the
verge of introducing plant-derived recombinant protein products. Plants provide unique
advantages over traditional cell-culture production systems, such as established and
inexpensive methods for transformation, cultivation, and processing, as well as reducing
the risk of contamination by mammalian pathogens. However, the purification process
remains the most expensive step in the production of recombinant proteins in plants.

142
Membrane-based separations have the potential to reduce the cost of the purification
process. In the work presented in chapters III and IV, The effectiveness of tangential flow
microfiltration and ultrafiltration for the solid/liquid clarification and purification of
aqueous corn endosperm and germ extracts was examined using recombinant type I
human collagen (rCollagen, 265 kDa) and green fluorescent protein (GFP, 27 kDa) as
model proteins.
Traditionally, the solid/liquid clarification of plant processing streams has been carried
out by depth filtration or rotary drum vacuum filtration. However, both of these
techniques rely heavily on the use of filter aids, which significantly add to the cost of the
purification process. Additionally, effluents from these operations typically still contain
some solids and require further clarification before the feed is ready for the subsequent
purification steps. Microfiltration has the potential to produce a solids-free effluent while
simultaneously eliminating the use of filter aids. The effectiveness of tangential flow
microfiltration for the solid/liquid clarification of aqueous corn endosperm and germ
extracts was examined in chapter III. In this study, microfiltration is established as an
effective method for the solid/liquid clarification of aqueous corn extracts. The
characteristics of the filter cakes formed during the filtration of aqueous extracts of corn
endosperm and germ fractions were identified as well as analyzed the effect of the
filtration operating conditions on the filtration performance. Despite high fouling of the
ceramic membrane, high permeate flux and transmission of the low molecular weight
proteins were achieved. Product transmission of the higher molecular weight proteins was
improved by filtration with a poly(vinylidene fluoride) (PVDF) membrane, which

143
showed significantly less fouling compared to the ceramic membrane. This result
illustrates the importance of selecting a membrane chemistry that is compatible with the
filtration feed and reduces internal membrane fouling. This study provides an excellent
approach for the characterization and evaluation of microfiltration for the solid/liquid
clarification of plant systems, as well as a starting point for the implementation,
optimization, and extension of microfiltration to other plant or cell culture host systems.
Ultrafiltration has the potential to provide an inexpensive, robust, and scalable
purification method in the production on recombinant proteins. In the work presented in
chapter IV, the effectiveness of ultrafiltration for the purification of recombinant proteins
from aqueous corn endosperm and germ extracts was examined. We developed an
approach to evaluate ultrafiltration as a technique for the purification of recombinant
proteins produced in transgenic corn. Identification of the effects of membrane pore size,
transmembrane pressure (TMP), crossflow rate, filtration pH, and targeted corn tissue on
permeate flux and protein sieving in the ultrafiltration of aqueous corn extracts was
performed. A method was developed to purify rCollagen to very high purity (>99%)
using only precipitation and ultrafiltration. This work could be extended to other larger
molecular weight larger recombinant proteins (>100 kDa) to provide an inexpensive
purification scheme for proteins from corn extracts using ultrafiltration. Our work could
be used as a model to evaluate the purification requirements of potential recombinant
proteins and production host combinations to identify a system to minimize the
downstream purification cost.

144
Taken together, successful development of several methods using membrane-based
separations for solid/liquid clarification and purification of recombinant proteins from a
bacterial fermentation broth and aqueous corn extracts was carried out. Filtration
performance was improved for microfiltration of both an industrial fermentation broth
and aqueous corn extracts and conditions were identified where ultrafiltration can be used
to produce a highly purified recombinant protein from transgenic corn. The methods
presented in this work can be used as models to develop more inexpensive and efficient
membrane-based separations.
On a broader note, the development of membrane-based separation processes is
extremely important to the biotechnology industry. Membrane-based separations can
decrease the cost of the purification process by decreasing the processing time and
increasing product yields. Future improvements in membrane materials, filtration
modules, and understanding of the factors that affect protein retention and permeate flux
will continue to drive membrane separations to the forefront of the separation techniques
used in the biotechnology industry.
Future Directions
Through our work using flocculation to improve microfiltration we gained significant
insights into the mechanisms that underlie the increases in permeate flux. Development
of a model to elucidate the precise role of the feed spacer in the deposition of particles in
a polydisperse feed might lead to significant advances in the design of feed spacers.
Additionally, extension of this study to different fermentation feeds and examination of

145
this process in a scaled-up system are necessary for adoption of this technique at the
production scale.
The use of membrane separations for the purification of proteins from transgenic plants
shows great potential. Extensions of the studies described in this thesis to other available
host systems would provide valuable insight into the purification requirements for each
system and may allow for selection of a host organism that minimizes the purification
requirements.