membrane reactor applied to enzyme conversion of …
TRANSCRIPT

www.wjpps.com Vol 9, Issue 9, 2020.
43
Vitolo. World Journal of Pharmacy and Pharmaceutical Sciences
MEMBRANE REACTOR APPLIED TO ENZYME CONVERSION OF
SUCROSE AND GLUCOSE
Michele Vitolo*
School of Pharmaceutical Sciences, University of São Paulo, Brazil.
ABSTRACT
Membrane reactor (MR) is a pressure-resistant glass or stainless-steel
vessel coupled with a nano-, ultra-, or microfiltration membrane. The
MR aims to integrate catalytic conversion, product separation or
concentration, catalyst retention, and recuperation in a same operation.
There are three types of MR (direct contact, diffusion contact, and
interfacial contact). This work addresses sucrose hydrolysis and
glucose oxidation by invertase and glucose oxidase (GO), respectively.
The MR operated in batch, fed-batch (linear or exponential decreasing
feeding), or continuous mode. The best yields (sucrose 100% and
glucose 72%) occur in fed-batch operated in linear decreasing mode.
Moreover, multi-enzyme (invertase, GO, and catalase) sucrose/gluconic acid conversion
conducted in MR operates in fed-batch and continuous modes and results in yields of 72%
and 92%, respectively.
KEYWORDS: Sucrose, glucose, membrane reactor, fed-batch, invertase, glucose oxidase.
INTRODUCTION
A membrane reactor (MR) is a pressure-resistant glass or stainless-steel vessel (always sealed
with a thick stainless-steel lid) coupled with a nano-, ultra-, or microfiltration membrane.
Table 1 shows some characteristics of the membrane. The membranes, independently of pore
size, can have the format of a plate, a hollow fiber cartridge, or a spiral cartridge.[1]
The MR
aims to integrate catalytic conversion, product separation or concentration, catalyst retention,
and recuperation in a same operation.
WORLD JOURNAL OF PHARMACY AND PHARMACEUTICAL SCIENCES
SJIF Impact Factor 7.632
Volume 9, Issue 9, 43-70 Research Article ISSN 2278 – 4357
Article Received on
29 June 2020,
Revised on 19 July 2020,
Accepted on 09 August 2020
DOI: 10.20959/wjpps20209-17060
*Corresponding Author
Michele Vitolo
School of Pharmaceutical
Sciences, University of São
Paulo, Brazil.
www.wjpps.com Vol 9, Issue 9, 2020.
44
Vitolo. World Journal of Pharmacy and Pharmaceutical Sciences
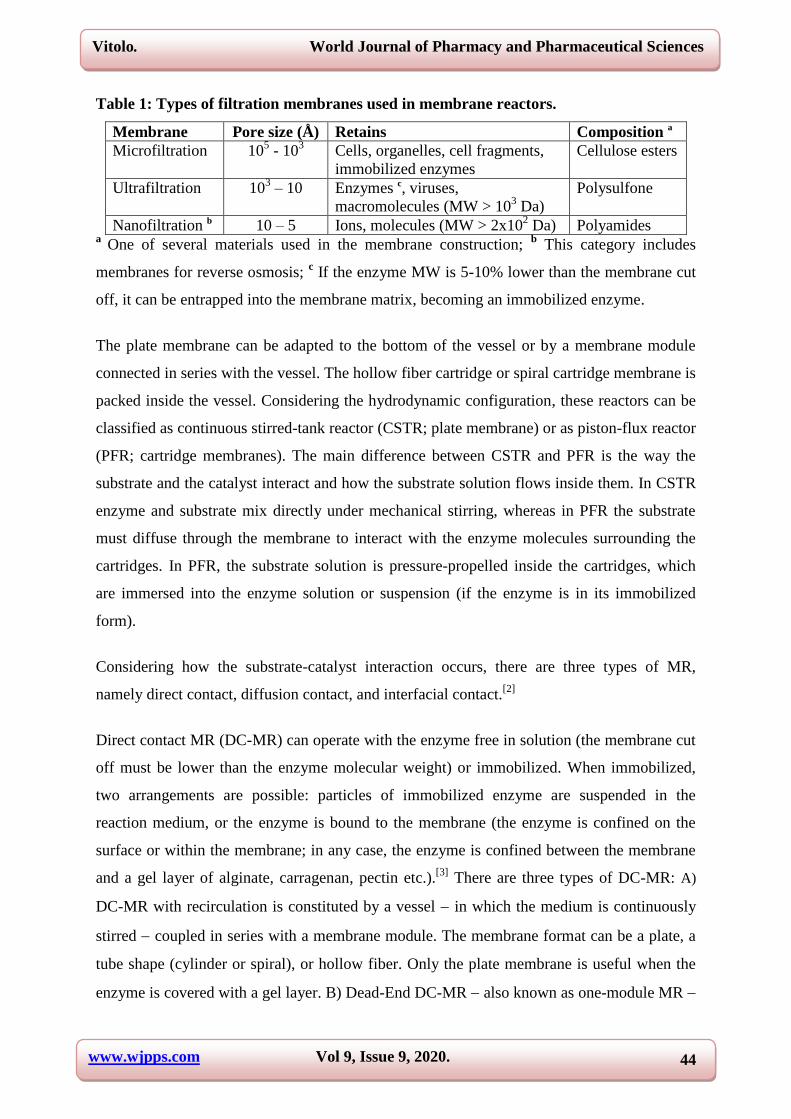
Table 1: Types of filtration membranes used in membrane reactors.
Membrane Pore size (Å) Retains Composition a
Microfiltration 105 - 10
3 Cells, organelles, cell fragments,
immobilized enzymes
Cellulose esters
Ultrafiltration 103 – 10 Enzymes c, viruses,
macromolecules (MW > 103 Da)
Polysulfone
Nanofiltration b 10 – 5 Ions, molecules (MW > 2x10² Da) Polyamides
a One of several materials used in the membrane construction;
b This category includes
membranes for reverse osmosis; c If the enzyme MW is 5-10% lower than the membrane cut
off, it can be entrapped into the membrane matrix, becoming an immobilized enzyme.
The plate membrane can be adapted to the bottom of the vessel or by a membrane module
connected in series with the vessel. The hollow fiber cartridge or spiral cartridge membrane is
packed inside the vessel. Considering the hydrodynamic configuration, these reactors can be
classified as continuous stirred-tank reactor (CSTR; plate membrane) or as piston-flux reactor
(PFR; cartridge membranes). The main difference between CSTR and PFR is the way the
substrate and the catalyst interact and how the substrate solution flows inside them. In CSTR
enzyme and substrate mix directly under mechanical stirring, whereas in PFR the substrate
must diffuse through the membrane to interact with the enzyme molecules surrounding the
cartridges. In PFR, the substrate solution is pressure-propelled inside the cartridges, which
are immersed into the enzyme solution or suspension (if the enzyme is in its immobilized
form).
Considering how the substrate-catalyst interaction occurs, there are three types of MR,
namely direct contact, diffusion contact, and interfacial contact.[2]
Direct contact MR (DC-MR) can operate with the enzyme free in solution (the membrane cut
off must be lower than the enzyme molecular weight) or immobilized. When immobilized,
two arrangements are possible: particles of immobilized enzyme are suspended in the
reaction medium, or the enzyme is bound to the membrane (the enzyme is confined on the
surface or within the membrane; in any case, the enzyme is confined between the membrane
and a gel layer of alginate, carragenan, pectin etc.).[3]
There are three types of DC-MR: A)
DC-MR with recirculation is constituted by a vessel in which the medium is continuously
stirred coupled in series with a membrane module. The membrane format can be a plate, a
tube shape (cylinder or spiral), or hollow fiber. Only the plate membrane is useful when the
enzyme is covered with a gel layer. B) Dead-End DC-MR also known as one-module MR
www.wjpps.com Vol 9, Issue 9, 2020.
45
Vitolo. World Journal of Pharmacy and Pharmaceutical Sciences
resembles functionally a filtration cell in which all reaction events (mainly substrate
conversion and product separation) occur in one step. Only the plate membrane is useful in
this type of membrane reactor.[4]
C) DC-MR dialyzer is operated by introducing the substrate
in the side of membrane module containing the enzyme, and the product formed cross the
membrane impelled by a concentration gradient collected from a storage tank. Commonly,
there is recirculation of the product into the membrane module (Figure 1). DC-MR has been
used in bioconversions such as sucrose, cellulose, triglycerides, or starch hydrolysis,[3,5,6,7,8]
and for synthesis of L-alanine, D-2hydroxy caproic acid, glucose-6phosphate, or manitol,
[9,10,11,12]
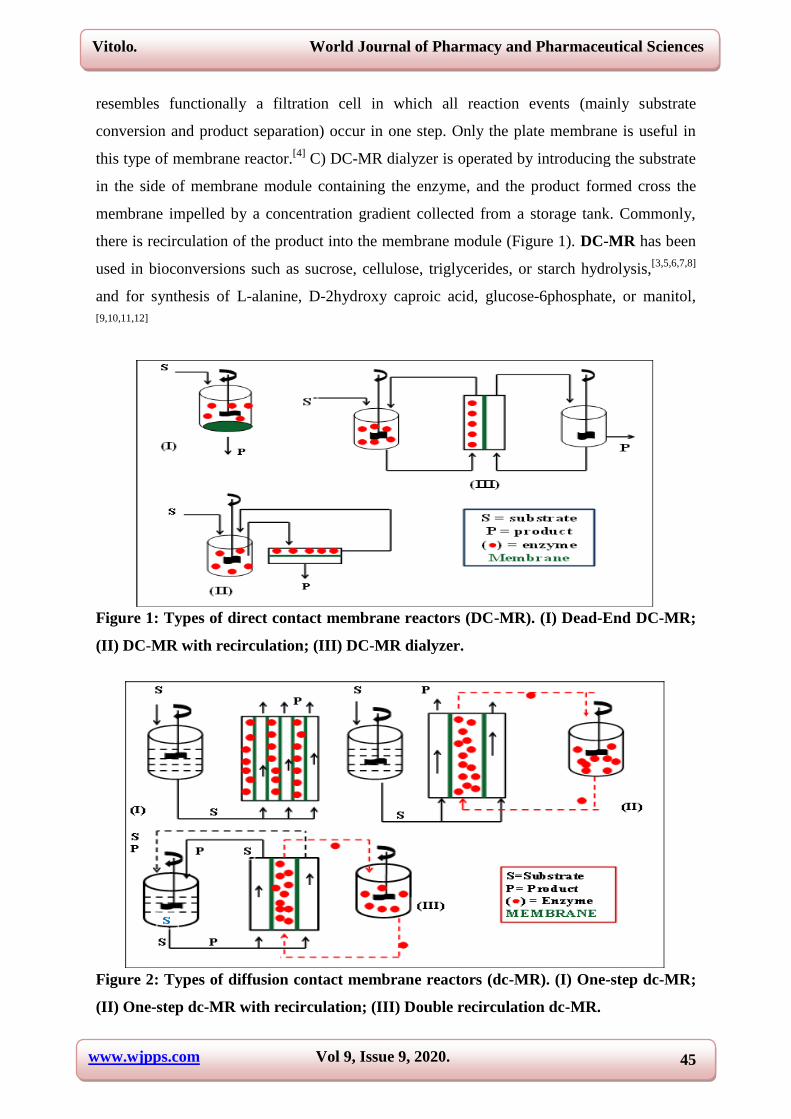
Figure 1: Types of direct contact membrane reactors (DC-MR). (I) Dead-End DC-MR;
(II) DC-MR with recirculation; (III) DC-MR dialyzer.
Figure 2: Types of diffusion contact membrane reactors (dc-MR). (I) One-step dc-MR;
(II) One-step dc-MR with recirculation; (III) Double recirculation dc-MR.
www.wjpps.com Vol 9, Issue 9, 2020.
46
Vitolo. World Journal of Pharmacy and Pharmaceutical Sciences
Diffusion contact MR (dc-MR) operates with the enzyme (soluble or insoluble) confined in
one side of the compartment delimited by a hollow fiber membrane, and the substrate fed at
the opposite side. As substrate molecules must diffuse passively across the membrane to
interact with the enzyme, the dc-MR can be considered a typical dialyzer. Such reactor can
only convert low MW compounds. The conversion substrate/product rate is diffusion-
dependent. There are three possible arrangements, namely one-step, one-step with
recirculation, and double recirculation (Figure 2). The dc-MR is used in the hydrolysis of
urea by urease and lactose by lactase, for instance.[13,14]
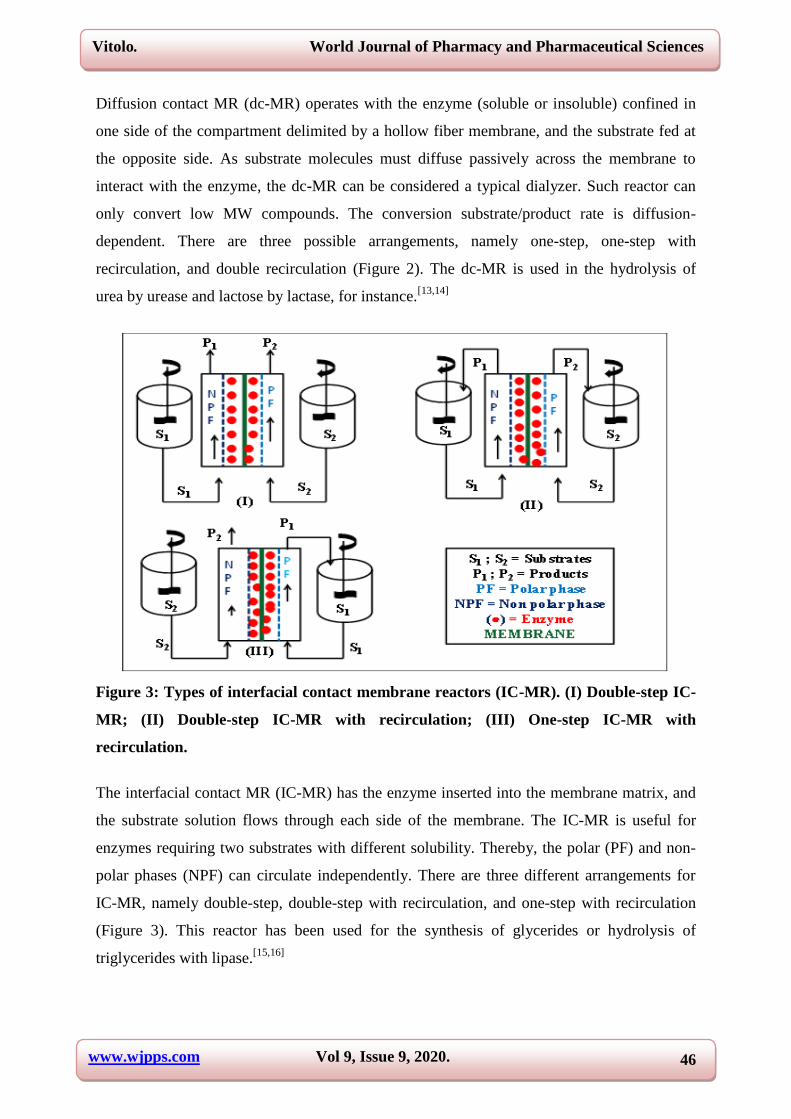
Figure 3: Types of interfacial contact membrane reactors (IC-MR). (I) Double-step IC-
MR; (II) Double-step IC-MR with recirculation; (III) One-step IC-MR with
recirculation.
The interfacial contact MR (IC-MR) has the enzyme inserted into the membrane matrix, and
the substrate solution flows through each side of the membrane. The IC-MR is useful for
enzymes requiring two substrates with different solubility. Thereby, the polar (PF) and non-
polar phases (NPF) can circulate independently. There are three different arrangements for
IC-MR, namely double-step, double-step with recirculation, and one-step with recirculation
(Figure 3). This reactor has been used for the synthesis of glycerides or hydrolysis of
triglycerides with lipase.[15,16]

www.wjpps.com Vol 9, Issue 9, 2020.
47
Vitolo. World Journal of Pharmacy and Pharmaceutical Sciences
Generally, membrane reactors are designed to operate continuous processes. However, the
dead-end DC-MR is the only one that can also operate in batch and fed-batch modes.[17,18]
The advantage of using it instead of traditional reactors is because of the possibility of
enzyme reutilization. It is enough to pressurize the vessel to filtrate the product solution.
After washing with buffer solution or deionized water, the retained enzyme becomes
available for the next reaction.
As with any reactor, MR has advantages and disadvantages, listed in Table 2.
Table 2: Advantages and disadvantages of membrane reactors.
Advantages
Used for enzyme characterization (KM, Vmax, reaction conditions: pH, temperature, agitation
etc.) at a bench level. Dead-end DC-MR is recommended.
Used for controlled hydrolysis of macromolecules (partial collagen hydrolysis by protease,
creating peptides with low MW and viscosity, for example). Direct-contact membrane rectors
are recommended.
Operation in continuous mode.
Shifting of reaction equilibrium, when occurs, by separating one of the reagents continuously.
Removing of enzyme inhibitor generated during catalysis (inhibition by product).
No back mixing.
Catalysis and separation of product are simultaneous events.
Membrane can be used as enzyme immobilization support.
Reaction in double phases, avoiding emulsification. IC-MR is recommended.
Product obtained can be a concentrated product.
Coenzyme regeneration by bi-enzymatic process. IC-MR is recommended.
Disadvantages
Decrease in enzyme activity due to shearing forces, mainly with DC-MR.
Decrease in yield due to diffusion limitations arising from membrane polarization* or pore
obstruction.
Decrease in enzyme activity due to loss of cofactors.
Inadequate enzyme-membrane interaction.
Increase in product or substrate inhibition when the enzyme is immobilized directly on the
membrane surface.
Decrease in mass transfer through the membrane (convective or diffusive flux) during
separation process.
*Concentration polarization is the maximum accumulation of solute on the membrane
surface. This phenomenon is due to an unbalance between the convective flux of solute to the
membrane and the rate at which solute passes through the membrane.
Sucrose is an abundant natural disaccharide extracted mainly from sugarcane (tropical and
sub-tropical countries) and beet (cold countries). It is a product per se. It is crystallized from
sugarcane juice and used as food sweetener (table-sugar). Moreover, sucrose dissolved in

www.wjpps.com Vol 9, Issue 9, 2020.
48
Vitolo. World Journal of Pharmacy and Pharmaceutical Sciences
sugarcane juice or in molasses (waste of sugar crystallization) is converted by yeast
fermentation into ethanol a compound used as fuel, reagent in alcohol-chemistry sectors,
and liquors. In Brazil, large bio-refinery facilities crush huge amounts of sugarcane stems,
resulting in a billion liters of stillage (residue from ethanol distillation, rich in potassium,
nitrate and organic substances, which is sprinkled over the soil where sugarcane is planted),
juice, and molasses. From juice and molasses tons of table-sugar and ethanol are obtained,
which are sold in the national and international markets. However, the markets for both
products are volatile because ethanol fuel competes with gasoline, whose prices vary
according to the price of petroleum in the world market, and table-sugar competes with other
producers (practically every tropical or sub-tropical country has huge sugarcane crops) and
problems related to climate change or uncontrolled plagues. Due to the instability of the
market, there may be a surplus of sucrose in bio-refineries, leading to an extra storage cost
and deterioration mainly due to absorption of humidity from the air, causing another problem
for the producer. A solution could be converting the sucrose into beverages/ethanol fuel by
fermentation. However, this might also lead to financial losses because refined sugar itself
has aggregate value. A possible reduction in the demand for ethanol might also increase sugar
accumulation in bio-refineries. Thus, converting sucrose into another valuable product, such
as glucose, fructose, gluconic acid, fructooligosaccharides, or high fructose syrup using an
efficient process, could transform eventual financial losses into profits.
The conversion of sucrose by invertase or -glucosidase into glucose and fructose, both
valuable reagents for the biotechnological and chemical industries as well as a mixture of
them makes the inverted sugar syrup also a marketable product. Other valuable
bioconversions are glucose oxidation into gluconic acid (used as acidulant, bleaching agent,
medicine, and cleaner of metallic surfaces), and fructose polymerization into
fructooligosaccharides by glucose oxidase and sucrose-6-fructosyl transferase (levansucrase),
respectively.[19,20]
The present study addresses the use of dead-end DC-MR operated in batch, fed-batch
(decreasing linear and exponential feeding laws), or continuous mode to hydrolyze sucrose
into glucose and fructose with invertase (E.C.3.2.1.26), and oxidize glucose into gluconic
acid with glucose oxidase (E.C.1.1.3.4).

www.wjpps.com Vol 9, Issue 9, 2020.
49
Vitolo. World Journal of Pharmacy and Pharmaceutical Sciences
MATERIAL AND METHODS
MATERIAL
Invertase (INVERTIN®; 2,400 U/mL), sucrose (biochemical grade), glucose oxidase (5,600
U/g), catalase (E.C.1.11.1.6; 2,950 U/mg), and reagents (grade P.A.) were purchased from
MERCK, SIGMA and FLUKA. The spectrometric determinations were obtained using a
Beckman-Coulter spectrometer (Model DU 640). The membrane reactor – dead-end DC-MR
– was a 500-mL pressure-resistant-glass cell (Millipore®) containing a 100-kDa UF
membrane at the bottom (regenerated cellulose; Millipore®).
METHODS
Characterization of Invertase
Determination of invertase activity (standard assay)
In the DC-MR we introduced 108 mL of 0.010 M acetate buffer (pH 5.0). The reactor was
left in a water bath for ten minutes at 37 OC, followed by addition of 12 g of sucrose under
agitation of 100 rpm. After five minutes, 12 mL of 0.010 M acetate buffer (pH 5.0) invertase
solution (INVERTIN® diluted 5,000 times) were added to the reactor. Aliquots of 0.5 mL
were taken every two minutes until 12 min of reaction. The aliquots were introduced in test
tubes containing 0.5 mL of distilled water and 1.0 mL of Somogyi’s reagent, followed by
immersion into boiling water bath for ten minutes. Next, we determined reducing sugars
concentration (RS).[21]
Before enzyme addition, a 0.5-mL aliquot was taken to determine the
initial RS concentration (time zero).
We defined one invertase unit (UI) as the amount of RS formed (mg) per minute under the
conditions of the test.
Effects of pH, temperature, and substrate concentration on invertase activity
The standard assay was carried out by changing pH (3.5-6.0), temperature (30-50 OC) or
sucrose concentration (4.0 - 50.0 mM). The kinetic constants were calculated by Hanes-
Woolf plot.[22]
Activation energy (Ea) and enthalpy (H) were calculated by the equations:[23]
Ln v = (Ea) 2.303. (R.T) (Eq. 1)
H = Ea – R.T (Eq. 2)
Where v = invertase activity (UI/mL); R = universal gas constant (8.3144 J/mol.OK); T =
absolute temperature (OK).

www.wjpps.com Vol 9, Issue 9, 2020.
50
Vitolo. World Journal of Pharmacy and Pharmaceutical Sciences
Effects of pH and temperature on invertase stability
In six beakers containing 60 mL of 0.010 M acetate buffer (pH 4.6 or 5.0), invertase was
dissolved to amount to a 5,000 times dilution in relation to the original INVERTIN®. The
beakers were left in a water bath at 37 OC for up to 30 h. After the times 0.5 h, 1 h, 2 h, 10 h,
20 h, and 30 h, 60 mL of 0.584 M sucrose buffered solution (0.010 M acetate buffer; pH 4.6)
were added to each beaker, and the reaction continued according to the standard assay. When
the acetate buffer pH was 5.0, the pH was lowered to 4.6 by adding ten drops of 1.0 M HCl
before adding sucrose solution. The final pH was verified using a Merck-strip indicator.
Characterization of glucose oxidase (GO)
Determination of GO activity (standard assay)
In a DC-MR we added 125 mL of 0.010 M acetate buffer (pH 5.0) and 0.15 g of glucose
under agitation of 100 rpm at 37 OC. Then, 25 mL of GO solution were added, and 1-mL
aliquots were taken every ten minutes until one hour of reaction. The samples were immersed
into boiling water bath and, after cooling, the hydrogen peroxide was measured at = 240
nm. Before GO addition, a 1-mL aliquot was taken to measure the hydrogen peroxide initial
concentration (time zero). Throughout the test, oxygen was bubbled into the medium,
amounting to a constant concentration of 4 ppm controlled by an automatic oxygen-meter.
We defined one GO unit (UGO) as the amount of H2O2 formed (mg) per minute under the
conditions of the test.
Effects of pH, temperature, and substrate concentration on GO activity
The standard assay was carried out by changing the pH (4.0-6.5), temperature (30-45 OC) or
glucose concentration (2.0-25.0 mM). The kinetic constants were calculated by Hanes-Woolf
plot. Activation energy (Ea) and enthalpy (H) were calculated by equations 1 and 2.
Effects of pH and temperature on GO stability
Six 50-mL volumetric flasks containing 25 mL of GO buffered solution (acetate buffer 0.010
M; pH 5.0) were immersed in water bath at 37 OC. At the times 0, 0.5 h, 1 h, 2 h, 10 h, 20 h,
and 30 h, the volume of every flask was added into a beaker containing 125 mL of 0.010 M
acetate buffer (pH 5.0), in which 0.15 g of glucose had been dissolved. The reaction
continued according to the standard assay.

www.wjpps.com Vol 9, Issue 9, 2020.
51
Vitolo. World Journal of Pharmacy and Pharmaceutical Sciences
Sucrose hydrolysis by invertase in Dead-End DC-MR operated in batch mode
In the DC-MR we added 250 mL of 0.010 M acetate buffer (pH 5.0) and 19.2 g of sucrose.
The temperature was set at 37 OC, and the solution was left under agitation (100 rpm) for ten
minutes. Then, 50 mL of invertase solution (0.010 M acetate buffer; pH 5.0) were added, and
the reaction continued for 60 min. Every ten minutes, aliquots (1 mL) were taken for RS
determination.
Sucrose Hydrolysis by Invertase in Dead-End DC-MR Operated in Fed-Batch Mode
In the DC-MR we added 50 mL of 0.010 M acetate buffer (pH 5.0) and 50 mL of buffered
invertase solution. Then, 300 mL of sucrose solution (64 g/L) were added step by step
following a linear decreasing or exponential decreasing law represented by the equations: [24]
Vad = 0.6t – 0.3t2 (Eq. 3)
Vad = 0.7621 – 0.7621.e-0.5.t
(Eq. 4)
Where Vad = volume of sucrose solution added up to at a given moment (L); t = addition time
(h).
Both equations are valid for a one-hour filling up time, total volume added of 0.3 L, and
addition constants of 0.6 (L/h2) and 0.5 h
-1 for linear and exponential decreasing laws,
respectively (see Appendix). The samples for analytical purposes were taken at every
addition time before the addition of fresh substrate solution. The reaction was carried out at
37 OC and agitation of 100 rpm.
Glucose oxidation by GO in Dead-End DC-MR operated in fed-batch mode
In the DC-MR we introduced 50 mL of 0.010 M acetate buffer (pH 5.0) and 50 mL of GO
solution (7,000U). Then, 300 mL of a mixture of glucose (32 g/L) and catalase (236,000U)
were added step by step for four hours according to linear decreasing or exponential
decreasing laws, represented by the equations:[24]
Vad = 0.15t – 0.01875.t2 (Eq. 5)
Vad = 0.347 – 0.347.e-0.5t
(Eq. 6)
Where Vad = volume of glucose solution added up to at a given moment (L); t = addition time
(h).
Both equations are valid for a four-hour filling up time, total volume added of 0.3 L, and
addition constants of 0.0375 (L/h2) and 0.5 h
-1 for linear and exponential decreasing laws,
respectively (see Appendix). The samples for analytical purposes were taken at every
www.wjpps.com Vol 9, Issue 9, 2020.
52
Vitolo. World Journal of Pharmacy and Pharmaceutical Sciences
addition time before the addition of fresh substrate solution. The reaction was carried out at
37 OC and agitation of 100 rpm.
To determine the residual amount of glucose, every sample was subjected to two
treatments.[25]
First, the residual amount of H2O2 present in 1 mL of sample was read directly
at = 240 nm. Secondly, 4.5 mL of catalase solution (295U) were mixed with 0.5 mL of
sample. The mixture was left at 37 OC for 30 min. Then, 0.1 mL of the catalase-treated
sample was mixed with 0.9 mL of distilled water and 1 mL of Somogyi-Nelson reagent.
Reducing sugars concentration was determined as described in another study.[21]
A blank was
prepared by mixing 0.5 mL of distilled water with 4.5 mL of catalase solution (295U). The
mixture was left at 37 OC for 30 min. Then, an aliquot of 0.1 mL was treated in the same way
as for RS determination.
Multi-enzyme conversion of sucrose in dead-end DC-MR operated in fed-batch mode
In the DC-MR we added 50 mL of invertase solution (776.6U) and 50 mL of glucose oxidase
solution (7,000U). Then, 300 mL of a mixture of sucrose (64 g/L) and catalase (236,000U)
were added step by step for four hours according to the linear decreasing law (Eq. 5). The
samples for analytical purposes were taken at every addition time before the addition of fresh
substrate solution. The reaction was carried out at 37 OC and agitation of 100 rpm.
Multi-enzyme conversion of sucrose in dead-end DC-MR operated in continuous mode
In the DC-MR we introduced 300 mL of acetate buffer solution (0.010 M; pH 5.0) containing
invertase (70.6U, 176.5U or 265U), GO (7,000U, 9,000U or 13,000U) and catalase
(236,000U, 354,000U or 531,000U). A sucrose solution (64 g/L, 100 g/L or 150 g/L) was
added continuously (100 mL/h) for 16 h. The residence time was three hours (dilution rate =
0.33 h-1
), and the internal pressure was 3 bar. Samples were taken every hour, at which the
amount of residual H2O2 and RS formed was determined. The process was carried out at 37
OC under continuous aeration and agitation at 100 rpm.
Analytical procedures
Determination of reducing sugars (RS)
The reducing sugars concentration, expressed as glucose, was evaluated by the Somogyi-
Nelson method as described in another study.[21]
www.wjpps.com Vol 9, Issue 9, 2020.
53
Vitolo. World Journal of Pharmacy and Pharmaceutical Sciences
The determination was made in quintuplicate to determine the standard deviation ( 31x10-4
mg) and the variation coefficient (3%) of the method. The glucose concentration was changed
between 0.04 mg and 0.20 mg.
The standard minimum square linear regression equation was:
YRS = 2.13Xgluc + 37x10-4
(r = 0.9996) (Eq. 7)
Where YRS = absorbance read at 540 nm; Xgluc = glucose amount (mg).
Determination of hydrogen peroxide
The H2O2 concentration was evaluated by reading the absorbance of 1-mL solutions at =
240 nm. The amount of H2O2 varied between 0.05 mg and 0.60 mg. The mother-solution
consisted of H2O2 10V (pharmaceutical grade) diluted fiftyfold into distilled water (0.608
mg/mL of H2O2).
The determination was made in quintuplicate to determine the standard deviation ( 14x10-4
mg) and the variation coefficient (0.5%) of the method.
The standard minimum square linear regression equation was:
YHD = 1.60XHD + 49x10-3
(r = 0.9994) (Eq. 8)
Where YHD = absorbance read at 240 nm; XHD = H2O2 amount (mg).
Determination of soluble protein
The soluble protein concentration was determined by the difference of absorbance read at =
215 nm and at = 225 nm.[24]
A solution of albumin (0.1 g/L) was used to determine the
standard minimum square linear regression equation:
YP = (Y215nm – Y225nm) = 61x10-4
XP – 17x10-4
(r = 0.99994) (Eq. 9)
Where YP = difference of absorbance read at 215 nm and 225 nm; XP = protein amount (g).
The determination was made in quintuplicate to determine the standard deviation (2.045 g)
and the variation coefficient (2.5%) of the method.
The protein concentrations for invertase and glucose oxidase were 2.74 mg/mL and 0.0248
mg/mL, respectively.

www.wjpps.com Vol 9, Issue 9, 2020.
54
Vitolo. World Journal of Pharmacy and Pharmaceutical Sciences
RESULTS AND DISCUSSION
Figures 4-8 show the characterization of invertase and GO in terms of activity, kinetic
constants, and effects of pH and temperature on activity and stability on both enzymes.
The activities of invertase and GO were calculated by the equations (Figure 4):
*YRS = 0.0341t – 0.0078 (r = 0.997) (Eq. 10)
YHP = 0.00091t – 0.0172 (r = 0.9994) (Eq. 11)
Where *YRS = concentration of reducing sugars (mg/mL); YHP = concentration of hydrogen
peroxide (mg/mL); t = reaction time (min).
Thereby, the invertase and GO activities were 0.0341 UI/mL (12.4x10⁻³
UI/mg of protein) and
91x10-5
UGO/mL (36.6x10⁻³
UGO/mg of protein), respectively.
Figure 4: Variation of RS (●) and H2O2 (□) concentrations versus time. Multiply the
time of GO activity by ten.
www.wjpps.com Vol 9, Issue 9, 2020.
55
Vitolo. World Journal of Pharmacy and Pharmaceutical Sciences
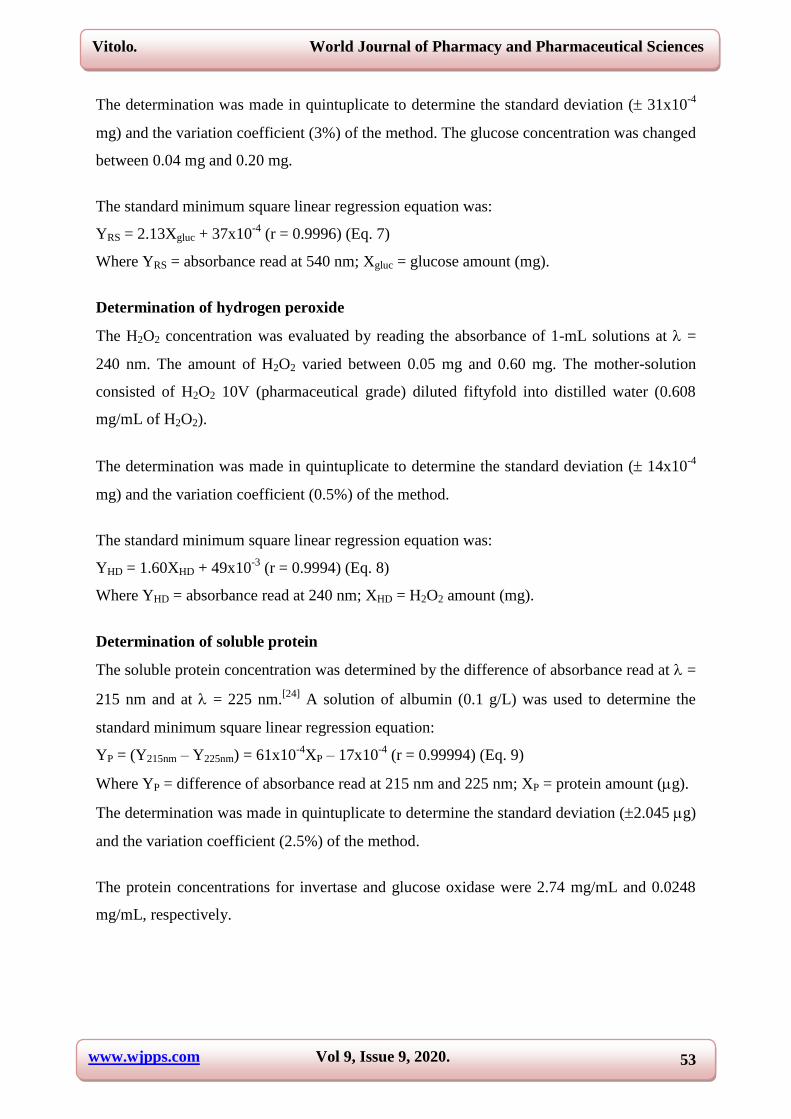
Figure 5: Effects of pH on the activity of invertase (●) and glucose oxidase (■).
The optimum pH for invertase and GO was 4.5 and 5.5, respectively (Figure 5). The data
found in the literature report pHs of 4.6 and 5.0-5.6, respectively, for invertase and
GO.[25,26,27,28]
When both enzymes are used in a reaction (direct conversion of sucrose into
gluconic acid), the pH value of the medium must be set. Setting pH at 5.0 is reasonable
because the activities of invertase and GO differ only 7% and 4% from their values at the
respective optimum pHs.
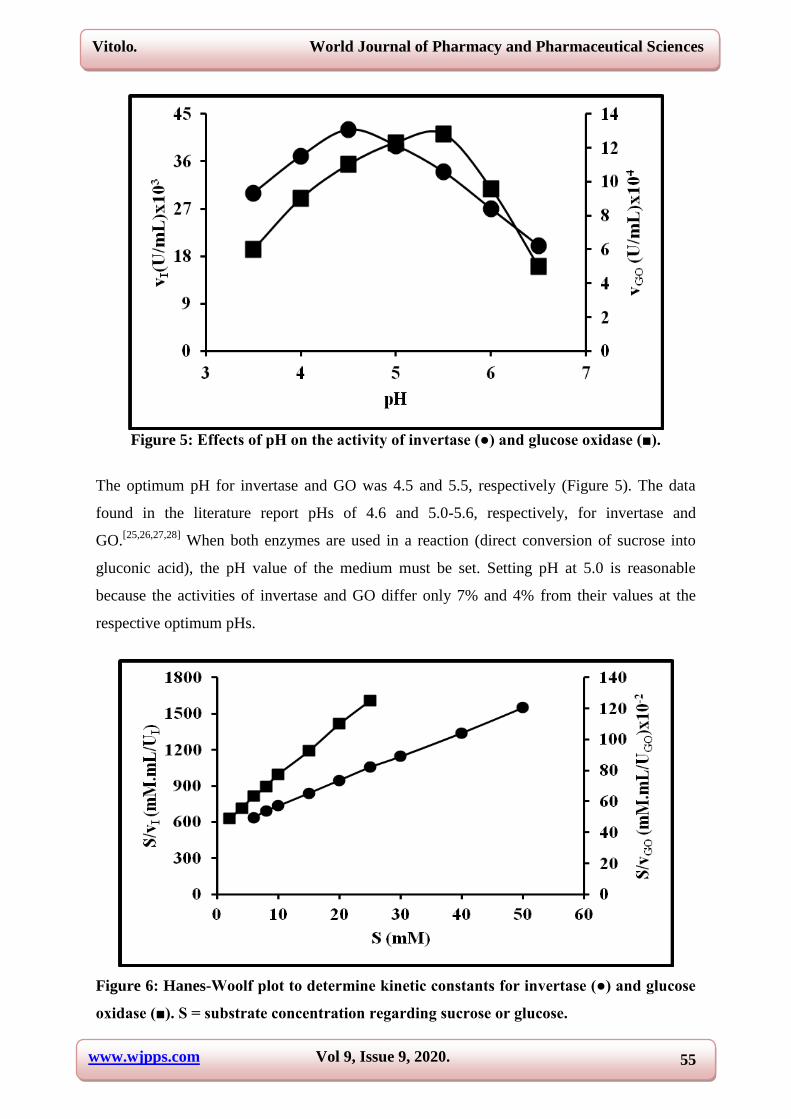
Figure 6: Hanes-Woolf plot to determine kinetic constants for invertase (●) and glucose
oxidase (■). S = substrate concentration regarding sucrose or glucose.

www.wjpps.com Vol 9, Issue 9, 2020.
56
Vitolo. World Journal of Pharmacy and Pharmaceutical Sciences
The minimum square linear regression equations regarding the lines shown in Figure 6 are:
(S/vI) = 20.45.(S) + 530.6 (r = 0.9996) (Eq. 12)
(S/vGO) = 0.033.(S) + 0.431 (r = 0.9995) (Eq. 13)
Where S= substrate (sucrose or glucose) concentration (mM); VI (UI/mL) and vGO (UGO/mL)
are activities of invertase and glucose oxidase.
Thereby, the kinetic constants for invertase and GO were (Vmax = 0.0489 UI/mL; KM = 25.9
mM) and (Vmax = 30.3 UGO/mL; KM = 13.1 mM), respectively.
Figure 7: Arrhenius plot to calculate the activation energy of the reaction catalyzed by
invertase (●) and glucose oxidase (■).
The minimum square linear regression equations regarding the lines shown in Figure 7 are:
Ln vI = 4,670. (1/T) + 11.8 (r = 0.997) (Eq. 14)
Ln vGO = 6,123.3.(1/T) + 12.8 (r = 0.998) (Eq. 15)
Thereby, the activation energy for invertase and GO reactions were 89.4 kJ/mol and 117.2
kJ/mol, respectively. By applying equation 2, the enthalpy for invertase and GO reactions
were 86.8 kJ/mol and 114.7 kJ/mol, respectively.

www.wjpps.com Vol 9, Issue 9, 2020.
57
Vitolo. World Journal of Pharmacy and Pharmaceutical Sciences
Figure 8: Stability of invertase (●) and glucose oxidase (■) at 37
OC and pH 5.0.
Invertase and GO were stable for 30 h at 37 OC and pH 5.0 (Figure 8). This result is relevant
when both enzymes are used in long-duration continuous processes.
As the main enzymes for catalytic sucrose and glucose conversions were characterized
kinetically, we evaluated their performance in dead-end DC-MR operated in batch, fed-batch
(feeding laws: linear and exponential decreasing), and continuous form.
We used the batch form to set the total invertase activity needed to convert a sucrose solution
(64g/L) in one hour. This time was used as the filling-up time for the fed-batch. Figure 9
shows that the sucrose solution completely hydrolyzed in one hour with a total invertase
activity of 777 UI. Moreover, we observed that the fed-batch carried out either in linear
decreasing (LD) or exponential decreasing (ED) mode led to a complete sucrose hydrolysis,
although the average of hydrolysis rate was 0.40 g RS/min and 0.35 g RS/min for LD and
ED, respectively.
www.wjpps.com Vol 9, Issue 9, 2020.
58
Vitolo. World Journal of Pharmacy and Pharmaceutical Sciences
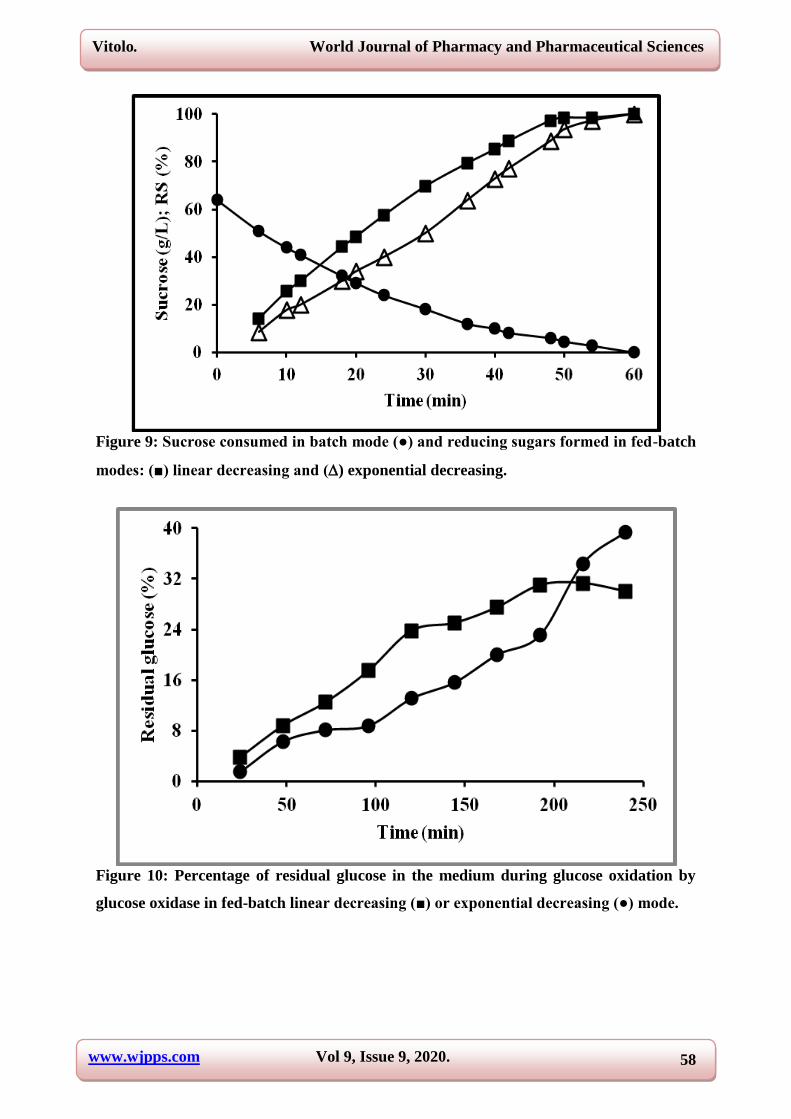
Figure 9: Sucrose consumed in batch mode (●) and reducing sugars formed in fed-batch
modes: (■) linear decreasing and () exponential decreasing.
Figure 10: Percentage of residual glucose in the medium during glucose oxidation by
glucose oxidase in fed-batch linear decreasing (■) or exponential decreasing (●) mode.

www.wjpps.com Vol 9, Issue 9, 2020.
59
Vitolo. World Journal of Pharmacy and Pharmaceutical Sciences
The oxidation of glucose into gluconic acid by glucose oxidase (GO) can be represented as
follows:
GO
GLUCOSE + O2 GLUCONIC ACID + H2O2
Thereby, the glucose/gluconic acid molar ratio is 1:1. According to Figure 10, the percentage
of residual glucose at the end of fed-batch was 30% (linear decreasing) and 39.4%
(exponential decreasing), which correspond to 22.4 g/L (0.124 moles) and 19.4 g/L (0.108
moles) of glucose consumed, respectively. These results led to concentrations of 24.3 g/L
(yield = 76%) and 21.2 g/L (yield = 66.3%) of gluconic acid obtained by linear decreasing
(LD) and exponential decreasing (ED) fed-batch, respectively. A complete glucose oxidation
was not achieved probably due to the accumulation of H2O2 in the reaction medium during
fed-batch operations. The concentrations at the end of the processes were 1.1 mg/mL (LD)
and 0.80 mg/mL (ED) (Figure 11). As already established, H2O2 concentrations over 0.04148
mg/mL are non-competitive inhibitors of GO by promoting the oxidation of Fe2+
(prosthetic
group of GO).[29]
The Fe2+
Fe3+
reaction leads to the formation of two forms of GO, i.e.,
GO-Fe2+
and GO-Fe3+
, the later less active.[30]
Despite the H2O2 concentration in ED being
27.3% lower than that of LD, conversion yields were opposite. This result could be explained
considering that glucose oxidation by GO is a five-step process:[30]
First: FAD-GO-Fe+2
+ G FADH2-GO-Fe+2
+ GA
Second: FADH2-GO-Fe+2
+ O2 H2O2 + FAD-GO-Fe+2
Third: FADH2-GO-Fe+2
+ H2O2 FADH2-GO-Fe+3
+ H2O + (1/2) O2
Fourth: FADH2-GO-Fe+3
+ O2 H2O2 + FAD-GO-Fe+3
Fifth: FAD-GO-Fe+3
+ G GA + FADH2-GO-Fe+3
Where G = glucose and GA = gluconic acid.
Accordingly, because the glucose addition rate in ED is lower than that of LD, the GO is
more susceptible to H2O2 non-competitive inhibition (third step), i.e., the formation of FAD-
GO-Fe3+
in ED is higher than in LD.
www.wjpps.com Vol 9, Issue 9, 2020.
60
Vitolo. World Journal of Pharmacy and Pharmaceutical Sciences
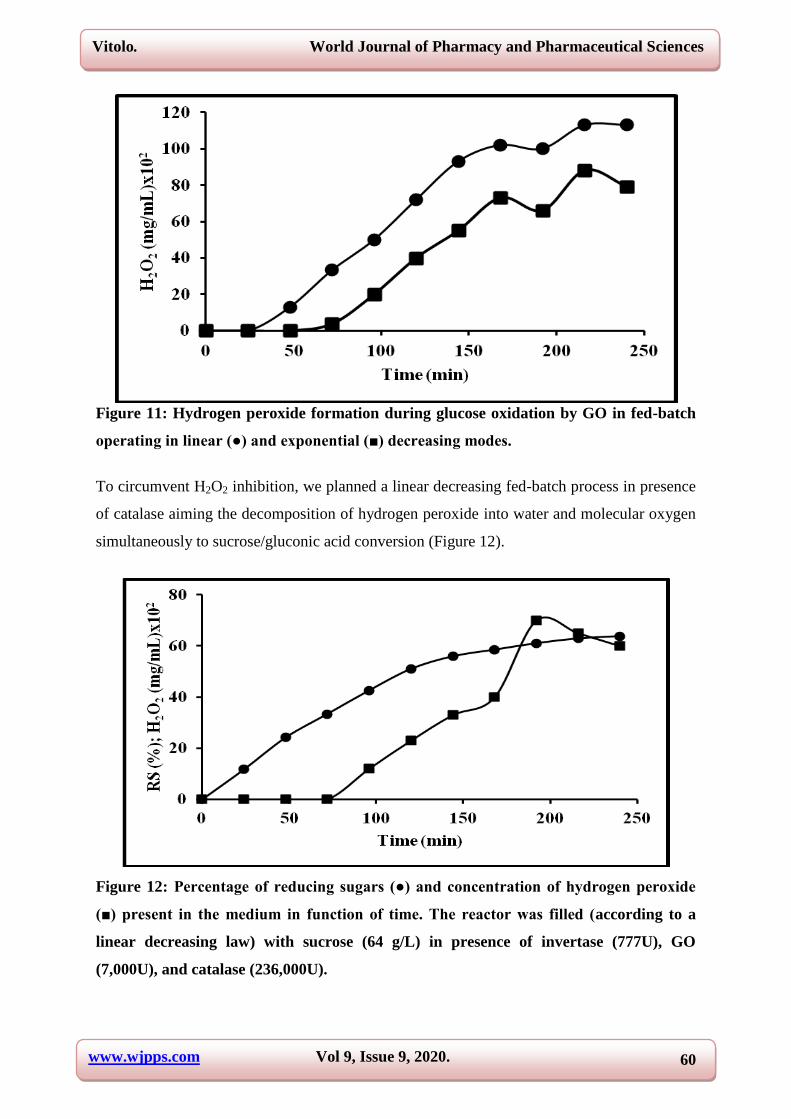
Figure 11: Hydrogen peroxide formation during glucose oxidation by GO in fed-batch
operating in linear (●) and exponential (■) decreasing modes.
To circumvent H2O2 inhibition, we planned a linear decreasing fed-batch process in presence
of catalase aiming the decomposition of hydrogen peroxide into water and molecular oxygen
simultaneously to sucrose/gluconic acid conversion (Figure 12).
Figure 12: Percentage of reducing sugars (●) and concentration of hydrogen peroxide
(■) present in the medium in function of time. The reactor was filled (according to a
linear decreasing law) with sucrose (64 g/L) in presence of invertase (777U), GO
(7,000U), and catalase (236,000U).

www.wjpps.com Vol 9, Issue 9, 2020.
61
Vitolo. World Journal of Pharmacy and Pharmaceutical Sciences
Figure 12 shows that the total percentage of reducing sugars was 63.75%, being 50% fructose
and 13.75% glucose. Thereby, the yield of gluconic acid was 72.5%. This yield is similar as
that obtained when the glucose oxidation occurred without catalase. We can thus assume that
glucose oxidation is the limiting step of sucrose/gluconic acid conversion as a consequence of
GO-Fe3+
formation. Similar tests conducted with catalase values over 236,000U were
impracticable due to the formation of a huge amount of bubbles inside the reactor.
In attempt to surpass the limiting yield of 72% of sucrose/gluconic acid conversion, we
designed a multi-enzyme test that operated the DC-MR in a continuous regime. Figures 13
and 14 show the preliminary results. .
Figure 13 shows that the steady-state occurred at all sucrose concentrations. The average
amount of reducing sugars was 3.30 g, 5.71 g, and 8.84 g for sucrose concentrations of 64
g/L, 100 g/L and 150 g/L, respectively. The yield (Y), expressed as gluconic acid/glucose
ratio (Eq. 16), was 92%, 80% and 76% for sucrose concentrations of 64 g/L, 100 g/L and 150
g/L, respectively (see Appendix).
Y = (GA)/(G)inlet = {(RSi) – [RSf – (F)]} (G)inlet (Eq. 16)
Where (GA) = gluconic acid (g), (G)inlet = amount of glucose to be oxidized by GO (g), (F) =
fructose (g), RSi = initial reducing sugars (g), and RSf = reducing sugars in the effluent (g).
Figure 13: Reducing sugars in function of time for continuous sucrose/gluconic acid
conversion. Operational conditions: flux of sucrose solution = 100 mL/h, residence time
= 3 h, medium volume = 300 mL, agitation = 120 rpm, 37 O
C, and pH 5.0. Sucrose
concentrations: 64 g/L (●), 100 g/L (O) and 150 g/L (■). The units of enzymes varied
www.wjpps.com Vol 9, Issue 9, 2020.
62
Vitolo. World Journal of Pharmacy and Pharmaceutical Sciences
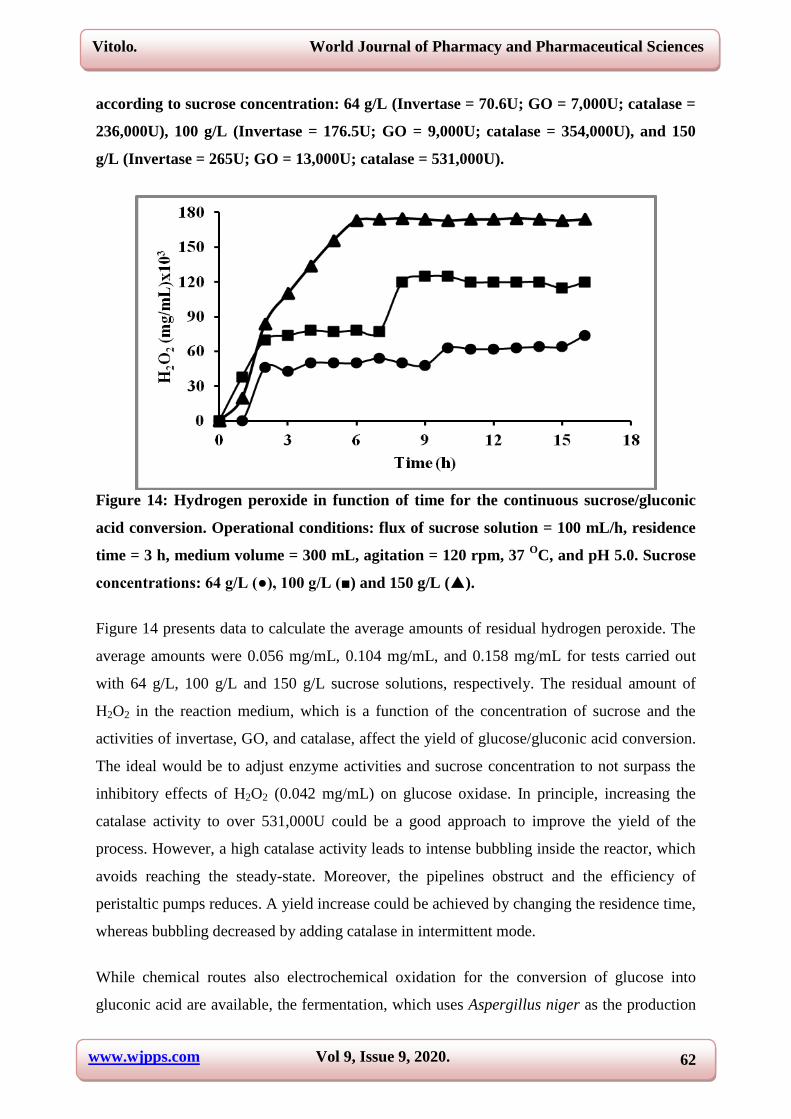
according to sucrose concentration: 64 g/L (Invertase = 70.6U; GO = 7,000U; catalase =
236,000U), 100 g/L (Invertase = 176.5U; GO = 9,000U; catalase = 354,000U), and 150
g/L (Invertase = 265U; GO = 13,000U; catalase = 531,000U).
Figure 14: Hydrogen peroxide in function of time for the continuous sucrose/gluconic
acid conversion. Operational conditions: flux of sucrose solution = 100 mL/h, residence
time = 3 h, medium volume = 300 mL, agitation = 120 rpm, 37 O
C, and pH 5.0. Sucrose
concentrations: 64 g/L (●), 100 g/L (■) and 150 g/L ().
Figure 14 presents data to calculate the average amounts of residual hydrogen peroxide. The
average amounts were 0.056 mg/mL, 0.104 mg/mL, and 0.158 mg/mL for tests carried out
with 64 g/L, 100 g/L and 150 g/L sucrose solutions, respectively. The residual amount of
H2O2 in the reaction medium, which is a function of the concentration of sucrose and the
activities of invertase, GO, and catalase, affect the yield of glucose/gluconic acid conversion.
The ideal would be to adjust enzyme activities and sucrose concentration to not surpass the
inhibitory effects of H2O2 (0.042 mg/mL) on glucose oxidase. In principle, increasing the
catalase activity to over 531,000U could be a good approach to improve the yield of the
process. However, a high catalase activity leads to intense bubbling inside the reactor, which
avoids reaching the steady-state. Moreover, the pipelines obstruct and the efficiency of
peristaltic pumps reduces. A yield increase could be achieved by changing the residence time,
whereas bubbling decreased by adding catalase in intermittent mode.
While chemical routes also electrochemical oxidation for the conversion of glucose into
gluconic acid are available, the fermentation, which uses Aspergillus niger as the production

www.wjpps.com Vol 9, Issue 9, 2020.
63
Vitolo. World Journal of Pharmacy and Pharmaceutical Sciences
organism, is the commercial process of choice. This process allows converting a glucose
solution at concentrations between 200g/L and 240g/L into gluconic acid with a yield of over
99%.[31]
Thereby, the multienzyme continuous sucrose/gluconic acid conversion must be
improved to compete with fermentation. Meanwhile, even yields between 75% and 95%
obtained in the continuous process could be competitive if we consider the complexity of
fermentation in relation to enzymatic conversion (Table 3).
Table 3: Comparison between fermentation and multienzyme catalysis in gluconic acid
production.
Fermentation Multienzyme catalysis in DC-MR
Microbial strain modified genetically. Commercial enzymes.
Decay of fermentative capability during the
process (strain returns to the wild stage).
Activities preserved provided that the
reaction conditions do not change.
Aseptic process. No asepsis.
Complex culture medium* Simple reaction medium.**
Cells discharged after fermentation. Enzymes recycled.
Glucose is the main substrate. Sucrose is the only substrate.
Glucose is a medium-cost reagent. Sucrose is a commodity.
Complex composition of effluent and residues Clean effluent and no residues.
Main products: gluconic acid and glucono -
lactone.
Main products: fructose and gluconic
acid.
Inoculum preparation and propagation require a
specific fermentation facility.
Enzymes are directly dissolved in the
reactor.
The fermenter is fed with sterilized air. The reactor is fed with ambient air.
High production cost. Medium production cost.
Complex kinetic process: cell growth and product
synthesis require hundreds of enzymes.
The kinetics of the process depends on
the action of three enzymes.
Downstream requires 6-7 stages. Downstream requires 2-3 stages.
Volume handling higher than 103 L. Volume handling lower than 10
3 L.
pH changes along the process; strict control
required.
pH constant throughout the process.
*Composition: glucose (200-250 g/L), corn steep liquor (3-4 g/L), urea (0.1-0.3 g/L),
MgSO4.7H2O (3-4 g/L), KH2PO4 (0.2-0.4 g/L), and (NH4)2HPO4 (0.4-0.6 g/L).
**Composition: 0.01 M acetate buffer (pH 5.0) and sucrose (64-150 g/L).
CONCLUSION
The data presented allow us to conclude that dead-end DC-MR operated in continuous mode
with a pool of enzymes (invertase, glucose oxidase, and catalase) results in sucrose/gluconic
acid conversion yields between 76% and 92% depending on the initial sucrose concentration
(64 g/L, 100 g/L, or 150 g/L). Moreover, fed-batch carried out in linear decreasing feeding
mode results in yields of 100% and 72% for sucrose hydrolysis and glucose oxidation,

www.wjpps.com Vol 9, Issue 9, 2020.
64
Vitolo. World Journal of Pharmacy and Pharmaceutical Sciences
respectively. In addition, when the multi-enzyme system was used under the same conditions,
the overall yield of sucrose/gluconic acid conversion was 72%. In this case, we did not obtain
a better conversion because the residual concentration of hydrogen peroxide was above 0.042
mg/mL, a condition that leads to a non-competitive inhibition of glucose oxidase.
Appendix
Fed-batch
Figure 15: Dead-end DC-MR operated in fed-batch mode.
The reactor is filled with a small volume of buffer solution containing the dissolved catalyst.
Volumes of substrate solution are added step by step up to a predetermined final volume. If
feeding is well planned, the end of reaction and the final volume are reached simultaneously.
No material is removed from the reactor (outlet zero), apart from normal sampling.
Moreover, the total quantity of material and the volume within the reactor increase in
function of time (Figure 15). In fed-batch, feeding obeys a specific addition law (exponential
decreasing, linear increasing, among others).[24]
The substrate (S) balance is
[Accumulation S rate] = [S feed rate in] – [S consumption rate] (I)

www.wjpps.com Vol 9, Issue 9, 2020.
65
Vitolo. World Journal of Pharmacy and Pharmaceutical Sciences
The total mass balance can be represented as
[Mass accumulation rate] = [Mass flow rate feeding] (II)
If the density of the reaction medium remains constant, the relation II is
[Reactor volume changing rate (dV/dt)] = [Feeding volumetric rate (F)] (III)
Thus, the relation III can be written as follows:
F = dV/dt (Eq. 17)
However, F can vary along the fed-batch regimen following a certain type of addition law,
for example: constant [F = (Vf – Vi)/t], linear increasing (F = Fo + k.t), linear decreasing (F =
Fo – k.t), exponential increasing (F = Fo.ekt
), and exponential decreasing (F = Fo.e-kt
). Where
Fo = initial rate feeding (L/h), k = constant of addition (L/h2 or h
-1), t = addition time (h), Vf =
final volume (L), and Vi = initial volume (L).
As an example we set the linear and exponential decreasing feeding laws for addition of a
substrate solution to a DC-MR.
Linear decreasing [k(L/h2)]
F = Fo – kt (Eq. 18)
Equaling equations 17 and 18
dV/dt = Fo - kt (Eq. 19)
Expanding the differential and making the algebraic rearrangements:
Vad = (V – Vi) = Fo.t – (k.t2)/2 (Eq. 20)
When t = [filling time (h)], then V = Vf. Therefore, equation 20 is
(Vf – Vi) = Fo. - (k.2)/2 (Eq. 21)
As feeding obeys a decreasing linear law, F is zero. The addition rate (F) decreases as the
medium volume inside the reactor (V) increases, which can only be zero at the limit (t = )!
Therefore, equation 19 is:
Fo = k. (Eq. 22)
www.wjpps.com Vol 9, Issue 9, 2020.
66
Vitolo. World Journal of Pharmacy and Pharmaceutical Sciences
Considering that, in this work, (Vf – Vi) = 0.3 L and = 1 h for fed-batch sucrose hydrolysis
by invertase, then equations 21 and 22 are:
0.3 = Fo – k/2 (Eq. 23)
Fo = k (Eq. 24)
By solving this equation system, k = 0.6 L/h2 and Fo = 0.6 L/h.
Replacing k and Fo in equation 20:
Vad = (V – Vi) = 0.6t – 0.3.t2 (Eq. 25)
Table 4 shows the results of setting a time interval for consecutive addition of sucrose
solution in the reactor, say t = 6 min (0.1 h), and using equation 25.
Exponential decreasing [k(h-1
)]
F = Fo.e-kt
(Eq. 26)
Equaling equations 17 and 26:
dV/dt = Fo.e-kt
(Eq. 27)
Expanding the differential and making the algebraic rearrangements:
Vad = (V – Vi) = -(Fo/k).(e-kt
-1) (Eq. 28)
When t = [filling time (h)], then V = Vf. Therefore, equation 28 is
(Vf – Vi) = -(Fo/k).(e-k
- 1) (Eq. 29)
Rearranging equation 28
- (Fo/k) = (V – Vi)/(e-kt
– 1) (Eq. 30)
Replacing equation 30 in equation 29
Vad = (Vf – Vi). [(e-kt
– 1)/(e-k
-1)] (Eq. 31)
Considering that, in this work, (Vf – Vi) = 0.3 L, = 1 h and k = 0.5 h-1
for fed-batch sucrose
hydrolysis by invertase, then equation 31 is:
Vad = 0.7621 – 0.7621.e-0.5t
(Eq. 32)
Table 4 shows the results of setting a time interval for consecutive addition of sucrose
solution in the reactor, say t = 6 min (0.1 h), and using equation 32.
www.wjpps.com Vol 9, Issue 9, 2020.
67
Vitolo. World Journal of Pharmacy and Pharmaceutical Sciences
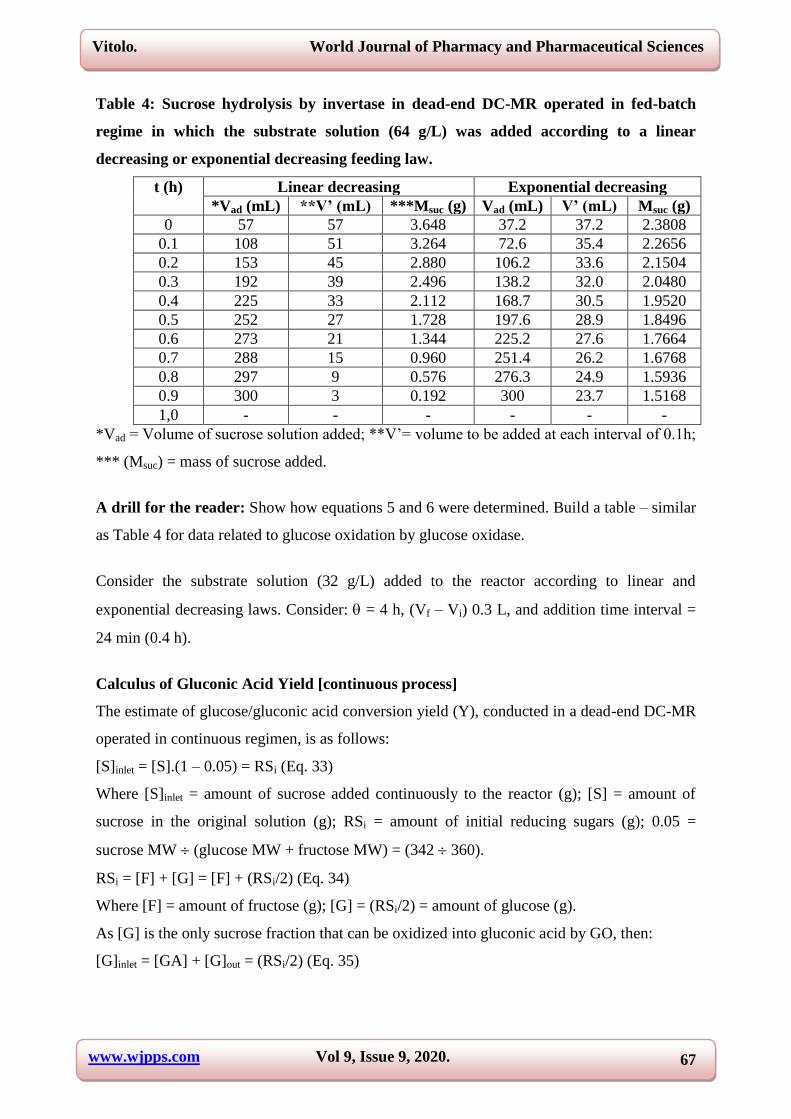
Table 4: Sucrose hydrolysis by invertase in dead-end DC-MR operated in fed-batch
regime in which the substrate solution (64 g/L) was added according to a linear
decreasing or exponential decreasing feeding law.
t (h) Linear decreasing Exponential decreasing
*Vad (mL) **V’ (mL) ***Msuc (g) Vad (mL) V’ (mL) Msuc (g)
0 57 57 3.648 37.2 37.2 2.3808
0.1 108 51 3.264 72.6 35.4 2.2656
0.2 153 45 2.880 106.2 33.6 2.1504
0.3 192 39 2.496 138.2 32.0 2.0480
0.4 225 33 2.112 168.7 30.5 1.9520
0.5 252 27 1.728 197.6 28.9 1.8496
0.6 273 21 1.344 225.2 27.6 1.7664
0.7 288 15 0.960 251.4 26.2 1.6768
0.8 297 9 0.576 276.3 24.9 1.5936
0.9 300 3 0.192 300 23.7 1.5168
1,0 - - - - - -
*Vad = Volume of sucrose solution added; **V’= volume to be added at each interval of 0.1h;
*** (Msuc) = mass of sucrose added.
A drill for the reader: Show how equations 5 and 6 were determined. Build a table – similar
as Table 4 for data related to glucose oxidation by glucose oxidase.
Consider the substrate solution (32 g/L) added to the reactor according to linear and
exponential decreasing laws. Consider: = 4 h, (Vf – Vi) 0.3 L, and addition time interval =
24 min (0.4 h).
Calculus of Gluconic Acid Yield [continuous process]
The estimate of glucose/gluconic acid conversion yield (Y), conducted in a dead-end DC-MR
operated in continuous regimen, is as follows:
[S]inlet = [S].(1 – 0.05) = RSi (Eq. 33)
Where [S]inlet = amount of sucrose added continuously to the reactor (g); [S] = amount of
sucrose in the original solution (g); RSi = amount of initial reducing sugars (g); 0.05 =
sucrose MW (glucose MW + fructose MW) = (342 360).
RSi = [F] + [G] = [F] + (RSi/2) (Eq. 34)
Where [F] = amount of fructose (g); [G] = (RSi/2) = amount of glucose (g).
As [G] is the only sucrose fraction that can be oxidized into gluconic acid by GO, then:
[G]inlet = [GA] + [G]out = (RSi/2) (Eq. 35)

www.wjpps.com Vol 9, Issue 9, 2020.
68
Vitolo. World Journal of Pharmacy and Pharmaceutical Sciences
Where [GA] = amount of gluconic acid (g); [G]out = residual amount of glucose (g); [G]inlet =
amount of glucose available to GO (g).
[G]out = RSf – [F] (Eq. 36)
Where RSf = final amount of reducing sugars (g).
Combining equations 35 and 36 and rearranging:
[GA] = (RSi/2) – {RSf – [F]} (Eq. 37)
Finally,
Y = [GA]/[G]inlet = 100.{(RSi/2) – (RSf – [F])} [G]inlet (Eq. 38)
As an example, below is the calculus of continuous multi-enzyme conversion of sucrose (64
g/L) at a feeding rate of 100 mL/h (Figure 13):
[S]inlet = 6.4 x 0.05 = 6.08 g = RSi
[G]inlet = 3.04 g and [F] = 3.04 g
RSf = amount of reducing sugars at the steady-state = 3.30 g
Y = [GA]/[G]inlet = 100. [3.04 – (3.30 – 3.04)]/3.04 = 91.5%
REFERENCES
1. Blanch HW, Clark DS. Biochemical Engineering. Marcel Dekker Inc, New York, 1996.
2. Romero L, Chávez R, Huerta-Ochoa S, Prado A. Biorreactores enzimaticos de
membrana: aplicaciones. In Reactores Enzimaticos. Huerta-Ochoa S (Ed.), Universidad
Autonoma Metropolitana, Mexico City, 2004; 93-124.
3. Yoriaz EJ, Vitolo M. Feasibility on using the membrane reactor for sucrose hydrolysis.
World Journal of Pharmacy and Pharmaceutical Sciences, 2014; 3(12): 66-72.
4. Di Addezio F, Yoriyaz EJ, Cantarella M, Vitolo M. Sucrose hydrolysis by invertase using
a membrane reactor: effect of membrane cut-off on enzyme performance. Brazilian
Journal of Pharmaceutical Sciences, 2014; 50(2): 257-259.
5. Nakajima M, Nishizawa K, Nabetani HA. A forced flow membrane enzyme reactor for
sucrose inversion using molasses. Bioprocess Engineering, 1993; 9: 31-35.
6. Lee SG, Kim HS. Optimal operating policy of the ultrafiltration membrane bioreactor for
enzymatic hydrolysis of cellulose. Biotechnology and bioengineering, 1993; 42: 737-746.
7. Molinari R, Drioli E, Barbieri G. Membrane reactor in fatty acid production. Journal
Membrane Science, 1988; 36: 525-534.

www.wjpps.com Vol 9, Issue 9, 2020.
69
Vitolo. World Journal of Pharmacy and Pharmaceutical Sciences
8. Darnoko D, Cheryan M, Artz WE. Saccharification of cassava starch in an ultrafiltration
reactor. Enzyme and Microbial Technology, 1989; 11: 154-159.
9. Wandrey C, Fiolitakis E, Wichmann U. L-amino acids from a racemic mixture of -
hydroxy acids. Annals of New York Academy of Science, 1984; 434: 91-94.
10. Wichmann U, Wandrey C, Hummel W, Schette H, Buckmann AF, Kula MR. Enzymatic
production of optically active 2-hydroxy acids. Annals of New York Academy of
Science, 1984; 434: 87-90.
11. Berke W, Morr M, Wandrey C, Kula MR. Continuous regeneration of ATP for enzymatic
synthesis. Annals of New York Academy of Science, 1984; 434: 257-258.
12. Kulbe KD, Horwald MW, Schmidt K, Rothing TR, Chmiel H. Rejection and continuous
regeneration of the native coenzyme NAD(P)H in a charged ultrafiltration membrane
enzyme reactor. Annals of New York Academy of Science, 1984; 434: 820-826.
13. Yonese M, Murabayashi H, Kishimoto H. Diffusion-reaction of urea through
multimembrane containing urease. Journal of Membrane Science, 1990; 54: 145-162.
14. Park TH, Kim IH, Chang HN. Recycled hollow fiber enzyme reactor with flow swing.
Biotechnology and Bioengineering, 1985; 27: 1185-1191.
15. Van der Padt A, Sewalt JJW, Van’t Riet K. Enzymatic acylglycerols synthesis in a
membrane bioreactor. Journal American Oil Chemistry Society, 1990; 67: 347-352.
16. Guit RPM, Kloosterman M, Meindersma GW, Mayer M, Meijer EM. Lipase kinetics:
hydrolysis of triacetin by lipase from Candida cylindracea in a hollow fiber membrane
reactor. Biotechnology and Bioengineering, 1991; 38: 727-732.
17. Guebara SAB, Araújo MCE, Ract JNR, Vitolo M. Lipase catalyzed esterificiation of
caprylic acid with residual glycerol from biodiesel production. World Journal of
Pharmaceutical Sciences, 2016; 4(6): 362-375.
18. Steinstraesser GC, Gioielli LA, Vitolo M. Monocaprylin and dicaprylin production by
immobilized lipase using batch and fed-batch operating modes. World Journal of
Pharmacy and Pharmaceutical Sciences, 2019; 8(11): 215-232.
19. Monsan P, Paul F. Novel enzymatic synthesis of oligosaccharides and polysaccharides.
In: Food Enzymology, Fox PF (Ed.). Elsevier, UK, 1991; 69-81.
20. Taraboulsi-Jr FA, Yoriyaz EJ, Vitolo M. Enzymatic conversion of sucrose into gluconic
acid by a fed-batch process operated in the constant feeding mode. In: European Biomass
Conference and Exibition, Viena, 2015; 23: 1220-1223.
www.wjpps.com Vol 9, Issue 9, 2020.
70
Vitolo. World Journal of Pharmacy and Pharmaceutical Sciences
21. Vitolo M. Invertase activity of intact Saccharomyces cerevisiae cells cultured in
sugarcane molasses by batch fermentation process. World Journal of Pharmacy and
Pharmaceutical Sciences, 2019; 8(3): 126-137.
22. Vitolo M. Adsorption of invertase on anionic resin. European Journal of Pharmaceutical
and Medical Research, 2020; 7(7): 113-117.
23. Vitolo M. Effect of freezing on invertase activity of Saccharomyces cerevisiae cell.
World Journal of Pharmaceutical Research, 2020; 9(6): 120-131.
24. Rocha-Filho JA, Vitolo M. Guide for Practices in Biotechnology of Enzymes and
Fermentation. Edgard Blücher, São Paulo, Brazil, 2017.
25. Taraboulsi FA, Vitolo M. Quantification of hydrogen peroxide in presence or absence of
reducing sugars using the Somogyi-Nelson method. Analytica, 2010; 8: 86-93.
26. Mansour EH, Dawoud M. Immobilization of invertase on celite and on polyacrylamide by
an absorption procedure. Journal of the Science of Food and Agriculture, 2003; 83:
446-450.
27. Raba J, Mottola HA. Glucose oxidase as an analytical reagent. Critical Review analytical
Chemistry, 1995; 25(1): 1-42.
28. Bao J, Furumoto K, Fukunaga K, Nakao K. A kinetic study on air oxidation of glucose
catalyzed by immobilized glucose oxidase for production of calcium gluconate.
Biochemical Engineering Journal, 2001; 8: 91-102.
29. Tomotani EJ, Neves LCM, Vitolo M. Oxidation of glucose to gluconic acid by glucose
oxidase in membrane bioreactor. Applied Biochemistry and Biotechnology, 2005; 121:
149-162.
30. Neves LCM, Vitolo M. Use of glucose oxidase in a membrane reactor for gluconic acid
production. Applied Biochemistry and Biotechnology, 2007; 136: 161-170.
31. Crognale S, Petruccioli M, Fenice M, Federici F. Fed-batch gluconic acid production
from Penicillium variabile P16 under different feeding strategies. Enzyme and Microbial
Technology, 2008; 42: 445-449.