memo status - nmdhb.govt.nz€¦ · our community can have confidence that when they need care,...
TRANSCRIPT

Chief Executive’s Report 5-1
MEMO
To: Board Members
From: Peter Bramley, Chief Executive
Date: 18 April 2018
Subject: Chief Executive’s Report
1. INTRODUCTORY COMMENTS I have been concerned at the focus being given in various media outlets to the apparent failures in our health care system. There is no question that the health system in NZ is under pressure from an ageing demographic, a rise in chronic conditions, and the impact of wider social issues on people’s health. We see this pressure particularly at the “front door” of health services – our GPs, Hospital Emergency Departments, and our Mental Health services. Unfortunately media attention, while right to highlight challenges in service provision and the inadequacies of buildings, can leave our community starting to wonder whether they can have confidence in our health system. I believe we have a health system to be proud of, both locally and nationally. Our staff are the “jewels” in the “health crown”. We are so fortunate here in Nelson Marlborough to have so many dedicated, talented and experienced people working in our health system. Our community can have confidence that when they need care, when they are acutely unwell, there is a health system that is responsive, delivers great care, and achieves health outcomes for our population that stands up strongly when compared internationally. There is plenty of talk of the chronic underfunding of healthcare. No question we too are under pressure to deliver healthcare for our community with the resources we are given. We do get close to half a billion dollars of funding each year, but with rising costs and increasing demand we never feel there is enough. This month we were overspent by close to 1 Million dollars. Most of this overspend is in hospital staff costs, pharmaceutical spend and patient transport costs – all areas where we needed to spend to deliver safe and appropriate care. We hope our planning and funding advice for 2018/19 goes someway to ensuring our local health system is better resourced. There is plenty of opportunity, however, for us to think about how we can remove the waste and duplication in our current healthcare models, and creatively think about ways that we can reconfigure how healthcare is delivered locally that makes better use of the dollars provided. Let us keep appreciating the strengths of our current healthcare system, while supporting the changes and resources needed to ensure it is fit for the future healthcare needs of our community. 2. PRIMARY & COMMUNITY
Work on the Model of Care (MoC) programme is well underway. The Clinical Working Group (CWG) was formed and the first meeting held on 26 March 2018. Underpinning Design Principles and Requirements, have been produced for the MoC programme. The documents will provide guidance on activities and decisions for the programme. Other documents such as the risk register, stakeholder and engagement plan and programme charter are close to final draft.
Richard Bohmer visited in early April and provided valuable insights and support as we get underway on the Model of Care work.
Status This report contains: For decision Update Regular report
For information
Chief Executive’s Report 5-2
The Hospital Pharmacies have been busy with what seems to be higher summer volumes and increasingly complex patients. In Community Pharmacy, consultation began in late March, on the proposed new contract Integrated Pharmacist Services in the Community Agreement (IPSCA). Work continues on reviewing our compliance with Pharmac's restrictions when high cost, low volume medicines are prescribed. Dispensing volumes keep increasing and this is expected to continue as Baby Boomers get older and are prescribed more medicines. The Community Pharmacy Sector is generally nervous about the change, however some Pharmacies are very enthusiastic about new services being offered with the new contract.
Pay Equity work is now extended via a formal claim, to the Mental Health workforce; work is also underway to include payment of pay equity funds into day programme contracts, similar to how ARC is funded for pay equity. There are complex wider government expectations of DHBs as employers and funders to progress “equity” proactively across the following domains regardless of a formal claim:
Pay equity – the same pay for work of equal value
Equal pay – the same pay for the same work
Pay relativity – the relationship between pay rates for various roles/work
Gender pay gap – the gap between the average earnings of men and women
Pay and employment equity – pay, conditions, experiences in the workplace, access to training and jobs at all levels are not affected by gender.
An End of Life Care workshop facilitated with NMH Board, ELT and key community stakeholders was held in March. The workshop was held to inform the models of care work, as well as identifyneeds in the community that need to be addressed. A regional workshop was held in Christchurch to discuss Advanced Care Planning and the implementation of the new HQSC programme. NMH ACP Programme implementation continues with conversations with both PHOs to support recruitment of facilitators.
Home and Community Support Services (HCSS) development of the intensive intervention component continues; including InterRAI profiles for at risk clients and service specifications for Nurse Practitioner interventions across the community based service. NMH continue to build relationships with the two HCSS providers.
Aged Residential Care admissions remain stable in Hospital Level Care. There has been an increase in bed utilisation at rest home level care (5 beds average) for March. All eighteen D6 psychogeriatric beds are full.
Dr Peter Jones has been appointed to the Rheumatology service, initially commuting and then shifting to Nelson and working 0.5FTE from September.
Cervical screening rates show an overall improvement for Maori, Pacific and Asian. The targeted approach to the priority groups will continue at practice level.
A Winter Action Plan is being developed to look at enhanced vaccination options and planning for increased service demand across primary and secondary care.
Currently work focuses on extending the Stop Smoking Service incentives programme to whanau of children with respiratory conditions identified in the hospital.
A procurement process is underway with evaluation of Interpreters proposals just completed; and a discussion with a possible provider to occur.
It seems likely that NMH will achieve the Obesity Health target for Quarter 3, and with a low rate of declines. Work needs to occur on ensuring children are then accessing a community based service.

Chief Executive’s Report 5-3
From the beginning of April, MSD can now refer to the PHOs to navigate new families to the region with children under 5 to a funded initial GP consult and enrolment.
The Public Health Service (PHS) was notified of an outbreak of gastroenteritis among a school group from Wellington staying at Teapot Valley in Tasman (120 children and parents). PHS was informed of the illness when the group were planning to travel back to Wellington. Advice was given for symptomatic students and adults not to travel; however, this was not fully adhered to. Significant work from Public Health Service working with MoH, Regional Public Health, Wellington and the ferries companies took place in March. PHS is supporting the ferry companies to develop a shared procedure to support them in these situations.
3. CLINICAL SERVICES
Inpatient Medicine continued to be busy in Nelson through March with the need to open additional beds in Ward 10 (8 days) and Day Stay Unit (6 days). Wairau had a reasonably quiet month with low occupancy throughout March.
Managing demand to capacity has become a frequent discussion point during March as we breached our promise to patients in regards to timely care in a number of specialities, including FSA, follow up and treatment. Collectively we need to find a solution to the increasing demand for acute and elective services for our population, which highlights the importance of the various Model of Care workstreams getting underway.
NMDHB performed well in the latest AROC data with Nelson ATR data showing 94% of patients left the unit with increased function post rehabilitation compared with the national benchmark of 92%.
The first Dermatology clinic as been held with the Specialist from CCDHB.
There were a total of 57 day of surgery postponements in March (43 for Nelson; 14 for Wairau. Nine of these were acute patients. The main reasons were:
11 patients – operation no longer required
10 patients – acutely unwell
9 patients – insufficient operating time in the current list
7 patients – DNA (self-cancelled)
7 patients – medical staff not available.
All resources are now employed and fully staffed in the Referral Centre at Wairau Hospital. All services within secondary services are now operating through the Referral Centre.
Pre-surgical Administration Centre (PAC) resources in Nelson are now all employed. All services expect for orthopaedics are now in the PAC in Nelson. PAC Wairau is now delayed until after SI PICS implementation.
The Clinical Coding service review by the Coding Manager of SDHB is planned for mid-April.
4. MENTAL HEALTH & ADDICTIONS AND DSS
The Quality Improvement forum for MH&A has been reformed with a new TOR and membership. This group will support ongoing service improvement initiatives, monitor and facilitate implementation of recommendations from serious incidents, reviews and safety first reporting, will facilitate collection and analysis of data and will ensure compliance requirements are fulfilled, including the review of policies, procedures and guidelines.
The Ministry of Health Mental H&A Inquiry will visit Nelson Marlborough on 4 May.

Chief Executive’s Report 5-4
4.1 Integration Programme
The initiatives from the work streams have now been allocated a lead point of contact within secondary services, and have been prioritised into an annual work plan for 2018/19.
4.2 Inpatient Occupancy
4.3 Quality & Safety (including Alexandra Hospital)

Chief Executive’s Report 5-5
4.4 Activity – Specialist
4.5 Seclusion
There has been a decrease in the number of patients, total seclusion hours and the maximum time spent in seclusion. There is increased awareness amongst staff to look at alternative ways of managing aggressive and violent behaviour.
January February March
Total number of patients 10 11 6
Total number of hours 273 257 64
Maximum hours in Seclusion 113 hrs 95 hrs 38 hrs
Minimum hours in seclusion 4 hrs 1 hr 20 mins 30 mins
Maori 2 1 2

Chief Executive’s Report 5-6
4.6 Disability Support Services
Disability Support Services (DSS)
ID PD LTCH Total YTD Total
Current Moh
Contract
As per Contracts at month
end 168 15 183 Redn 1
Beds – Moh
Individual contracts
As per Contracts at month
end 11 2 13
Beds – S&P-
Chronic Health
Conditions
As per Contracts at month
end 1 13 14
Beds – Individual
contracts with ACC
As per Contracts at month
end 1 1 2
Beds – Others -
CY&F & Mental
Health 2 1 3 Redn 1
Residential contracts -
Actual at month end 183 19 13 215
Total number of
people supported
Residential service users -
Actual at month end 183 19 13 215 Redn 2
Respite service users -
Actual at month end 1 2 3
Child Respite service users -
Actual at month end 15 15
Personal cares service
users - Actual at month end 0 1 1
Total number of people
supported 199 22 13 234
** Includes Child
respite
Total Available Beds -
Service wide Count of ALL bedrooms 235 ** Includes Child respite 4 beds
Total available bed days 7,285 63,960
Total Occupied Bed
days
Actual for full month -
includes respite 6,781 59,512
Total Occupied Beds
Based on actual bed days
for full month (includes
respite volumes) 93.1% 93.0%
Last
month
Current
month Variance
236 234 2-
Referrals (excludes
respite)
Total long term residential
referrals 9 10
New Referrals in the month 3 6
Of above total
referrals Transitioning to service - -
On Waiting List 9 10
Vacant Beds at End
of month 10 14
Less people transitioning to
service -
Vacant Beds 10 14
Current March 2018 YTD March 2018
Total number of people supported
Contracted Services
Number of people supported

Chief Executive’s Report 5-7
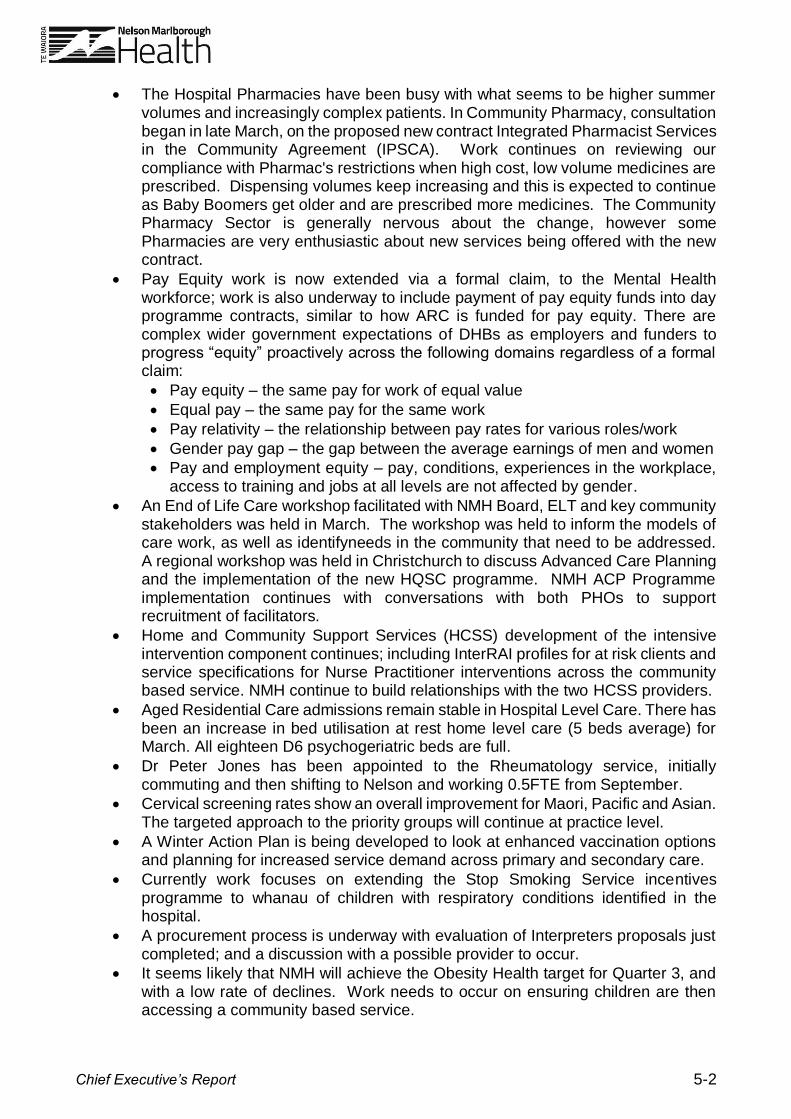
5. PERFORMANCE INFORMATION 5.1 Shorter Stays in Emergency Department
In March the NMH Emergency Department target of 95% within 6 hours was achieved at both sites.
Length of stay target for past 3 months
January 2018 February 2018 March 2018
Total <6hrs Total <6hrs Total <6hrs
Nelson 2,521 2,362
93.69% 2,442 2,264
93.69% 2,286 2,175
95.14%
Wairau 1,513 1,423
94.05% 1,489 1,452
97.52% 1,532 1,452
96.67%
Emergency Department Nelson There was a 4.3% increase in the number of presentations in March 2018 (2,291) from February 2018 (2,195). There was also a 6% drop in comparison to March 2017.
90.0%
92.0%
94.0%
96.0%
98.0%
100.0%
120
122
124
126
128
130
132
134
136
138
Sep
-16
Oct
-16
No
v-1
6
Dec
-16
Jan
-17
Feb
-17
Mar
-17
Ap
r-1
7
May
-17
Jun
-17
Jul-
17
Au
g-1
7
Sep
-17
Oct
-17
No
v-1
7
Dec
-17
Jan
-18
Feb
-18
Mar
-18
NMDHB ED Performance
Presentations Per Day NMDHB 6 Hr Target Results ED 6 Hour Target
15.0%
20.0%
25.0%
30.0%
35.0%
40.0%
45.0%
Sep
-16
Oct
-16
No
v-1
6
Dec
-16
Jan
-17
Feb
-17
Mar
-17
Ap
r-1
7
May
-17
Jun
-17
Jul-
17
Au
g-1
7
Sep
-17
Oct
-17
No
v-1
7
Dec
-17
Jan
-18
Feb
-18
Mar
-18
% of ED Attendances Admitted
Total ED Admissions Nelson ED Admissions Wairau ED Admissions
90.0%
92.0%
94.0%
96.0%
98.0%
100.0%
64
69
74
79
84
Sep
-16
Oct
-16
No
v-1
6
Dec
-16
Jan
-17
Feb
-17
Mar
-17
Ap
r-1
7
May
-17
Jun
-17
Jul-
17
Au
g-1
7
Sep
-17
Oct
-17
No
v-1
7
Dec
-17
Jan
-18
Feb
-18
Mar
-18
Nelson ED Performance
Presentations Per Day NMDHB 6 Hr Target Results ED 6 Hour Target
92.0%
93.0%
94.0%
95.0%
96.0%
97.0%
98.0%
48 49 50 51 52 53 54 55 56 57
Sep
-16
Oct
-16
No
v-1
6
Dec
-16
Jan
-17
Feb
-17
Mar
-17
Ap
r-1
7
May
-17
Jun
-17
Jul-
17
Au
g-1
7
Sep
-17
Oct
-17
No
v-1
7
Dec
-17
Jan
-18
Feb
-18
Mar
-18
Wairau ED Performance
Presentations Per Day NMDHB 6 Hr Target Results ED 6 Hour Target
Chief Executive’s Report 5-8
Emergency Department Wairau There was a drop in the number of presentations in February 2018 (1,224) from February 2017 (1,516). Wairau ED are noticing the positive impact of the Marlborough Urgent Care Centre.

Chief Executive’s Report 5-9
5.2 Hospital Occupancy / Acute Demand
5.3 Elective / Acute Arranged Services
Year to date internal results to the end of March indicate NMDHB has delivered 5,930 discharges against a plan of 5,643 (a total delivery above plan of 287 discharges). This is likely to increase as IDF patients are finalised at MoH.
Ministry of Health finalised results to the end of February indicate -313 discharges against plan (93.7%). This is due to coding not being completed. Quarter 2 results show 96.7%.
0
100
200
300
400
500
600
700
800
900
1,000
Jan
-17
Feb
-17
Mar
-17
Ap
r-1
7
May
-17
Jun
-17
Jul-
17
Au
g-1
7
Sep
-17
Oct
-17
No
v-1
7
Dec
-17
Jan
-18
Feb
-18
Mar
-18
Acute CWDs Nelson
Medical Acute CWDs Surgical Acute CWDs Neonatal & Maternity Acute CWDs
0
100
200
300
400
500
600
700
800
900
1,000
Jan
-17
Feb
-17
Mar
-17
Ap
r-1
7
May
-17
Jun
-17
Jul-
17
Au
g-1
7
Sep
-17
Oct
-17
No
v-1
7
Dec
-17
Jan
-18
Feb
-18
Mar
-18
Elective CWDs - Nelson
Medical Elective CWDs Surgical Elective CWDs
0
50
100
150
200
250
300
350
400
450
Jan
-17
Feb
-17
Mar
-17
Ap
r-1
7
May
-17
Jun
-17
Jul-
17
Au
g-1
7
Sep
-17
Oct
-17
No
v-1
7
Dec
-17
Jan
-18
Feb
-18
Mar
-18
Acute CWDs - Wairau
Medical Acute CWDs Surgical Acute CWDs Neonatal & Maternity CWDs
0
50
100
150
200
250
300
350
400
450
Jan
-17
Feb
-17
Mar
-17
Ap
r-1
7
May
-17
Jun
-17
Jul-
17
Au
g-1
7
Sep
-17
Oct
-17
No
v-1
7
Dec
-17
Jan
-18
Feb
-18
Mar
-18
Elective CWDs - Wairau
Medical Elective CWDs Surgical Elective CWDs

Chief Executive’s Report 5-10
ESPI 2 was red for the month of March, with 98 patients not being seen within 120 days of referral acceptance. ESPI 5 was yellow for the month of March, with 13 patients not being treated within 120 days of being given certainty. Key areas of concern include Dermatology, ENT, General Surgery, and Urology.
Chief Executive’s Report 5-11
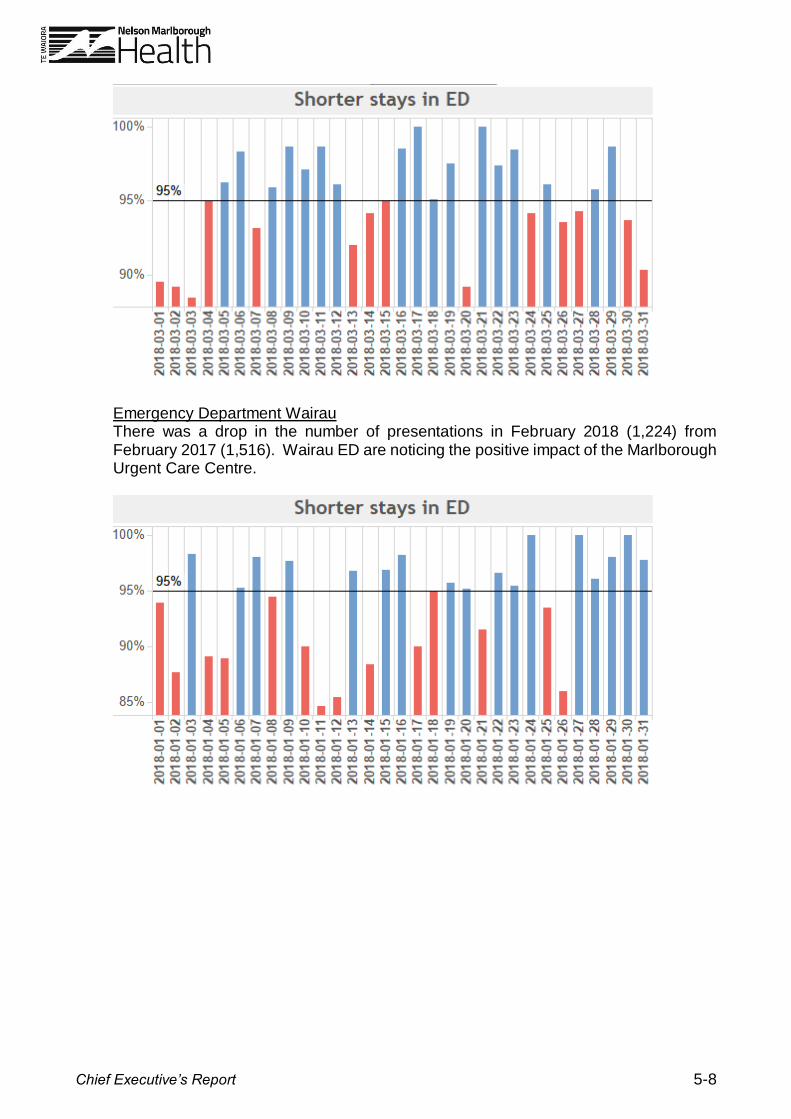
5.4 Enhanced Access to Diagnostics
MoH MRI performance shows 51% of referrals accepted are scanned within 42 days (target is 85%). Machine capacity remains the challenge with this target. MoH CT performance is 70% scanned within 42 days (target is 95%).
0
20
40
60
80
100
Mar
-17
Ap
r-1
7
May
-17
Jun
-17
Jul-
17
Au
g-1
7
Sep
-17
Oct
-17
No
v-1
7
De
c-1
7
Jan
-18
Feb
-18
Mar
-18
Diagnostic Reporting Template - CT (DHB wide) Total Number accepted referrals
waiting outside 6 weeks (excluding referrals for scans that are planned patient
events)
Diagnostic ReportingTemplate - CT (DHB wide)Total Number acceptedreferrals waiting outside 6weeks (excluding referrals forscans that are planned patientevents)

Chief Executive’s Report 5-12
5.5 Improving Diagnostic Waiting Times – Colonoscopy Results for March indicate that we met all targets for urgent and non-urgent diagnostic colonoscopy. Surveillance colonoscopy is sitting at 57.2% of patients being scoped within 84 days of their scheduled date, and 65.8% of patients being scoped within 120 days of their scheduled date.
0
50
100
150
200
250
Mar
-17
Ap
r-1
7
May
-17
Jun
-17
Jul-
17
Au
g-1
7
Sep
-17
Oct
-17
No
v-1
7
De
c-1
7
Jan
-18
Feb
-18
Mar
-18
Diagnostic Reporting Template - MRI Total Number accepted referrals
waiting outside 6 weeks (excluding referrals for scans that are planned
patient events)
Diagnostic ReportingTemplate - MRI TotalNumber accepted referralswaiting outside 6 weeks(excluding referrals forscans that are plannedpatient events)
02468
101214161820
Mar
-17
Ap
r-1
7
May
-17
Jun
-17
Jul-
17
Au
g-1
7
Sep
-17
Oct
-17
No
v-1
7
De
c-1
7
Jan
-18
Feb
-18
Mar
-18
Diagnostic Reporting Template - CTCTotal number accepted referrals waiting outside 6 weeks (excluding referrals for scans that are planned patient events
Series2
0.0%
20.0%
40.0%
60.0%
80.0%
100.0%
Oct
-16
No
v-1
6
Dec
-16
Jan
-17
Feb
-17
Mar
-17
Ap
r-1
7
May
-17
Jun
-17
Jul-
17
Au
g-1
7
Sep
-17
Oct
-17
No
v-1
7
Dec
-17
Jan
-18
Feb
-18
Mar
-18
Urgent Diagnostic Colonoscopy
Actual % treated < 14 days Target % treated < 14 days
0.0%
20.0%
40.0%
60.0%
80.0%
100.0%
Non Urgent Diagnostic Colonoscopy
Actual % treated < 42 days Target % treated < 42 days
0.0%
20.0%
40.0%
60.0%
80.0%
100.0%
Oct
-16
No
v-1
6
Dec
-16
Jan
-17
Feb
-17
Mar
-17
Ap
r-1
7
May
-17
Jun
-17
Jul-
17
Au
g-1
7
Sep
-17
Oct
-17
No
v-1
7
Dec
-17
Jan
-18
Feb
-18
Mar
-18
Surveillance Colonoscopy
Actual % treated < 84 days Target % treated < 84 days
Chief Executive’s Report 5-13
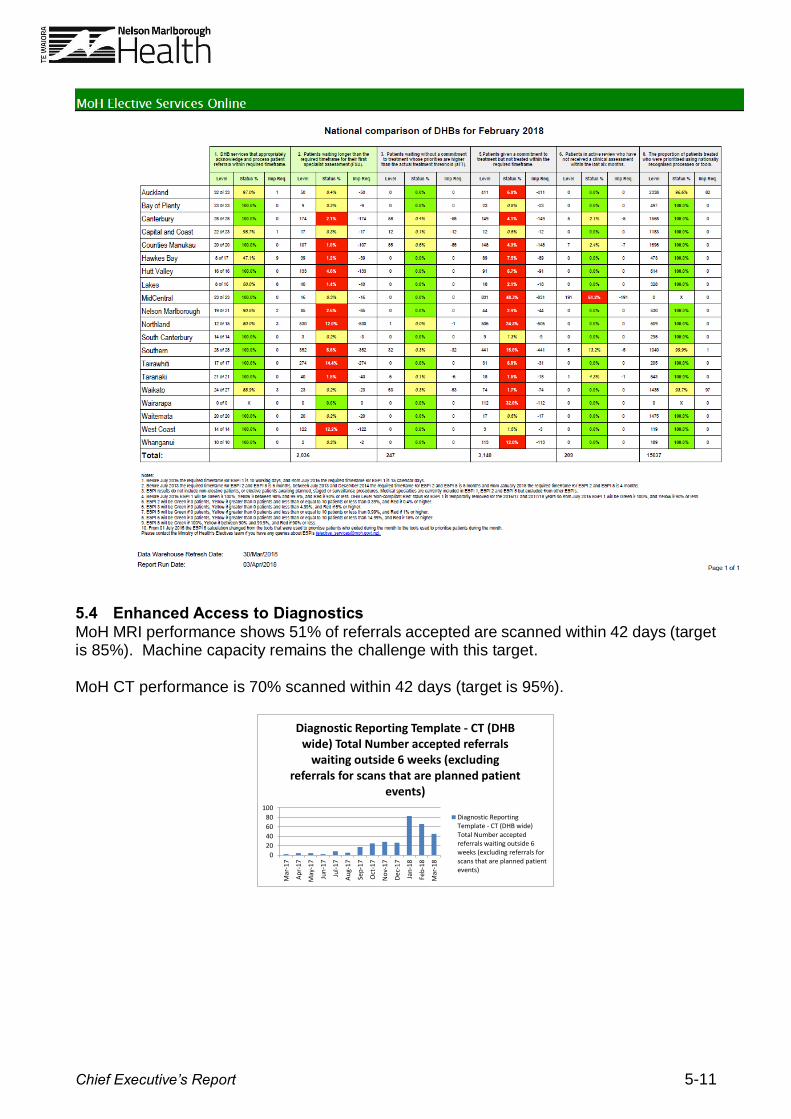
5.6 Faster Cancer Treatment – Oncology
6. MĀORI HEALTH 6.1 Hauora Direct Hauora Direct is a 360 degree health assessment of an individual’s health needs and will be conducted by health professionals in multiple settings. The GM Māori Health & Vulnerable Populations has met with the Charge Nurse of Paediatrics who has agreed to integrate Hauora Direct into their ward admissions process. Further there is verbal agreement from the ADOM that the Midwives within the DHB will look to adopt the tool. Victory Community Centre has adopted the Hauora Direct tool and the newly established Tahuna Community Centre nursing service is also adopting the tool.
FCT Monthly Report - March 2018 Reporting Month: Feb 2018 - Quarter 3 - 2017-2018
As at 26/03/2018
62 Day Indicator Records
TARGET SUMMARY
Within 62
Days
Exceeded
62 Days
Within 62
Days
Exceeded
62 Days
Within 62
Days
Exceeded
62 Days
Within 62
Days
Exceeded
62 Days
Within 62
Days
Exceeded
62 Days
Within 62
Days
Exceeded
62 Days
Within 62
Days
Exceeded
62 Days
Within 62
Days
Exceeded 62
Days
84% 16% 85% 15% 74% 26% 82% 18% 89% 11% 89% 11% 91% 9% 94% 6%
Number of Records 21 4 28 5 14 5 63 14 75 9 214 27 302 30 308 21
Total Number of Records
Numbers Including all Delay Codes 84% 16% 82% 18% 61% 39% 77% 23% 82% 18% 81% 19% 83% 17% 86% 14%
Number of Records 21 4 28 6 14 9 63 19 75 16 214 49 302 62 308 49
Total Number of Records
90% of patients had their 1st treatment
within: # days
62 Day Delay Code Break Down
01 - Patient Reason (chosen to delay)
02 - Clinical Cons. (co-morbidities)
03 - Capacity Constraints
FCT Monthly Report - March 2018 Reporting Month: Feb 2018 - Quarter 3 - 2017-2018
As at 27/03/2018
62 Day Indicator Records continued
TUMOUR STREAM12 Months to Date (Apr 17-Mar18) Column1
Brain/CNS 100% 1 0% 0 1 African 100% 1 0% 0 1
Breast 100% 44 0% 0 44 Asian - not further defined #DIV/0! 0 #DIV/0! 0 0
Gynaecological 86% 18 14% 3 21 Chinese 0% 0 100% 1 1
Haematological 84% 21 16% 4 25 Don't Know #DIV/0! 0 #DIV/0! 0 0
Head & Neck 63% 20 38% 12 32 European - not further defined 75% 9 25% 3 12
Lower Gastrointestinal 79% 48 21% 13 61 Indian 0% 0 100% 1 1
Lung 57% 21 43% 16 37 Not stated 100% 5 0% 0 5
Other 100% 3 0% 0 3 NZ European 85% 257 15% 45 302
Sarcoma 100% 1 0% 0 1 NZ Maori 64% 9 36% 5 14
Skin 98% 87 2% 2 89 Other Asian 100% 1 0% 0 1
Upper Gastrointestinal 73% 11 27% 4 15 Other European 76% 19 24% 6 25
Urological 77% 27 23% 8 35 Response unidentifiable #DIV/0! 0 #DIV/0! 0 0
Blank #DIV/0! 0 #DIV/0! 0 0 Samoan #DIV/0! 0 #DIV/0! 0 0
Grand Total 83% 302 17% 62 364 50% 1 50% 1 2
83% 302 17% 62 364
Completed Records
Exceeded
62 Days
Total
Records
Within 62
Days
Within
62 Days
59
Mar-18
(in progress)
0 0 1
Financial Year to
Date
2
ETHNICITY12 Months to Date (Apr 17-Mar18)
Exceeded
62 Days
21
Uncoded = 6
(Started 01/07/17 -
Mandatory from
01/01/17)
Year to Date
Apr 17-Mar 18
332
(Started 01/07/17 -
Mandatory from
01/01/17)
364
84
Year to Date
Apr 17-Mar 18
3
Quarter 2
0
71
Previous Financial Year
(2016-2017)
329
357
(85% target)
Previous Year
(2016-2017)
2
Numbers as Reported by MOH
(Capacity Constraint delay only)
Financial Year to
Date
241
263
76
25 33 19 77
25 34 23 82 91
Mar-18
(in progress)Feb-18 Jan-18
Quarter 3
(in progress)Quarter 2
55 77 7096 83
Jan-18
1
3
5
20
27
4
14
7
9
Quarter 3
(in progress)Feb-18
Exceeded
62 Days
Within 62
Days
Within
62 Days
0
4
1
5
29
30
Exceeded
62 Days
Total
Records
Grand Total
Southeast Asian
20

Chief Executive’s Report 5-14
Nelson Bays Primary Health’s Kaiatawhai service has also agreed to pilot the tool for Māori whanau in the first instance. 7. CLINICAL GOVERNANCE 7.1 Service User Complaints
There were 45 complaints received for March compared to 23 the previous month. Four new HDC complaints were received in March. Six responses were sent to HDC, two of which were in response to additional information requests awaiting decision. Eleven HDC decisions are still awaiting findings.
8. COMMUNICATIONS 8.1 Screen Media The installation of a screen media (TV screen with slideshow) in the Nelson Hospital café is a new communications channel to reach staff, patients and visitors. Our next step is to extend this to the Wairau Hospital café. Most of the café slideshow content builds on promotional material used simultaneously elsewhere, as part of agreed communications plans and public health campaigns. Some content however, is purpose-made for the slideshow – such as ‘Our People’ profiles of NMH staff. The current content mix is approximately 40:60 for staff and public, and content targeted at staff has to pass the ‘public test’. Examples of current content include:
flu vaccination promotion
advance care planning
quit-smoking services
‘get up, get dressed, get moving’ (end PJ paralysis)
Healthline
NMH Values and Building Respect promotion. 9. HUMAN RESOURCES 9.1 People & Capability Restructure We are currently in the feedback and consultation phase of the P&C change, which was extended to close on 13 April.

Chief Executive’s Report 5-15
9.2 Warm Welcome and Induction Throughout March, 37 new employees attended the Warm Welcome, with 33 from Nelson and four from Wairau. As at 4 April, 50% of new employees were enrolled in the online induction. Of those enrolled, 32% are on track with the completion milestones (Day 1, Week 1, First Month, First 3 Months). A review of the new induction will help us understand the challenges to timely enrolment and completion of the online induction modules. 9.3 Health & Safety
There were 97 reported worker/workplace events for the month ending March 2018.
9.4 Health & Wellbeing There were 38 workplace injuries reported in March compared to 33 in February. Of the injuries reported 22 were minor, 11 required treatment and five employees required time off work. The leading themes are:
Musculoskeletal injuries (14)
Contusions, grazes, and soft tissue (5)
Lacerations and scratches (5). 9.5 Performance Appraisals To date we are at 65.7% of staff with a current appraisal.

Chief Executive’s Report 5-16
Peter Bramley CHIEF EXECUTIVE
RECOMMENDATION: THAT THE CHIEF EXECUTIVE’S REPORT BE RECEIVED