memorandum - edmonton
TRANSCRIPT
D O W N T O W N E D M O N T O N
C O M M E R C I A L , O F F I C E A N D
R E S I D E N T I A L F O R E C A S T S 2 0 0 9 - 2 0 4 4
C I T Y O F E D M O N T O N
A P R I L 2 0 1 0
Prepared by:
G . P . R o l l o & A s s o c i a t e s , L a n d E c o n o m i s t s
[i]
DOWNTOWN EDMONTON COMMERCIAL, OFFICE AND RESIDENTIAL FORECASTS, 2009 TO 2044 G.P Rollo & Associates, Land Economists Ltd.
EXECUTIVE SUMMARY
G.P. Rollo & Associates (GPRA) was retained by Cohos Evamy Integratedesign to prepare residential, retail/service commercial and office demand projections for Downtown Edmonton. This task was undertaken as an input component to the revisioning and re-imagining of the Capital City Downtown Plan by Cohos Evamy and HB Lanarc.
GPRA sought to provide two future scenarios for Downtown Edmonton from 2009 to 2044, termed ‘baseline’ and ‘alternate’. Baseline conditions are those that we believe would likely unfold barring significant municipal investment in recommended Downtown planning initiatives. Alternative conditions are those that we feel could unfold if key ‘catalyst projects’ – as outlined in the Downtown Plan – are implemented.
To forecast demand for dwelling units, retail and service space, and office space in Downtown Edmonton from 2009 to 2044, GPRA applied forecast methodologies to population and employment projections. Initial projections were provided to GPRA by Applications Management Consulting; our review of these projections led us to conclude that the population and employment allocations for downtown were overly conservative (save for a short-term population ‘surge’ forecast from 2009 to 2014) and we therefore elected to apply our methodologies to these forecasts to form our ‘baseline’ demand scenario. Our ‘alternate’ or ‘catalyst project’ scenario used alternate population and employment forecasts formulated by GPRA.
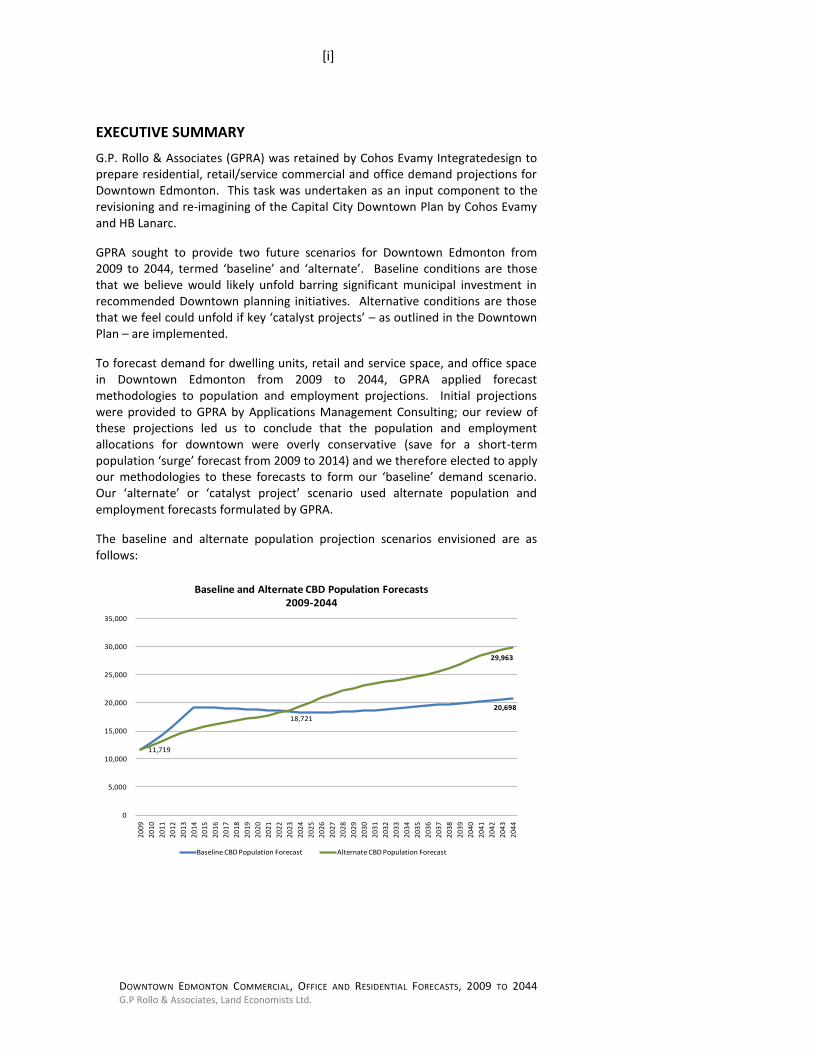
The baseline and alternate population projection scenarios envisioned are as follows:
20,698
11,719
18,721
29,963
0
5,000
10,000
15,000
20,000
25,000
30,000
35,000
20
09
20
10
20
11
20
12
20
13
20
14
20
15
20
16
20
17
20
18
20
19
20
20
20
21
20
22
20
23
20
24
20
25
20
26
20
27
20
28
20
29
20
30
20
31
20
32
20
33
20
34
20
35
20
36
20
37
20
38
20
39
20
40
20
41
20
42
20
43
20
44
Baseline and Alternate CBD Population Forecasts2009-2044
Baseline CBD Population Forecast Alternate CBD Population Forecast
[ii]
DOWNTOWN EDMONTON COMMERCIAL, OFFICE AND RESIDENTIAL FORECASTS, 2009 TO 2044 G.P Rollo & Associates, Land Economists Ltd.
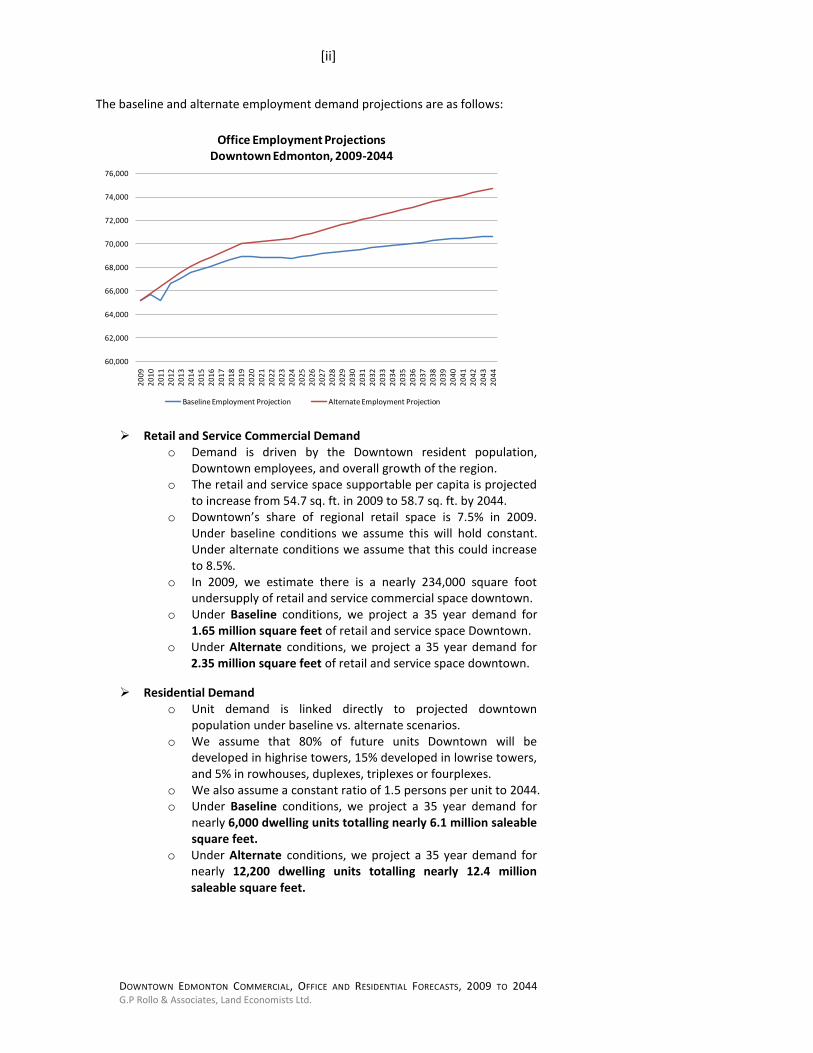
The baseline and alternate employment demand projections are as follows:
60,000
62,000
64,000
66,000
68,000
70,000
72,000
74,000
76,000
20
09
20
10
20
11
20
12
20
13
20
14
20
15
20
16
20
17
20
18
20
19
20
20
20
21
20
22
20
23
20
24
20
25
20
26
20
27
20
28
20
29
20
30
20
31
20
32
20
33
20
34
20
35
20
36
20
37
20
38
20
39
20
40
20
41
20
42
20
43
20
44
Office Employment Projections Downtown Edmonton, 2009-2044
Baseline Employment Projection Alternate Employment Projection
Retail and Service Commercial Demand o Demand is driven by the Downtown resident population,
Downtown employees, and overall growth of the region. o The retail and service space supportable per capita is projected
to increase from 54.7 sq. ft. in 2009 to 58.7 sq. ft. by 2044. o Downtown’s share of regional retail space is 7.5% in 2009.
Under baseline conditions we assume this will hold constant. Under alternate conditions we assume that this could increase to 8.5%.
o In 2009, we estimate there is a nearly 234,000 square foot undersupply of retail and service commercial space downtown.
o Under Baseline conditions, we project a 35 year demand for 1.65 million square feet of retail and service space Downtown.
o Under Alternate conditions, we project a 35 year demand for 2.35 million square feet of retail and service space downtown.
Residential Demand o Unit demand is linked directly to projected downtown
population under baseline vs. alternate scenarios. o We assume that 80% of future units Downtown will be
developed in highrise towers, 15% developed in lowrise towers, and 5% in rowhouses, duplexes, triplexes or fourplexes.
o We also assume a constant ratio of 1.5 persons per unit to 2044. o Under Baseline conditions, we project a 35 year demand for
nearly 6,000 dwelling units totalling nearly 6.1 million saleable square feet.
o Under Alternate conditions, we project a 35 year demand for nearly 12,200 dwelling units totalling nearly 12.4 million saleable square feet.
[iii]
DOWNTOWN EDMONTON COMMERCIAL, OFFICE AND RESIDENTIAL FORECASTS, 2009 TO 2044 G.P Rollo & Associates, Land Economists Ltd.
Office Space Demand o Demand is linked directly to projected downtown
employment growth under baseline and alternate scenarios.
o Baseline employment projections call for 5,400 new office employees Downtown by 2044, translating to demand for nearly 1.3 million additional square feet.
o Alternate employment projections call for approximately 9,500 new office employees Downtown by 2044, translating to demand for 2.25 million additional square feet.
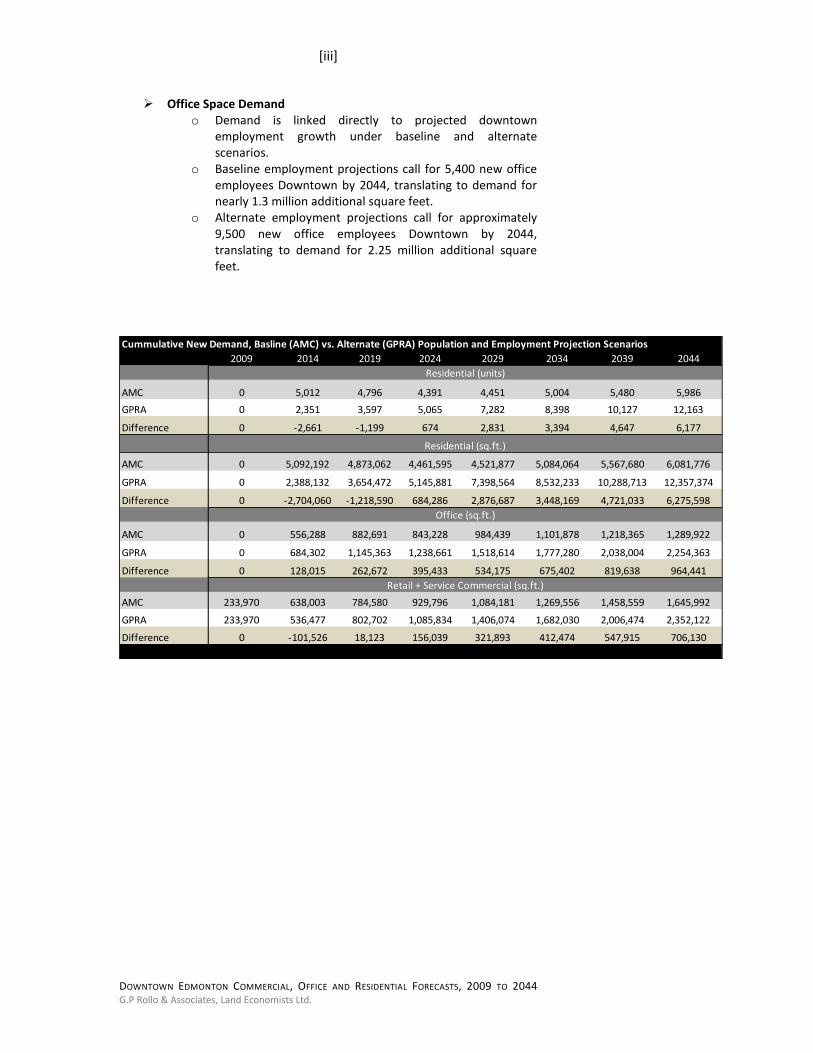
Cummulative New Demand, Basline (AMC) vs. Alternate (GPRA) Population and Employment Projection Scenarios
2009 2014 2019 2024 2029 2034 2039 2044
AMC 0 5,012 4,796 4,391 4,451 5,004 5,480 5,986
GPRA 0 2,351 3,597 5,065 7,282 8,398 10,127 12,163
Difference 0 -2,661 -1,199 674 2,831 3,394 4,647 6,177
AMC 0 5,092,192 4,873,062 4,461,595 4,521,877 5,084,064 5,567,680 6,081,776
GPRA 0 2,388,132 3,654,472 5,145,881 7,398,564 8,532,233 10,288,713 12,357,374
Difference 0 -2,704,060 -1,218,590 684,286 2,876,687 3,448,169 4,721,033 6,275,598
AMC 0 556,288 882,691 843,228 984,439 1,101,878 1,218,365 1,289,922
GPRA 0 684,302 1,145,363 1,238,661 1,518,614 1,777,280 2,038,004 2,254,363
Difference 0 128,015 262,672 395,433 534,175 675,402 819,638 964,441
AMC 233,970 638,003 784,580 929,796 1,084,181 1,269,556 1,458,559 1,645,992
GPRA 233,970 536,477 802,702 1,085,834 1,406,074 1,682,030 2,006,474 2,352,122
Difference 0 -101,526 18,123 156,039 321,893 412,474 547,915 706,130
Residential (sq.ft.)
Residential (units)
Office (sq.ft.)
Retail + Service Commercial (sq.ft.)
[iv]
DOWNTOWN EDMONTON COMMERCIAL, OFFICE AND RESIDENTIAL FORECASTS, 2009 TO 2044 G.P Rollo & Associates, Land Economists Ltd.
Contents
EXECUTIVE SUMMARY ......................................................................................... i
1.0 INTRODUCTION ............................................................................................ 1
2.0 PERSPECTIVES ON DEMAND ........................................................................ 2
3.0 POPULATION PROJECTIONS ......................................................................... 3
3.1 Background and Assumptions.................................................................. 3
3.3 Baseline Population Projection, 2009 to 2044 ......................................... 6
3.4 Alternate Population Forecast Scenario .................................................. 8
4.0 DOWNTOWN RETAIL and SERVICE COMMERCIAL DEMAND ..................... 12
4.1 Baseline Conditions ................................................................................ 12
4.2 Growth Assumptions ............................................................................. 13
4.3 Projected Retail and Service Floor Area Demand .................................. 15
4.4 Comparison to Alternate Projections .................................................... 17
5.0 DOWNTOWN RESIDENTIAL DEMAND ........................................................ 19
5.1 Assumptions ........................................................................................... 19
5.2 Market Conditions ................................................................................. 19
5.3 Projected Demand: Baseline Population Scenario ................................ 19
5.4 Projected Demand: Alternate Population Scenario ............................... 20
5.5 Land Requirements ................................................................................ 21
5.6 Comparison to Alternate Projections .................................................... 22
6.0 DOWNTOWN OFFICE SPACE DEMAND ...................................................... 24
6.1 Market Conditions ................................................................................. 24
6.2 Downtown Employment and Office Space Forecasts ............................ 24
6.3 Comparison to Alternate Projections and Further Considerations ....... 28
7.0 CONCLUSION .............................................................................................. 29
[v]
DOWNTOWN EDMONTON COMMERCIAL, OFFICE AND RESIDENTIAL FORECASTS, 2009 TO 2044 G.P Rollo & Associates, Land Economists Ltd.
List of Figures FIGURE 1: HISTORIC POPULATION GROWTH, CITY OF EDMONTON, 1986-20094 FIGURE 2: HISTORIC POPULATION GROWTH, DOWNTOWN EDMONTON, 1086-
2009 ................................................................................................... 4 FIGURE 3: DOWNTOWN POPULATION AS PERCENT OF CITY POPULATION,
1986 TO 2009. .................................................................................... 5 FIGURE 4: EDMONTON’S DOWNTOWN AND DOWNTOWN FRINGE .................. 7 FIGURE 5: BASELINE CBD POPULATION AND CBD’S SHARE OF CITY
POPULATION ...................................................................................... 8 FIGURE 6: BASELINE AND ALTERNATE EDMONTON CBD POPULATION
FORECASTS, 2009 TO 2044 .............................................................. 10 FIGURE 7: ALTERNATE SCENARIO: DOWNTOWN POPULATION GROWTH AND
POPULATION AS % OF CITY, 2009-2044 ........................................... 11 FIGURE 8: DOWNTOWN COMMERCIAL DEMAND, BASELINE AND ALTERNATE,
2009-2044 ........................................................................................ 17 FIGURE 9: DWELLING UNIT DEMAND, DOWNTOWN EDMONTON, BASELINE
AND ALTERNATE SCENARIOS, 2009-2044 ........................................ 21 FIGURE 10: OFFICE SPACE DEMAND, DOWNTOWN EDMONTON, BASELINE AND
ALTERNATE SCENARIOS, 2009-2044 ................................................ 26 FIGURE 11: INTACT INSURANCE BUILDING, 10830 JASPER AVENUE ................. 27 FIGURE 13: WORLD TRADE CENTRE, 9990 JASPER AVENUE .............................. 28 FIGURE 12: MANULIFE PLACE, 10180 101 ST. NW ............................................. 27

[vi]
DOWNTOWN EDMONTON COMMERCIAL, OFFICE AND RESIDENTIAL FORECASTS, 2009 TO 2044 G.P Rollo & Associates, Land Economists Ltd.
List of Tables TABLE 2: BASELINE POPULATION FORECASTS, CBD, FRINGE AND CITY............ 7 TABLE 1: BASELINE FORECAST, CBD AND FRINGE AS % OF CITY POPULATION 7 TABLE 3: BASELINE ANNUAL POPULATION GROWTH RATES FORECAST .......... 8 TABLE 4: EDMONTON CITY AND DOWNTOWN FRINGE POP FORECASTS,
2009-2044 .......................................................................................... 8 TABLE 5: BASELINE AND ALTERNATE EDMONTON CBD POPULATION
FORECASTS 2009-2044, AND AMC FORECASTS OF CBD FRINGE AND CITY. ................................................................................................. 10
TABLE 6: DOWNTOWN POP AS % OF CITY UNDER BASELINE AND ALTERNATE CONDITIONS, 2009-2044 ................................................................. 11
TABLE 7: RETAIL AND SERVICE COMMERCIAL INVENTORY, AND SQ. FT. PER CAPITA, 2006.................................................................................... 12
TABLE 8: REGIONAL-SERVICE RETAIL + SERVICE SPACE, 2006 ........................ 13 TABLE 9: RETAIL + SERVICE SPACE SUPPORTED PER CAPITA, 2009-2044 ....... 14 TABLE 10: DOWNTOWN’S SHARE OF REGIONAL COMMERCIAL SPACE UNDER
BASELINE AND ALTERNATE SCENARIOS, 2009-2044........................ 14 TABLE 11: COMMERCIAL SPACE SUPPORTED BY DOWNTOWN RESIDENTS ..... 15 TABLE 12: BASELINE COMMERCIAL DEMAND DOWNTOWN, 2009-2044 ........ 16 TABLE 13: ALTERNATE COMMERCIAL DEMAND DOWNTOWN, 2009-2044 ..... 16 TABLE 14: BASELINE DOWNTOWN OFFICE SPACE PROJECTIONS, 2009 - 2044 25 TABLE 15: ALTERNATE DOWNTOWN OFFICE SPACE PROJECTIONS, 2009-2044 ..
......................................................................................................... 26
[1]
DOWNTOWN EDMONTON COMMERCIAL, OFFICE AND RESIDENTIAL FORECASTS, 2009 TO 2044 G.P Rollo & Associates, Land Economists Ltd.
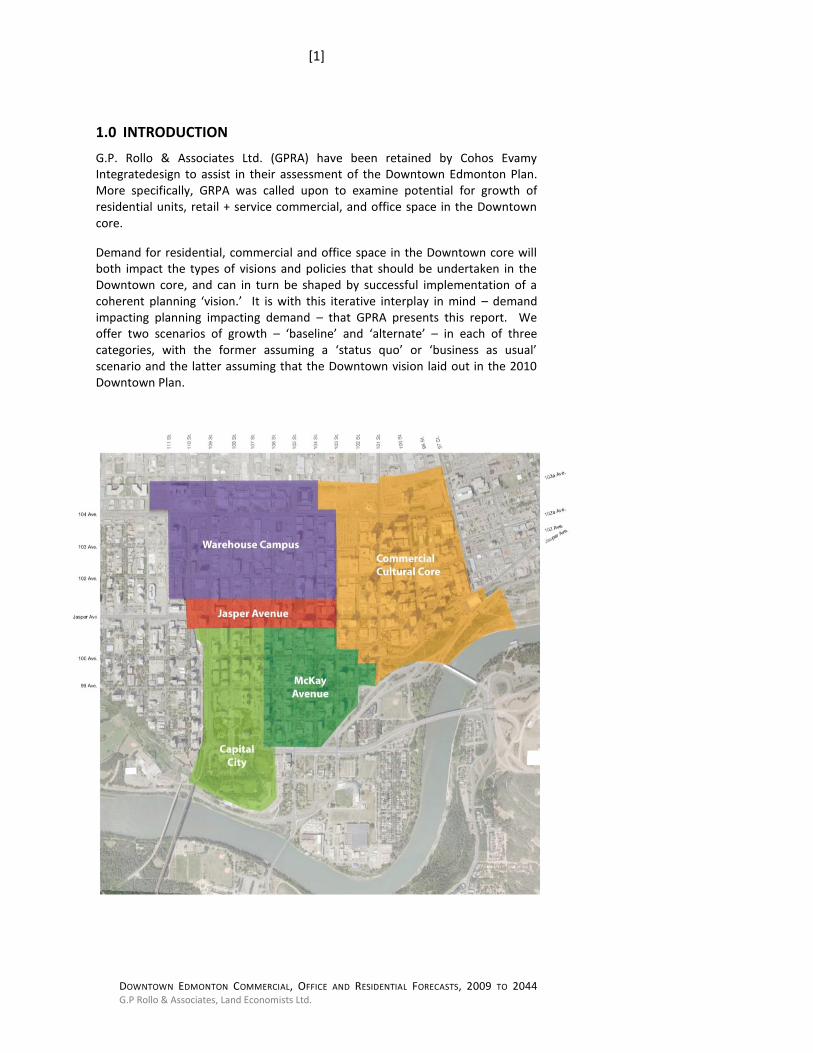
1.0 INTRODUCTION
G.P. Rollo & Associates Ltd. (GPRA) have been retained by Cohos Evamy Integratedesign to assist in their assessment of the Downtown Edmonton Plan. More specifically, GRPA was called upon to examine potential for growth of residential units, retail + service commercial, and office space in the Downtown core.
Demand for residential, commercial and office space in the Downtown core will both impact the types of visions and policies that should be undertaken in the Downtown core, and can in turn be shaped by successful implementation of a coherent planning ‘vision.’ It is with this iterative interplay in mind – demand impacting planning impacting demand – that GPRA presents this report. We offer two scenarios of growth – ‘baseline’ and ‘alternate’ – in each of three categories, with the former assuming a ‘status quo’ or ‘business as usual’ scenario and the latter assuming that the Downtown vision laid out in the 2010 Downtown Plan.
[2]
DOWNTOWN EDMONTON COMMERCIAL, OFFICE AND RESIDENTIAL FORECASTS, 2009 TO 2044 G.P Rollo & Associates, Land Economists Ltd.
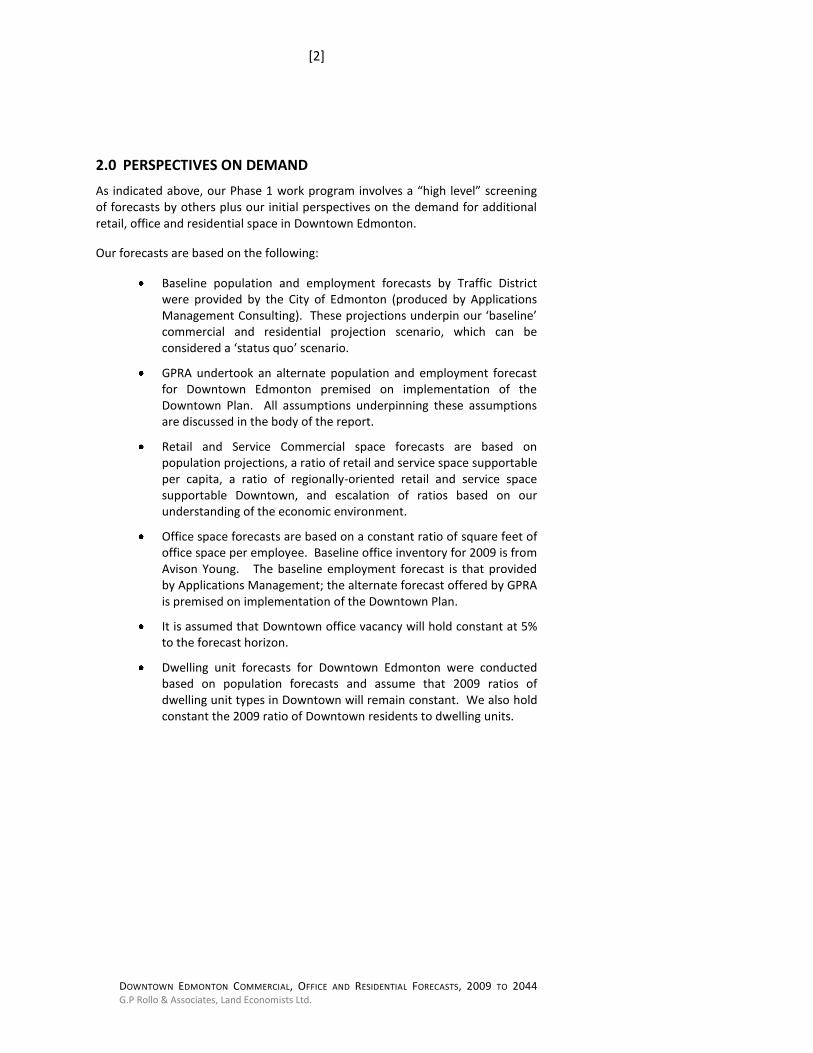
2.0 PERSPECTIVES ON DEMAND
As indicated above, our Phase 1 work program involves a “high level” screening of forecasts by others plus our initial perspectives on the demand for additional retail, office and residential space in Downtown Edmonton.
Our forecasts are based on the following:
Baseline population and employment forecasts by Traffic District were provided by the City of Edmonton (produced by Applications Management Consulting). These projections underpin our ‘baseline’ commercial and residential projection scenario, which can be considered a ‘status quo’ scenario.
GPRA undertook an alternate population and employment forecast for Downtown Edmonton premised on implementation of the Downtown Plan. All assumptions underpinning these assumptions are discussed in the body of the report.
Retail and Service Commercial space forecasts are based on population projections, a ratio of retail and service space supportable per capita, a ratio of regionally-oriented retail and service space supportable Downtown, and escalation of ratios based on our understanding of the economic environment.
Office space forecasts are based on a constant ratio of square feet of office space per employee. Baseline office inventory for 2009 is from Avison Young. The baseline employment forecast is that provided by Applications Management; the alternate forecast offered by GPRA is premised on implementation of the Downtown Plan.
It is assumed that Downtown office vacancy will hold constant at 5% to the forecast horizon.
Dwelling unit forecasts for Downtown Edmonton were conducted based on population forecasts and assume that 2009 ratios of dwelling unit types in Downtown will remain constant. We also hold constant the 2009 ratio of Downtown residents to dwelling units.
[3]
DOWNTOWN EDMONTON COMMERCIAL, OFFICE AND RESIDENTIAL FORECASTS, 2009 TO 2044 G.P Rollo & Associates, Land Economists Ltd.
3.0 POPULATION PROJECTIONS
3.1 BACKGROUND AND ASSUMPTIONS
GPRA forecasts for additional retail/service commercial space and new residential units in Downtown Edmonton are based upon population forecasts for both Downtown and the City from 2009 to 2044.
Baseline forecasts were built upon population projections undertaken by Applications Management Consulting Ltd. (AMC) in 2009
1 and provided to GPRA
by the City of Edmonton. AMC’s population projections for the Edmonton Central Business District (CBD) and the City as a whole were undertaken as part of a comprehensive forecasting exercise, allocating expected growth across the entire Capital Region to 2044. These forecasts take into consideration identified priority growth areas, land supply, transportation development and growth density targets.
Key summary points on the AMC population projection assumptions are as follows:
A base year of 2009 was utilized for projections, with data garnered from the 2009 Edmonton Municipal Census;
The Downtown is identified by the Capital Region Board as a Priority Growth Area (PGA);
Density target ranges were established for each PGA, and the midpoint of the range was utilized to calculate the capacity of each traffic zone. For Downtown Edmonton, a density target of 40 dwelling units per net residential hectare (du/NRha) was used;
The CBD is targeted for compact growth and intensification;
Projections assume expansion of the LRT network with a mixture of high density residential, employment and mixed-use development emerging at proposed Transit Oriented Development (TOD) stations.
Using AMC’s forecasts, GPRA established projections for retail, service commercial, and residential unit demand in the CBD. These projections are classified as ‘baseline’ projections in this report. While AMC has indicated that its projections take into account some strategic revisioning of the Downtown core (as noted above), we believe that the projections are significantly below what could be achieved through visionary goals, policies, implementation strategies and implementation processes.
AMC correctly acknowledges that their forecasts represent only one plausible and likely distribution of growth, and that “[o]ther plausible scenarios could be developed using the same general direction…and altering assumptions about the distribution of growth.”
2 With this in mind, GPRA provides an ‘alternate’ growth
scenario premised on a series of assumptions (discussed below), and discusses implications for future retail, service commercial and residential demand in Downtown Edmonton. Comparisons are also provided to forecasts conducted in recent years by other organizations.
1 Applications Management Consulting Ltd. Capital Region Board Population &
Employment Forecasts. November 2009. 2 Ibid. P. 2
[4]
DOWNTOWN EDMONTON COMMERCIAL, OFFICE AND RESIDENTIAL FORECASTS, 2009 TO 2044 G.P Rollo & Associates, Land Economists Ltd.
3.2 City of Edmonton, Historic Growth
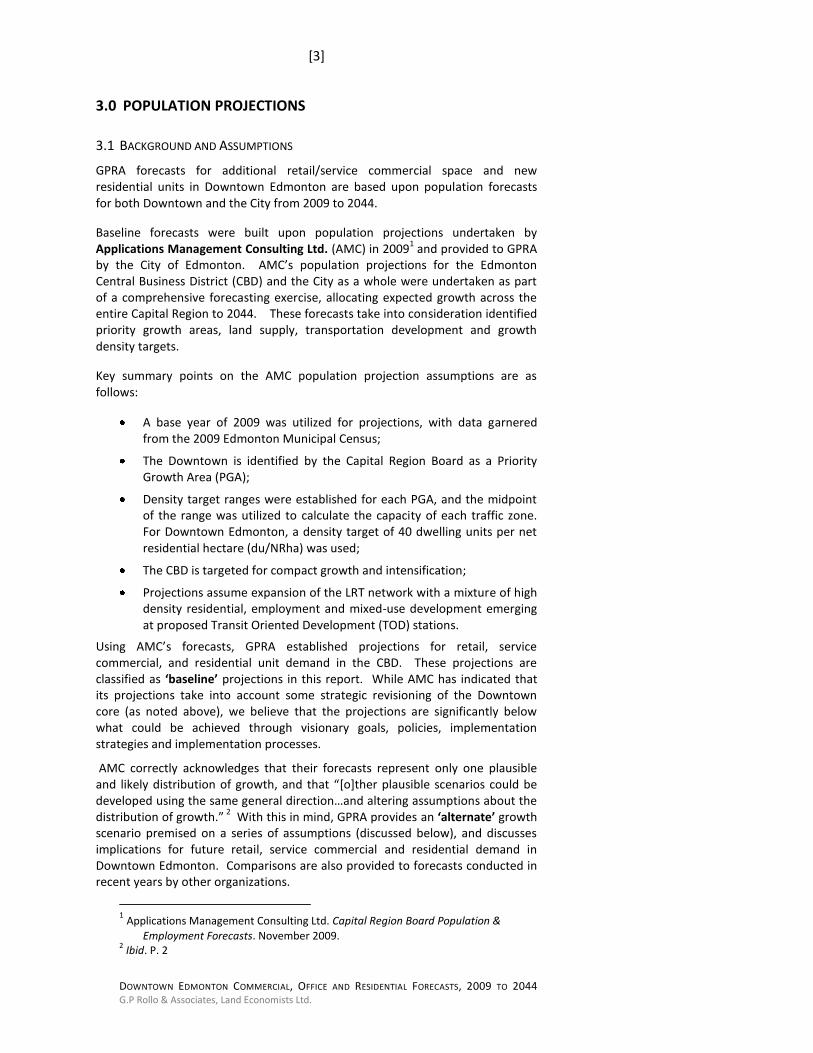
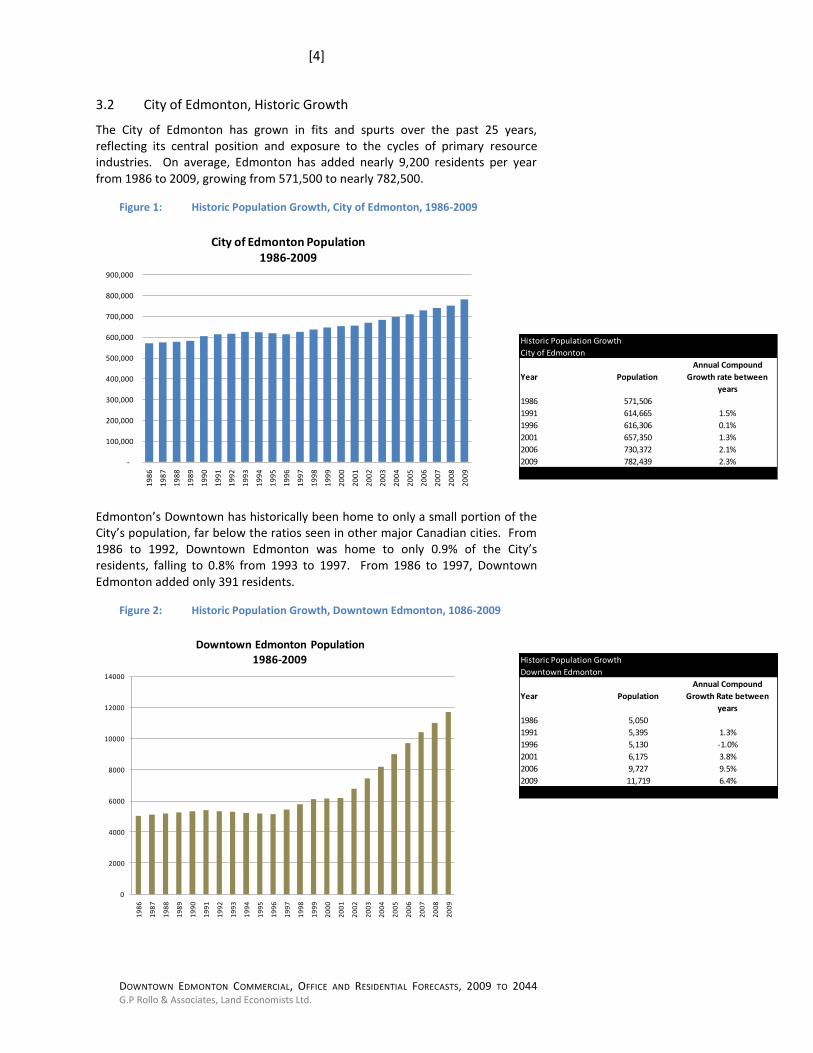
The City of Edmonton has grown in fits and spurts over the past 25 years, reflecting its central position and exposure to the cycles of primary resource industries. On average, Edmonton has added nearly 9,200 residents per year from 1986 to 2009, growing from 571,500 to nearly 782,500.
Figure 1: Historic Population Growth, City of Edmonton, 1986-2009
-
100,000
200,000
300,000
400,000
500,000
600,000
700,000
800,000
900,000
19
86
19
87
19
88
19
89
19
90
19
91
19
92
19
93
19
94
19
95
19
96
19
97
19
98
19
99
20
00
20
01
20
02
20
03
20
04
20
05
20
06
20
07
20
08
20
09
City of Edmonton Population 1986-2009
Edmonton’s Downtown has historically been home to only a small portion of the City’s population, far below the ratios seen in other major Canadian cities. From 1986 to 1992, Downtown Edmonton was home to only 0.9% of the City’s residents, falling to 0.8% from 1993 to 1997. From 1986 to 1997, Downtown Edmonton added only 391 residents.
Figure 2: Historic Population Growth, Downtown Edmonton, 1086-2009
0
2000
4000
6000
8000
10000
12000
14000
19
86
19
87
19
88
19
89
19
90
19
91
19
92
19
93
19
94
19
95
19
96
19
97
19
98
19
99
20
00
20
01
20
02
20
03
20
04
20
05
20
06
20
07
20
08
20
09
Downtown Edmonton Population 1986-2009
Historic Population Growth
City of Edmonton
Year Population
Annual Compound
Growth rate between
years
1986 571,506
1991 614,665 1.5%
1996 616,306 0.1%
2001 657,350 1.3%
2006 730,372 2.1%
2009 782,439 2.3%
Historic Population Growth
Downtown Edmonton
Year Population
Annual Compound
Growth Rate between
years
1986 5,050
1991 5,395 1.3%
1996 5,130 -1.0%
2001 6,175 3.8%
2006 9,727 9.5%
2009 11,719 6.4%
[5]
DOWNTOWN EDMONTON COMMERCIAL, OFFICE AND RESIDENTIAL FORECASTS, 2009 TO 2044 G.P Rollo & Associates, Land Economists Ltd.
It was only with the economic boom that began in the late 1990s that Downtown condominium construction surged and Downtown living became a more attractive option for some. The booming Alberta economy attracted residents from other centres such as Toronto, Montreal and Vancouver where Downtown urban living is the norm; many of these new migrants sought out a similar lifestyle in Edmonton. Similarly, a greater number of local residents became attracted to the concept of Downtown living, motivated by a number of factors ranging from increasing eco-consciousness, desire for a less car-dependent lifestyle, or simply attraction to an environment where a multitude of locations are within walking distance of home and work.
At the same time, the City implemented the Downtown Housing Reinvestment Grant Program to spur Downtown revitalization. This program provided $4,500 for each housing unit built within the Downtown Plan boundary, and was incorporated into the Capital City Downtown Plan. In all, the City paid $4.5 million in grants subsidizing construction of 1,000 housing units.
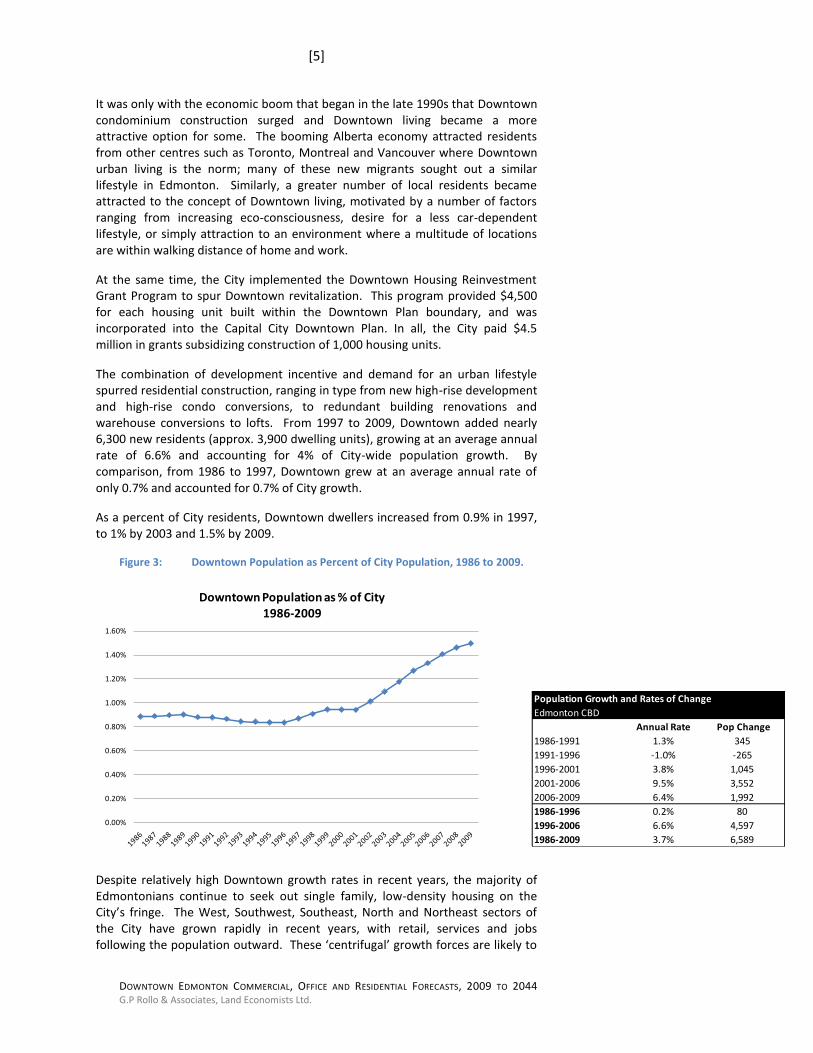
The combination of development incentive and demand for an urban lifestyle spurred residential construction, ranging in type from new high-rise development and high-rise condo conversions, to redundant building renovations and warehouse conversions to lofts. From 1997 to 2009, Downtown added nearly 6,300 new residents (approx. 3,900 dwelling units), growing at an average annual rate of 6.6% and accounting for 4% of City-wide population growth. By comparison, from 1986 to 1997, Downtown grew at an average annual rate of only 0.7% and accounted for 0.7% of City growth.
As a percent of City residents, Downtown dwellers increased from 0.9% in 1997, to 1% by 2003 and 1.5% by 2009.
Figure 3: Downtown Population as Percent of City Population, 1986 to 2009.
0.00%
0.20%
0.40%
0.60%
0.80%
1.00%
1.20%
1.40%
1.60%
Downtown Population as % of City1986-2009
Despite relatively high Downtown growth rates in recent years, the majority of Edmontonians continue to seek out single family, low-density housing on the City’s fringe. The West, Southwest, Southeast, North and Northeast sectors of the City have grown rapidly in recent years, with retail, services and jobs following the population outward. These ‘centrifugal’ growth forces are likely to
Population Growth and Rates of Change
Edmonton CBD
Annual Rate Pop Change
1986-1991 1.3% 345
1991-1996 -1.0% -265
1996-2001 3.8% 1,045
2001-2006 9.5% 3,552
2006-2009 6.4% 1,992
1986-1996 0.2% 80
1996-2006 6.6% 4,597
1986-2009 3.7% 6,589
[6]
DOWNTOWN EDMONTON COMMERCIAL, OFFICE AND RESIDENTIAL FORECASTS, 2009 TO 2044 G.P Rollo & Associates, Land Economists Ltd.
continue and, barring City-wide strategies geared towards redirecting growth forces to the core (for example: grants, land swaps, office growth policies, transit initiatives, public realm design initiatives), will place limits on potential population growth in the City centre. This assumption is incorporated into GPRA’s population forecasts for the CBD.
3.3 BASELINE POPULATION PROJECTION, 2009 TO 2044
Applications Management Consulting (AMC) prepared the following population forecasts for the City of Edmonton and the Downtown core. As discussed above, we classify these as ‘baseline’ forecasts, and they form the basis for baseline dwelling units and retail + service commercial space demand projections.
3.3.1 Downtown and Downtown Fringe Population Forecast
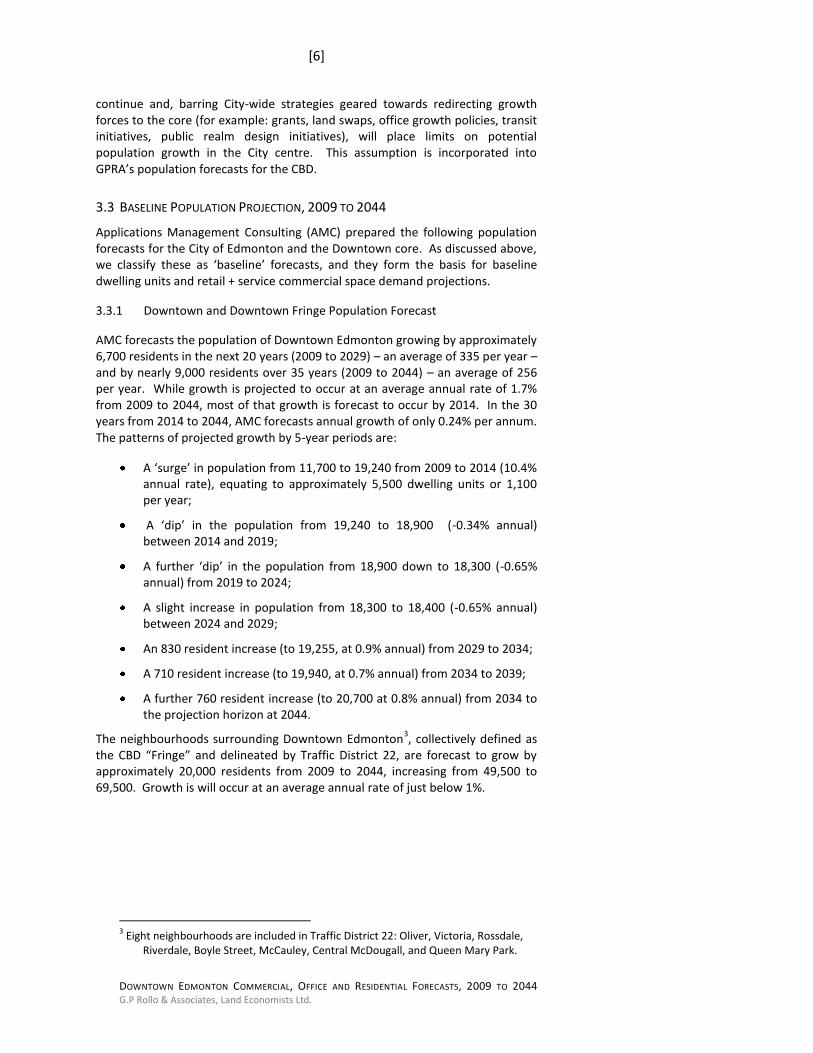
AMC forecasts the population of Downtown Edmonton growing by approximately 6,700 residents in the next 20 years (2009 to 2029) – an average of 335 per year – and by nearly 9,000 residents over 35 years (2009 to 2044) – an average of 256 per year. While growth is projected to occur at an average annual rate of 1.7% from 2009 to 2044, most of that growth is forecast to occur by 2014. In the 30 years from 2014 to 2044, AMC forecasts annual growth of only 0.24% per annum. The patterns of projected growth by 5-year periods are:
A ‘surge’ in population from 11,700 to 19,240 from 2009 to 2014 (10.4% annual rate), equating to approximately 5,500 dwelling units or 1,100 per year;
A ‘dip’ in the population from 19,240 to 18,900 (-0.34% annual) between 2014 and 2019;
A further ‘dip’ in the population from 18,900 down to 18,300 (-0.65% annual) from 2019 to 2024;
A slight increase in population from 18,300 to 18,400 (-0.65% annual) between 2024 and 2029;
An 830 resident increase (to 19,255, at 0.9% annual) from 2029 to 2034;
A 710 resident increase (to 19,940, at 0.7% annual) from 2034 to 2039;
A further 760 resident increase (to 20,700 at 0.8% annual) from 2034 to the projection horizon at 2044.
The neighbourhoods surrounding Downtown Edmonton3, collectively defined as
the CBD “Fringe” and delineated by Traffic District 22, are forecast to grow by approximately 20,000 residents from 2009 to 2044, increasing from 49,500 to 69,500. Growth is will occur at an average annual rate of just below 1%.
3 Eight neighbourhoods are included in Traffic District 22: Oliver, Victoria, Rossdale,
Riverdale, Boyle Street, McCauley, Central McDougall, and Queen Mary Park.
[7]
DOWNTOWN EDMONTON COMMERCIAL, OFFICE AND RESIDENTIAL FORECASTS, 2009 TO 2044 G.P Rollo & Associates, Land Economists Ltd.
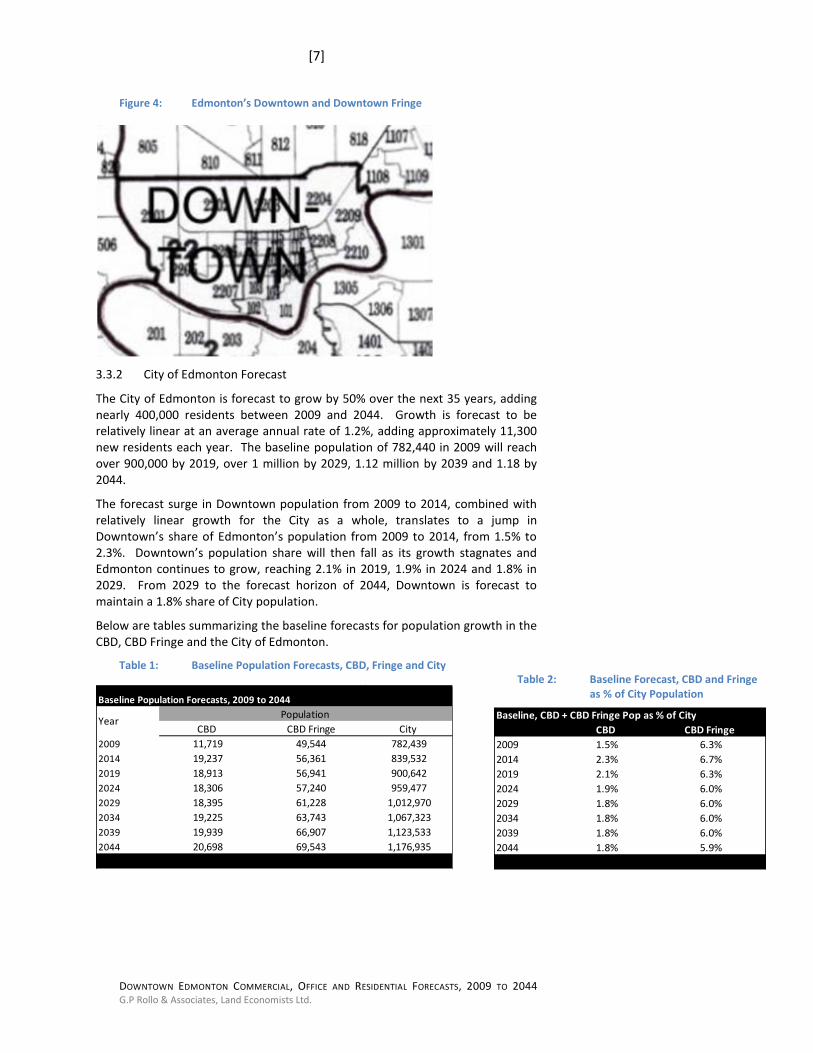
Figure 4: Edmonton’s Downtown and Downtown Fringe
3.3.2 City of Edmonton Forecast
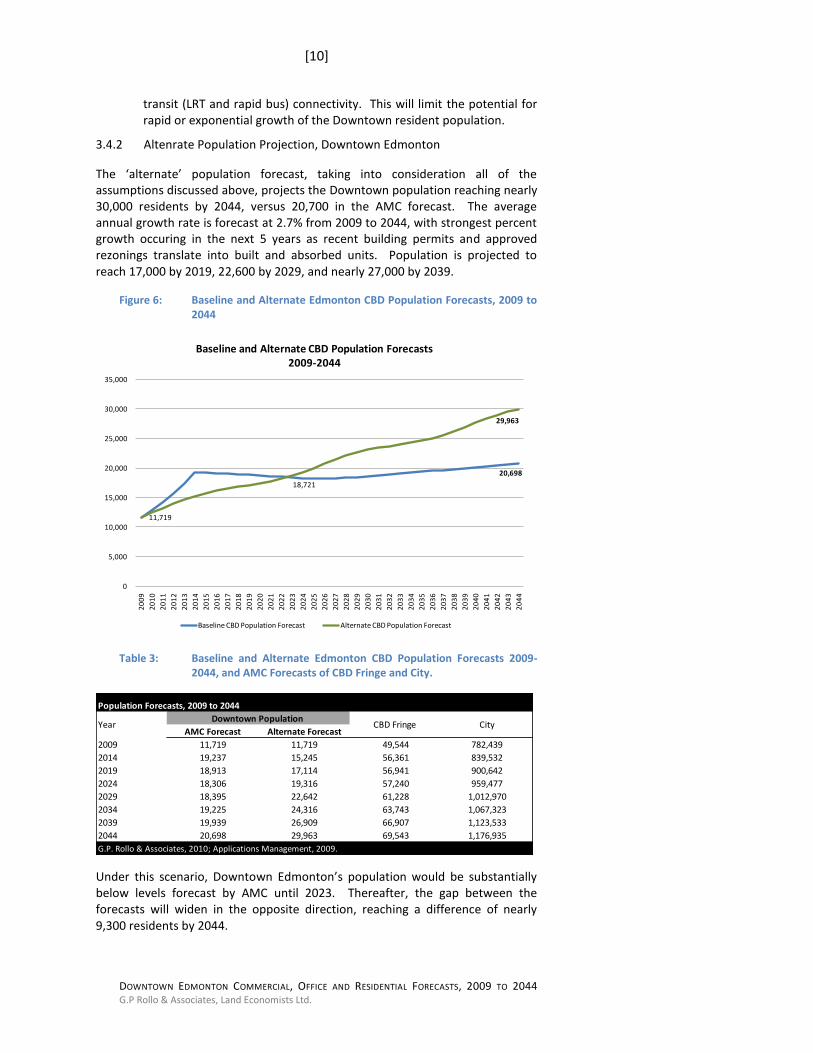
The City of Edmonton is forecast to grow by 50% over the next 35 years, adding nearly 400,000 residents between 2009 and 2044. Growth is forecast to be relatively linear at an average annual rate of 1.2%, adding approximately 11,300 new residents each year. The baseline population of 782,440 in 2009 will reach over 900,000 by 2019, over 1 million by 2029, 1.12 million by 2039 and 1.18 by 2044.
The forecast surge in Downtown population from 2009 to 2014, combined with relatively linear growth for the City as a whole, translates to a jump in Downtown’s share of Edmonton’s population from 2009 to 2014, from 1.5% to 2.3%. Downtown’s population share will then fall as its growth stagnates and Edmonton continues to grow, reaching 2.1% in 2019, 1.9% in 2024 and 1.8% in 2029. From 2029 to the forecast horizon of 2044, Downtown is forecast to maintain a 1.8% share of City population.
Below are tables summarizing the baseline forecasts for population growth in the CBD, CBD Fringe and the City of Edmonton.
Table 1: Baseline Population Forecasts, CBD, Fringe and City
Baseline Population Forecasts, 2009 to 2044
CBD CBD Fringe City
2009 11,719 49,544 782,439
2014 19,237 56,361 839,532
2019 18,913 56,941 900,642
2024 18,306 57,240 959,477
2029 18,395 61,228 1,012,970
2034 19,225 63,743 1,067,323
2039 19,939 66,907 1,123,533
2044 20,698 69,543 1,176,935
Population Year
Baseline, CBD + CBD Fringe Pop as % of City
CBD CBD Fringe
2009 1.5% 6.3%
2014 2.3% 6.7%
2019 2.1% 6.3%
2024 1.9% 6.0%
2029 1.8% 6.0%
2034 1.8% 6.0%
2039 1.8% 6.0%
2044 1.8% 5.9%
Table 2: Baseline Forecast, CBD and Fringe as % of City Population

[8]
DOWNTOWN EDMONTON COMMERCIAL, OFFICE AND RESIDENTIAL FORECASTS, 2009 TO 2044 G.P Rollo & Associates, Land Economists Ltd.
Table 1: Baseline Annual Population Growth Rates Forecast
Basline Annual Growth Rates Forecast
5-Year Periods
Period CBD CBD Fringe City
2009-2014 10.42% 2.6% 1.4%
2014-2019 -0.34% 0.2% 1.4%
2019-2024 -0.65% 0.1% 1.3%
2024-2029 0.10% 1.4% 1.1%
2029-2034 0.89% 0.8% 1.1%
2034-2039 0.73% 1.0% 1.0%
2039-2044 0.75% 0.8% 0.9%
2009-2044 1.64% 1.0% 1.2%
2014-2044 0.24% 0.7% 1.1%
Annual Growth Rates
Figure 5: Baseline CBD Population and CBD’s Share of City Population
0.0%
0.5%
1.0%
1.5%
2.0%
2.5%
-
5,000
10,000
15,000
20,000
25,000
20
09
20
10
20
11
20
12
20
13
20
14
20
15
20
16
20
17
20
18
20
19
20
20
20
21
20
22
20
23
20
24
20
25
20
26
20
27
20
28
20
29
20
30
20
31
20
32
20
33
20
34
20
35
20
36
20
37
20
38
20
39
20
40
20
41
20
42
20
43
20
44
Baseline Scenario: CBD Population Growth and CBD Population as % of City
2009-2044
CBD Population CBD as % of City
3.4 ALTERNATE POPULATION FORECAST SCENARIO
3.4.1 Assumptions
GPRA has compiled an alternate population forecast scenario for Downtown Edmonton. This alternative scenario is premissed on the following assumptions:
We have not adjusted the AMC population forecasts for the City of Edmonton or the Downtown Fringe. These forecasts remain as follows:
Table 2: Edmonton City and Downtown Fringe Pop Forecasts, 2009-2044
Population Forecasts, 2009-2044
2009 2014 2019 2024 2029 2034 2039 2044
Downtown Fringe 49,544 56,361 56,941 57,240 61,228 63,743 66,907 69,543
City of Edmonton 782,439 839,532 900,642 959,477 1,012,970 1,067,323 1,123,533 1,176,935
Applications Management Consulting, 2009.
[9]
DOWNTOWN EDMONTON COMMERCIAL, OFFICE AND RESIDENTIAL FORECASTS, 2009 TO 2044 G.P Rollo & Associates, Land Economists Ltd.
The urban Downtown lifestyle will become increasingly attractive as key ‘catalyst projects’ are implemented. Combined with increased environmental consciousness and higher energy costs, there will be greater impetus for Edmonton residents to live in compact, integrated communities including Downtown.
Catalysts to Downtown living will include City-initiated and collaborative livability strategies
4 that include: LRT expansion, community amenity
space construction (public or developer-funded), heritage restoration, high-quality building design, public realm impovements focusing on streets, and affordable housing.
Growth of the seniors population (30% of City population by 2041 vs. 20% today) will create increased demand for smaller, urban dwelling units and walkable environments, with some seniors chosing to downsize from suburban single family homes and relocate to Downtown condos and townhouses. Increased leisure time will make proximity to leisure and cultural acitivities attractive.
The 10.4% per annum population ‘surge’ from 2009 to 2014 forecast by AMC is likely overstated. This forecast is equivalent to an average annual unit absorption of 915 per year, with absorption over 1,000 units per year in years 2012 to 2014. Given the significant unit construction ongoing at the City’s fringe, the attractive price-per-square foot in neighbourhoods within a 15-25 minute drive of Downtown, and the likely timeline for Downtown improvements that will make its neighbourhoods more attractive to those who are not already intent on living Downtown, such a ramp-up of absorption to historically unprecedented levels is unlikely. That said, Downtown absorption will likely remain strong in the coming years.
5 GPRA forecasts an average
annual absorption of 470 Downtown dwelling units from 2010 to 2014, consistent with the 450 units per annum average seen from 2004 to 2009.
The GPRA forecast is premised on Downtown unit absorption following a 7-year cycle from peak to trough, with peaks at 550 units absorbed and troughs at 175 units. The peak absorption rate is premised on both historic absorption trends and what we believe is possible given implementation of Downtown improvements, while troughs are based on historic trends adjusted to a larger population base and again take into consideration Downtown improvements.
Land supply and comparatively lower land prices on the urban fringe, affording famlies more living space, will continue to make these areas attractive to the majority of Edmonton residents. Higher energy costs and environmental concerns will likely spur intensification of population and jobs at key ‘urban nodes’ in inner and outer suburban neighbourohods
6, eventually creating a multi-nodal urban region with
4 Collaboration could include provincial funding, public-private-partnerships, private
sector voluntary or mandatory amenity contributions or cash in-lieu. 5 Discussions with members of the Edmonton development community have revealed
a feeling that Downtown absorption will likely plateau over the next 3-5 years. 6 Colliers’ Edmonton Real Estate Analysis (Oct. 2009, p.8-9) indicated possible
locations for future urban node densification.
[10]
DOWNTOWN EDMONTON COMMERCIAL, OFFICE AND RESIDENTIAL FORECASTS, 2009 TO 2044 G.P Rollo & Associates, Land Economists Ltd.
transit (LRT and rapid bus) connectivity. This will limit the potential for rapid or exponential growth of the Downtown resident population.
3.4.2 Altenrate Population Projection, Downtown Edmonton
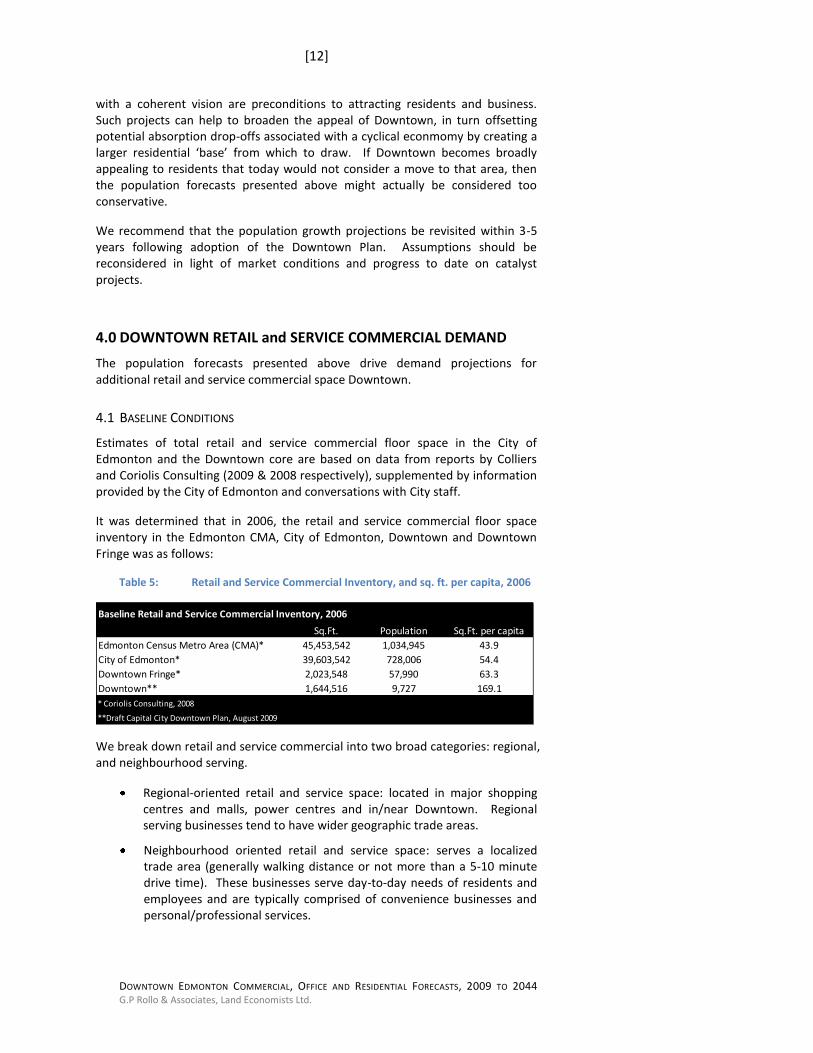
The ‘alternate’ population forecast, taking into consideration all of the assumptions discussed above, projects the Downtown population reaching nearly 30,000 residents by 2044, versus 20,700 in the AMC forecast. The average annual growth rate is forecast at 2.7% from 2009 to 2044, with strongest percent growth occuring in the next 5 years as recent building permits and approved rezonings translate into built and absorbed units. Population is projected to reach 17,000 by 2019, 22,600 by 2029, and nearly 27,000 by 2039.
Figure 6: Baseline and Alternate Edmonton CBD Population Forecasts, 2009 to 2044
20,698
11,719
18,721
29,963
0
5,000
10,000
15,000
20,000
25,000
30,000
35,000
20
09
20
10
20
11
20
12
20
13
20
14
20
15
20
16
20
17
20
18
20
19
20
20
20
21
20
22
20
23
20
24
20
25
20
26
20
27
20
28
20
29
20
30
20
31
20
32
20
33
20
34
20
35
20
36
20
37
20
38
20
39
20
40
20
41
20
42
20
43
20
44
Baseline and Alternate CBD Population Forecasts2009-2044
Baseline CBD Population Forecast Alternate CBD Population Forecast
Table 3: Baseline and Alternate Edmonton CBD Population Forecasts 2009-2044, and AMC Forecasts of CBD Fringe and City.
Population Forecasts, 2009 to 2044
AMC Forecast Alternate Forecast
2009 11,719 11,719 49,544 782,439
2014 19,237 15,245 56,361 839,532
2019 18,913 17,114 56,941 900,642
2024 18,306 19,316 57,240 959,477
2029 18,395 22,642 61,228 1,012,970
2034 19,225 24,316 63,743 1,067,323
2039 19,939 26,909 66,907 1,123,533
2044 20,698 29,963 69,543 1,176,935
G.P. Rollo & Associates, 2010; Applications Management, 2009.
Year Downtown Population
CBD Fringe City
Under this scenario, Downtown Edmonton’s population would be substantially below levels forecast by AMC until 2023. Thereafter, the gap between the forecasts will widen in the opposite direction, reaching a difference of nearly 9,300 residents by 2044.

[11]
DOWNTOWN EDMONTON COMMERCIAL, OFFICE AND RESIDENTIAL FORECASTS, 2009 TO 2044 G.P Rollo & Associates, Land Economists Ltd.
As a percent of total City population, the CBD is forecast to increase from 1.5% in 2009 to 1.9% by 2019, 2.2% by 2029, 2.4% by 2039 and 2.5% by 2044. By contrast, the AMC scenario forecasts a peak of 2.3% in 2014 before decreasing to 1.9% in 2024 and stabilizing at 1.8% to the forecast horizon.
Table 4: Downtown Pop as % of City under baseline and alternate conditions, 2009-2044
Baseline & Alternate CBD as % of City Population
Baseline Alternate
2009 1.5% 1.5%
2014 2.3% 1.8%
2019 2.1% 1.9%
2024 1.9% 2.0%
2029 1.8% 2.2%
2034 1.8% 2.3%
2039 1.8% 2.4%
2044 1.8% 2.5%
CBD
Figure 7: Alternate Scenario: Downtown Population Growth and Population as % of City, 2009-2044
0.0%
0.5%
1.0%
1.5%
2.0%
2.5%
3.0%
-
5,000
10,000
15,000
20,000
25,000
30,000
35,000
20
09
20
10
20
11
20
12
20
13
20
14
20
15
20
16
20
17
20
18
20
19
20
20
20
21
20
22
20
23
20
24
20
25
20
26
20
27
20
28
20
29
20
30
20
31
20
32
20
33
20
34
20
35
20
36
20
37
20
38
20
39
20
40
20
41
20
42
20
43
20
44
Alternate Scenario:CBD Population Growth and CBD Population as % of City
2009-2044
Alternate CBD Population Forecast CBD as % of City
It is worth noting that under this alternate population growth scenario, the Downtown population would fall short of achieving City Policy 4.1 of the Draft Downtown Plan (2009), which calls for “24,000 Downtown residents by 2030.”
The rate at which Downtown Edmonton can grow will primarily be a function of the speed and quality of catalyst project implementation, leading to the establishment of Downtown neighbourhoods that offer a quality of life that cannot be found elsewhere in the City. A high quality public realm, efficient and attractive transit and bikeways, alongside other improvement projects associated
[12]
DOWNTOWN EDMONTON COMMERCIAL, OFFICE AND RESIDENTIAL FORECASTS, 2009 TO 2044 G.P Rollo & Associates, Land Economists Ltd.
with a coherent vision are preconditions to attracting residents and business. Such projects can help to broaden the appeal of Downtown, in turn offsetting potential absorption drop-offs associated with a cyclical econmomy by creating a larger residential ‘base’ from which to draw. If Downtown becomes broadly appealing to residents that today would not consider a move to that area, then the population forecasts presented above might actually be considered too conservative.
We recommend that the population growth projections be revisited within 3-5 years following adoption of the Downtown Plan. Assumptions should be reconsidered in light of market conditions and progress to date on catalyst projects.
4.0 DOWNTOWN RETAIL and SERVICE COMMERCIAL DEMAND
The population forecasts presented above drive demand projections for additional retail and service commercial space Downtown.
4.1 BASELINE CONDITIONS
Estimates of total retail and service commercial floor space in the City of Edmonton and the Downtown core are based on data from reports by Colliers and Coriolis Consulting (2009 & 2008 respectively), supplemented by information provided by the City of Edmonton and conversations with City staff.
It was determined that in 2006, the retail and service commercial floor space inventory in the Edmonton CMA, City of Edmonton, Downtown and Downtown Fringe was as follows:
Table 5: Retail and Service Commercial Inventory, and sq. ft. per capita, 2006
Baseline Retail and Service Commercial Inventory, 2006
Sq.Ft. Population Sq.Ft. per capita
Edmonton Census Metro Area (CMA)* 45,453,542 1,034,945 43.9
City of Edmonton* 39,603,542 728,006 54.4
Downtown Fringe* 2,023,548 57,990 63.3
Downtown** 1,644,516 9,727 169.1
* Coriolis Consulting, 2008
**Draft Capital City Downtown Plan, August 2009
We break down retail and service commercial into two broad categories: regional, and neighbourhood serving.
Regional-oriented retail and service space: located in major shopping centres and malls, power centres and in/near Downtown. Regional serving businesses tend to have wider geographic trade areas.
Neighbourhood oriented retail and service space: serves a localized trade area (generally walking distance or not more than a 5-10 minute drive time). These businesses serve day-to-day needs of residents and employees and are typically comprised of convenience businesses and personal/professional services.
[13]
DOWNTOWN EDMONTON COMMERCIAL, OFFICE AND RESIDENTIAL FORECASTS, 2009 TO 2044 G.P Rollo & Associates, Land Economists Ltd.
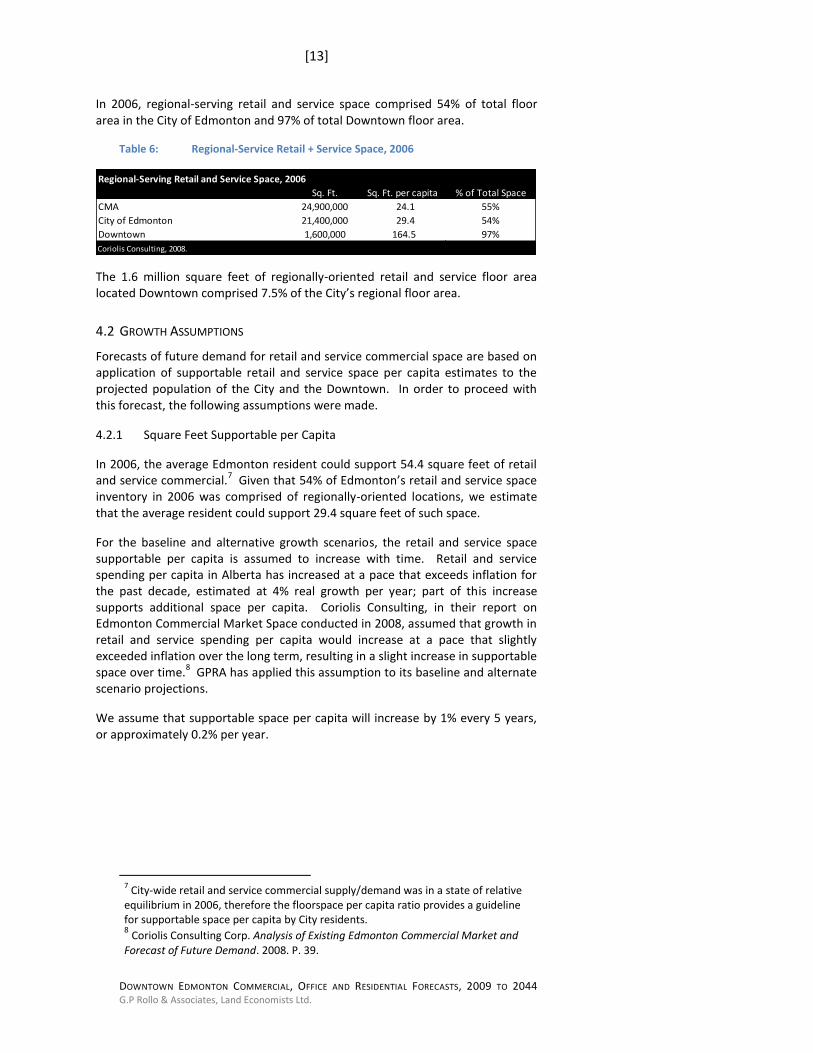
In 2006, regional-serving retail and service space comprised 54% of total floor area in the City of Edmonton and 97% of total Downtown floor area.
Table 6: Regional-Service Retail + Service Space, 2006
Regional-Serving Retail and Service Space, 2006
Sq. Ft. Sq. Ft. per capita % of Total Space
CMA 24,900,000 24.1 55%
City of Edmonton 21,400,000 29.4 54%
Downtown 1,600,000 164.5 97%
Coriolis Consulting, 2008.
The 1.6 million square feet of regionally-oriented retail and service floor area located Downtown comprised 7.5% of the City’s regional floor area.
4.2 GROWTH ASSUMPTIONS
Forecasts of future demand for retail and service commercial space are based on application of supportable retail and service space per capita estimates to the projected population of the City and the Downtown. In order to proceed with this forecast, the following assumptions were made.
4.2.1 Square Feet Supportable per Capita
In 2006, the average Edmonton resident could support 54.4 square feet of retail and service commercial.
7 Given that 54% of Edmonton’s retail and service space
inventory in 2006 was comprised of regionally-oriented locations, we estimate that the average resident could support 29.4 square feet of such space.
For the baseline and alternative growth scenarios, the retail and service space supportable per capita is assumed to increase with time. Retail and service spending per capita in Alberta has increased at a pace that exceeds inflation for the past decade, estimated at 4% real growth per year; part of this increase supports additional space per capita. Coriolis Consulting, in their report on Edmonton Commercial Market Space conducted in 2008, assumed that growth in retail and service spending per capita would increase at a pace that slightly exceeded inflation over the long term, resulting in a slight increase in supportable space over time.
8 GPRA has applied this assumption to its baseline and alternate
scenario projections.
We assume that supportable space per capita will increase by 1% every 5 years, or approximately 0.2% per year.
7 City-wide retail and service commercial supply/demand was in a state of relative
equilibrium in 2006, therefore the floorspace per capita ratio provides a guideline for supportable space per capita by City residents. 8 Coriolis Consulting Corp. Analysis of Existing Edmonton Commercial Market and
Forecast of Future Demand. 2008. P. 39.
[14]
DOWNTOWN EDMONTON COMMERCIAL, OFFICE AND RESIDENTIAL FORECASTS, 2009 TO 2044 G.P Rollo & Associates, Land Economists Ltd.
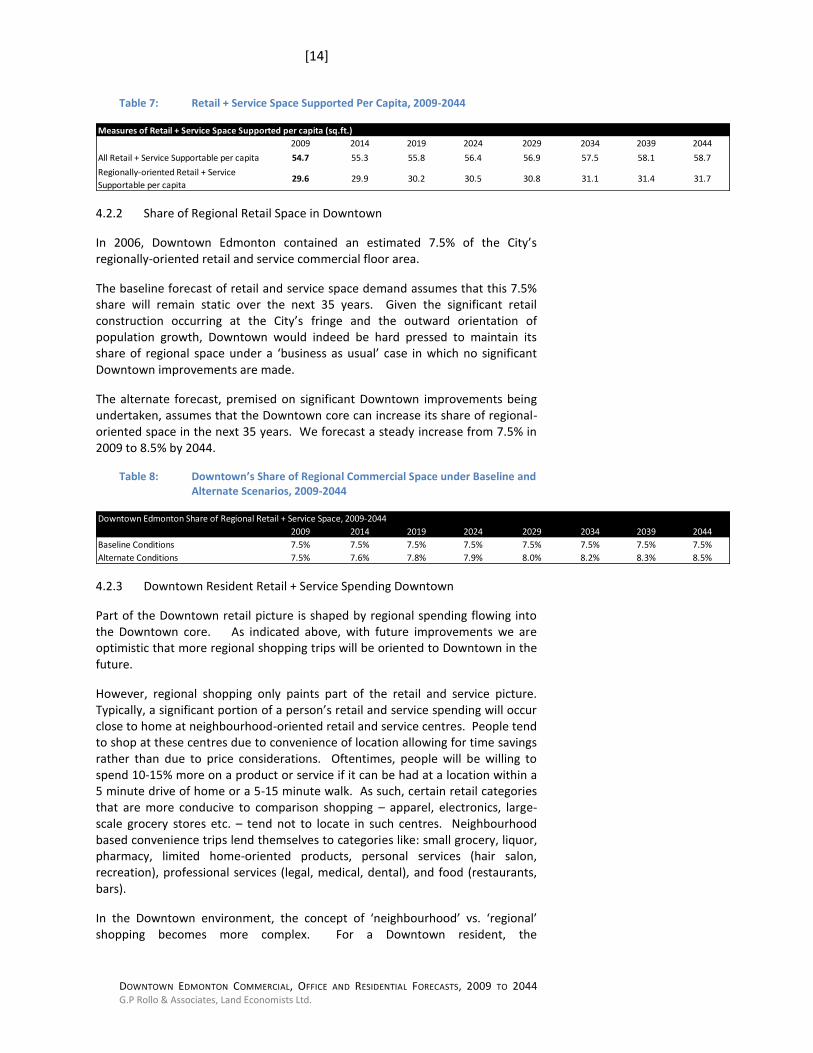
Table 7: Retail + Service Space Supported Per Capita, 2009-2044
Measures of Retail + Service Space Supported per capita (sq.ft.)
2009 2014 2019 2024 2029 2034 2039 2044
All Retail + Service Supportable per capita 54.7 55.3 55.8 56.4 56.9 57.5 58.1 58.7
Regionally-oriented Retail + Service
Supportable per capita29.6 29.9 30.2 30.5 30.8 31.1 31.4 31.7
4.2.2 Share of Regional Retail Space in Downtown
In 2006, Downtown Edmonton contained an estimated 7.5% of the City’s regionally-oriented retail and service commercial floor area.
The baseline forecast of retail and service space demand assumes that this 7.5% share will remain static over the next 35 years. Given the significant retail construction occurring at the City’s fringe and the outward orientation of population growth, Downtown would indeed be hard pressed to maintain its share of regional space under a ‘business as usual’ case in which no significant Downtown improvements are made.
The alternate forecast, premised on significant Downtown improvements being undertaken, assumes that the Downtown core can increase its share of regional-oriented space in the next 35 years. We forecast a steady increase from 7.5% in 2009 to 8.5% by 2044.
Table 8: Downtown’s Share of Regional Commercial Space under Baseline and Alternate Scenarios, 2009-2044
Downtown Edmonton Share of Regional Retail + Service Space, 2009-2044
2009 2014 2019 2024 2029 2034 2039 2044
Baseline Conditions 7.5% 7.5% 7.5% 7.5% 7.5% 7.5% 7.5% 7.5%
Alternate Conditions 7.5% 7.6% 7.8% 7.9% 8.0% 8.2% 8.3% 8.5%
4.2.3 Downtown Resident Retail + Service Spending Downtown
Part of the Downtown retail picture is shaped by regional spending flowing into the Downtown core. As indicated above, with future improvements we are optimistic that more regional shopping trips will be oriented to Downtown in the future.
However, regional shopping only paints part of the retail and service picture. Typically, a significant portion of a person’s retail and service spending will occur close to home at neighbourhood-oriented retail and service centres. People tend to shop at these centres due to convenience of location allowing for time savings rather than due to price considerations. Oftentimes, people will be willing to spend 10-15% more on a product or service if it can be had at a location within a 5 minute drive of home or a 5-15 minute walk. As such, certain retail categories that are more conducive to comparison shopping – apparel, electronics, large-scale grocery stores etc. – tend not to locate in such centres. Neighbourhood based convenience trips lend themselves to categories like: small grocery, liquor, pharmacy, limited home-oriented products, personal services (hair salon, recreation), professional services (legal, medical, dental), and food (restaurants, bars).
In the Downtown environment, the concept of ‘neighbourhood’ vs. ‘regional’ shopping becomes more complex. For a Downtown resident, the
[15]
DOWNTOWN EDMONTON COMMERCIAL, OFFICE AND RESIDENTIAL FORECASTS, 2009 TO 2044 G.P Rollo & Associates, Land Economists Ltd.
‘neighbourhood’ grocery store may also be a large supermarket and the local insurance broker may be located in a large office tower. Therefore creating a sharp delineation between neighbourhood-oriented and regionally-oriented spending is not cut-and-dry.
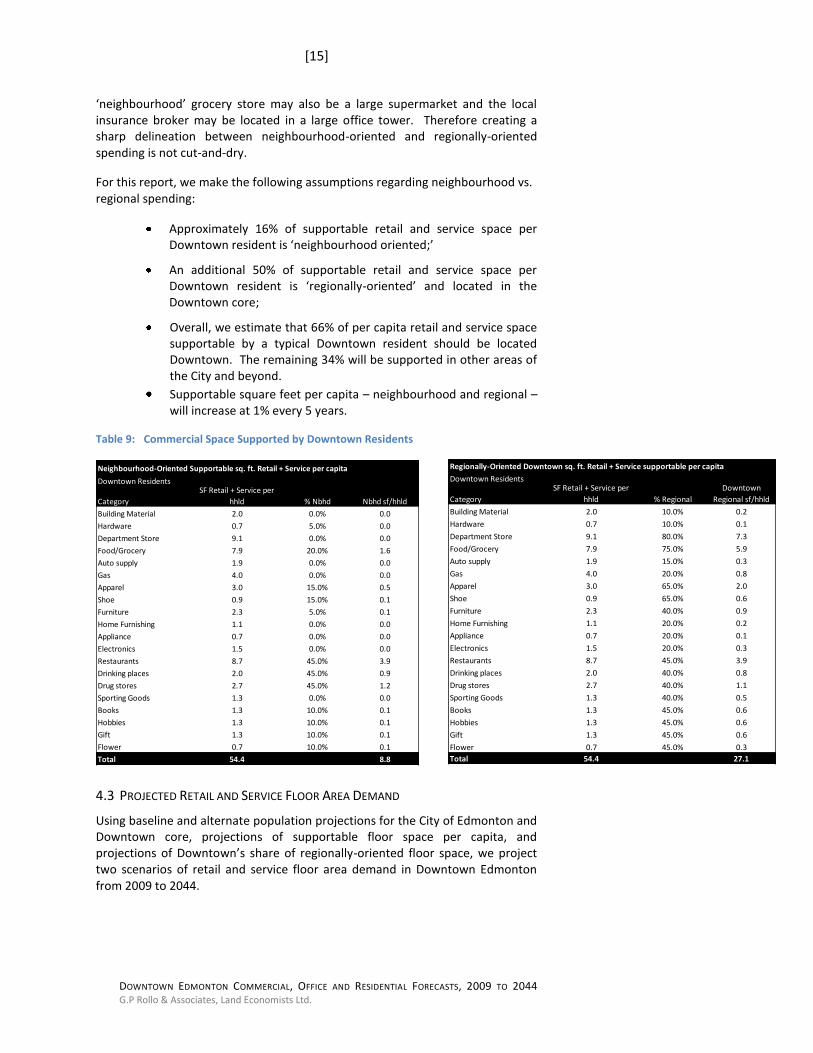
For this report, we make the following assumptions regarding neighbourhood vs. regional spending:
Approximately 16% of supportable retail and service space per Downtown resident is ‘neighbourhood oriented;’
An additional 50% of supportable retail and service space per Downtown resident is ‘regionally-oriented’ and located in the Downtown core;
Overall, we estimate that 66% of per capita retail and service space supportable by a typical Downtown resident should be located Downtown. The remaining 34% will be supported in other areas of the City and beyond.
Supportable square feet per capita – neighbourhood and regional – will increase at 1% every 5 years.
Table 9: Commercial Space Supported by Downtown Residents
Neighbourhood-Oriented Supportable sq. ft. Retail + Service per capita
Downtown Residents
Category
SF Retail + Service per
hhld % Nbhd Nbhd sf/hhld
Building Material 2.0 0.0% 0.0
Hardware 0.7 5.0% 0.0
Department Store 9.1 0.0% 0.0
Food/Grocery 7.9 20.0% 1.6
Auto supply 1.9 0.0% 0.0
Gas 4.0 0.0% 0.0
Apparel 3.0 15.0% 0.5
Shoe 0.9 15.0% 0.1
Furniture 2.3 5.0% 0.1
Home Furnishing 1.1 0.0% 0.0
Appliance 0.7 0.0% 0.0
Electronics 1.5 0.0% 0.0
Restaurants 8.7 45.0% 3.9
Drinking places 2.0 45.0% 0.9
Drug stores 2.7 45.0% 1.2
Sporting Goods 1.3 0.0% 0.0
Books 1.3 10.0% 0.1
Hobbies 1.3 10.0% 0.1
Gift 1.3 10.0% 0.1
Flower 0.7 10.0% 0.1
Total 54.4 8.8
4.3 PROJECTED RETAIL AND SERVICE FLOOR AREA DEMAND
Using baseline and alternate population projections for the City of Edmonton and Downtown core, projections of supportable floor space per capita, and projections of Downtown’s share of regionally-oriented floor space, we project two scenarios of retail and service floor area demand in Downtown Edmonton from 2009 to 2044.
Regionally-Oriented Downtown sq. ft. Retail + Service supportable per capita
Downtown Residents
Category
SF Retail + Service per
hhld % Regional
Downtown
Regional sf/hhld
Building Material 2.0 10.0% 0.2
Hardware 0.7 10.0% 0.1
Department Store 9.1 80.0% 7.3
Food/Grocery 7.9 75.0% 5.9
Auto supply 1.9 15.0% 0.3
Gas 4.0 20.0% 0.8
Apparel 3.0 65.0% 2.0
Shoe 0.9 65.0% 0.6
Furniture 2.3 40.0% 0.9
Home Furnishing 1.1 20.0% 0.2
Appliance 0.7 20.0% 0.1
Electronics 1.5 20.0% 0.3
Restaurants 8.7 45.0% 3.9
Drinking places 2.0 40.0% 0.8
Drug stores 2.7 40.0% 1.1
Sporting Goods 1.3 40.0% 0.5
Books 1.3 45.0% 0.6
Hobbies 1.3 45.0% 0.6
Gift 1.3 45.0% 0.6
Flower 0.7 45.0% 0.3
Total 54.4 27.1
[16]
DOWNTOWN EDMONTON COMMERCIAL, OFFICE AND RESIDENTIAL FORECASTS, 2009 TO 2044 G.P Rollo & Associates, Land Economists Ltd.
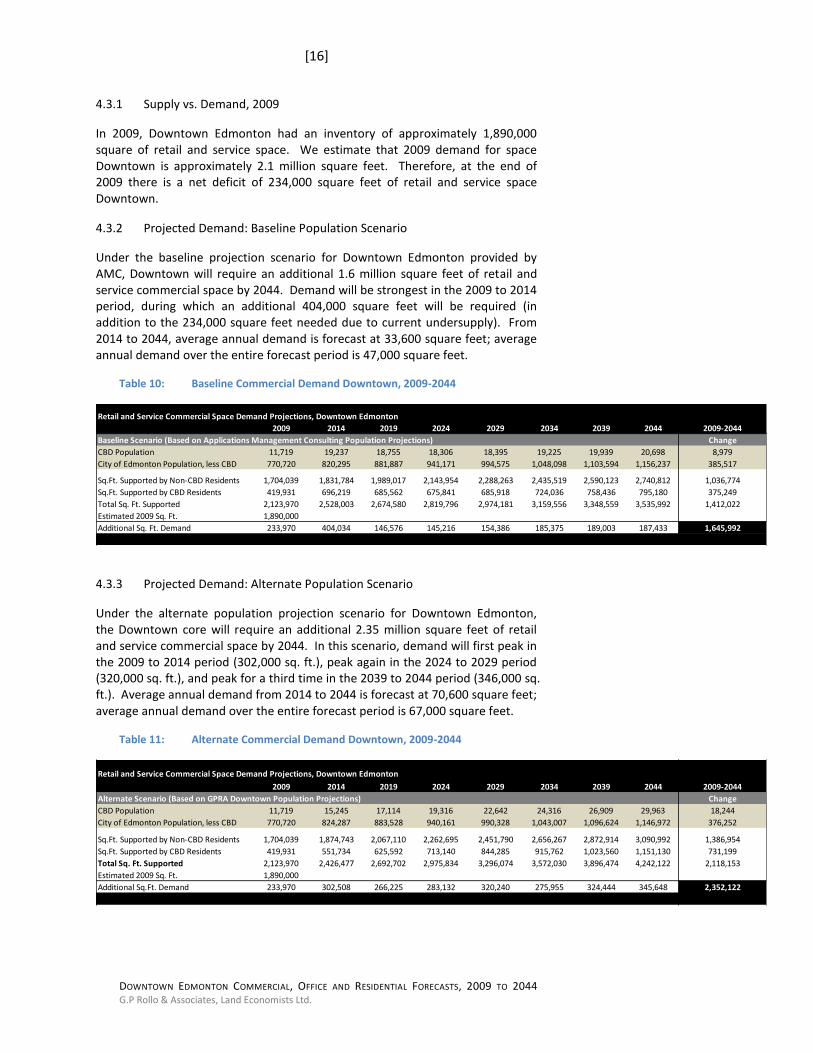
4.3.1 Supply vs. Demand, 2009
In 2009, Downtown Edmonton had an inventory of approximately 1,890,000 square of retail and service space. We estimate that 2009 demand for space Downtown is approximately 2.1 million square feet. Therefore, at the end of 2009 there is a net deficit of 234,000 square feet of retail and service space Downtown.
4.3.2 Projected Demand: Baseline Population Scenario
Under the baseline projection scenario for Downtown Edmonton provided by AMC, Downtown will require an additional 1.6 million square feet of retail and service commercial space by 2044. Demand will be strongest in the 2009 to 2014 period, during which an additional 404,000 square feet will be required (in addition to the 234,000 square feet needed due to current undersupply). From 2014 to 2044, average annual demand is forecast at 33,600 square feet; average annual demand over the entire forecast period is 47,000 square feet.
Table 10: Baseline Commercial Demand Downtown, 2009-2044
Retail and Service Commercial Space Demand Projections, Downtown Edmonton
2009 2014 2019 2024 2029 2034 2039 2044 2009-2044
Baseline Scenario (Based on Applications Management Consulting Population Projections) Change
CBD Population 11,719 19,237 18,755 18,306 18,395 19,225 19,939 20,698 8,979
City of Edmonton Population, less CBD 770,720 820,295 881,887 941,171 994,575 1,048,098 1,103,594 1,156,237 385,517
Sq.Ft. Supported by Non-CBD Residents 1,704,039 1,831,784 1,989,017 2,143,954 2,288,263 2,435,519 2,590,123 2,740,812 1,036,774
Sq.Ft. Supported by CBD Residents 419,931 696,219 685,562 675,841 685,918 724,036 758,436 795,180 375,249
Total Sq. Ft. Supported 2,123,970 2,528,003 2,674,580 2,819,796 2,974,181 3,159,556 3,348,559 3,535,992 1,412,022
Estimated 2009 Sq. Ft. 1,890,000
Additional Sq. Ft. Demand 233,970 404,034 146,576 145,216 154,386 185,375 189,003 187,433 1,645,992
4.3.3 Projected Demand: Alternate Population Scenario
Under the alternate population projection scenario for Downtown Edmonton, the Downtown core will require an additional 2.35 million square feet of retail and service commercial space by 2044. In this scenario, demand will first peak in the 2009 to 2014 period (302,000 sq. ft.), peak again in the 2024 to 2029 period (320,000 sq. ft.), and peak for a third time in the 2039 to 2044 period (346,000 sq. ft.). Average annual demand from 2014 to 2044 is forecast at 70,600 square feet; average annual demand over the entire forecast period is 67,000 square feet.
Table 11: Alternate Commercial Demand Downtown, 2009-2044
Retail and Service Commercial Space Demand Projections, Downtown Edmonton
2009 2014 2019 2024 2029 2034 2039 2044 2009-2044
Alternate Scenario (Based on GPRA Downtown Population Projections) Change
CBD Population 11,719 15,245 17,114 19,316 22,642 24,316 26,909 29,963 18,244
City of Edmonton Population, less CBD 770,720 824,287 883,528 940,161 990,328 1,043,007 1,096,624 1,146,972 376,252
Sq.Ft. Supported by Non-CBD Residents 1,704,039 1,874,743 2,067,110 2,262,695 2,451,790 2,656,267 2,872,914 3,090,992 1,386,954
Sq.Ft. Supported by CBD Residents 419,931 551,734 625,592 713,140 844,285 915,762 1,023,560 1,151,130 731,199
Total Sq. Ft. Supported 2,123,970 2,426,477 2,692,702 2,975,834 3,296,074 3,572,030 3,896,474 4,242,122 2,118,153
Estimated 2009 Sq. Ft. 1,890,000
Additional Sq.Ft. Demand 233,970 302,508 266,225 283,132 320,240 275,955 324,444 345,648 2,352,122

[17]
DOWNTOWN EDMONTON COMMERCIAL, OFFICE AND RESIDENTIAL FORECASTS, 2009 TO 2044 G.P Rollo & Associates, Land Economists Ltd.
Figure 8: Downtown Commercial Demand, Baseline and Alternate, 2009-2044
3,535,992
2,123,970
4,242,122
0
500,000
1,000,000
1,500,000
2,000,000
2,500,000
3,000,000
3,500,000
4,000,000
4,500,000
2009 2014 2019 2024 2029 2034 2039 2044
Retail + Service Commercial Sq. Ft. Demand Downtown Edmonton, 2009-2044
Baseline Population Scenario Alternate Population Scenario
4.4 COMPARISON TO ALTERNATE PROJECTIONS
Both Colliers International and Coriolis Consulting Corp have conducted commercial demand analyses for the City of Edmonton in the past two years.
Colliers International: Edmonton Real Estate Analysis (October 2009)
Colliers forecast demand for retail and service commercial from 2006 to 2041;
Over that time, Colliers forecast demand for 21.5 million square feet for the City of Edmonton and 4.9 million square feet for the Downtown. This forecast therefore assumes that 23% of future space demand will be constructed Downtown.
In 2006, the CBD accounted for only 4% of citywide retail and service
space, and 7.5% of citywide regionally-oriented retail and service space.
Under our ‘alternate’ (catalyst) population projection scenario, Downtown commercial space growth will account for 11% of citywide growth.
Colliers foresees 23% of citywide commercial growth occurring Downtown over 35 years.
Coriolis Consulting Corp: Analysis of Existing Edmonton Commercial Market and Forecast of Future Demand (January 2008)
Coriolis forecast demand for retail and service commercial from 2006 to 2041;
[18]
DOWNTOWN EDMONTON COMMERCIAL, OFFICE AND RESIDENTIAL FORECASTS, 2009 TO 2044 G.P Rollo & Associates, Land Economists Ltd.
Over that time, Coriolis forecast demand for 22.7 million square feet for the City of Edmonton and 1.65 million square feet for the combined Downtown and fringe.
Coriolis’ projections assumes that Downtown and fringe capture 10% of additional regional retail and service demand
It is our opinion that Coriolis underestimates the potential for additional
neighbourhood-oriented retail and service space in the Downtown, specifically in areas targeted for residential growth like the Warehouse District and McKay Avenue.
[19]
DOWNTOWN EDMONTON COMMERCIAL, OFFICE AND RESIDENTIAL FORECASTS, 2009 TO 2044 G.P Rollo & Associates, Land Economists Ltd.
5.0 DOWNTOWN RESIDENTIAL DEMAND
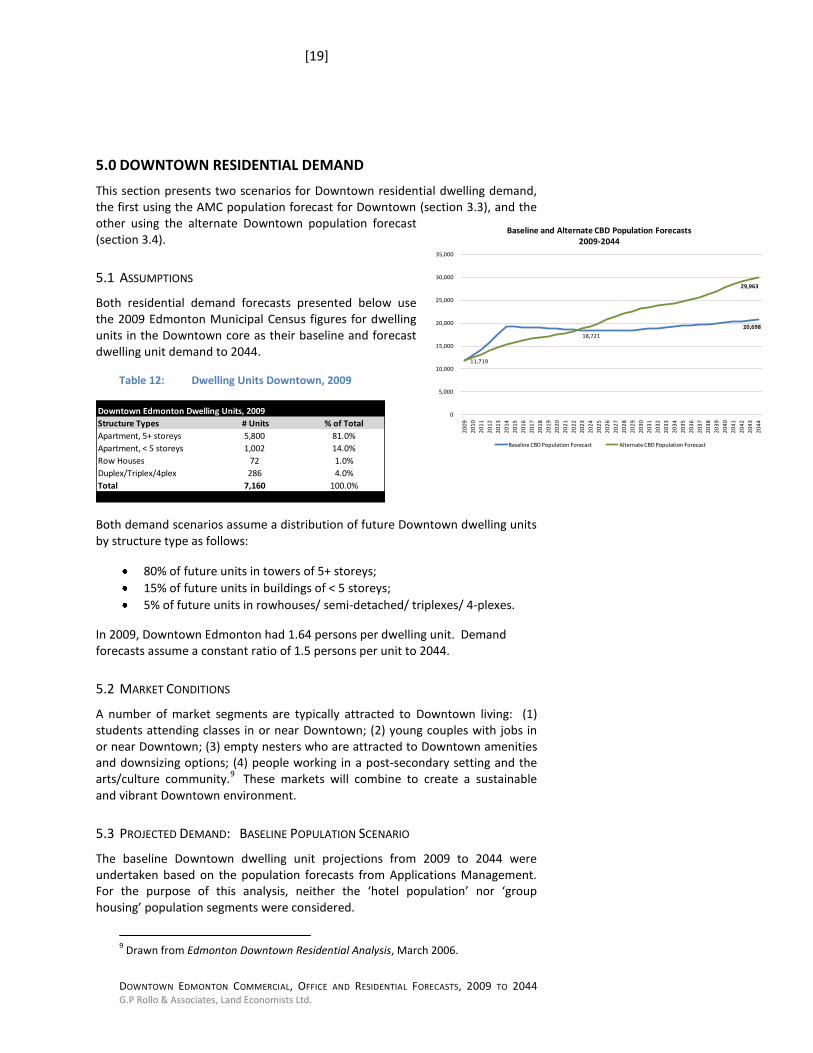
This section presents two scenarios for Downtown residential dwelling demand, the first using the AMC population forecast for Downtown (section 3.3), and the other using the alternate Downtown population forecast (section 3.4).
5.1 ASSUMPTIONS
Both residential demand forecasts presented below use the 2009 Edmonton Municipal Census figures for dwelling units in the Downtown core as their baseline and forecast dwelling unit demand to 2044.
Table 12: Dwelling Units Downtown, 2009
Downtown Edmonton Dwelling Units, 2009
Structure Types # Units % of Total
Apartment, 5+ storeys 5,800 81.0%
Apartment, < 5 storeys 1,002 14.0%
Row Houses 72 1.0%
Duplex/Triplex/4plex 286 4.0%
Total 7,160 100.0%
Both demand scenarios assume a distribution of future Downtown dwelling units by structure type as follows:
80% of future units in towers of 5+ storeys;
15% of future units in buildings of < 5 storeys;
5% of future units in rowhouses/ semi-detached/ triplexes/ 4-plexes.
In 2009, Downtown Edmonton had 1.64 persons per dwelling unit. Demand forecasts assume a constant ratio of 1.5 persons per unit to 2044.
5.2 MARKET CONDITIONS
A number of market segments are typically attracted to Downtown living: (1) students attending classes in or near Downtown; (2) young couples with jobs in or near Downtown; (3) empty nesters who are attracted to Downtown amenities and downsizing options; (4) people working in a post-secondary setting and the arts/culture community.
9 These markets will combine to create a sustainable
and vibrant Downtown environment.
5.3 PROJECTED DEMAND: BASELINE POPULATION SCENARIO
The baseline Downtown dwelling unit projections from 2009 to 2044 were undertaken based on the population forecasts from Applications Management. For the purpose of this analysis, neither the ‘hotel population’ nor ‘group housing’ population segments were considered.
9 Drawn from Edmonton Downtown Residential Analysis, March 2006.
20,698
11,719
18,721
29,963
0
5,000
10,000
15,000
20,000
25,000
30,000
35,000
20
09
20
10
20
11
20
12
20
13
20
14
20
15
20
16
20
17
20
18
20
19
20
20
20
21
20
22
20
23
20
24
20
25
20
26
20
27
20
28
20
29
20
30
20
31
20
32
20
33
20
34
20
35
20
36
20
37
20
38
20
39
20
40
20
41
20
42
20
43
20
44
Baseline and Alternate CBD Population Forecasts2009-2044
Baseline CBD Population Forecast Alternate CBD Population Forecast
[20]
DOWNTOWN EDMONTON COMMERCIAL, OFFICE AND RESIDENTIAL FORECASTS, 2009 TO 2044 G.P Rollo & Associates, Land Economists Ltd.
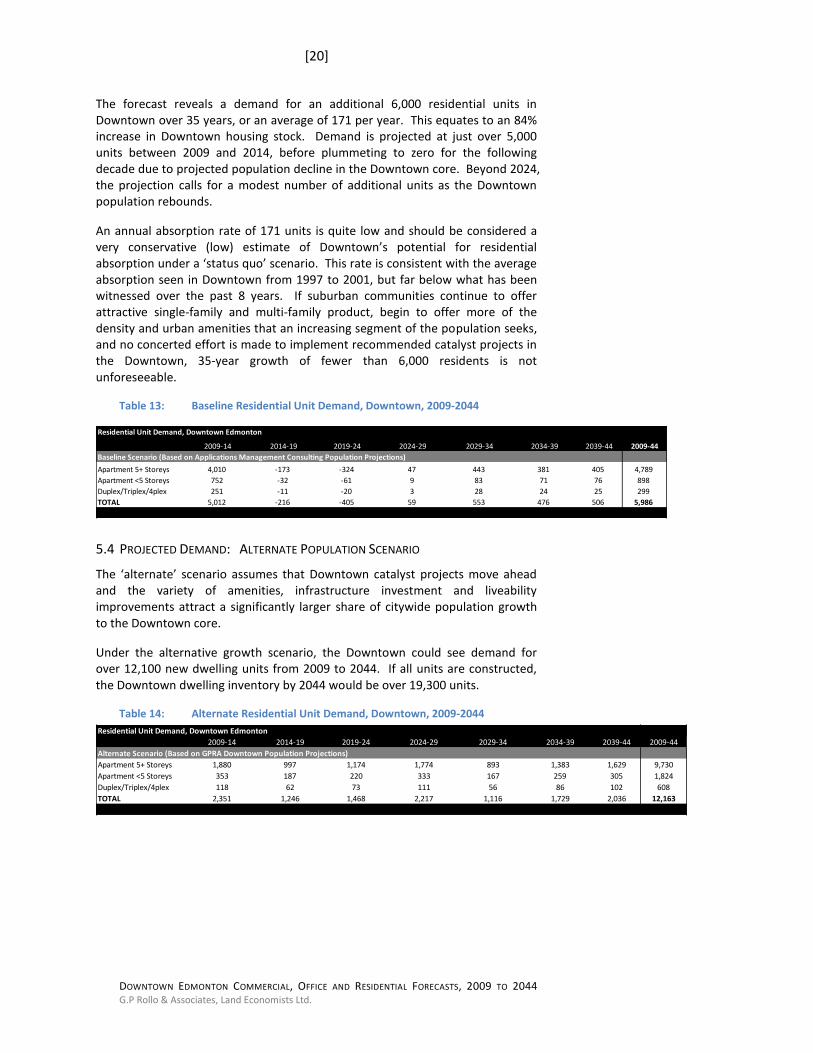
The forecast reveals a demand for an additional 6,000 residential units in Downtown over 35 years, or an average of 171 per year. This equates to an 84% increase in Downtown housing stock. Demand is projected at just over 5,000 units between 2009 and 2014, before plummeting to zero for the following decade due to projected population decline in the Downtown core. Beyond 2024, the projection calls for a modest number of additional units as the Downtown population rebounds.
An annual absorption rate of 171 units is quite low and should be considered a very conservative (low) estimate of Downtown’s potential for residential absorption under a ‘status quo’ scenario. This rate is consistent with the average absorption seen in Downtown from 1997 to 2001, but far below what has been witnessed over the past 8 years. If suburban communities continue to offer attractive single-family and multi-family product, begin to offer more of the density and urban amenities that an increasing segment of the population seeks, and no concerted effort is made to implement recommended catalyst projects in the Downtown, 35-year growth of fewer than 6,000 residents is not unforeseeable.
Table 13: Baseline Residential Unit Demand, Downtown, 2009-2044
Residential Unit Demand, Downtown Edmonton
2009-14 2014-19 2019-24 2024-29 2029-34 2034-39 2039-44 2009-44
Baseline Scenario (Based on Applications Management Consulting Population Projections)
Apartment 5+ Storeys 4,010 -173 -324 47 443 381 405 4,789
Apartment <5 Storeys 752 -32 -61 9 83 71 76 898
Duplex/Triplex/4plex 251 -11 -20 3 28 24 25 299
TOTAL 5,012 -216 -405 59 553 476 506 5,986
5.4 PROJECTED DEMAND: ALTERNATE POPULATION SCENARIO
The ‘alternate’ scenario assumes that Downtown catalyst projects move ahead and the variety of amenities, infrastructure investment and liveability improvements attract a significantly larger share of citywide population growth to the Downtown core.
Under the alternative growth scenario, the Downtown could see demand for over 12,100 new dwelling units from 2009 to 2044. If all units are constructed, the Downtown dwelling inventory by 2044 would be over 19,300 units.
Table 14: Alternate Residential Unit Demand, Downtown, 2009-2044
Residential Unit Demand, Downtown Edmonton
2009-14 2014-19 2019-24 2024-29 2029-34 2034-39 2039-44 2009-44
Alternate Scenario (Based on GPRA Downtown Population Projections)
Apartment 5+ Storeys 1,880 997 1,174 1,774 893 1,383 1,629 9,730
Apartment <5 Storeys 353 187 220 333 167 259 305 1,824
Duplex/Triplex/4plex 118 62 73 111 56 86 102 608
TOTAL 2,351 1,246 1,468 2,217 1,116 1,729 2,036 12,163
[21]
DOWNTOWN EDMONTON COMMERCIAL, OFFICE AND RESIDENTIAL FORECASTS, 2009 TO 2044 G.P Rollo & Associates, Land Economists Ltd.
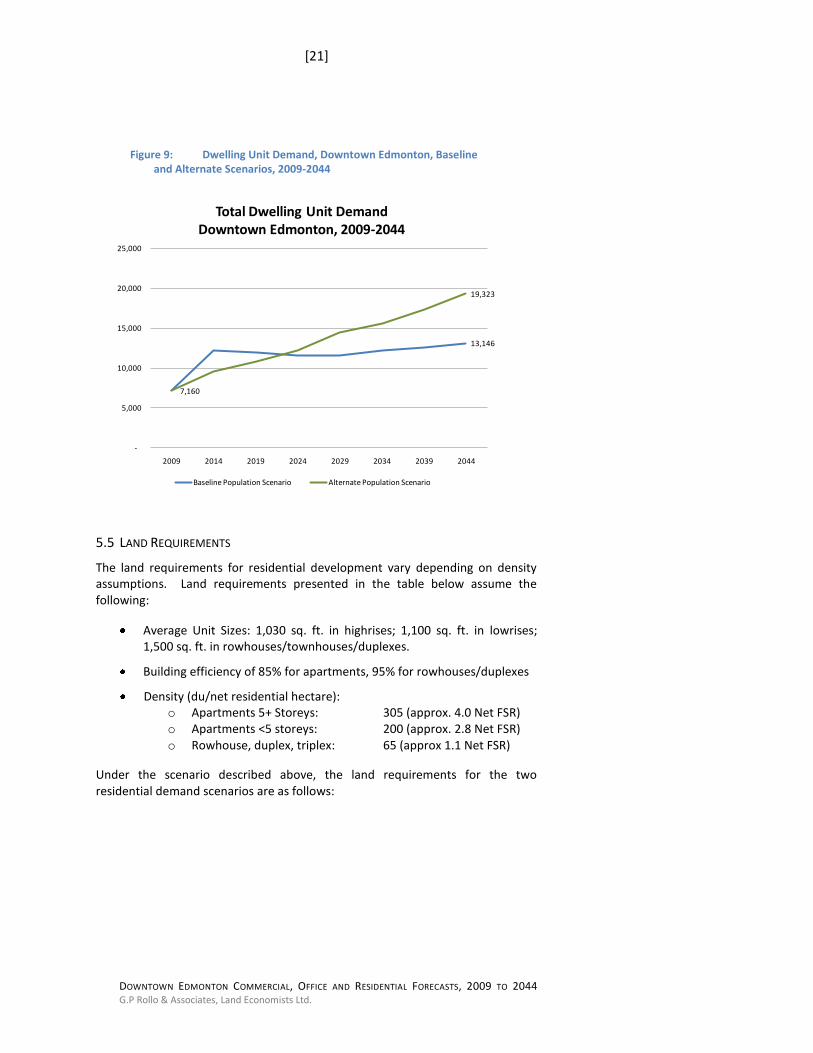
5.5 LAND REQUIREMENTS
The land requirements for residential development vary depending on density assumptions. Land requirements presented in the table below assume the following:
Average Unit Sizes: 1,030 sq. ft. in highrises; 1,100 sq. ft. in lowrises; 1,500 sq. ft. in rowhouses/townhouses/duplexes.
Building efficiency of 85% for apartments, 95% for rowhouses/duplexes
Density (du/net residential hectare): o Apartments 5+ Storeys: 305 (approx. 4.0 Net FSR) o Apartments <5 storeys: 200 (approx. 2.8 Net FSR) o Rowhouse, duplex, triplex: 65 (approx 1.1 Net FSR)
Under the scenario described above, the land requirements for the two residential demand scenarios are as follows:
13,146
7,160
19,323
-
5,000
10,000
15,000
20,000
25,000
2009 2014 2019 2024 2029 2034 2039 2044
Total Dwelling Unit Demand Downtown Edmonton, 2009-2044
Baseline Population Scenario Alternate Population Scenario
Figure 9: Dwelling Unit Demand, Downtown Edmonton, Baseline and Alternate Scenarios, 2009-2044
[22]
DOWNTOWN EDMONTON COMMERCIAL, OFFICE AND RESIDENTIAL FORECASTS, 2009 TO 2044 G.P Rollo & Associates, Land Economists Ltd.
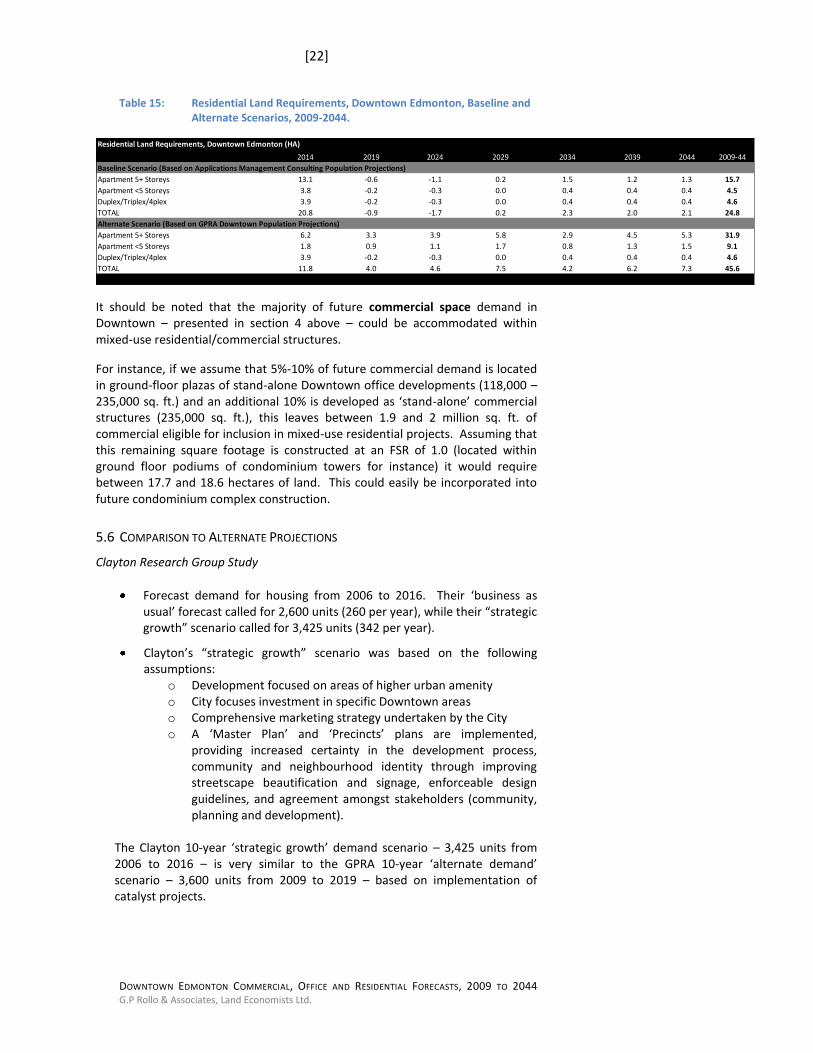
Table 15: Residential Land Requirements, Downtown Edmonton, Baseline and Alternate Scenarios, 2009-2044.
Residential Land Requirements, Downtown Edmonton (HA)
2014 2019 2024 2029 2034 2039 2044 2009-44
Baseline Scenario (Based on Applications Management Consulting Population Projections)
Apartment 5+ Storeys 13.1 -0.6 -1.1 0.2 1.5 1.2 1.3 15.7
Apartment <5 Storeys 3.8 -0.2 -0.3 0.0 0.4 0.4 0.4 4.5
Duplex/Triplex/4plex 3.9 -0.2 -0.3 0.0 0.4 0.4 0.4 4.6
TOTAL 20.8 -0.9 -1.7 0.2 2.3 2.0 2.1 24.8
Alternate Scenario (Based on GPRA Downtown Population Projections)
Apartment 5+ Storeys 6.2 3.3 3.9 5.8 2.9 4.5 5.3 31.9
Apartment <5 Storeys 1.8 0.9 1.1 1.7 0.8 1.3 1.5 9.1
Duplex/Triplex/4plex 3.9 -0.2 -0.3 0.0 0.4 0.4 0.4 4.6
TOTAL 11.8 4.0 4.6 7.5 4.2 6.2 7.3 45.6
It should be noted that the majority of future commercial space demand in Downtown – presented in section 4 above – could be accommodated within mixed-use residential/commercial structures.
For instance, if we assume that 5%-10% of future commercial demand is located in ground-floor plazas of stand-alone Downtown office developments (118,000 – 235,000 sq. ft.) and an additional 10% is developed as ‘stand-alone’ commercial structures (235,000 sq. ft.), this leaves between 1.9 and 2 million sq. ft. of commercial eligible for inclusion in mixed-use residential projects. Assuming that this remaining square footage is constructed at an FSR of 1.0 (located within ground floor podiums of condominium towers for instance) it would require between 17.7 and 18.6 hectares of land. This could easily be incorporated into future condominium complex construction.
5.6 COMPARISON TO ALTERNATE PROJECTIONS
Clayton Research Group Study
Forecast demand for housing from 2006 to 2016. Their ‘business as usual’ forecast called for 2,600 units (260 per year), while their “strategic growth” scenario called for 3,425 units (342 per year).
Clayton’s “strategic growth” scenario was based on the following assumptions:
o Development focused on areas of higher urban amenity o City focuses investment in specific Downtown areas o Comprehensive marketing strategy undertaken by the City o A ‘Master Plan’ and ‘Precincts’ plans are implemented,
providing increased certainty in the development process, community and neighbourhood identity through improving streetscape beautification and signage, enforceable design guidelines, and agreement amongst stakeholders (community, planning and development).
The Clayton 10-year ‘strategic growth’ demand scenario – 3,425 units from 2006 to 2016 – is very similar to the GPRA 10-year ‘alternate demand’ scenario – 3,600 units from 2009 to 2019 – based on implementation of catalyst projects.
[23]
DOWNTOWN EDMONTON COMMERCIAL, OFFICE AND RESIDENTIAL FORECASTS, 2009 TO 2044 G.P Rollo & Associates, Land Economists Ltd.
Colliers’s Edmonton Real Estate Analysis
Colliers forecast an increase of 29,632 housing units in Downtown Edmonton from 2006 to 2041 (average of 846 units per year). This was determined by allocating 18% of the City’s total forecast housing growth to Downtown Edmonton.
In our opinion, this forecast is too aggressive for Downtown. If we assume 1.5 persons per household to the forecast horizon, 29,632 new units equates to an additional 44,448 residents to Downtown Edmonton from 2006 to 2041, or a 357% increase from the 2006 population of just over 9,000.
[24]
DOWNTOWN EDMONTON COMMERCIAL, OFFICE AND RESIDENTIAL FORECASTS, 2009 TO 2044 G.P Rollo & Associates, Land Economists Ltd.
-
6.0 DOWNTOWN OFFICE SPACE DEMAND
6.1 MARKET CONDITIONS
Edmonton’s office market has been quite resilient in recent years. Despite increasing vacancies from 2008 to 2009 (5.3% to 5.9%), available space continues to have 1-2% lower vacancies than other markets in the country. There has been an overall downward trend in office vacancy since a peak of 18.9% in 2000. It has been noted that much of the vacancy is related to large tenants pursuing space elsewhere in the City primarily due to price considerations, combined with various tenants downsizing their office needs.
The Downtown Financial District represents approximately 2/3rds of the Downtown office market (10.3 million square feet). This district has seen a slight increase in vacancy in recent months, reaching 5.9% by third quarter 2009. Three major office towers had a cumulative vacancy of nearly 226,000 square feet, resulting in a slight softening of rental rates. The medium and long term forecast is for significant opportunity for investment in the financial district office market.
The Downtown Government District comprised approximately 5.2 million square feet in 2009. There has been very little net change in overall vacancy in this district, with a steady rate of 5.9%. With much of the office space in this district occupied by government agencies, vacancy fluctuations are much less likely. Overall investment in the Government District remains solid and is forecast to remain so in the medium and longer terms.
In 2009, the City of Edmonton had an inventory of nearly 23.6 million square feet of office space. Approximately 66% of this space, or 15.51 million square feet, was located in the Downtown core across both the Financial and Government Districts.
6.2 DOWNTOWN EMPLOYMENT AND OFFICE SPACE FORECASTS
Demand for office space is calculated on the basis of square feet of office space used per office employee. Space projections are premised on the following:
2009 Downtown office space inventory: 15,507,593 square feet (Avison Young);
2009 Downtown office employment inventory: 67,712;
238 office employees per square foot. This ratio is held constant through to 2044.
6.2.1 Baseline Forecast
Applications Management has provided a baseline forecast of Downtown employment from 2009 to 2044. We believe that this forecast is realistic under a ‘status quo’ scenario where significant Downtown projects are not undertaken and an abundance of attractive employment land continues to be available at the City’s periphery.
[25]
DOWNTOWN EDMONTON COMMERCIAL, OFFICE AND RESIDENTIAL FORECASTS, 2009 TO 2044 G.P Rollo & Associates, Land Economists Ltd.
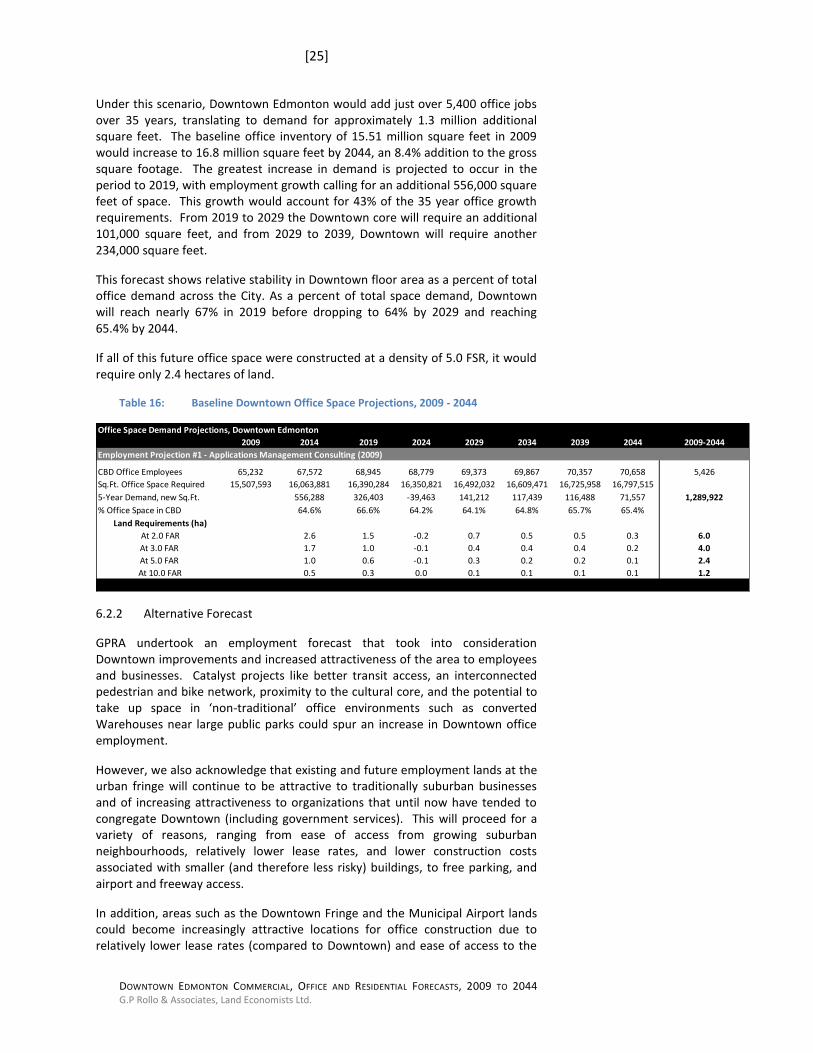
Under this scenario, Downtown Edmonton would add just over 5,400 office jobs over 35 years, translating to demand for approximately 1.3 million additional square feet. The baseline office inventory of 15.51 million square feet in 2009 would increase to 16.8 million square feet by 2044, an 8.4% addition to the gross square footage. The greatest increase in demand is projected to occur in the period to 2019, with employment growth calling for an additional 556,000 square feet of space. This growth would account for 43% of the 35 year office growth requirements. From 2019 to 2029 the Downtown core will require an additional 101,000 square feet, and from 2029 to 2039, Downtown will require another 234,000 square feet.
This forecast shows relative stability in Downtown floor area as a percent of total office demand across the City. As a percent of total space demand, Downtown will reach nearly 67% in 2019 before dropping to 64% by 2029 and reaching 65.4% by 2044.
If all of this future office space were constructed at a density of 5.0 FSR, it would require only 2.4 hectares of land.
Table 16: Baseline Downtown Office Space Projections, 2009 - 2044
Office Space Demand Projections, Downtown Edmonton
2009 2014 2019 2024 2029 2034 2039 2044 2009-2044
Employment Projection #1 - Applications Management Consulting (2009)
CBD Office Employees 65,232 67,572 68,945 68,779 69,373 69,867 70,357 70,658 5,426
Sq.Ft. Office Space Required 15,507,593 16,063,881 16,390,284 16,350,821 16,492,032 16,609,471 16,725,958 16,797,515
5-Year Demand, new Sq.Ft. 556,288 326,403 -39,463 141,212 117,439 116,488 71,557 1,289,922
% Office Space in CBD 64.6% 66.6% 64.2% 64.1% 64.8% 65.7% 65.4%
Land Requirements (ha)
At 2.0 FAR 2.6 1.5 -0.2 0.7 0.5 0.5 0.3 6.0
At 3.0 FAR 1.7 1.0 -0.1 0.4 0.4 0.4 0.2 4.0
At 5.0 FAR 1.0 0.6 -0.1 0.3 0.2 0.2 0.1 2.4
At 10.0 FAR 0.5 0.3 0.0 0.1 0.1 0.1 0.1 1.2
6.2.2 Alternative Forecast
GPRA undertook an employment forecast that took into consideration Downtown improvements and increased attractiveness of the area to employees and businesses. Catalyst projects like better transit access, an interconnected pedestrian and bike network, proximity to the cultural core, and the potential to take up space in ‘non-traditional’ office environments such as converted Warehouses near large public parks could spur an increase in Downtown office employment.
However, we also acknowledge that existing and future employment lands at the urban fringe will continue to be attractive to traditionally suburban businesses and of increasing attractiveness to organizations that until now have tended to congregate Downtown (including government services). This will proceed for a variety of reasons, ranging from ease of access from growing suburban neighbourhoods, relatively lower lease rates, and lower construction costs associated with smaller (and therefore less risky) buildings, to free parking, and airport and freeway access.
In addition, areas such as the Downtown Fringe and the Municipal Airport lands could become increasingly attractive locations for office construction due to relatively lower lease rates (compared to Downtown) and ease of access to the
[26]
DOWNTOWN EDMONTON COMMERCIAL, OFFICE AND RESIDENTIAL FORECASTS, 2009 TO 2044 G.P Rollo & Associates, Land Economists Ltd.
core. Construction of office ‘clusters’ near the Downtown would likely be buttressed by LRT extensions and development of mixed-use transit-oriented nodes.
Given the above factors, we offer a relatively conservative alternate Downtown employment growth scenario premised on surging strength of the suburban office market and growth in the Downtown fringe office market.
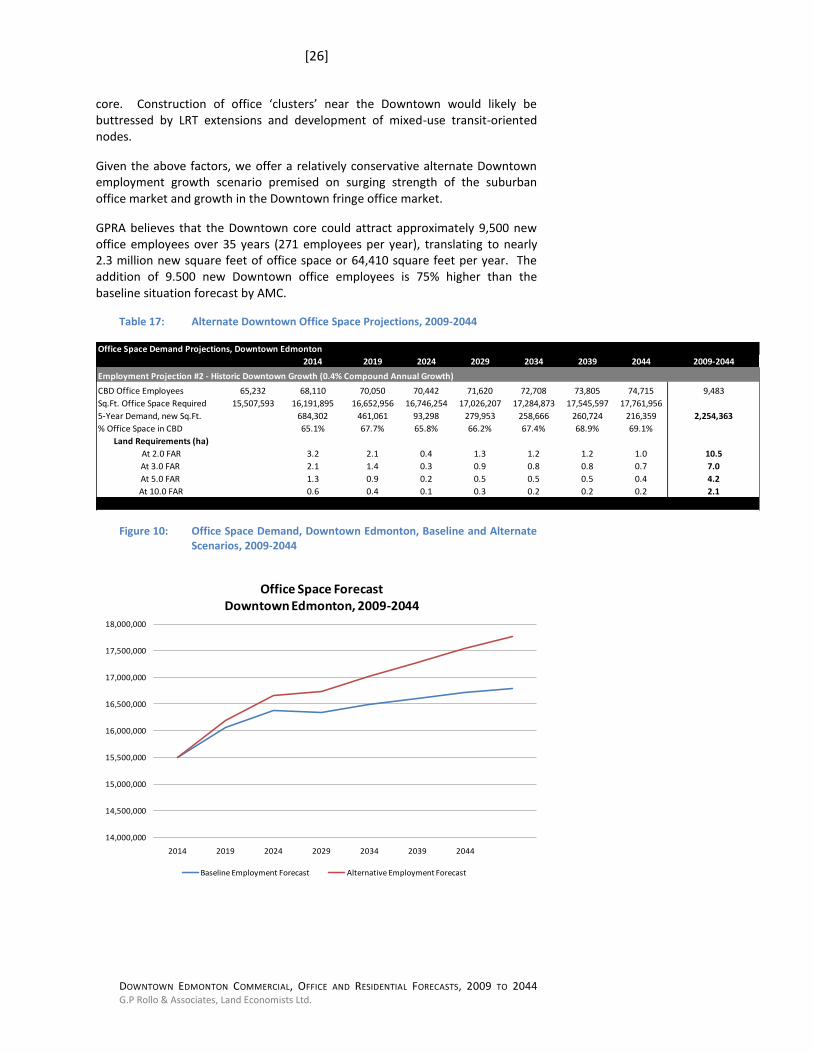
GPRA believes that the Downtown core could attract approximately 9,500 new office employees over 35 years (271 employees per year), translating to nearly 2.3 million new square feet of office space or 64,410 square feet per year. The addition of 9.500 new Downtown office employees is 75% higher than the baseline situation forecast by AMC.
Table 17: Alternate Downtown Office Space Projections, 2009-2044
Office Space Demand Projections, Downtown Edmonton
2014 2019 2024 2029 2034 2039 2044 2009-2044
Employment Projection #2 - Historic Downtown Growth (0.4% Compound Annual Growth)
CBD Office Employees 65,232 68,110 70,050 70,442 71,620 72,708 73,805 74,715 9,483
Sq.Ft. Office Space Required 15,507,593 16,191,895 16,652,956 16,746,254 17,026,207 17,284,873 17,545,597 17,761,956
5-Year Demand, new Sq.Ft. 684,302 461,061 93,298 279,953 258,666 260,724 216,359 2,254,363
% Office Space in CBD 65.1% 67.7% 65.8% 66.2% 67.4% 68.9% 69.1%
Land Requirements (ha)
At 2.0 FAR 3.2 2.1 0.4 1.3 1.2 1.2 1.0 10.5
At 3.0 FAR 2.1 1.4 0.3 0.9 0.8 0.8 0.7 7.0
At 5.0 FAR 1.3 0.9 0.2 0.5 0.5 0.5 0.4 4.2
At 10.0 FAR 0.6 0.4 0.1 0.3 0.2 0.2 0.2 2.1
Figure 10: Office Space Demand, Downtown Edmonton, Baseline and Alternate Scenarios, 2009-2044
14,000,000
14,500,000
15,000,000
15,500,000
16,000,000
16,500,000
17,000,000
17,500,000
18,000,000
2014 2019 2024 2029 2034 2039 2044
Office Space ForecastDowntown Edmonton, 2009-2044
Baseline Employment Forecast Alternative Employment Forecast
[27]
DOWNTOWN EDMONTON COMMERCIAL, OFFICE AND RESIDENTIAL FORECASTS, 2009 TO 2044 G.P Rollo & Associates, Land Economists Ltd.
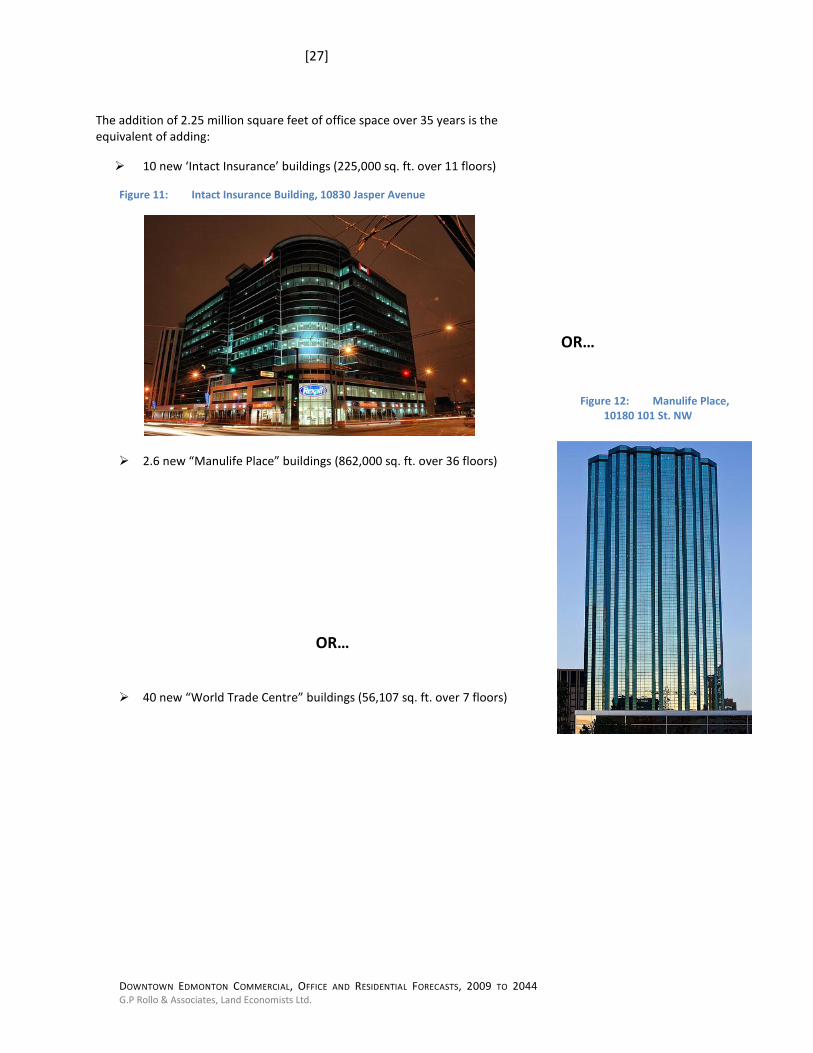
The addition of 2.25 million square feet of office space over 35 years is the equivalent of adding:
10 new ‘Intact Insurance’ buildings (225,000 sq. ft. over 11 floors)
Figure 11: Intact Insurance Building, 10830 Jasper Avenue
2.6 new “Manulife Place” buildings (862,000 sq. ft. over 36 floors)
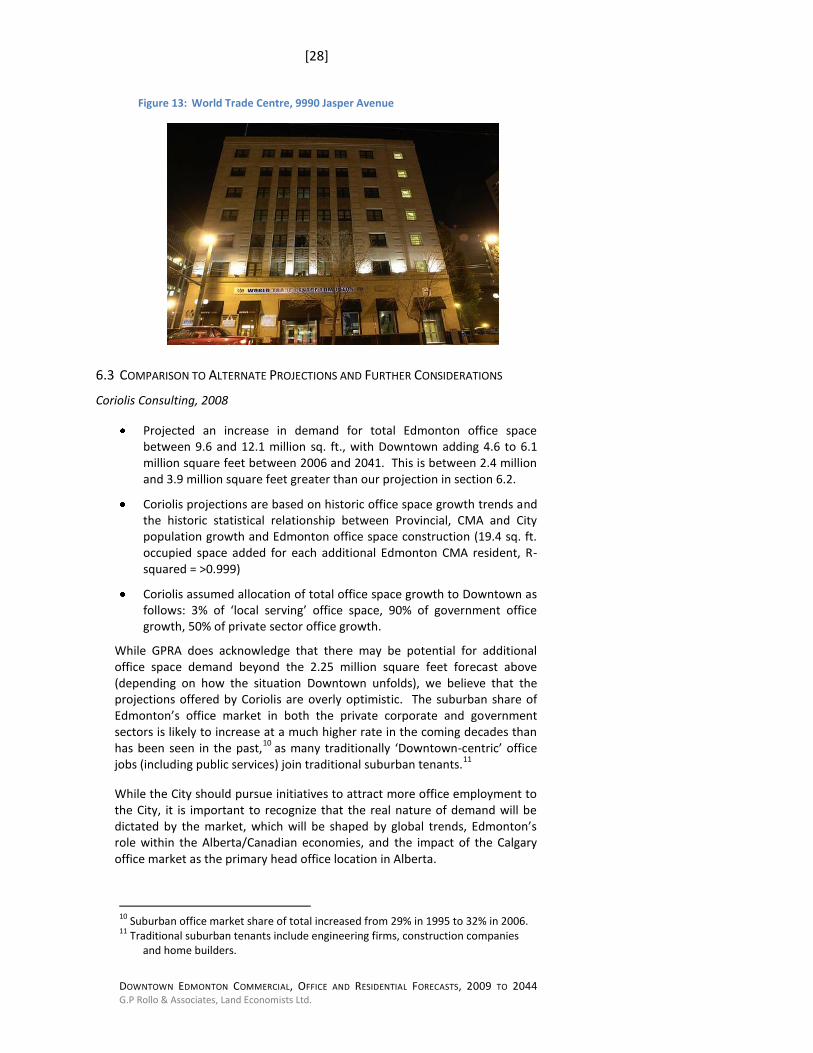
40 new “World Trade Centre” buildings (56,107 sq. ft. over 7 floors)
Figure 12: Manulife Place, 10180 101 St. NW
OR…
OR…
[28]
DOWNTOWN EDMONTON COMMERCIAL, OFFICE AND RESIDENTIAL FORECASTS, 2009 TO 2044 G.P Rollo & Associates, Land Economists Ltd.
Figure 13: World Trade Centre, 9990 Jasper Avenue
6.3 COMPARISON TO ALTERNATE PROJECTIONS AND FURTHER CONSIDERATIONS
Coriolis Consulting, 2008
Projected an increase in demand for total Edmonton office space between 9.6 and 12.1 million sq. ft., with Downtown adding 4.6 to 6.1 million square feet between 2006 and 2041. This is between 2.4 million and 3.9 million square feet greater than our projection in section 6.2.
Coriolis projections are based on historic office space growth trends and the historic statistical relationship between Provincial, CMA and City population growth and Edmonton office space construction (19.4 sq. ft. occupied space added for each additional Edmonton CMA resident, R-squared = >0.999)
Coriolis assumed allocation of total office space growth to Downtown as follows: 3% of ‘local serving’ office space, 90% of government office growth, 50% of private sector office growth.
While GPRA does acknowledge that there may be potential for additional office space demand beyond the 2.25 million square feet forecast above (depending on how the situation Downtown unfolds), we believe that the projections offered by Coriolis are overly optimistic. The suburban share of Edmonton’s office market in both the private corporate and government sectors is likely to increase at a much higher rate in the coming decades than has been seen in the past,
10 as many traditionally ‘Downtown-centric’ office
jobs (including public services) join traditional suburban tenants.11
While the City should pursue initiatives to attract more office employment to the City, it is important to recognize that the real nature of demand will be dictated by the market, which will be shaped by global trends, Edmonton’s role within the Alberta/Canadian economies, and the impact of the Calgary office market as the primary head office location in Alberta.
10
Suburban office market share of total increased from 29% in 1995 to 32% in 2006. 11
Traditional suburban tenants include engineering firms, construction companies and home builders.

[29]
DOWNTOWN EDMONTON COMMERCIAL, OFFICE AND RESIDENTIAL FORECASTS, 2009 TO 2044 G.P Rollo & Associates, Land Economists Ltd.
Initiatives undertaken by the City will likely have a positive impact on attracting additional office space Downtown. However, as illustrated above, they are unlikely to increase demand to levels forecast in other reports.
There is insufficient market demand to support the high FSRs allocated to Downtown under current zoning. While there may be instances of occasional office buildings that support such high (or higher) ratios, we cannot envisage there being demand to warrant such high densities throughout the entire Downtown.
7.0 CONCLUSION
Under a scenario where key catalyst projects are implemented in the Downtown core as part of a coherent planning vision for the City, GPRA foresees long-term demand for residential units, commercial retail space and office space rising above baseline demand figures. While AMC does forecast a larger ‘surge’ in the short term for population growth (and thus residential and commercial demand) Downtown, over the long term the alternate scenario provides for more jobs, resident and commercial businesses Downtown.
Below we offer a summary table of baseline and alternate demand scenarios.
Table 18: Summary Demand Table: Residential, Office and Retail/Service
Cummulative New Demand, Basline (AMC) vs. Alternate (GPRA) Population and Employment Projection Scenarios
2009 2014 2019 2024 2029 2034 2039 2044
AMC 0 5,012 4,796 4,391 4,451 5,004 5,480 5,986
GPRA 0 2,351 3,597 5,065 7,282 8,398 10,127 12,163
Difference 0 -2,661 -1,199 674 2,831 3,394 4,647 6,177
AMC 0 5,092,192 4,873,062 4,461,595 4,521,877 5,084,064 5,567,680 6,081,776
GPRA 0 2,388,132 3,654,472 5,145,881 7,398,564 8,532,233 10,288,713 12,357,374
Difference 0 -2,704,060 -1,218,590 684,286 2,876,687 3,448,169 4,721,033 6,275,598
AMC 0 556,288 882,691 843,228 984,439 1,101,878 1,218,365 1,289,922
GPRA 0 684,302 1,145,363 1,238,661 1,518,614 1,777,280 2,038,004 2,254,363
Difference 0 128,015 262,672 395,433 534,175 675,402 819,638 964,441
AMC 233,970 638,003 784,580 929,796 1,084,181 1,269,556 1,458,559 1,645,992
GPRA 233,970 536,477 802,702 1,085,834 1,406,074 1,682,030 2,006,474 2,352,122
Difference 0 -101,526 18,123 156,039 321,893 412,474 547,915 706,130
Residential (sq.ft.)
Residential (units)
Office (sq.ft.)
Retail + Service Commercial (sq.ft.)
Even under ‘catalyst’ growth conditions, there will be insufficient demand for office, residential and retail/ service commercial space in Downtown Edmonton to warrant the FSR allowances under the current zoning bylaw.
[30]
DOWNTOWN EDMONTON COMMERCIAL, OFFICE AND RESIDENTIAL FORECASTS, 2009 TO 2044 G.P Rollo & Associates, Land Economists Ltd.
Only a small portion of available zoned space could be filled by residential, office and retail development over the next 35 years.
With supply far outpacing demand, the City of Edmonton must give careful consideration to the placement and massing of future growth in order to create a vibrant, liveable and sustainable Downtown core.
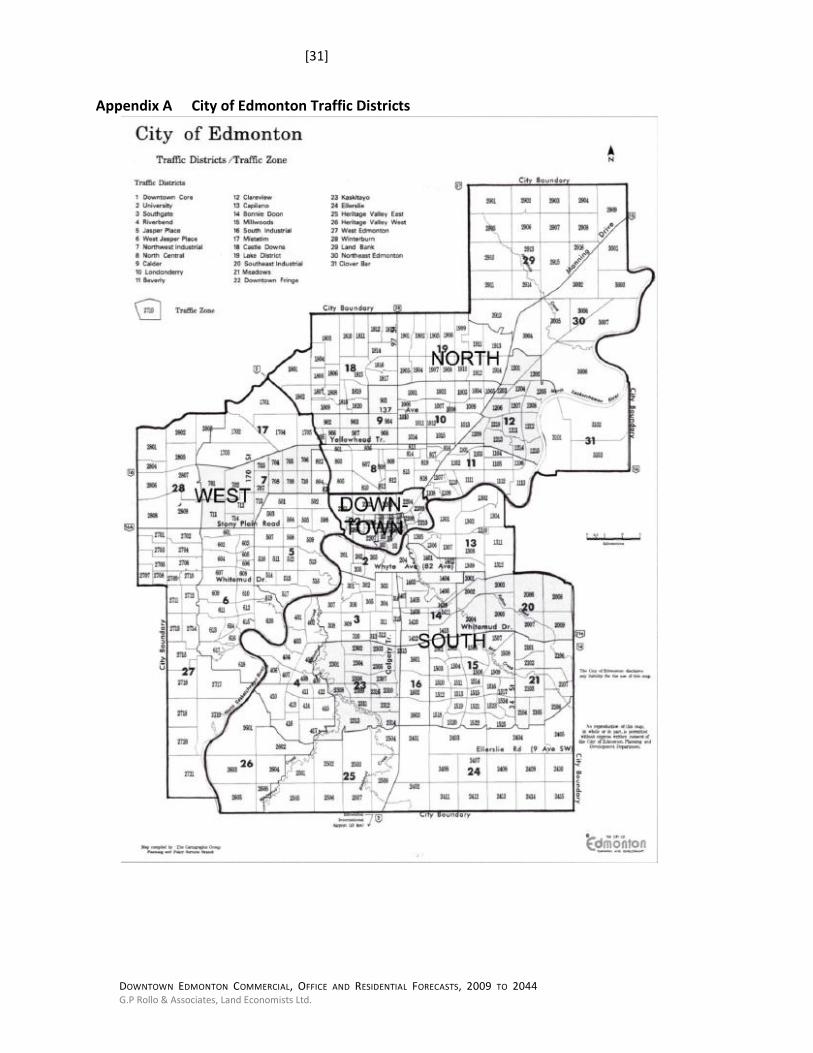
[31]
DOWNTOWN EDMONTON COMMERCIAL, OFFICE AND RESIDENTIAL FORECASTS, 2009 TO 2044 G.P Rollo & Associates, Land Economists Ltd.
Appendix A City of Edmonton Traffic Districts