memorandum - sv.uio.no
TRANSCRIPT
MEMORANDUM
No 17/2016
Øystein Kravdal
ISSN: 0809-8786
Department of Economics University of Oslo
New evidence about effects of reproductive variables on
child mortality in sub-Saharan Africa

This series is published by the University of Oslo Department of Economics
In co-operation with The Frisch Centre for Economic Research
P. O.Box 1095 Blindern N-0317 OSLO Norway Telephone: + 47 22855127 Fax: + 47 22855035 Internet: http://www.sv.uio.no/econ e-mail: [email protected]
Gaustadalleén 21 N-0371 OSLO Norway Telephone: +47 22 95 88 20 Fax: +47 22 95 88 25 Internet: http://www.frisch.uio.no e-mail: [email protected]
Last 10 Memoranda
No 16/16 Moti Michaeli and Daniel Spiro The dynamics of revolutions
No 15/16 Geir B. Asheim, Mark Voorneveld and Jörgen W. Weibull Epistemically robust strategy subsets
No 14/16 Torbjørn Hanson Estimating output mix effectiveness: A scenario approach
No 13/16 Halvor Mehlum and Kalle Moene Unequal power and the dynamics of rivalry
No 12/16 Halvor Mehlum Another model of sales. Price discrimination in a horizontally differentiated duopoly market
No 11/16 Vladimir W. Krivonozhko, Finn R. Førsund and Andrey V. Lychev Smoothing the frontier in the DEA models
No 10/16 Finn R. Førsund Pollution Modelling and Multiple-Output Production Theory*
No 09/16 Frikk Nesje and Geir B. Asheim Intergenerational altruism: A solution to the climate problem?*
No 08/16 Michael Hoel Optimal control theory with applications to resource and environmental economics
No 07/16 Geir B. Asheim Sustainable growth
Previous issues of the memo-series are available in a PDF® format at:
http://www.sv.uio.no/econ/english/research/unpublished-works/working-papers/

New evidence about effects of reproductive variables on child
mortality in sub-Saharan Africa
Øystein Kravdal
Department of Economics
ABSTRACT
There is considerable uncertainty about how reproductive factors affect child mortality. Joint
determinants are difficult to control adequately for, and the studies that have dealt with
selection in the most advanced ways have given diverging results. According to very simple
models estimated from DHS data from 28 countries in sub-Saharan Africa, mortality is
highest for first-born children with a very young mother. Also some other groups of children
with a young mother, or of high birth order, have high mortality. Net of such age and birth
order differences, a short preceding birth interval is associated with high mortality. The
pattern does not change much if a number of other observed characteristics are controlled for,
but a different picture appears if time-invariant unobserved mother-level characteristics are
taken into account in a multilevel-multiprocess model. According to the latter models, the
mortality of a first child goes up as the mother’s age increases above 24, and younger siblings
are adversely affected by the later start of childbearing as this means that their mother will be
older when they are born. Avoiding a short birth interval reduces the chance that the next
child dies, but this effect is weaker than suggested by the simpler models, and younger
siblings have a disadvantage because their mothers are older than they otherwise would be.
The conclusion is different if it is taken into account that a higher maternal age goes hand in
hand with a later calendar period, which may reduce mortality. Assuming that the recent
general mortality decline continues, the advice to a woman would be to avoid a very early
first birth and short birth intervals. In addition to being an advantage in the short term, there
are no disadvantages for the children she may have later. It is also discussed whether a
woman’s next child will have lower mortality than her most recently born child. The
statistical analysis is backed up by a simulation experiment.
Key Words: birth interval, birth order, child, DHS, infant, maternal age, mortality,
multilevel-multiprocess models, sub-Saharan Africa, reproductive variables, simulation
JEL codes: C30, I10, J13

SHORT ABSTRACT
There is considerable uncertainty about how reproductive factors affect child mortality. Joint
determinants are difficult to control adequately for, and earlier studies have given diverging
results. In this study, multilevel-multiprocess models that control for time-invariant
unobserved mother-level characteristics are estimated, using DHS data from 28 countries in
sub-Saharan Africa. There are less adverse effects of early first birth and short birth interval
according to these models than according to simpler models. The implications of the results
are discussed, taking into account that a higher age at the next birth, possibly as a result of a
longer birth interval, will make the mother older also at subsequent births, and that a higher
age for the mother necessarily means that that the child will be born in a later calendar year. It
is also discussed whether a woman’s next child will have lower mortality than her most
recently born child.
Background
A number of studies from developing countries have shown that children born soon after an
older brother or sister have poorer health and higher chance of dying in infancy or childhood
than children born after a longer birth interval (Hobcraft 1983; Rutstein 2005; Saha and van
Soest 2013; Kozuki and Walker 2013). Also a short subsequent birth interval has been
associated with poor child health (DaVanzo et al., 2008; Fotso et al., 2012). The evidence is
more mixed when it comes to birth order and maternal ages. Special disadvantages for first-
born children and, to lesser extent, children of high birth order have been reported in several
studies (Davanzo et al. 2008; Ezeh et al., 2014; Kozuki et al., 2013a), but some authors using
more advanced methods to deal with selection have concluded that there is no effect of birth
order (Kozuki et al., 2013c; Bhalotra and van Soest, 2008) or even a favourable influence of
higher birth order (reported, but not shown, by Kudamatsu, 2012). Furthermore, a very low
age at birth has been associated with high mortality (Ezeh et. al, 2014; Finlay et al. 2011;
Gibbs et al., 2012; Kozuki et al., 2013a), and some studies have shown a moderate increase in
child mortality from age 35 or 40 (Ezeh et al. 2014; Kozuki et al 2013a), whereas other
authors have observed an increase already from around age 25 or 30 (Finlay et al. 2011;
Bhalotra and van Soest 2008) or a generally adverse effect of higher age (uncommented
estimates in Saha and van Soest 2013). None of these reported patterns is theoretically
implausible. As explained below, several counteracting mechanisms are probably involved
and the balance could tip in either direction.
Family planning programmes have to a large extent been motivated by the idea that
such relationships between reproductive factors and child health are causal. In particular,
attempts to help people avoid short birth intervals have been an important ingredient of these
programmes. Furthermore, knowledge about causal effects (rather than statistical associations)
not only constitutes the ideal underpinning of family planning programmes and population
policies; it is also what individuals need in their fertility decisions making, and it adds to our
general insight into human physiology. For other purposes, identification of causal effects
may not even be a goal. In particular, health personnel and health care planners may
sometimes just be interested in knowing which groups of children that are most vulnerable, in
order to steer resources in that direction. This calls for a simple description of differences, for
a relevant period and the country (or within-country setting) in which these persons operate.
In many earlier investigations that have aimed (perhaps implicitly) to identify a causal
effect, many good attempts have been made to control for individual and societal
characteristics that affect both women’s reproduction and her children’s health and mortality.
However, there will always be doubt about whether this has been done adequately. Besides,
when assessing the importance of a reproductive variable, other reproductive variables must
be controlled for, as they are closely linked to each other, and these controls have often been
rather crude. The fact that the results have also been rather mixed – even those coming from
the statistically most advanced investigations - adds to the motivation for further analysis
based on good data and methods.
The aim of the present study is to shed new light on the relationship between three
main reproductive factors (birth order, maternal age, length of preceding birth interval) and
child mortality, using state-of-the-art methods and data from all (readily) available
Demographic and Health Surveys (DHS) conducted in sub-Saharan Africa after 2010 – with a
focus on the last 10 years before the surveys. The issue is particularly pressing in this region,
where infant mortality was as high as 64 per 1000 on average in 2015, under-5-mortality was
83 per 1000, and the total fertility rate was 5.0 (PRB 2015). Earlier studies have shown that
associations with reproductive factors differ between infant and child mortality, and that there

may also be differences within the infant period (e.g. Davanzo et al., 2008), but for simplicity
this is largely ignored.
The first step of the study is to describe the relationships between the reproductive
variables and child mortality by means of a simple regression model with only a few control
variables included. As mentioned, this could be helpful for some purposes. In the next step, a
number of variables are added to this model, and finally multilevel-multiprocess models are
estimated to control also for constant unobserved characteristic of the mother (and the
household and the community in which she lives) that affect both fertility and child mortality.
Based on these model estimates, it is discussed how alternative reproductive
“strategies” affect a mother’s chance of losing her next child and later children, assuming
persistent effects of the reproductive variables. It is then taken into account that a short birth
interval not only itself may increase the chance that the next child dies. A short interval also
means that the mother will be slightly younger when she gives birth to that child, which may
have an additional impact; besides, she will be younger at subsequent births. Furthermore, it is
taken into account that, if a woman has a child at a younger age, the birth will necessarily take
place in an earlier calendar period (Barclay and Myrskylä, 2016). The latter is likely to have
an effect as well, for example because of continued general improvements in nutrition,
sanitation and health care.
Some of the models include the reproductive factors as separate variables, while
others include a variable that combines maternal age and birth order. The latter is a
convenient approach (although good alternatives exist) because some combinations of these
two factors are impossible or highly unlikely, and because it is possible that effects of
maternal age vary with birth order.
Data from the various African countries are pooled because introductory analysis
showed that estimates from country-specific models have large standard errors and fluctuate
wildly and without displaying any meaningful pattern. For many countries, the estimation
procedure did not even converge. The downside of such an analysis is that it does not reflect
the likely variation in effects between (and within) all these countries because of
heterogeneity in policies and the social and physical environment to which families are
exposed. Only one simple step will be taken to shed some light on this variation: some models
will be estimated separately for the least and the most developed among the 28 countries.
Theoretical Issues
A brief review of social and physiological mechanisms
The mentioned reproductive factors have been thought to affect the child’s health and survival
through many different, and partly counteracting, mechanisms. For example, low maternal
age may increase child mortality because of a particularly heavy nutritional burden during
pregnancy (from feto-maternal competition), physiological immaturity (leading to preterm
births or obstetric complications), and less health knowledge and fewer material resources
among the parents (Chen 2007; Gibbs et al. 2012; Finlay et al. 2011). On the other hand, the
chance of chromosomal or congenital abnormalities increases as a woman approaches the end
of her reproductive period, and the chance that the she suffers from hypertension, diabetes or
other chronic diseases – with likely implications for the child’s health - increases with age
throughout her reproductive period. The possibility of an adverse effect of higher maternal
age because of deteriorating health has been referred to as the “weathering hypothesis”
(Geronimus 1992). In support of that idea, Powers (2013) found that the mortality of black
infants in the US went up with increasing maternal age, and that there was an upturn from the
mid-20s among Mexican-origin children. Furthermore, Love (2010) reported that, among
socially disadvantaged African-Americans (but not others in the US), the chance of having a
child of low birth weight was 50% higher if the mother was older than 30 than if she was
younger than 20. Similarly, Goisis and Sigle-Rushton (2014) observed that, among black first-
born children in the UK, the chance of low birth weight doubled when the mother’s age
increased from around 25 to 40 (while the same pattern did not appear among disadvantaged
white children).
It has been suggested that first-born children have particularly high mortality
compared to the later-born because the mother’s body is not adapted to pregnancy and
childbirth, which increases the chance of complications during childbirth (Lee et al. 2011).
Besides, it is thought that children of high birth order are disadvantaged because of nutritional
stress experienced by mothers during previous pregnancies and lactation periods and
reproductive injuries (Montgomery and Lloyd 1996). Also, there may be fewer parental
resources available when there are several older siblings (especially if these siblings are not
old enough to help the younger or contribute to the family income; Kravdal et al. 2013).
Finally, having many siblings may increase the chance of disease transmission (although
effects are not necessarily adverse as relatively weak infections at low age could confer
immunity; Cardoso, 2004).
On the other hand, it is also possible that child mortality goes down with increasing
birth order because mothers and fathers have accumulated more experience with childrearing.
Such an effect of birth order could also arise if having many children on the whole, and in
spite of the disadvantages just mentioned, affects the parents’ health positively, so that they
can care better for their children. However, while studies from rich countries suggest that
having relatively many children may lead to a healthier life style and better health (Kravdal et
al., 2012), there is no such evidence from poor settings. As mentioned, the idea of a protective
effect of higher birth order was supported by Kudamatsu (2012), who carried out a within-
mother analysis with control for maternal age and period dummies.
When it comes to the firmly documented excess mortality after short birth intervals,
several explanations have been suggested: i) inadequate time to recover from the nutritional
depletion caused by the previous pregnancy, ii) cervical insufficiency/incontinence due to
inadequate time to regain the strength of the muscles in the reproductive tissue, iii)
breastfeeding of the preceding child during a substantial part of the pregnancy, with
consequences for the intra-uterine environment and later breastfeeding, iv) higher chance of
disease transmission from the mother, who may have been weakened in connection with the
preceding birth, or because there is at least one very young sibling, and v) less resources
available from the parents because the previous as well as older siblings will tend to be
younger than if the interval is longer (see elaboration in Conde-Agudelo et al., 2012).
Most of these arguments would suggest that mortality continues to fall as the birth
interval increases, at least up to a certain length. However, it has also been suggested that
mortality may go up again if the interval becomes very long. The idea is that the woman
becomes primed for fetal growth during a pregnancy, which gives her advantages in later
pregnancies, but that this benefit disappears if she waits long, so that her capacity in that
respect is like that of a childless woman (Zhu 1999).
Effect modifiers
The impact of the reproductive factors probably depends on a number of individual,
household and societal characteristics, including the socioeconomic resources of the family or
in the country. However, there is much complexity involved and therefore hard to make
predictions. To give just a few examples of possible interactions, it is a key aspect of the
“weathering hypothesis” that relatively rich women do not experience as strong general health
deterioration with increasing age as the less resourceful. Furthermore, the nutritional-
depletion argument may be less relevant among those with a generally adequate food intake,
and there could also be other reasons for sharper effects of short birth intervals among the
least resourceful (Whitworth and Stephenson 2002). Yet, Conde-Agudelo et al. (2006)
concluded in a review that we do not actually know much about whether effects of spacing
differ between developed and developing countries. When it comes to birth order, one could
argue that the dilution-of-resources argument should carry less weight among the richest, but
it has also been pointed out that better access to various health promoting amenities may
intensify the competition among siblings (Desai 1995; Gibson and Lawson 2011).
In societies with strong son preferences, also the child’s sex - and even the sex
composition of the siblings - may condition the effects of the reproductive variables (e.g.
Makepeace and Pal 2008). For simplicity, and because son preferences in large parts of Africa
are weaker than in South and East Asia, this issue is not addressed in this study.
Selection
Child mortality is influenced by a number of individual or household characteristics, such as
the economic resources of the parents, their knowledge, their trust in modern health care, their
general health, and the mother’s autonomy. Similar socioeconomic characteristics at the
aggregate level are also important, for example through the availability of health care and the
quality of the sanitation systems, and the natural environment has an effect above and beyond
that (e.g. by affecting possibilities for microbial growth and survival of disease vectors). All
these factors also influence the need for children as labour and old-age security, the access to
contraception, and other important determinants of fertility. Some of them are often measured
in surveys, and some may at least be reasonably constant over time for a given individual or
family, so that they are taken into account by the approach used in this study. Others are more
problematic to control for (see further discussion below).
Data and Methods
DHS surveys
The analysis was based on all 28 Demographic and Health Surveys (DHS) conducted in sub-
Saharan Africa after 2010 and available at the end of 2015: Benin 2011, Burkina Faso 2010,
Burundi 2010, Cameroon 2011, Congo (Brazzaville) 2011, Cote d’Ivoire 2011, Democratic
Republic of Congo 2013, Ethiopia 2011, Gabon 2012, Gambia 2013, Ghana 2014, Guinea
2012, Lesotho 2009/10, Liberia 2013, Malawi 2010, Mali 2012, Mozambique 2011, Namibia
2013, Niger 2012, Nigeria 2013, Rwanda 2010, Senegal 2010, Sierra Leone 2013,Tanzania
2010, Togo 2010, Uganda 2011, Zambia 2013, and Zimbabwe 2010.1 For simplicity, women
with at least one twin were left out, as in many earlier studies (Davanzo et al., 2008; Saha and
van Soest, 2013).2 The focus was on the mortality of children born less than 10 years before
interview, as a compromise between analyzing a recent period and including many children.3
As described below, broadening the study period gave similar results.
The DHS surveys include region-specific weights that should be used when
calculating country-level descriptive statistics, while it is less obvious that they should be
used in estimation of statistical models. In this analysis, weights were not included.
Introductory estimation showed that inclusion of region-specific weighs, or weights that also
took the country size into account (thus placing more emphasis on DHS observations from,
for example, Nigeria), had very little impact on the estimates.
Multilevel-multiprocess models
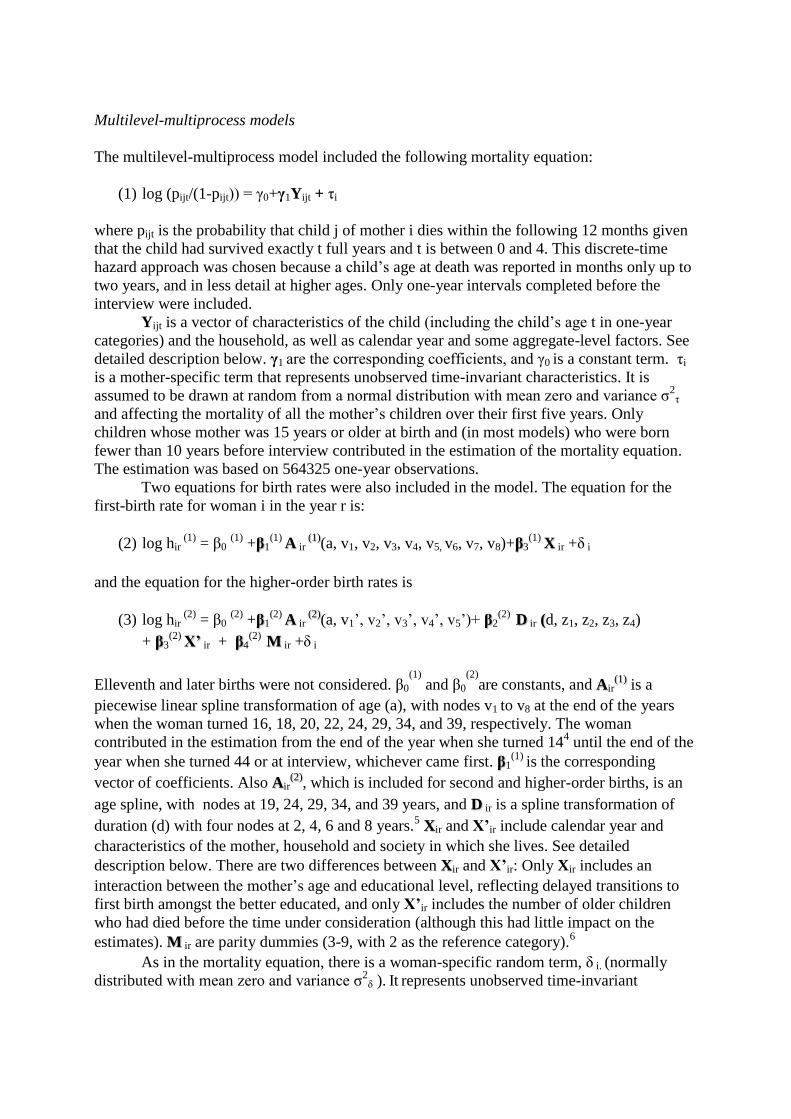
The multilevel-multiprocess model included the following mortality equation:
(1) log (pijt/(1-pijt)) = γ0+γ1Yijt + τi
where pijt is the probability that child j of mother i dies within the following 12 months given
that the child had survived exactly t full years and t is between 0 and 4. This discrete-time
hazard approach was chosen because a child’s age at death was reported in months only up to
two years, and in less detail at higher ages. Only one-year intervals completed before the
interview were included.
Yijt is a vector of characteristics of the child (including the child’s age t in one-year
categories) and the household, as well as calendar year and some aggregate-level factors. See
detailed description below. γ1 are the corresponding coefficients, and γ0
is a constant term. τi
is a mother-specific term that represents unobserved time-invariant characteristics. It is
assumed to be drawn at random from a normal distribution with mean zero and variance σ2
τ
and affecting the mortality of all the mother’s children over their first five years. Only
children whose mother was 15 years or older at birth and (in most models) who were born
fewer than 10 years before interview contributed in the estimation of the mortality equation.
The estimation was based on 564325 one-year observations.
Two equations for birth rates were also included in the model. The equation for the
first-birth rate for woman i in the year r is:
(2) log hir (1)
= β0 (1)
+ 1(1)
irβ A (a, v1, v2, v3, v4, v5, v6, v7, v8)+ (1)
3(1)
ir +δ i β X
and the equation for the higher-order birth rates is
(3) log hir (2)
= β0 (2)
+ 1(2)
irβ A (a, v1’, v2’, v3’, v4’, v5’)+ (2)
2(2)
ir d, z1, z2, z3, z4) β D (
+ 3(2)
ir + 4(2)
ir +δ i β X’ β M
Elleventh and later births were not considered. β0
(1) and β0
(2)are constants, and irA is a
(1)
piecewise linear spline transformation of age (a), with nodes v1 to v8 at the end of the years
when the woman turned 16, 18, 20, 22, 24, 29, 34, and 39, respectively. The woman
contributed in the estimation from the end of the year when she turned 144 until the end of the
year when she turned 44 or at interview, whichever came first. 1(1)
is the corresponding β
vector of coefficients. Also irA , which is included for second and higher-order births, is an (2)
age spline, with nodes at 19, 24, 29, 34, and 39 years, and ir is a spline transformation of D
duration (d) with four nodes at 2, 4, 6 and 8 years.5 ir and X’ir include calendar year and X
characteristics of the mother, household and society in which she lives. See detailed
description below. There are two differences between ir and X’ir: Only Xir includes an X
interaction between the mother’s age and educational level, reflecting delayed transitions to
first birth amongst the better educated, and only X’ir includes the number of older children
who had died before the time under consideration (although this had little impact on the
estimates). ir are parity dummies (3-9, with 2 as the reference category).6 M
As in the mortality equation, there is a woman-specific random term, δ i. (normally
distributed with mean zero and variance σ2
δ ). It represents unobserved time-invariant

characteristics and is assumed to be drawn at an early age and stay with the woman
throughout her reproductive period, thus affecting all her birth rates.
A nonzero correlation (ρδτ) between δi and τi was allowed, reflecting that there are
joint constant mother-level determinants of fertility and child mortality. The model was
estimated via maximum likelihood, using the software package aML (Lillard and Panis 2003).
The distributions of the random terms were approximated by 5 support points. Increasing the
number to 10 did not change the results.
Multilevel-multiprocess models of this type have been estimated in earlier
investigations of strongly interlinked socio-demographic processes (Upchurch et al. 2002;
Steele et al. 2009; Kravdal et al. 2013). Besides, other models with correlated fertility and
mortality random terms have been used in studies of the importance of reproductive factors
for child mortality in South Asia (Makepeace and Pal 2008; Saha and van Soest 2013;
Bhalotra and van Soest 2008). However, fertility was modelled very differently in the latter
studies, with equations for birth intervals after the first birth. Makepeace and Pal (2008), who
focused on middle-order births, did not consider the importance of maternal age or birth order,
and in the other studies these effects were captured by second-degree polynomials.
A simulation experiment is reported in Appendix 2. It shows that the estimation has
been carried out correctly and that the results are reasonable. Additionally, it illustrates that
the approach that is taken is superior to a sibling fixed-effects analysis, which also controls
for constant mother-level unobserved factor, and probably would be considered by many
researchers as a good alternative (and was used, for example, by Kozuki and Walker (2013) to
analyse effects of the birth interval length).
Variables
The mortality equations included either separate variables for maternal age and birth order or
a variable combining these two factors. In both cases, the previous birth interval was also
included. It was set to the reference category, 30-41 months, for the first-born. The reference
category was chosen to match the maternal age categorization and thus facilitate the
discussion. The number of deaths in the different categories of these reproductive variables is
shown in Table 1. A parenthesis around the number means that the group is so small that it
was left out when models including the combined age-order variable were estimated. This
limit was set quite arbitrarily at 0.5% of the total number of deaths.7
(Table 1 about here)
In addition to these three reproductive variables, calendar year and the other variables
specifically mentioned earlier (child’s age in the mortality equation and woman’s age,
duration since previous birth, parity, and mortality of older children in one or both of the
fertility equations), the following variables were included in both the fertility and mortality
equations: the woman’s education (grouped into 0-2, 3-6, 7-8, 9-10 and 11+ years and
interacted with a grouped age variable in the equation for first birth), the woman’s religion
(Christian, Muslim, other/no religion), the standard DHS indicator of household wealth (based
on household amenities), averages of women’s education (in years completed) and household
wealth calculated for the community (PSU) in which the woman lived, whether that
community was urban or rural, and country dummies to capture unobserved country-specific
characteristics. The mortality equation also included the child’s sex.
Some of these variables may not adequately reflect the earlier situation that has
influenced fertility and child mortality, as changes may have taken place between that time
and the interview. In principle, variables measured at interview may even capture factors that

are consequences of fertility or child mortality (Cohen et al., 2011). However, many of the
variables are likely rather stable over the relevant period, and to the extent that there is a
reverse-causality problem, it should be reassuring that all the variables are actually quite
unimportant as controls (see comparison referred to in Appendix 2).
Calendar year was entered as a continuous variable with a linear effect in all models.
Very similar results appeared when it instead was included as a categorical variable. Allowing
the year effects to differ across countries did not change the results either.
Variations in the effects of reproductive variables
Stratified analyses were undertaken to examine some of the variation in the effects of the
reproductive variables. Models were estimated separately for the 14 countries with lowest
HDI (Human Development Index) and for the 14 countries with highest HDI.
“Standard” mortality models”
For reasons explained earlier, also “standard” discrete-time mortality models (referred to
below as “standard mortality models”) were estimated in the first steps of the analysis.
Technically, this was done by leaving out the mortality random term and the (then redundant)
fertility equations from the model.8 In some of these models, only calendar year and country
were included in addition to the reproductive variables and child’s age; others included all the
mentioned control variables.
Results
Estimates of the γ1 coefficients in equation (1) are presented below. These estimates reflect
the log-odds of dying within a year in the category in focus minus the corresponding log-odds
in the reference category, or – if the variable is continuous - how the log-odds changes with a
one-unit change of that variable.
Standard mortality models with few control variables
Estimates from a standard mortality model that only included year and country as control
variables are shown in Table 2 (first column). Mortality goes down with increasing maternal
age until the mid-30s, after which there is an upturn. It also increases with birth order, except
that mortality is higher for first-born than second-born children. Note that the coefficient for
first-born reflects the difference between being a first child and being a second child born 30-
41 months after the first child (the reference category for birth interval length). Furthermore,
mortality falls with increasing interval length until 42-53 months; there is no further decline
after that. These estimates accord with the patterns reported in several earlier analyses based
on relatively simple statistical models (see above).
The general decline in mortality that is estimated from this multi-country sample
without weighting is quite sharp: 0.053 per year. This figure is reasonable compared to
published numbers. For example, Demombynes and Trommlerová (2012) reported that more
than half of the countries in the region that had a DHS survey between 2005 and 2012
experienced an annual decline of under-5-mortality that was larger than the Millenium
Development Goal of 4.4%. Similarly, a graph produced by You et al. (2015) showed an
annual decline of more than 4% from 2000 to 2015, after slower improvement in the previous
decade.

(Table 2 about here)
The combined “effects” (a word used here and below for simplicity and without claim
of causality) of maternal age and birth order are shown in Table 3, in the form of log-odds of
dying for children with various combinations of maternal age and birth order minus the
corresponding log-odds for second-born children with a mother aged 21-23.9
(Table 3 about here)
First-born children with mothers younger than 18 have the highest mortality, but also
second-born children with a mother in that age group, first-born children with a mother who is
18-20, children of birth order 7 who have a very young mother, and most of the children of
birth order 8 or higher have relatively high mortality (log odds > 0.30 above the reference
category). Furthermore, mortality is significantly elevated among most other children who are
first-born, are of high birth order, or have a relatively young mother (i.e. who typically started
childbearing early), while it is lowest among children of birth order 2 or 3 who have a
relatively old mother.
First-born children do not have the same disadvantage after their first year as when
they are infants. This is seen by estimating a logistic model for infant mortality and a discrete-
time hazard model for mortality at age 1-4 instead of a hazard model for age 0-4 (see Panel A
of Appendix table A1). In fact, child mortality at age 1-4 is rather low for first-born children
with a mother in her 20s, and it is only moderately elevated if the mother is very young.
Furthermore, children of birth order 2-5 who do not have a particularly young mother have a
clearer advantage after their first year than earlier. Finally, short intervals have less adverse
impact after the first year, while there is a more clearly protective effect of longer intervals.
This accords with earlier studies of birth intervals, and may partly reflect the stronger relative
importance of biological compared to social pathways among the youngest children (Manda
1999; DaVanzo et al. 2008; Fotso et al. 2012; Rutstein 2005).
The message to individual women according to standard mortality models with more control
variables
As explained earlier, estimates from models that control better for joint determinants of
fertility and child mortality are more useful for individual women who make fertility
decisions, and for those guiding them in these matters. When many social variables are added,
a less negative effect of maternal age and a less positive effect of birth order appear, while the
effect of birth interval is essentially unchanged (column 2 of Table 2). The combined effects
of maternal age and birth order are shown in Panel A of Table 4.
(Table 4 about here)
Below, it is explained in detail how various reproductive strategies affect child
mortality and how these conclusions can be reached through a careful examination of the
tables. This should pave the way for a more condense presentation of the results from the
multilevel-multiprocess models later.
The chance of losing the first child. A woman who wants to minimize the chance of losing her
first child should avoid early childbearing, assuming that future effects will be just as those

estimated. However, postponement beyond age 21 will not reduce mortality further. This and
other conclusions are summarized in Table 7.
Obviously, if the general decline in mortality continues with the same force, there will
be an even stronger reason to delay entry into motherhood. In that case, mortality would be
lower the older the mother is, although there is a diminishing benefit of increasing age. This
conclusion comes from adding the period effect to the combined effect of maternal age and
birth order (see Panel B of Table 4). The period contribution is set to 0 for age group 21-24,
and as a woman “moves into” a higher three-year age group, the child mortality is reduced by
0.16, which is three times the estimated per-year period effect of -0.054.10
Long-term implications of first-birth timing. There are also long-term implications of first-
birth timing, because if the woman is relatively old when she has her first child, she will also
be relatively old when she has her next children, unless she “compensates” by particularly
short subsequent birth intervals. For example, if a woman has her first child when she is 18-20
and another child after a three-year interval, she will then be 21-23; if also the next interval is
three years, she will be 24-26 when that child is born, and so on. Thus, she will, so to speak,
move along the diagonal marked in grey. If she instead starts three years later and proceeds
with three-year intervals, she will move along another diagonal one step up and to the right.
One can shed light on the long-term implications of the age at first birth by, for each birth
order, comparing mortality for each maternal age group with that in the higher maternal age
group (i.e. check the birth-order specific effects of maternal age, which are not always
monotonic). Small differences should not be counted. Below, the limit is set at 0.10, which is
two times the typical standard error. (Formal significance testing would require numerous
changes of the reference category and be cumbersome.)
Let us start by ignoring the possibility of a continued general mortality decline (Panel
A). In that case, 5 pairwise differences are -0.10 or larger, i.e. the log-odds go down by at
least 0.10 if the maternal age is in the next category. These are indicated with full underlining
and appear – as do many of the smaller ones that go in the same direction – at relatively low
maternal ages. There are also 3 opposite pairwise differences, i.e. differences that are 0.10 or
larger. These are in the lower right part of the table (high age and birth order) and are
indicated with stapled underlining. In other words, there is a U-shaped relationship between
maternal age and child mortality at the highest birth order. To conclude, there is on the whole
no long-term advantage to be drawn from delaying the start of childbearing into the last half
of the 20s. The mortality of the first child would not be lower and the mortality of later
children could be higher. If it instead is assumed that the general decline in mortality
continues, the message is simpler (see panel B, with no underlining): Not only does the first
child have a lower mortality the older the mother is; also the children she gives birth to later
benefit from that.11
Net, total and long-term effects of birth intervals. When discussing which birth intervals that
would be ideal, two types of effects are relevant in the short run. First, a short birth interval
will itself increase the mortality of the next child. Second, if the interval is short, the mother
will be slightly younger at next birth than she would otherwise be, which may have an
additional impact. Let us, for example, consider a woman who has her first child when she is
18-20 and ignore the effect of the general decline in mortality. The mortality of that child,
when measured as the log-odds difference from the reference category, is 0.40 (Panel A of
Table 4). If the woman has another child after a three-year interval, the infant mortality of that
child will be 0 (recall that 30-41 months is the reference category for birth intervals), and if
she proceeds with this spacing (i.e. moves along the marked diagonal), the infant mortality of
her third child will be -0.05. If she instead had her second child after an interval of less than

18 months, she would be younger at that time, which would increase infant mortality to
something between 0 and 0.07 (the number to the left of the diagonal) in addition to the net
adverse effect of the short birth interval (1.21). If she had yet another child after an interval
of less than 18 months12
, she would be about 21-23 at third birth rather than 24-26 if she had
two three-year intervals. That would give her a small disadvantage because of the lower age
(0.01 as opposed to -0.05), which adds to the adverse interval effect. If she then continues
with three-year intervals, each of her next children will experience a mortality quite similar to
what it would be if she had started with two three-year intervals, the figures along this
diagonal being -0.03, 0.00, 0.07, 0.06, and 0.26, as opposed to -0.06, -0.04, -0.05, 0.14, 0.36.
To form a more general conclusion about the “secondary” interval effect involving
maternal age, we can again consider the birth-order specific effect of maternal age and
conclude as above: In the absence of a general mortality decline (Panel A), being slightly
older at the next birth because the birth interval is not very short is an advantage at the low
ages and a disadvantage at the higher ages and birth orders. However, it is a clear advantage if
there is a general mortality decline (Panel B). Taking also the longer-term implications into
account, one can say that, in the presence of a general mortality decline, avoidance of a short
interval gives a triple advantage: i) a beneficial net effect for the next child, ii) the mother
being a bit older when that child is born, and iii) younger siblings (if any) having an older
mother.13
Mortality of next versus previously born child. While concerns about children of high birth
orders have been voiced, and the earlier description showed that these children indeed have
relatively high mortality, it is not obvious how individual families and those guiding them
should think about this issue. It may be relevant for them to ask whether the mortality of the
next child would be higher than that of the most recently born child. Obviously, that would
depend much on the birth intervals. Assuming first that birth intervals are always three years,
the answer can be found by comparing, for each birth order and maternal age group, with
mortality in the cell one step below and to the right (i.e. down along a diagonal). The
conclusion is that the mortality of the next child is at least 0.10 lower for many groups of
women who have less than three children. One example is shown in a box and with bold font
in Panel A of Table 4). At higher birth orders, 7 opposite cases can be found. One of them is
shown in a box and with standard fonts. Taking the general mortality decline into account,
however, the next child will generally have a lower mortality (except that there are some
differences below the 0.10 limit and even of the opposite sign at high age/order).
If both the interval before the child most recently born and that before the next child is
very short, it is more relevant to compare with a number between the one that is lower along
the diagonal and the one that is one step to the left of that. In that case, it is less clear – even if
the general mortality reduction continues – that the next child will have lower mortality.
Conversely, if intervals are generally long, the next child will more definitely experience a
lower mortality.
The message to individual women according to the multilevel-multiprocess models
When also joint unobserved constant determinants of fertility and mortality are taken into
account, the effect of calendar year is the same as estimated from the simpler models, while
the effect of birth interval is somewhat weaker (column 3 of Table 2). However, effects of
maternal age and birth order are markedly different. When these are included as separate
variables, a sharply positive effect of maternal age appears, at least from the late teens, and
mortality declines strongly with birth order.14

Suspicions may arise when effects are so strong, but it is important to keep in mind
that high birth order goes hand in hand with high maternal age. For example, if birth intervals
are 30-41 months, a prediction from these separate effects of maternal age and birth order is
that, if a woman starts childbearing at age 18-20 and proceeds with three-year intervals, the
log-odds of dying within a year will be 0.08 lower (-0.25+0.17) for a third child than for a
second child, 0.08 lower for a fifth child, and 0.06 lower (-1.09+1.13) for children of birth
order 8 or higher.
Numbers of almost the same size can be found with grey background in Panel A of
Table 5, which shows effects of the variable combining maternal age and birth order. (The
differences between these estimates and predictions from the main effects in column 3 of
Table 2 reflect variations in the importance of maternal age across birth order. These
interactions are rather weak and do not display a clear pattern.) In reality, intervals tend to be
shorter than 3 years, and especially among women ending up with many children, so for a
woman who started childbearing at age 18-20, an average child of birth order 8 has log-odds
of dying that is closer to the number to the left of the grey diagonal (-0.24 compared to the
reference category.) If a woman has a child at a considerably lower age than the one shown on
the diagonal, however, the mortality of that child will be very low. Conversely, it will be high
at higher ages. In fact, numbers as high as 0.4-0.6 in absolute value appear at some of the
highest and lowest ages for birth orders above 1, but there are few children in these categories.
The importance of maternal age is discussed in more detail below, using the same type of
arguments as when presenting the result from the standard mortality model.
(Table 5 about here)
Possible “strategies” when the general mortality decline is disregarded. If the possibility of a
general mortality decline is disregarded (Panel A), the advice to a woman who wants to
minimize the chance of losing her first child would be to become a mother before age 24.
There are also adverse implications of a higher age at first birth in the longer term, through
higher maternal age at subsequent births: In fact, from this perspective, the message would be
that the earlier the first birth takes place the better. All this is markedly different from the
conclusions from the standard mortality model.
As mentioned, the adverse net effect of a short birth interval is weaker according to the
multilevel-multiprocess model than according to the standard mortality model (0.88 as
opposed to 1.10). In addition, avoidance of a short birth interval has less beneficial
“secondary” effects – on the next and subsequent births - because of the mentioned increase in
child mortality with increasing maternal age. Having, for example, two short intervals rather
than 3-year intervals will give those two children a rather high mortality (elevated by 0.88
minus the age advantage), but if childbearing then continues with 3-year intervals, the child
mortality will be as indicated by the diagonal to the left of the one on which the woman
started. This advantage can be as large 0.32, but is on average round 0.15. Stated differently,
the low mortality to the left of the grey diagonal (and the very low mortality one or two steps
further in that direction) may come at a cost in the form of high mortality of earlier children
because of short intervals. Conversely, having very long birth intervals confers only an
immediate advantage, while there is a clearer long-term penalty.
One might believe that the low mortality at low ages is partly a consequence of having
lost older children because of short intervals and therefore having fewer children to feed, but
that appears not to be the case. Addition of an indicator of earlier child death gave more
strongly protective effect of low maternal age, as the experience of earlier child death actually
increased the child mortality by about 10% (perhaps partly as a result of grief reactions).

Furthermore, if all birth intervals are three years, the multiprocess-multilevel model
suggests that the next child will have lower mortality than the child most recently born only
among women with one or two children. The picture is mixed at higher birth orders.
The pattern changes only moderately across the first five years of a child’s life.
However, being a first-born child and being born after a short birth interval has a less adverse
effect for children of age 1-4 than for infants (see Panel B of Appendix table A1). There is
also a clearer protective effect of a rather long interval.
Possible “strategies” when the general mortality decline is taken into account. The
conclusions are quite different if the general decline in mortality is assumed to continue with
the same strength (Panel B): First, the mortality of the first child is minimized by becoming a
mother after age 18. There is little variation in mortality across ages above that. Second, there
is not a clear long-term effect of a higher age at first birth and “secondary effect” of avoiding
short birth intervals. In fact, there are quite few examples that a higher age matters, and on the
whole these tilt towards the adverse side. Thus, in comparison with the standard mortality
models (when continued mortality decline is assumed), everything points towards fewer
advantages from starting childbearing relatively late and not having short birth intervals.
Third, if all birth intervals are three years, the next child will generally have lower mortality
than the child most recently born. (Only a few differences are smaller than 0.10.) If intervals
are generally shorter or generally longer, the conclusion is basically the same, since maternal
age matters little.
Longer period of analysis and variations in effects
Appendix table A2 shows estimates from a model where all births to the interviewed women
are included, also those occurring more than 10 years before interview. Effects of maternal
age and birth order are somewhat weaker (separate effects not shown), and the general
mortality decline is also weaker, but the conclusions about fertility strategies would be the
same.
According to models estimated separately for the countries with lowest and those with
highest HDI - and with the focus again on births within the most recent 10 years – a long birth
interval has more protective effect in the richest countries (Table 6).15
Otherwise, the
estimates differ little.
(Table 6 about here)
Summary and Conclusion
The importance of reproductive factors for infant and child mortality has received much
attention over many years, and the issue is still highly relevant in many parts of the word, not
least in sub-Saharan Africa. However, whereas a sharply adverse effect of a short birth
interval has been reported consistently, there is much uncertainty about the other reproductive
factors. A number of individual and societal characteristics that are hard to measure affect
both fertility and mortality, so conclusions from earlier investigations may be questioned, and
results from studies that have dealt with selection in the most advanced way have given
diverging results.
For some purposes, identification of causal effects may not even be a goal. In the
present study, a model that only controls for period and country was therefore estimated,
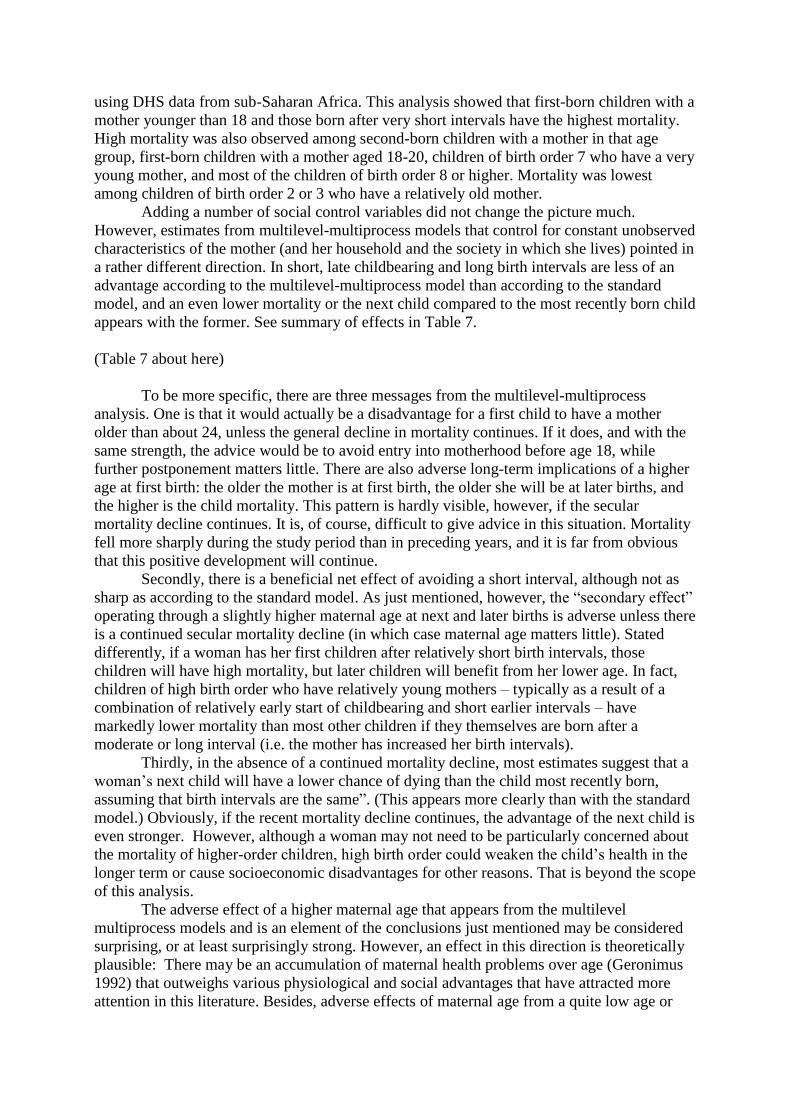
using DHS data from sub-Saharan Africa. This analysis showed that first-born children with a
mother younger than 18 and those born after very short intervals have the highest mortality.
High mortality was also observed among second-born children with a mother in that age
group, first-born children with a mother aged 18-20, children of birth order 7 who have a very
young mother, and most of the children of birth order 8 or higher. Mortality was lowest
among children of birth order 2 or 3 who have a relatively old mother.
Adding a number of social control variables did not change the picture much.
However, estimates from multilevel-multiprocess models that control for constant unobserved
characteristics of the mother (and her household and the society in which she lives) pointed in
a rather different direction. In short, late childbearing and long birth intervals are less of an
advantage according to the multilevel-multiprocess model than according to the standard
model, and an even lower mortality or the next child compared to the most recently born child
appears with the former. See summary of effects in Table 7.
(Table 7 about here)
To be more specific, there are three messages from the multilevel-multiprocess
analysis. One is that it would actually be a disadvantage for a first child to have a mother
older than about 24, unless the general decline in mortality continues. If it does, and with the
same strength, the advice would be to avoid entry into motherhood before age 18, while
further postponement matters little. There are also adverse long-term implications of a higher
age at first birth: the older the mother is at first birth, the older she will be at later births, and
the higher is the child mortality. This pattern is hardly visible, however, if the secular
mortality decline continues. It is, of course, difficult to give advice in this situation. Mortality
fell more sharply during the study period than in preceding years, and it is far from obvious
that this positive development will continue.
Secondly, there is a beneficial net effect of avoiding a short interval, although not as
sharp as according to the standard model. As just mentioned, however, the “secondary effect”
operating through a slightly higher maternal age at next and later births is adverse unless there
is a continued secular mortality decline (in which case maternal age matters little). Stated
differently, if a woman has her first children after relatively short birth intervals, those
children will have high mortality, but later children will benefit from her lower age. In fact,
children of high birth order who have relatively young mothers – typically as a result of a
combination of relatively early start of childbearing and short earlier intervals – have
markedly lower mortality than most other children if they themselves are born after a
moderate or long interval (i.e. the mother has increased her birth intervals).
Thirdly, in the absence of a continued mortality decline, most estimates suggest that a
woman’s next child will have a lower chance of dying than the child most recently born,
assuming that birth intervals are the same”. (This appears more clearly than with the standard
model.) Obviously, if the recent mortality decline continues, the advantage of the next child is
even stronger. However, although a woman may not need to be particularly concerned about
the mortality of higher-order children, high birth order could weaken the child’s health in the
longer term or cause socioeconomic disadvantages for other reasons. That is beyond the scope
of this analysis.
The adverse effect of a higher maternal age that appears from the multilevel
multiprocess models and is an element of the conclusions just mentioned may be considered
surprising, or at least surprisingly strong. However, an effect in this direction is theoretically
plausible: There may be an accumulation of maternal health problems over age (Geronimus
1992) that outweighs various physiological and social advantages that have attracted more
attention in this literature. Besides, adverse effects of maternal age from a quite low age or

over the entire age span have been reported also in earlier studies of child mortality in a
general poor population (Saha and van Soest 2013) or in a disadvantaged sub-group in rich
settings (Powers 2013). Such effects have appeared also in studies of birth weight among
minority groups in the US (Love et al., 2010) and the UK (Goisis and Sigle-Rushton, 2014).
Additionally, the protective effect of higher birth order – which can be seen as counteracting
the age effect so that a next child does not have a markedly higher mortality than the
previously born child - has been reported in earlier studies (Kudamatsu et al., 2012). A
possible explanation is that parents accumulated experience with childrearing, although it may
seem unlikely that this benefit is so large. Moreover, in addition to being plausible and in line
with some earlier studies, the findings are robust to many alternative model specifications,
and the simulation experiment indicates that the estimation has been carried out appropriately.
The fact that the results do not vary across the two main groups of countries that are
considered suggests that the processes involved are either quite general or that interactions
with the socioeconomic development (a few possible examples were given above) cancel each
other out.
Unfortunately, the multilevel-multiprocess model does not control perfectly for
selection, as factors that vary over time within a family are not accounted for. For example, a
mother may not be particularly “childbearing prone” when she has her third child at age 25,
but may for some reason see the world differently some years later or have poorer access to
contraception, and thus continue childbearing beyond the original intentions, perhaps even at
higher speed. Her health or her breastfeeding pattern may also have changed over time, with
implications for her ability to have or interest in having another child soon. Such factors can
obviously also affect the mortality of her children (although some studies that have controlled
for breastfeeding have shown that this factor does not matter much; DaVanzo et al., 2008;
Rutstein 2005). Given these methodological concerns as well as the importance of the subject
and the somewhat challenging results from this study – which suggest that there may be much
more to story about maternal age and birth order than commonly thought - further analysis
based on even richer data and better methods should be very welcome.

Literature
Barclay, K., and M. Myrskylä. 2016. Advanced maternal age and offspring outcomes:
reproductive: reproductive aging and counterbalancing period trend. Population and
Development Review 42: 69-94.
Bhalotra S, van Soest A. 2008. Birth-spacing, fertility and neonatal mortality in Inida:
Dynamics, frailty, and fecundity. Journal of Econometrics 13: 274-290.
Cardoso, M.R.A., Cousens, S.N., Siqueira, L.F.G., Alves, F.M., and D’Angelo, L.A.V. 2004.
Crowding: Risk factor or protective factor for lower respiratory disease in young children.
BMC Public Health 2004: 19.
Chen XK, Wen SW, Fleming N, Demissie K, Rhoads GC, Walker M. 2007. Teenage
pregnancy and adverse birth outcomes: a large population based retrospective cohort study.
International Journal of Epidemiology 36: 368-373.
Cohen, J. Ø. Kravdal, N Keilman. 2011. Childbearing impeded education more than
education impeded childbearing in a cohort of Norwegian women. Proceedings of the
National Academy of Science 108(29):11830-5
Conde-Agudelo A, Rosas-Bermudez A, Kafury-Goeta A. 2006. Birth spcaing and risk of
adverse perinatal outcomes. A meta analysis. JAMA 295: 1809-1823.
Conde-Agudelo A, Rosas-Bermudez A, Castaño F, Norton MH. 2012. Effects of birth spacing
on maternal, perinatal, infant, and child health: A systematic review of causal mechanisms.
Studies in Family Planning 43: 93-114.
Davanco J, Hale L, Razzaque A, Rahman M. 2008. The effects of pregnancy spacing on
infant and child mortality in matlab, Bangladesh: How they vary by the type of pregnancy
outcome that began the interval. Population Studies 62: 131-154.
Demombynes, G., & Trommlerová, S. K. (2012). What has driven the decline of infant
mortality in Kenya?. World Bank policy research working paper, (6057).
Desai S. 1995. When are children from large families disadvantage? Evidence from cross-
national analyses? Population Studies 49: 195-210.
Ezeh OK, Agho KE, Dibley MJ, Hall J, Page AN. 2014. Determinants of neonatal mortality in
Nigeria: evidence from the 2008 Demographic and Health Survey. BMC Public Health 14:
521.
Finlay JE, Özaltin E, Canning D. 2011. The association of maternal age with infant mortality,
child anthropometric failure, diarrhea and anemia for first births: evidence from 55 low- and
middle-income countries. BMJ Open 1: e000226.
Fotso JC, Cleland J, Mberu B, Mutua M, Elungata P. 2012. Birth spacing and child mortality:
an analysis of prospective data from the Nairobi urban health and demographic surveillance
system. Journal of Biosocial Science …

Geronimus AT. 1992. The weathering hypothesis ant the health of Afican-American woman
and infants: evidence and speculations. Ethn Dis 2: 207-221.
Gibbs CM, Wendt A, Peters S, Hogue CJ. 20120. The impact of early age at first childbirth on
maternal and infant health. Paediatric and Perinatal Epidemiology 26 (suppl 1): 259-284
Gibson MA, Lawson DW. 2011. “Modernization” increases parental investment and sibling
resource competition: evidence from a rural development initiative in Ethiopia. Evolution and
Human Behaviour 32: 97-105.
Goisis, A., W. Sigle-Rushton. 2014. Childbearing postponement and child well-being: A
complex and varied relationship? Demography 51: 1821-1841.
Hobcraft J, McDonald JW, Rutstein SO. 1983. Child spacing effects on infant and early child
mortality. Population Index 49: 585-618.
Kozuki N, Walker N. 2013. Exploring the association between short/long preceding birth
intervals and child mortality: using reference birth interval children of the same mother as
comparison. BMC Public Health 13 (suppl 3): S6.
Kozuki N, Lee ACC, Silveira MF, Sania A, Vogel JP, Adair L, Barros F, Caulfield and othe
in the Child Health Epidemiology Reference Group (CHErG) Small-for-Gestational-Age-
Preterm Working Group. 2013a. The associations of parity and maternal age with small-for-
gestational-age, preterm, and neonatal and infant mortality: a meta-analysis. BMC Public
Health 13(suppl 3): S2.
Kozuki N, Sonneveldt E, Walker N. 2013c. Residual confounding explains the association
between high parity and child morrtality. BMC Public Health 13 (suppl 3): S5.
Kravdal, Ø., E. Grundy. T. Lyngstad, and K.Aa. Wiik. 2012. Family life history and late mid-
life mortality in Norway. Population and Development Review 38: 237-257.
Kravdal, Ø., I. Kodzi and W. Sigle-Rushton. 2013. Education in sub-Saharan Africa: A new
look at the effects of number of siblings. Studies in Family Planning 44: 275-297.
Kudamatsu M. 2012. Has democratization reduced infant mortality in sub-Saharan Africa?
Evidence from micro data. Journal of the European Economic Association 10: 1294-1317.
Lee AC, Mullany LC, Tielsch JM, Katz J, Khatry SK, LeClerq SC, Adhikari RK, Darmstadt
GL. 2011. Community-based stillbirth rates and risk factors in rural Sarlahi, Nepal. Int J
Gynechol Obstet 113: 199-204.
Lillard, L.A. and C.W.A. Panis. 2003. aML Multilevel Multiprocess Statistical Software,
version 2.0. Los Angeles: EconWare.
Love C, David RJ, Rankin KM, Collins JW. 2010. Exploring weathering: Effects of lifelong
conomic environment and maternal age on low birth weight, small for gestational age, and
preterm birth in Africa-American and white women. American Journal of Epidemiology 172:
127-134.

Makepeace G, Pal S. 2008. Understanding the effect of siblings on child mortality: evidence
from India. Journal of Population Economics 21: 877-902.
Manda SOM. 1999. Birth intervals, breastfeeding and determinants off childhood mortality in
Malawi. Social Science & Medicine 48: 301-312.
Montgomery, M. and C. Lloyd. 1996. Fertility and child health. In Ahlburg, D., A. Kelley and
K. Mason (eds.), The Impact of Population Growth on Well-Being in Developing Countries.
Springer, Berlin, pp. 37-65.
Population Reference Bureau. 2015. World Population Data Sheet 2015.
Powers DA. 2013. Paradox revisited: a further investigation of racial/ethnic differences in
infant mortality by maternal age. Demography 50: 495-520.
Pullum, TW. 2006. An assessment of age and date reporting in the Demographic and Health
Surveys, 1985-2003. DHS Methodological Reports 5, Macro International, Inc., Calverton,
MD.
Rutstein SO. 2005. Effects of the preceding intervals on neonatal, infant and under-five
mortality and nutritional status in developing countries: evidence from Demographic and
Health Surveys. International Journal of Gynecology and Obstetrics 89: S7-S24.
Saha UR, van Soest A. 2013. Contraceptive use, birth spacing, and child survival in Matlab,
Bangladesh. Studies in Family Planning 44: 45-66.
Steele, F., W.Sigle-Rushton and Ø. Kravdal. 2009. Consequences of family disruption on
children’s educational outcomes in Norway. Demography 46: 553-574.
Upchurch, Dawn M., Lee A. Lillard, and Constantijn W.A. Panis. 2002. “Nonmarital
childbearing: Influences of education, marriage, and fertility,” Demography 39(2): 311-329.
Uthman OA, Uthmn MB, Yahaya I. 2008. A population-based study of effect of multiple
birth on infant mortality in Nigeria. BMC Pregnancy and Childbirth 8: 41.
Whitworth A, Stephenson R. 2002. Birth spacing, sibling rivalry and child mortality in India.
Social Science & medicine 55: 2107-2119.
You, D., Hug, L., Ejdemyr, S., Idele, P., Hogan, D., Mathers, C., ... & Alkema, L. (2015).
Global, regional, and national levels and trends in under-5 mortality between 1990 and 2015,
with scenario-based projections to 2030: a systematic analysis by the UN Inter-agency Group
for Child Mortality Estimation. The Lancet, 386(10010), 2275-2286.
Zhu B-P, Rolfs RT, Nangle BE, Horan JM. 1999. Effects of the interval between pregnancies
on perinatal outcomes. New England Journal of Medicine 340: 589-594.
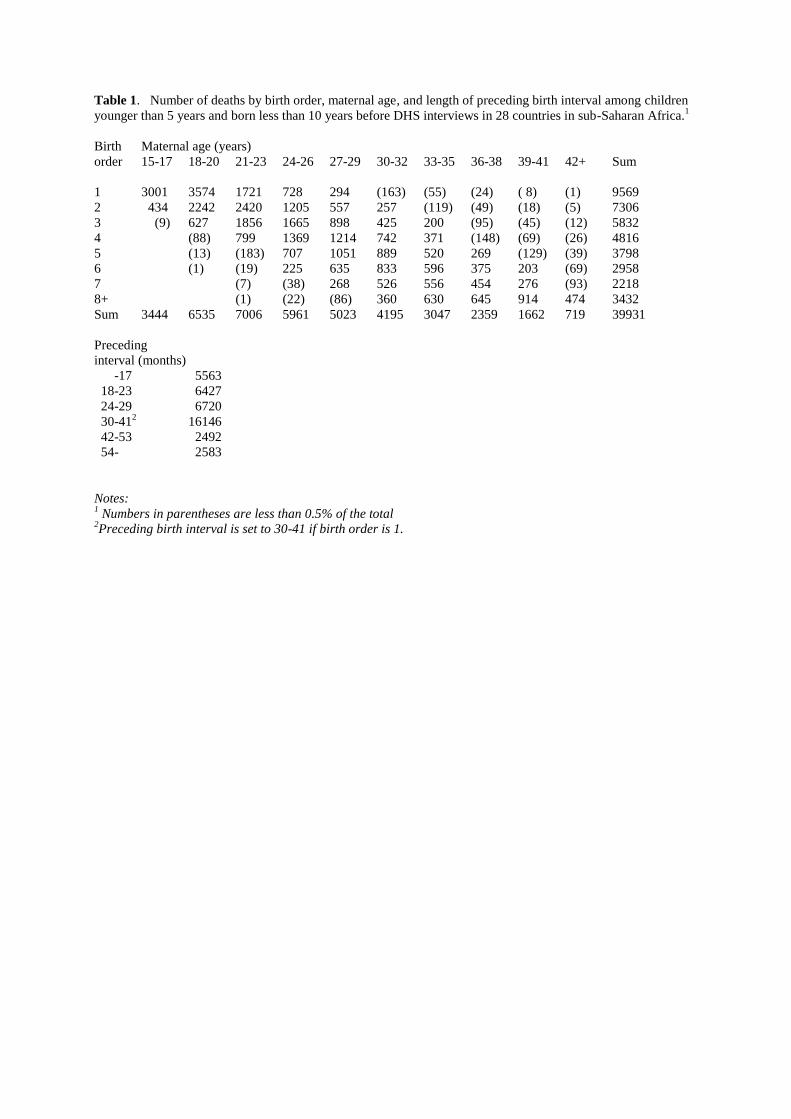
Table 1. Number of deaths by birth order, maternal age, and length of preceding birth interval among children
younger than 5 years and born less than 10 years before DHS interviews in 28 countries in sub-Saharan Africa.1
Birth Maternal age (years)
order 15-17 18-20 21-23 24-26 27-29 30-32 33-35 36-38 39-41 42+ Sum
1 3001 3574 1721 728 294 (163) (55) (24) ( 8) (1) 9569
2 434 2242 2420 1205 557 257 (119) (49) (18) (5) 7306
3 (9) 627 1856 1665 898 425 200 (95) (45) (12) 5832
4 (88) 799 1369 1214 742 371 (148) (69) (26) 4816
5 (13) (183) 707 1051 889 520 269 (129) (39) 3798
6 (1) (19) 225 635 833 596 375 203 (69) 2958
7 (7) (38) 268 526 556 454 276 (93) 2218
8+ (1) (22) (86) 360 630 645 914 474 3432
Sum 3444 6535 7006 5961 5023 4195 3047 2359 1662 719 39931
Preceding
interval (months)
-17 5563
18-23 6427
24-29 6720
30-412 16146
42-53 2492
54- 2583
Notes: 1 Numbers in parentheses are less than 0.5% of the total
2Preceding birth interval is set to 30-41 if birth order is 1.

Table 2. Effects (log odds with SE) of maternal age, birth order, length of preceding birth interval, and calendar
year on mortality among children younger than 5 years and born less than 10 years before DHS interviews in 28
countries in sub-Saharan Africa.
Discrete-time Discrete-time Multilevel-multiprocess
mortality model mortality model model also including
also including also including child’s age,
child’s age and child’s age, country and several
country country and other variables (see text)
several other
variables (see text)
(fertmort23mod40) (fertmort23mod22) (fertmort23mod20)
Maternal
age (years)
15-17 0.38*** (0.02) 0.30*** (0.02) -0.04 (0.03)
18-20 0.12*** (0.02) 0.08*** (0.02) -0.12*** (0.02)
21-231 0 0 0
24-26 -0.07*** (0.02) -0.03 (0.02) 0.17*** (0.02)
27-29 -0.14*** (0.02) -0.06*** (0.02) 0.33*** (0.02)
30-32 -0.17*** (0.02) -0.06*** (0.02) 0.52*** (0.03)
33-35 -0.26*** (0.03) -0.14*** (0.03) 0.63*** (0.03)
36-38 -0.21*** (0.03) -0.08*** (0.03) 0.84*** (0.04)
39-41 -0.11*** (0.03) 0.01 (0.03) 1.03*** (0.04)
42+ -0.04 (0.04) 0.06 (0.04) 1.20*** (0.06)
Birth order
1 0.26*** (0.02) 0.32*** (0.02) 0.53*** (0.02)
21 0 0 0
3 0.03 (0.02) -0.03 (0.02) -0.25*** (0.02)
4 0.11*** (0.02) 0.01 (0.02) -0.43*** (0.02)
5 0.19*** (0.02) 0.05** (0.02) -0.60*** (0.03)
6 0.28*** (0.03) 0.12*** (0.02) -0.73*** (0.03)
7 0.39*** (0.03) 0.21*** (0.03) -0.83*** (0.03)
8+ 0.52*** (0.03) 0.31*** (0.03) -1.09*** (0.04)
Preceding
interval (months)2
-17 1.01*** (0.02) 1.00*** (0.02) 0.88*** (0.02)
18-23 0.60*** (0.02) 0.59*** (0.02) 0.52*** (0.02)
24-29 0.33*** (0.02) 0.32*** (0.02) 0.26*** (0.02)
30-411 0 0 0
42-53 -0.21*** (0.03) -0.20*** (0.02) -0.15*** (0.02)
54- -0.20*** (0.03) -0.16*** (0.02) -0.11*** (0.03)
Year -0.053*** (0.002) -0.052*** (0.002) -0.054*** (0.002)
Standard deviation of δ (σδ) 0.43*** (0.00)
Standard deviation of τ (στ) 0.90*** (0.01)
Correlation between δ and τ (ρδτ ) 0.75*** (0.01)
Notes: 1 Reference category
2Preceding birth interval is set to 30-41 if birth order is 1.
***p<0.01; ** p<0.05; * p<0.010

Table 3. Effects (log odds) of maternal age and birth order on mortality among children younger than 5 years
and born less than 10 years before DHS interviews in 28 countries in sub-Saharan Africa. Discrete-time
mortality model also including length of preceding birth interval, calendar year, country dummies and child’s
age. 1
(fertmort23mod41.aml)
Birth Maternal age (years)
order 15-17 18-20 21-23 24-26 27-29 30-32 33-35 36-38 39-41 42+
1 0.66*** 0.38*** 0.20*** 0.18*** 0.08
2 0.30*** 0.11*** 02 -0.07** -0.13*** -0.14**
3 0.13*** 0.05 -0.04 -0.15*** -0.22*** -0.22***
4 0.15*** 0.01 -0.04 -0.05 -0.08
5 0.11*** 0.05 -0.02 -0.02 -0.06
6 0.23*** 0.17** 0.11** -0.02 0.08 0.11
7 0.33*** 0.21*** 0.11** 0.17*** 0.26***
8+ 0.33*** 0.18*** 0.33*** 0.43*** 0.48***
Notes: 1 Standard errors of the combined effects of maternal age and birth order are 0.03 – 0.07 (largest in the smallest
groups, see Table 1). Effects of birth interval are 1.01, 0.60, 0.32, -0.20 and -0.21, and the effect of calendar
year is -0.053, with standard errors as in column1 of Table 2. 2 Reference category
***p<0.01; ** p<0.05; * p<0.010

Table 4. Effects (log odds) of maternal age and birth order on mortality of children younger than 5 year and
born less than 10 years before DHS interviews in 28 countries in sub-Saharan Africa. Discrete-time mortality
model also including length of preceding birth interval, calendar year, country dummies, child’s age and several
other variables (see text).
PANEL A: Model estimates1
(fertmort23Mod42).
Birth Maternal age (years)
order 15-17 18-20 21-23 24-26 27-29 30-32 33-35 36-38 39-41 42+
1 0.64*** 0.40*** 0.27*** 0.31*** 0.27***
2 0.23*** 0.07** 02 -0.03 -0.02
3 0.06 0.01 -0.05 -0.12*** -0.15**
4 0.07* -0.03 -0.06* -0.04 -0.06
5 0.04 0.00 -0.04 -0.03 -0.07
6 0.15** 0.10** 0.07* -0.05 0.05 0.08
7 0.24*** 0.14** 0.06 0.14*** 0.22***
8+ 0.24*** 0.11** 0.26*** 0.36*** 0.40***
PANEL B: Sum of the period effect (set to 0 for age 21-23) and the combined effect of maternal age and birth
order shown in panel A.
Birth Maternal age (years)
order 15-17 18-20 21-23 24-26 27-29 30-32 33-35 36-38 39-41 42+
1 0.96 0.56 0.27 0.15 -0.05
2 0.55 0.23 02 -0.19 -0.35 -0.51
3 0.22 0.01 -0.21 -0.44 -0.65 -0.80
4 0.07 -0.19 -0.38 -0.54 -0.71
5 -0.12 -0.32 -0.53 -0.68 -0.88
6 -0.01 -0.22 -0.42 -0.70 -0.76 -0.89
7 -0.08 -0.35 -0.59 -0.67 -0.75
8+ -0.25 -0.54 -0.55 -0.61 -0.73
Notes: 1 Standard errors of the combined effects of maternal and birth order are 0.03 – 0.07 (largest in the smallest
groups, see Table 1). Effects of birth interval are 1.01, 0.58, 0.31,0, -0.19 and -0.18, and the effect of calendar
year is -0.054, with standard errors as in column 2 of Table 2. The symbols and indicate examples of
differences of ≤ - 0.1 or ≥ 0.1, respectively, when comparing two cells horizontally and the value in the left cell
is subtract from that in the right. The boxes indicate examples of differences of ≤ -0.1 (bold font) or
≥0.1(standard font) when comparing two cells along a diagonal and the value in the upper left cell is subtracted
from that in the lower right. 2 Reference category
***p<0.01; ** p<0.05; * p<0.010
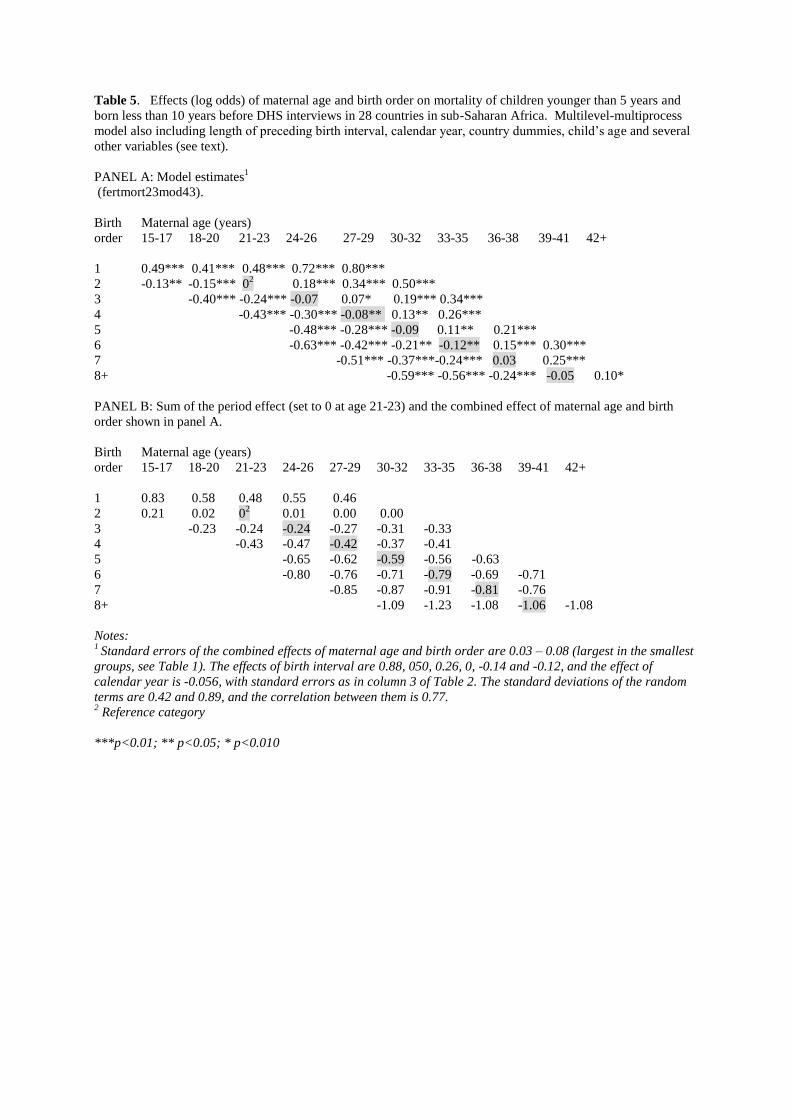
Table 5. Effects (log odds) of maternal age and birth order on mortality of children younger than 5 years and
born less than 10 years before DHS interviews in 28 countries in sub-Saharan Africa. Multilevel-multiprocess
model also including length of preceding birth interval, calendar year, country dummies, child’s age and several
other variables (see text).
PANEL A: Model estimates1
(fertmort23mod43).
Birth Maternal age (years)
order 15-17 18-20 21-23 24-26 27-29 30-32 33-35 36-38 39-41 42+
1 0.49*** 0.41*** 0.48*** 0.72*** 0.80***
2 -0.13** -0.15*** 02 0.18*** 0.34*** 0.50***
3 -0.40*** -0.24*** -0.07 0.07* 0.19*** 0.34***
4 -0.43*** -0.30*** -0.08** 0.13** 0.26***
5 -0.48*** -0.28*** -0.09 0.11** 0.21***
6 -0.63*** -0.42*** -0.21** -0.12** 0.15*** 0.30***
7 -0.51*** -0.37***-0.24*** 0.03 0.25***
8+ -0.59*** -0.56*** -0.24*** -0.05 0.10*
PANEL B: Sum of the period effect (set to 0 at age 21-23) and the combined effect of maternal age and birth
order shown in panel A.
Birth Maternal age (years)
order 15-17 18-20 21-23 24-26 27-29 30-32 33-35 36-38 39-41 42+
1 0.83 0.58 0.48 0.55 0.46
2 0.21 0.02 02 0.01 0.00 0.00
3 -0.23 -0.24 -0.24 -0.27 -0.31 -0.33
4 -0.43 -0.47 -0.42 -0.37 -0.41
5 -0.65 -0.62 -0.59 -0.56 -0.63
6 -0.80 -0.76 -0.71 -0.79 -0.69 -0.71
7 -0.85 -0.87 -0.91 -0.81 -0.76
8+ -1.09 -1.23 -1.08 -1.06 -1.08
Notes: 1 Standard errors of the combined effects of maternal age and birth order are 0.03 – 0.08 (largest in the smallest
groups, see Table 1). The effects of birth interval are 0.88, 050, 0.26, 0, -0.14 and -0.12, and the effect of
calendar year is -0.056, with standard errors as in column 3 of Table 2. The standard deviations of the random
terms are 0.42 and 0.89, and the correlation between them is 0.77. 2 Reference category
***p<0.01; ** p<0.05; * p<0.010

Table 6 . Effects (log odds with SE) of maternal age, birth order, length of preceding birth interval and calendar
year on mortality of children younger than 5 years and born less than 10 years before DHS interviews in two
subgroups of 28 countries in sub-Saharan Africa. Multilevel-multiprocess model also including country
dummies, child’s age and several other variables (see text).
fertmort23mod20poor for low HDI, mod20rich for high HDI,
Countries with Countries with
lowest HDI highest HDI
Maternal
age (years)
15-17 -0.07* (0.04) -0.01 (0.04)
18-20 -0.14*** (0.03) -0.11** (0.03)
21-231 0 0
24-26 0.18*** (0.03) 0.16*** (0.03)
27-29 0.38*** (0.04) 0.29*** (0.03)
30-32 0.55*** (0.04) 0.49*** (0.04)
33-36 0.66*** (0.05) 0.59*** (0.04)
36-38 0.88*** (0.06) 0.80*** (0.05)
39-41 1.08*** (0.07) 0.98*** (0.06)
42+ 1.24*** (0.08) 1.15*** (0.08)
Birth order
1 0.52*** (0.03) 0.54*** (0.03)
21 0 0
3 -0.26*** (0.03) -0.24*** (0.03)
4 -0.43*** (0.04) -0.42*** (0.03)
5 -0.64*** (0.04) -0.55*** (0.04)
6 -0.74*** (0.05) -0.71*** (0.04)
7 -0.85*** (0.06) -0.81*** (0.05)
8+ -1.09*** (0.07) -1.07*** (0.06)
Preceding
interval (months)2
-17 0.89*** (0.03) 0.87*** (0.03)
18-23 0.52*** (0.03) 0.49*** (0.03)
24-29 0.27*** (0.03) 0.25*** (0.03)
30-411 0 0
42-53 -0.11*** (0.04) -0.17*** (0.03)
54- -0.01 (0.04) -0.20*** (0.03)
Year -0.041*** (0.003) -0.064*** (0.003)
Standard deviation of δ (σδ) 0.46*** (0.01) 0.41*** (0.01)
Standard deviation of τ (στ) 0.90*** (0.02) 0.89*** (0.02)
Correlation between δ and τ (ρδτ ) 0.71*** (0.02) 0.78*** (0.02)
Notes: 1 Reference category
2 Preceding birth interval is set to 30-41 if birth order is 1.
***p<0.01; ** p<0.05; * p<0.010

Table 7. Summary of effects on child mortality.
According to standard mortality model According to multilevel-multiprocess model
Ignoring Assuming Ignoring Assuming
mortality mortality mortality mortality
decline decline as decline decline as
earlier earlier
Based on Based on Based on Based on
Table 4 Table 4 Table 5 Table 5
Panel A Panel B Panel A Panel B
Effect of maternal age on
mortality of first child - until age 21 - + after age 24 - until age 18
Higher maternal age mixed - + 0
at second or later (- at low age (few + and
birth, as implication of + at high fewer -,
-later first birth age/order) mostly at
-longer preceding high order)
interval
-longer interval
earlier
Net effect of longer
interval - - but not quite as sharp
Next child compared mixed - - at low order -
to previous, if (- at low order except mixed at high order with fewer
intervals always + especially at at high exceptions
3 years high age/order) age/order
at high age/order)
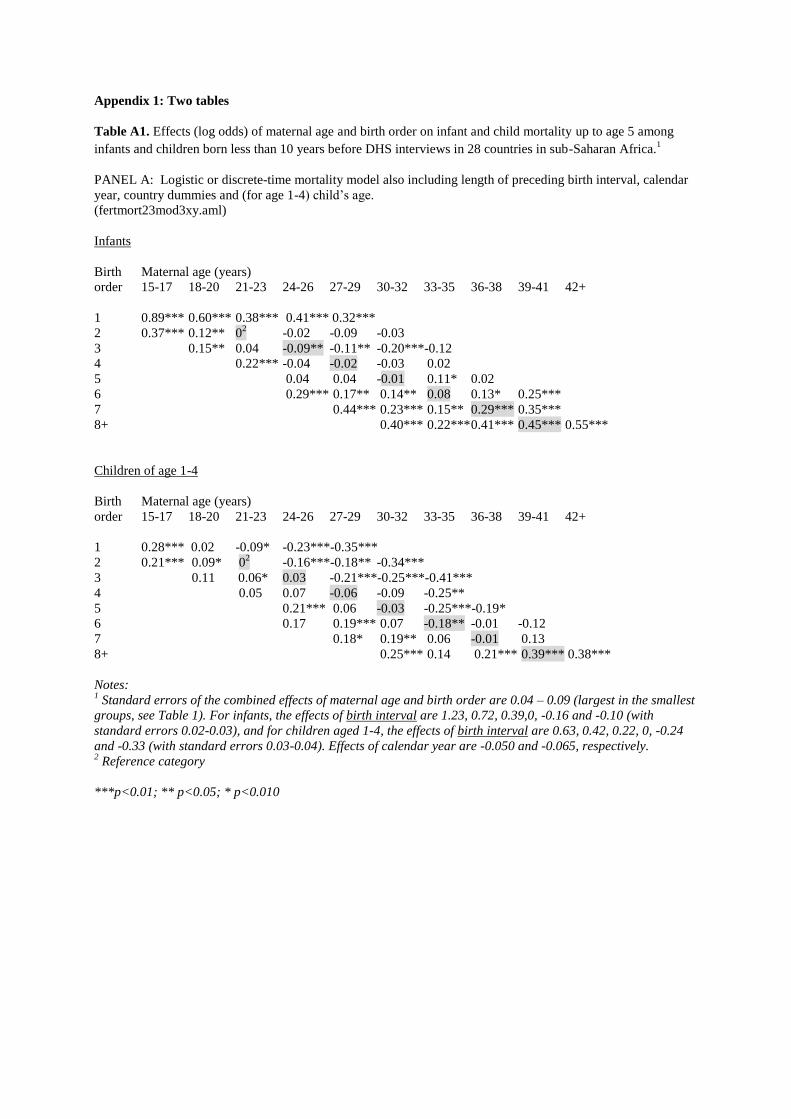
Appendix 1: Two tables
Table A1. Effects (log odds) of maternal age and birth order on infant and child mortality up to age 5 among
infants and children born less than 10 years before DHS interviews in 28 countries in sub-Saharan Africa.1
PANEL A: Logistic or discrete-time mortality model also including length of preceding birth interval, calendar
year, country dummies and (for age 1-4) child’s age.
(fertmort23mod3xy.aml)
Infants
Birth Maternal age (years)
order 15-17 18-20 21-23 24-26 27-29 30-32 33-35 36-38 39-41 42+
1 0.89*** 0.60*** 0.38*** 0.41*** 0.32***
2 0.37*** 0.12** 02 -0.02 -0.09 -0.03
3 0.15** 0.04 -0.09** -0.11** -0.20***-0.12
4 0.22*** -0.04 -0.02 -0.03 0.02
5 0.04 0.04 -0.01 0.11* 0.02
6 0.29*** 0.17** 0.14** 0.08 0.13* 0.25***
7 0.44*** 0.23*** 0.15** 0.29*** 0.35***
8+ 0.40*** 0.22*** 0.41*** 0.45*** 0.55***
Children of age 1-4
Birth Maternal age (years)
order 15-17 18-20 21-23 24-26 27-29 30-32 33-35 36-38 39-41 42+
1 0.28*** 0.02 -0.09* -0.23***-0.35***
2 0.21*** 0.09* 02 -0.16***-0.18** -0.34***
3 0.11 0.06* 0.03 -0.21***-0.25***-0.41***
4 0.05 0.07 -0.06 -0.09 -0.25**
5 0.21*** 0.06 -0.03 -0.25***-0.19*
6 0.17 0.19*** 0.07 -0.18** -0.01 -0.12
7 0.18* 0.19** 0.06 -0.01 0.13
8+ 0.25*** 0.14 0.21*** 0.39*** 0.38***
Notes: 1 Standard errors of the combined effects of maternal age and birth order are 0.04 – 0.09 (largest in the smallest
groups, see Table 1). For infants, the effects of birth interval are 1.23, 0.72, 0.39,0, -0.16 and -0.10 (with
standard errors 0.02-0.03), and for children aged 1-4, the effects of birth interval are 0.63, 0.42, 0.22, 0, -0.24
and -0.33 (with standard errors 0.03-0.04). Effects of calendar year are -0.050 and -0.065, respectively. 2 Reference category
***p<0.01; ** p<0.05; * p<0.010
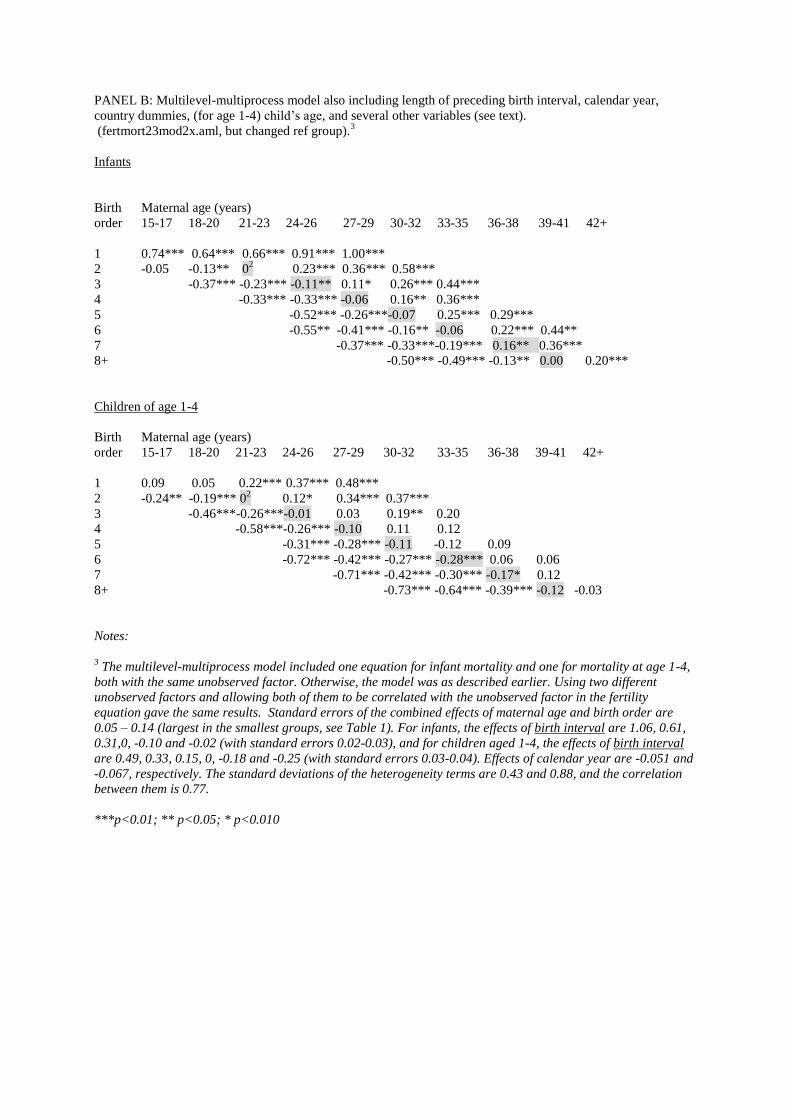
PANEL B: Multilevel-multiprocess model also including length of preceding birth interval, calendar year,
country dummies, (for age 1-4) child’s age, and several other variables (see text).
(fertmort23mod2x.aml, but changed ref group).3
Infants
Birth Maternal age (years)
order 15-17 18-20 21-23 24-26 27-29 30-32 33-35 36-38 39-41 42+
1 0.74*** 0.64*** 0.66*** 0.91*** 1.00***
2 -0.05 -0.13** 02 0.23*** 0.36*** 0.58***
3 -0.37*** -0.23*** -0.11** 0.11* 0.26*** 0.44***
4 -0.33*** -0.33*** -0.06 0.16** 0.36***
5 -0.52*** -0.26***-0.07 0.25*** 0.29***
6 -0.55** -0.41*** -0.16** -0.06 0.22*** 0.44**
7 -0.37*** -0.33***-0.19*** 0.16** 0.36***
8+ -0.50*** -0.49*** -0.13** 0.00 0.20***
Children of age 1-4
Birth Maternal age (years)
order 15-17 18-20 21-23 24-26 27-29 30-32 33-35 36-38 39-41 42+
1 0.09 0.05 0.22*** 0.37*** 0.48***
2 -0.24** -0.19*** 02 0.12* 0.34*** 0.37***
3 -0.46***-0.26***-0.01 0.03 0.19** 0.20
4 -0.58***-0.26*** -0.10 0.11 0.12
5 -0.31*** -0.28*** -0.11 -0.12 0.09
6 -0.72*** -0.42*** -0.27*** -0.28*** 0.06 0.06
7 -0.71*** -0.42*** -0.30*** -0.17* 0.12
8+ -0.73*** -0.64*** -0.39*** -0.12 -0.03
Notes:
3 The multilevel-multiprocess model included one equation for infant mortality and one for mortality at age 1-4,
both with the same unobserved factor. Otherwise, the model was as described earlier. Using two different
unobserved factors and allowing both of them to be correlated with the unobserved factor in the fertility
equation gave the same results. Standard errors of the combined effects of maternal age and birth order are
0.05 – 0.14 (largest in the smallest groups, see Table 1). For infants, the effects of birth interval are 1.06, 0.61,
0.31,0, -0.10 and -0.02 (with standard errors 0.02-0.03), and for children aged 1-4, the effects of birth interval
are 0.49, 0.33, 0.15, 0, -0.18 and -0.25 (with standard errors 0.03-0.04). Effects of calendar year are -0.051 and
-0.067, respectively. The standard deviations of the heterogeneity terms are 0.43 and 0.88, and the correlation
between them is 0.77.
***p<0.01; ** p<0.05; * p<0.010

Table A2. Estimates from a model such as specified in panel A of Table 5, except that also children born more
than 10 years before interview are included. 1 ( fertmort23mod44)
Birth Maternal age (years)
order 15-17 18-20 21-23 24-26 27-29 30-32 33-35 36-38 39-41 42+
1 0.41*** 0.35*** 0.39*** 0.55*** 0.68***
2 -0.07** -0.11*** 02 0.08*** 0.33*** 0.43***
3 -0.25*** -0.19*** -0.03 0.06** 0.19*** 0.32***
4 -0.31*** -0.18*** -0.05** 0.15*** 0.31***
5 -0.35*** -0.18*** -0.02 0.16*** 0.28***
6 -0.47*** -0.34*** -0.17*** -0.04 0.20*** 0.31***
7 -0.43*** -0.30*** -0.15*** 0.04 0.28***
8+ -0.46*** -0.39*** -0.18*** -0.02 0.08
Preceding interval (months)3 Year -0.028*** (0.001)
-17 0.77*** (0.01)
18-23 0.44*** (0.01)
24-29 0.23*** (0.01)
30-412 0
42-53 -0.16*** (0.01)
54- -0.22*** (0.01)
Notes: 1 Standard errors of the age/order effects are 0.03 – 0.12 (and largest in the smallest groups, see Table 1). The
standard errors of the heterogeneity terms are 0.44 and 0.82, and the correlation between them is 0.79. 2 Reference category
3 Preceding birth interval is set to 30-41 if birth order is 1.
***p<0.01; ** p<0.05; * p<0.010

Appendix 2: Simulation
A sample was set up as the first step of the simulation experiment: 600000 women were
distributed across years of interview, age, and education in accordance with the corresponding
distributions of the DHS surveys. (The multilevel-multiprocess models could not be estimated
with a larger sample.)
In the second step, a simplified multilevel-multiprocess model was estimated from the
DHS data. It included the reproductive variables, year, child’s age and mother’s education in
the mortality equations and mother’s age and education, time since birth and year in the
fertility equations. For simplicity, birth order and maternal age were treated as two separate
variables rather than combining them into one variable. The estimates from this model, which
are shown in the first column of Appendix table A3 (and are quite similar to those shown in
column 3 of Table 2 from a model with more variables), were taken as effect parameters in
the simulation, except that effects for one-year categories of maternal age were obtained by
interpolation and extrapolation (see details in notes to Appendix table A3).
In the simulation, birth rates were predicted for each month of life for each woman in
the sample, taking also into account the mortality and fertility random terms, which were
drawn from a bivariate normal distribution according to the estimated covariance structure. A
one-month birth probability was calculated from each of these birth rates, and fertility
histories were then generated from these probabilities. Births of order above 10 were ignored.
The distributions of the simulated births over maternal age, birth order and birth interval
length were very similar to the corresponding distributions of the births in the DHS data (not
shown in tables).
Third, a multilevel-multiprocess model (specified such as in the estimation just
described) was estimated from the simulated birth histories. The estimates (column 2 of
Appendix table A3) did not differ much from the parameters used in the simulation, which
indicates that the program used to adapt data to aML works well and that aML, not
surprisingly, does what it is supposed to do.
Fourth, a standard discrete-time mortality model was estimated from the simulated
birth histories (column 3 of Appendix table A3). The estimates were quite similar to those
obtained when the same model was estimated from DHS data (column 4 of Appendix table
A3) or when more control variables were included (column 2 of Table 2). In other words, the
relatively weak relationships between child mortality and high maternal age and high birth
order that appear in simpler analysis – and that have been reported in some earlier studies -
are consistent with a sharply positive effect of high maternal age, a sharply negative effect of
high birth order, and a positive correlation between constant woman-specific mortality and
fertility random terms, such as found with the multilevel-multiprocess model estimated from
DHS data.
A sibling model (i.e. a mortality model with mother-level fixed effects) might be seen
by many researchers as a reasonable alternative. It is worth noting that it does not give correct
estimates. Less positive effects of high maternal age are obtained with such a model (column
5 of Appendix table A3), and the year effect is much smaller, while effects of birth order and
birth interval are the same. (Using a much larger simulation sample gave similar results.) An
intuitive explanation of this is that the increase in mortality within a 3-year category of
mother’s age is partly attributed to the period effect. In contrast, the period effect is estimated
correctly with the multilevel-multiprocess approach, which not in the same way is a
comparison between siblings, but also makes use of data on children without siblings and
allows inclusion of factors that do not vary across siblings. A bias in the period effect has
implications especially for the estimation of effects of maternal age. If broader categories of
maternal age are used, the sibling model gives even more biased estimates (column 6 of

Appendix table A3).16
Also a fixed-effect proportional hazard (Cox) model was estimated
from the simulated birth histories, after adding months of death at random. The results were
similar to those obtained with a sibling model (not shown in tables).

Table A3. Results from simulation experiments (only point estimates shown)
Effect Multilevel-
parameters multiprocess Standard Standard
used in the model mortality mortality Sibling
simulation1 estimated model model mortality
from estimated estimated models
simulated from from estimated
births2 simulated DHS from
births3 data
3 simulated
births3,4
(simul30, (simul30 (same) (same as tab2
from buildsimul16 col 1, except (simul30)
fertmort23mod30 fertsimul16.r2a ctrl educ and
which gives fertsimul30.aml) not country)
the same as in Tab3
except ctrl social)
Mother’s age
15-17 -0.02 -0.02 0.37 0.36 0.11 0.03
18-20 -0.12 -0.07 0.15 0.10 -0.01
21-235 0 0 0 0 0 0
24-26 0.17 0.18 -0.06 -0.06 0.11
27-29 0.35 0.36 -0.10 -0.11 0.21 0.08
30-32 0.55 0.52 -0.15 -0.13 0.31
33-35 0.67 0.67 -0.20 -0.21 0.39 0.12
36-38 0.89 0.83 -0.21 -0.16 0.49
39-41 1.10 1.00 -0.14 -0.07 0.58 0.16
42-44 1.26 1.18 -0.07 -0.02 0.60
Birth order
1 0.54 0.54 0.27 0.30 0.68 0.73
25 0 0 0 0 0 0
3 -0.26 -0.26 0.00 0.00 -0.28 -0.29
4 -0.46 -0.44 0.06 0.06 -0.47 -0.48
5 -0.65 -0.63 0.11 0.12 -0.67 -0.69
6 -0.80 -0.76 0.22 0.20 -0.81 -0.83
7 -0.94 -0.90 0.30 0.30 -0.99 -1.01
8+ -1.25 -1.16 0.44 0.42 -1.25 -1.27
Birth interval
-17 0.83 0.84 0.85 0.99 0.96 0.98
18-23 0.50 0.49 0.55 0.61 0.57 0.57
24-29 0.25 0.24 0.27 0.33 0.28 0.28
30-415 0 0 0 0 0 0
42-53 -0.14 -0.15 -0.20 -0.20 -0.17 -0.17
54- -0.10 -0.10 -0.18 -0.19 -0.14 -0.14
Year -0.043 -0.043 -0.040 -0.039 -0.018 0.005
Random terms
St. dev. of δ 0.47 0.46
St. dev. of τ 0.99 0.99
Corr. between
δ and τ 0.79 0.77
Notes: 1 These parameters are estimates of effects/coefficients in a multilevel model including only the age, duration
since birth, parity, year and education in the fertility equation, and maternal age and edcuation, birth order,

birth interval, year, and child’s age in the mortality equation (i.e. as in column 3 of Table 2, except that
education is the only variable in addition to the “core” demographic variables). The model was estimated from
DHS data. The parameter for a middle one-year age category (e.g. 31) of a three-year category of maternal age
(e.g. 30-32) is set to the estimate for that three-year category, which is shown in column 1 of the table.
Parameters for the other one-year categories are obtained by linear inter- and extrapolation from the
parameters for the middle one-year categories. 2 The model includes the same variables as described in note1.
3 The model includes the same variables as in the mortality equation in the multilevel-model on which the
simulation was based, i.e. birth order, mother’s age and education, birth interval, year, and child’s age. In the
fixed-effects model, maternal education cancels out. 4 Pairs of maternal age categories are grouped together
5 Reference category

Endnotes
1 The surveys have used a stratified cluster sample design. Within each province, a number of primary sampling
units (PSUs) have been selected. These units typically encompass one or a few villages or part of a town. On
average, about 25 households have been randomly selected within each primary sampling unit, and women of
reproductive age in the household have been interviewed.
2 Women with twins were included in some additional calculations. The number of pregnancies resulting in live
births was then considered, along with a twin indicator. The results were very similar.
3 It has been observed that some women report a higher age for a child born a little less than five years before
interview to avoid answering so many detailed questions. This may be particularly common if the child has died
(Pullum 2006), which, in principle, could blow up the adverse effects of short birth intervals.
4 Thus, if a woman had her first birth at age 13 and then no other birth before the end of the year when she turned
14, she only contributed to the estimation of the equation for second- and higher-order births, and from the latter
age.
5 A linear trend in the birth rate from 0 to 24 months is not realistic, but adding a node at 8 months gave almost
identical results.
6 A restriction implied by the equations above is that effects of A, D and X’ are the same at all parities above 1.
The results were similar if the effects were allowed to vary.
7 If these groups were left out also when estimating separate effects of maternal age and birth order, the results
were almost unchanged.
8 These simpler models could, of course, also be estimated directly from the data fed into aML, using the same
software as when preparing these data (SAS). Alternatively, one might keep the mortality random term and omit
the fertility equation (essentially the same as setting the correlation between the two random terms to zero). Thus,
there would still be an unobserved factor affecting the mortality of all siblings, but not linked to fertility. This
gave almost identical results.
9 Addition of the separate effects of maternal age and birth order shown in the first column of Table 2 gave the
same pattern, except for a lower mortality at the lowest maternal ages for birth orders 4 and 6-8 (not shown).
10
If mother’s year of birth was included instead of child’s year of birth, the combined effects of maternal age
and birth order were very similar to those shown in Panel B of Tables 4 and 5, as maternal age then picked up
also the period effect.
11
Conclusions about long-term effects could alternatively have been reached by including age at first birth
instead of current age for birth orders above 1 in the mortality equation.
12
In fact, the high mortality of the second-born child, primarily because of the short preceding birth interval,
itself increases the chance of a short subsequent interval.
13
To reach such conclusions, one could alternatively include age at previous birth and length of preceding
interval in the model, as well as mother’s birth cohort instead of year of birth if the intention is to let the two
other variables pick up the period effect.
14
If a broader categorization of maternal age and birth order was used, effects were weaker. This is because
differences in child mortality within a birth-order category are attributed to the effect of maternal age, which
then becomes less positive, and vice versa.

15
This could be partly a selection effect: In that setting, a long interval may to a lesser extent be the result of an
adverse pregnancy outcome that may reflect poor maternal health or other problems of importance for child
mortality.
16
Further broadening of the categories gives weaker effects of maternal age also when a multilevel-multiprocess
model is estimated, but the differences are much smaller than with a sibling model, and the estimate of the year
effect changes only moderately. Note also that one cannot estimate discrete-time fixed effects models with one-
year categories for maternal age, while this would work well with the multilevel-multiprocess approach.