memorandum to: from: brad gamble, henry hunt and sam …
TRANSCRIPT

1
MEMORANDUM TO: Brad Phelps, Project Manager, CH2M Hill FROM: Brad Gamble, Henry Hunt and Sam Stowe,
Layne Ranney Collector Wells RE: Results: Test Borings and Hydraulic Interval Testing Cowlitz River Alluvial Aquifer Collector Well Feasibility Study
DATE: March 3, 2016
INTRODUCTION The City of Longview currently operates four deep (352-385 feet) water supply wells constructed in the alluvium associated with the Columbia River. These wells, constructed in the Mint Farm Industrial Park, are located in the western portion of the City. The City initiated an investigation to determine the feasibility of replacing their current water supply wells using collector well technology from the alluvium in the Cowlitz River valley, which generally forms the eastern boundary of the City. In order to determine if the hydrogeologic conditions are sufficient to develop a collector well (or wells) along the Cowlitz River, Layne was authorized to undertake a phased drilling and testing program. The first phase involved drilling test borings in three locations north of the City and conducting hydraulic interval testing. The results of this recently completed work, the capacity estimates and water quality analyses are presented in this memorandum. The data collected were evaluated primarily to determine if additional detailed aquifer testing is warranted, and if so, the most favorable location to conduct the detailed aquifer testing, which constitutes the second phase of this investigation. FIELD ACTIVITIES In order to evaluate the hydraulic character of the alluvial deposits, a total of three (3) test borings were drilled by Cascade Drilling, L.P. using rotasonic drilling technology, under the supervision of an experienced Layne hydrogeologist. Test boring TH-1 was drilled in Riverside County Park (Site 1), test boring TH-2 was drilled along Solomon Road (Site 2), and test boring TH-3 was drilled adjacent to the (inactive) Fishers Lane Water Treatment Plant (FLWTP) (Site 3) as shown in Figures 1 and 2. Each boring was advanced until it was confirmed that the base of coarse-grained alluvial deposits was encountered. Lithologic samples were retained from
2
every five (5) feet of depth and at each change in formation materials. Selected samples from each boring were retained by Layne for grain size analysis. Lithologic samples not retained by Layne were submitted to the City at the end of the field activities. Hydraulic interval pumping tests were conducted in borings at two of the three locations (Sites 1 and 3). At Site 1 a single test boring, TH-1, was drilled, and the interval test was conducted in this boring. At Site 3, boring TH-3 was drilled for the lithologic characterization and installation of an observation well; then a larger diameter boring, TH-3a, was drilled 8.5 feet away from TH-3 to conduct the hydraulic interval test. Some stratigraphic differences were noted between the two borings which may be the result of variability within the formation and/or differences in sampling between the two borings. No hydraulic interval test was conducted at Site 2 because the saturated thickness of sand and gravel aquifer encountered in TH-2 was so thin and the deposits above and below the aquifer deposits were of sufficiently low permeability that they would likely restrict recharge to the thin sand and gravel layer that was encountered at 55.5 to 58 feet below ground surface. The vertical interval (depth) to be tested in borings TH-1 and TH-3a was selected by the hydrogeologist on the basis of the drilling and material sampling results. Upon reaching the total completion depth of the test boring, the casing was pulled back to the bottom of the interval to be tested, and a 15-foot length of well screen (6-inch diameter, wire-wrapped continuous slot) was installed in the selected interval using the pullback method. The screen slot size was 0.020-inch. An electric submersible pump capable of pumping up to 125 gallons per minute (gpm) was used to develop the test wells and conduct the test pumping. Development of the interval tested was accomplished by surging and airlifting for up to two hours until the water produced was visibly clear and contained little or no sediment. For the tests, the selected interval was pumped for two (2) hours, with the pumping period divided into four (4) steps of thirty (30) minutes duration. During each step, the pumping was maintained at a constant rate. During the hydraulic interval test pumping periods, depths to water in the test wells were measured to the nearest 0.01 foot. The elapsed time of pumping to the nearest minute and the pumping rate associated with the water level measurements were also recorded. The approximate elevation

3
of the Cowlitz River in this area was also monitored during this testing using a stage gage at the existing intake near the FLWTP and a nearby U.S. Army Corps of Engineers gaging station. An in-line electronic flowmeter (Great Plains Industries, Inc. Model TM200-N) was used to measure the pumping rates. During each step of the pumping period, water level measurements in the test boring were made on at approximately the following schedule:
Every 1 minute for 0 to 6 minutes from the start of the step; Every 2 minutes for 6 to 12 minutes from the start of the step; Every 5 minutes after 15 minutes from the start of the step.
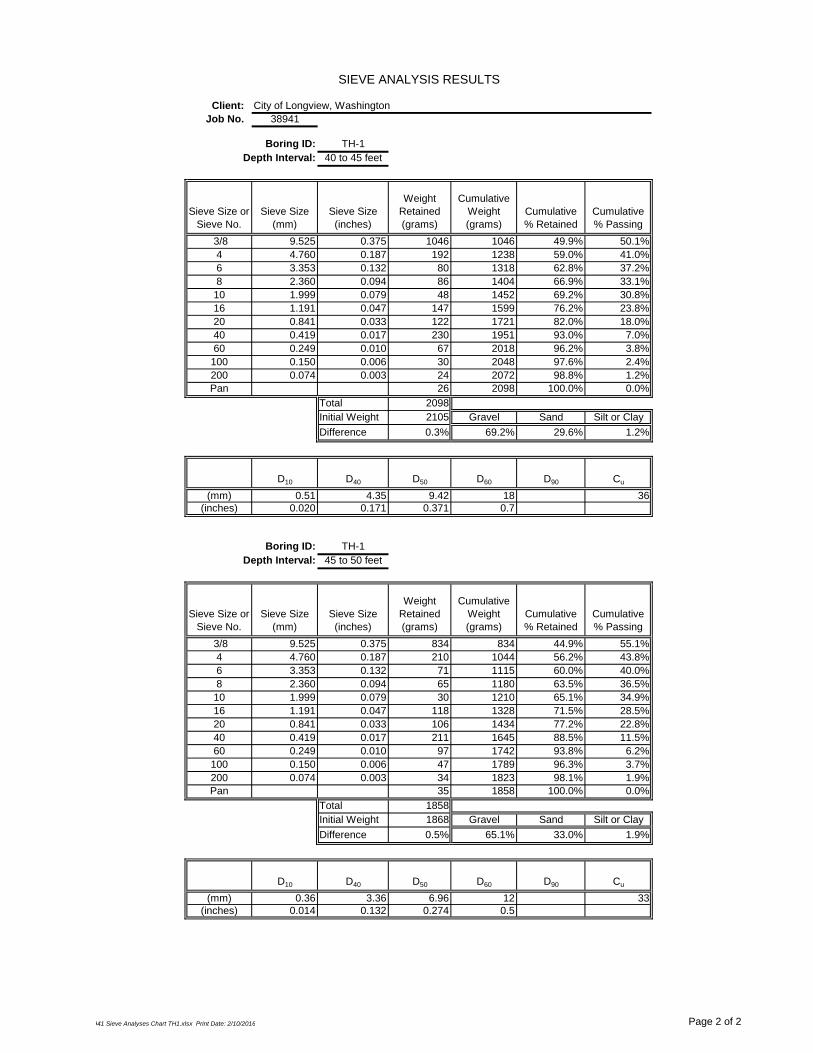
During the hydraulic interval testing, water samples were field screened for pH, conductivity, iron and temperature by Layne. Additionally, water samples were collected by CH2M during the pumping period and submitted to the ALS Environmental Kelso Laboratory for laboratory analysis of water quality parameters selected by CH2M. Water samples were not collected at Site 2 because that location had been determined unfavorable due to the limited saturated thickness of sand and gravel. A water sample was also collected from the Cowlitz River by Layne for general background screening purposes. Two of the borings, TH-1 and TH-3, were converted to 2-inch diameter PVC observation wells. Each observation well was installed with 10 feet of machine slotted PVC well screen. At TH-1 (in Riverside County Park), the top of the observation well was completed with a flush-grade cover. At TH-3 (FLWTP site), the top of the observation well was completed with an above-grade 4-inch square steel protective casing with a lockable lid. Water-tight plugs were installed in the tops of the PVC casings in both observation wells. The other borings, which were no longer needed for exploratory testing, TH-2 and TH-3a, were properly abandoned following completion of the drilling by filling with bentonite chips per WAC 173-160-381 and Department of Ecology requirements. TEST DRILLING RESULTS Detailed logs of the materials encountered in the boreholes are presented in Attachment 1, and a summary of information on the boreholes and observation wells is presented in Table 1. The sieve analysis results are presented in Attachment 2 and summarized in Table 2.
4
The borings were drilled to total depths of 60 to 80 feet. All of the borings were advanced until about 10 feet of low permeability materials were encountered. In all of the borings, alluvial deposits of unconsolidated sand with varying amounts of gravel were present from just below the ground surface to depths of 48 to 58 feet. The coarse-grained alluvial deposits were underlain by layers of comprised mainly of clay and/or silt, which will not yield usable quantities of water and would impede recharge to any more permeable deposits that might be present at greater depths. The grain size distribution of the coarse-grained alluvial deposits encountered in the borings varied from nearly all sand to more than 70% gravel (based on the Wentworth grain size classification). The greatest depth to the base of the coarse-grained sand and gravel deposits was at 58 feet in TH-2, which is the boring along Solomon Road. However, in this boring the sand and gravel was only 2.5 feet thick. The shallowest depth to the base of the coarse-grained sand and gravel deposits was at 48 feet in TH-3 at the FLWTP. The sand and gravel was 13 feet thick in TH-3. In TH-1 in Riverside County Park the depth to the base of the sand and gravel was at 50 feet, and this boring encountered the thickest layer of coarse-grained sand and gravel at 23 feet thick.
The uppermost sediments encountered at Riverside County Park could be the result of dredging operations in the area following the 1980 eruption of Mt. St. Helens and subsequent surge flows down the Cowlitz and Toutle Rivers. A local resident described the pumping of dredge spoil sediments into the park area at some time in the past, presumably to raise the grade elevation in this area.
The measured depths to water in the borings varied from about 12 to 19 feet below ground with the water table elevations estimated to be about 15 to 23 feet above sea level. The saturated thickness above the base of the coarse-grained sand and gravel deposits varied from about 35 to 39 feet, with the greatest saturated thickness occurring at TH-2 where the base of the sand and gravel was encountered at the lowest elevation. However, as indicated above, there is only about 2.5 feet of sand and gravel present at TH-2. The remainder of the saturated thickness above the sand and gravel in TH-2 is comprised of clayey silt and silty sand which will not yield usable quantities of water.
In addition to the three test borings completed as part of this phase, the results from drilling of a test boring during a 1977 investigation for the City of Kelso (T.H.2) on a property (referred to as the Ostrander Rock Property)
5
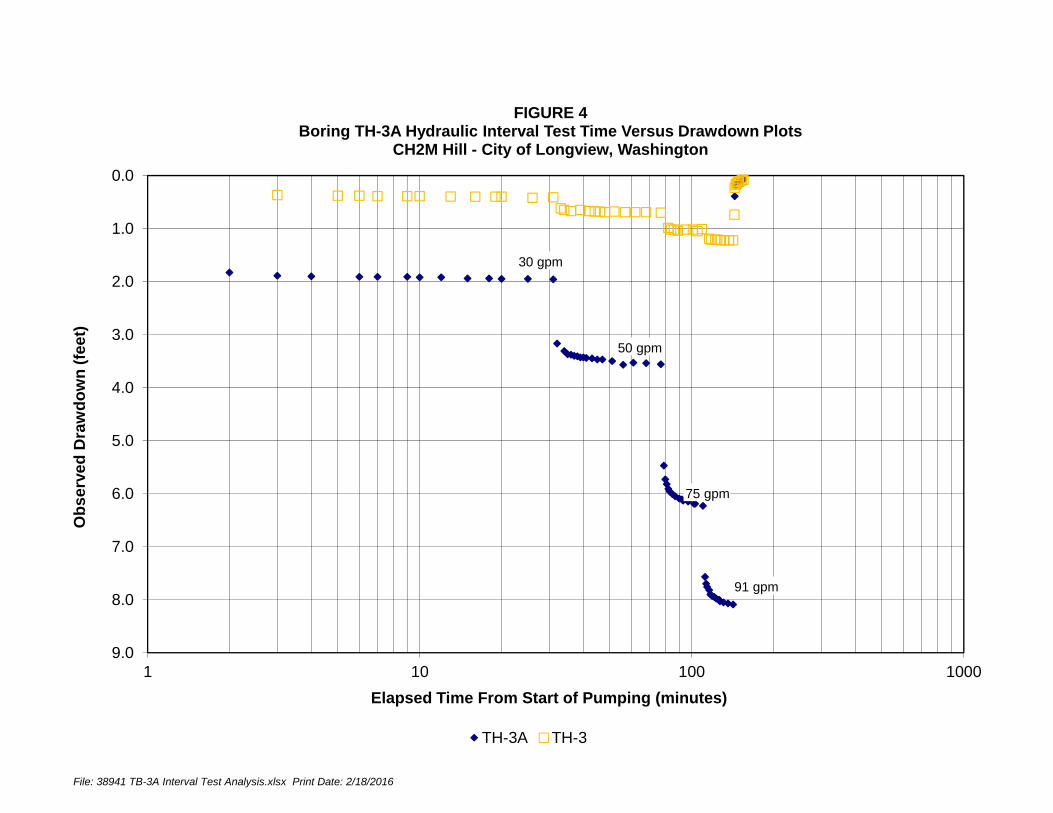
in the vicinity of the Solomon Road Site (the approximate location shown on Figure 2) was also considered. Attempts were made to gain access to this property for the purposes of installing a new test boring, however, an agreement could not be reached within the time frame of this study schedule. The previous boring conducted in 1977 showed a saturated sand and gravel aquifer thickness of approximately 32 feet. The previous boring was completed before the eruption of Mt. St. Helens, and the information in the 1977 report does not reflect the possible accumulation of dredge spoils or river surge flows that may have been deposited post-1980. These deposits could have raised the grade elevation from what was observed at in 1977. HYDRAULIC INTERVAL TEST RESULTS The hydraulic interval pumping test data are presented in Attachment 3, and a summary of the pumping test results is presented in Table 3. Time drawdown plots for the pumping tests are presented in Figures 3 and 4. For the hydraulic interval pumping test conducted at TH-1 (Riverside County Park), the observed drawdown value (the difference between the static and the pumping water levels in the wells) at the end of the step at the maximum pumping rate of 121 gpm was 1.66 feet. The observed specific capacity (the ratio of the pumping rate to the drawdown) for this step is 73 gallons per minute per foot of drawdown (gpm/ft). At TH-3a (FLWTP site), the maximum pumping rate that could be sustained was 91 gpm and the observed drawdown at the end of the step at this rate was 8.09 feet giving a specific capacity of only 11 gpm/ft. Estimates of the aquifer transmissivity and hydraulic conductivity were made based on the observed specific capacity values. These transmissivity and hydraulic conductivity values should be considered as very approximate estimates given factors such as the short-term length of the pumping tests, potential boundary effects, possible recirculation of the discharge water, and pumping well efficiency. Transmissivity of an unconfined aquifer can be estimated from specific capacity using the following equation (Driscoll, 1986):
T = 1500 * Q/s
Where: T = transmissivity, gpd/ft Q/s = specific capacity, gpm/ft Q = pumping rate, gpm s = drawdown, feet

6
Hydraulic conductivity is related to transmissivity by the following equation:
K = T/b Where: K = hydraulic conductivity, gpd/ft2 b = aquifer thickness, feet The specific capacity data from the tests were adjusted for well efficiency and partial penetration effects using an equation by Kozeny (Driscoll, 1986), such that:
EX
sQ
T
1500
X Lr
b L
L
1 7
2 2cos
Where: T = aquifer transmissivity, gpd/ft Q = pumping rate, gpm s = drawdown, feet
r = well radius, in feet b = saturated aquifer thickness, feet L = well screen length as a fraction of aquifer
thickness r = well radius, feet X = partial penetration adjustment
E = well efficiency For the analysis, the well efficiency was estimated using the methods presented by Bruin and Hudson (1955). The estimated transmissivity values from the hydraulic interval tests are included in Table 3. For the TH-1 site, the transmissivity values were calculated with and without the partial penetration correction. The Kozeny equation used to adjust for partial penetration assumes that the aquifer is homogeneous and isotropic. At the TH-1 site, the aquifer materials have a fining upward character, where grain-size becomes finer in the upward direction with finer-grained material lying over coarser sediments. Because of this, the partial penetration adjustment may result in an optimistic
7
estimate of the transmissivity and hydraulic conductivity values. In the temporary well installed in TH-3a for the interval test, the screened zone fully penetrated the sand and gravel layer and so a correction for partial penetration is not needed. The results for the TH-1 test without the partial penetration correction are approximately 136,000 gallons per day per foot (gpd/ft) for the transmissivity and approximately 3,600 gallons per day per square foot (gpd/ft2) for the hydraulic conductivity. With the partial penetration correction, the results for the TH-1 test are about 240,000 gpd/ft for the transmissivity and about 6,400 gpd/ft2 for the hydraulic conductivity. It is likely that the actual aquifer properties are intermediate between the values obtained with and without the partial penetration correction. The results for the TH-3a test are approximately 35,000 gpd/ft for the transmissivity and approximately 2,700 gallons gpd/ft2 for the hydraulic conductivity. However, the drawdown data obtained from the observation well installed in boring TH-3 during the TH-3a interval test suggests that the hydraulic conductivity at the TH-3a site could be higher than was calculated based on the pumping well data and could be similar to the upper range of the values obtained for the TH-1 site. Hydraulic conductivity values between 3,000 and 5,000 gpd/ft2 are in the expected range for an aquifer comprised mainly of sand and gravel of a character similar to that observed during the drilling. WATER QUALITY The results of the field water quality testing conducted during the hydraulic interval tests are presented in Table 4. The laboratory results from the TH-1 samples are summarized in Table 5, and the laboratory results from the TH-3a samples are summarized in Table 6. The laboratory reports are attached as Attachment 4. The field water quality measurements indicated that the ground water temperatures averaged between 53 degrees F (11.4 degrees C) at TH-1 and 50 degrees F (10.3 degrees C) at TH-3a. The specific conductance values averaged 240 micro Siemens per centimeter (µS/cm) at TH-1 and 230 µS/cm at TH-3a. Field sampling and testing for iron concentrations exceeded the limits of the field testing equipment, suggesting the iron concentrations were above the testing limit of 5 milligrams per liter (mg/l). The laboratory iron concentrations for the samples from TH-1 and TH-3a were 11.1 and 12.5 mg/l, respectively, both of which are considerably

8
above the secondary drinking water standard for iron of 0.30 mg/l. The manganese results for TH-1 at 0.29 and for TH-3a 0.64 mg/l exceed the secondary drinking water standard for manganese of 0.050 mg/l. The aluminum result for TH-3a at 0.27 mg/l exceeds the secondary drinking water standard for aluminum of 0.2 mg/l, and the aluminum result for TH-1, at 0.04 mg/l is below the secondary standard. Secondary drinking water standards are generally established for aesthetic reasons to control issues of color, odor or the potential for staining, rather than for health effects. A water sample from the Cowlitz River was collected by Layne at Riverside County Park for general background screening and comparison to the ground water quality. The results for the river water sample are summarized in Table 7 and the laboratory report is included as Attachment 5. The aluminum, iron and manganese concentrations in the river water sample also exceed the secondary drinking water standards, but the iron concentration in the river water at 0.43 mg/l is substantially lower than the iron concentrations in the sample from TH-1 and TH-3a. Silica levels in the Cowlitz River were reported at 18 mg/L, notably lower than the total silica levels reported in ground water samples collected from TH-1 and TH-3a at 58 mg/L and 49 mg/L, respectively. Arsenic was reported as non-detect in samples from all three sources. AQUIFER CHARACTERIZATION The unconsolidated sand and gravel deposits encountered in the test borings are part of the Cowlitz River Valley alluvial aquifer system. There are permeable sand and gravel deposits present at each of the test boring locations, to varying degrees of thickness, which are a source of ground water supply. Based on their fine-grained nature, the deposits observed just below the sand and gravel aquifer deposits likely have very low permeability and would yield negligible quantities of water to wells. The limited saturated thickness of sand and gravel at borings TH-2 and TH-3 and the relatively low hydraulic conductivity values at TH-2 limit the potential yield of production wells at those test boring locations. Of the sites tested, the TH-1 location in Riverside County Park is the most favorable location for ground water supply development based on the higher transmissivity values for that location and the greater saturated thickness. The location of the test boring T.H.2 made in 1977 (Ostrander Rock Property) also appears potentially favorable due to the well log description and the reported saturated thickness, however, confirmation of

9
the depth, permeability and saturated thickness of those deposits is required to verify the aquifer conditions and potential well yield projections at this prospective location.
Based on the available information from a nearby City of Kelso radial collector well constructed in the alluvial deposits along the Cowlitz River, it appears the aquifer conditions and the potential productivity at the Riverside County Park site may be similar or more favorable than those for the existing collector well operated by the City of Kelso. The yield estimated for a collector well installed at TH-1 (Riverside County Park), up to 9 million gallons per day (MGD) under test conditions, is above the yield reported for the Kelso collector well on an average pumping basis. The information from drilling and testing TH-1 and TH-3a, and from the existing radial collector well, suggests that the areas upstream from the Ostrander Rock Property to Riverside County Park along the Cowlitz River appear favorable for development of a horizontal collector well water supply. At both Riverside County Park and the Ostrander Rock property, there is a flood control levee that runs the length of each property following the Cowlitz River. It is understood that subsurface construction in either area will require discussions and compliance with levee-related regulations for locating and operating wells. HORIZONTAL COLLECTOR WELL YIELD ESTIMATE Using the recent testing results, estimates for the yield of horizontal collector well can be calculated. The theoretical drawdown under steady-state pumping conditions in a collector well can be calculated using the following equation developed by Hantush and Papadopulos (1962):
cs
b
42
w
i w
s Q
2 Kb
b
r
2 1 - b
2 z + r
Lncos
l
where: scs = Drawdown in collector well, ft Q = Yield of collector, gpd K = Hydraulic Conductivity, gpd/ft2 b = Saturated thickness of aquifer, ft

10
= (2 (a - rc))/l a = Effective distance to a line of recharge, ft l = Average length of laterals, ft rc = Radius of collector caisson, ft = (2a - rc - l)/l rw = Effective radius of each lateral, ft zi = Depth of lateral below top of the aquifer, ft
The test boring location with the most favorable aquifer conditions of the three sites tested in this investigative study is TH-1. Using a variation of the above equation, the potential collector well yield was estimated using values determined by the test results and the hydrogeologic setting of the TH-1 and TH-3a locations. To estimate yield, the design depth to centerline elevation of the laterals is assumed at seven (7) feet above the estimated base of the alluvial aquifer and the minimum pumping level at ten (10) feet above the centerline of the laterals. The effective distance to recharge was assumed to equal the distance from the test boring locations to the middle of the Cowlitz River. The assumed collector well design utilized five (5) laterals with an average lateral length of 200 feet. For comparability, the same number and length of laterals were used for the yield calculations for both sites. However, because of the proximity to structures and property lines for the TH-3a site, installation of five 200-foot laterals would require the demolition of existing structures and/or the acquisition of additional property. The calculated yields for the TH-3a site are too low to justify installation of five laterals (three would be sufficient). The collector well yield estimates for both sites assume no pumping interference from any adjacent wells. For both sites, the collector well yields were calculated with a low and high estimate of the hydraulic conductivity. For the TH-1 site, the hydraulic conductivity values used for the yield estimates were those obtained from the interval test analysis with and without the partial penetration correction (3,600 and 6,400 gpd/ft2). For the TH-3a site, the low hydraulic conductivity value was from the interval test analysis (2,700 gpd/ft2) and the high hydraulic conductivity value (6,400 gpd/ft2) was the same as the high value for the TH-1 site. Based on the equation and the assumptions presented above, the yield of a collector well installed near the TH-1 location under the conditions present during testing is estimated to be in the range of 3,570 to 6,340 gpm or 5.1 to 9.1 MGD. The yield of a collector well installed near the TH-3a location
11
under the conditions present during the testing is estimated to be in the range of 1,150 to 2,730 gpm or 1.7 to 3.9 MGD. The actual collector well yields will depend on how well the actual conditions match the assumed conditions and will vary with changes in recharge conditions, river and ground water levels and river and ground water temperatures. It is estimated that during the interval testing the Cowlitz River levels were 3 to 4 feet above normal low river levels. Reducing the static water levels by 3 to 4 feet to adjust for normal river conditions could reduce the estimated yields by 20% or more from the values presented above. Considering the estimated yield for a collector well at the Riverside County Park site, and assuming that a similar yield could also be developed at other sites within the park boundaries, it appears that two collector wells could be installed on this property to produce a combined capacity of 10 to 18 MGD, assuming minimal pumping interferences between the wells. Depending upon property line and levee set-backs/easements, it may be possible to locate three collector wells on the Riverside County Park site, although there would likely be hydraulic interference between the wells, possibly reducing their individual yields. Similarly, it appears that two collector wells could be installed within the estimated property boundaries for the Ostrander Rock site downstream where T.H.2 was installed in 1977, and could also produce in the range of 10 to 18 MGD, assuming aquifer conditions at this site are at least as favorable as the aquifer conditions tested at Riverside County Park. A collector well at the FLWTP might be capable of 1 to 4 MGD, at most. At all of the sites, criteria such as levee easements and restrictions, property line set-backs and property owner (e.g. Riverside County Park) preferences will direct the final well location selections. SUMMARY/RECOMMENDATIONS The City of Longview is considering the feasibility of installing collector wells along the Cowlitz River to supplement and/or replace some or all of the capacity produced from the existing vertical wells at the Mint Farm Regional Water Treatment Plant. In order to determine if the existing hydrogeologic conditions are sufficient to develop a collector well in one or more areas along the Cowlitz River, Layne has recommended a phased drilling and testing program. The first phase, involving test borings and hydraulic interval testing, was recently completed. In this phase, three test borings were drilled using rotasonic methods at locations within the Riverside County Park (Site 1), along Solomon Road near West Side Highway (Site 2), and within the inactive Fishers Lane Water Treatment

12
Plant (Site 3). Hydraulic interval pumping tests were conducted at Sites 1 and 3. The three test borings conducted in the first phase of the investigation showed that the coarse-grained sand and gravel aquifer materials were present from just below the ground surface to depths of 48 to 58 feet, although the full depth of the borings was not water bearing. The alluvial deposits were underlain by layers comprised primarily of clay and/or silt, deposits which likely have very low permeability. The saturated thickness of the coarse-grained sand and gravel deposits at the test boring locations were 2.5 to 23 feet. The transmissivity results from the TH-1 site range from about 135,000 to 240,000 gpd/ft and the estimated hydraulic conductivity values vary from about 3,600 to 6,400 gpd/ft2. The transmissivity result from the TH-3a site is about 35,000 gpd/ft and the estimated hydraulic conductivity value is about 2,700 gpd/ft2. The limited saturated thickness values and/or relatively low hydraulic conductivity values limit the potential yield of production wells at Sites 2 and 3. Site 1 (Riverside County Park) is the most favorable location for ground water supply development based on the higher saturated thickness and transmissivity value at that location. Additionally, a test boring (T.H.2) made in 1977 on the Ostrander Rock Property near the test site along Solomon Road suggests favorable aquifer deposits may also exist at that location. The estimated yield of a collector well installed at the Riverside County Park under the conditions present during the initial testing phase is estimated to be between 5 to 9 MGD. If the City wishes to continue to investigate the feasibility of developing a water supply using collector well technology along the Cowlitz River, Layne recommends continuing with the phased testing approach, which would involve additional detailed aquifer testing. The transmissivity and hydraulic conductivity values from the short-term pumping tests conducted at TH-1 and TH-3a should be considered as very approximate values. Because the collector well yield estimates utilize these transmissivity and hydraulic conductivity values, they must also be considered very approximate. A longer term pumping test conducted with a higher pumping rate and with multiple observation wells is necessary to accurately determine the aquifer characteristics and allow for accurate estimates of collector well yields. Also, additional borings are required to evaluate the potential for variability in the aquifer properties. Layne recommends installing a larger temporary

13
production test well to be used for the detailed aquifer testing. To accurately determine the aquifer characteristics, we recommend installing up to three additional observation wells adjacent to the production test well and using the initial well TH-1 as an additional observation well. The detailed aquifer testing would then be conducted. It is also recommended that if the City wishes to continue to investigate the feasibility of installing a collector well on the Ostrander Rock Property, access rights should be pursued for the purposes of drilling an exploratory test boring and conducting a hydraulic interval test there to compare with the results from the drilling and testing of the boring in the Riverside County Park. If this initial testing phase suggests that aquifer conditions here are favorable, the City may elect to conduct the next phase of testing (detailed aquifer testing) at that location in lieu of or in addition to the Riverside County Park site.

FIGURES


File: 38941 TB-1 Interval Test Analysis.xlsx Print Date: 2/18/2016
0.0
0.2
0.4
0.6
0.8
1.0
1.2
1.4
1.6
1.81 10 100 1000
Obs
erve
d D
raw
dow
n (fe
et)
Elapsed Time From Start of Pumping (minutes)
FIGURE 3Boring TH-1 Hydraulic Interval Test Time Versus Drawdown Plot
CH2M Hill - City of Longview, Washington
30 gpm
50 gpm
121 gpm
76 gpm
File: 38941 TB-3A Interval Test Analysis.xlsx Print Date: 2/18/2016
0.0
1.0
2.0
3.0
4.0
5.0
6.0
7.0
8.0
9.01 10 100 1000
Obs
erve
d D
raw
dow
n (fe
et)
Elapsed Time From Start of Pumping (minutes)
FIGURE 4 Boring TH-3A Hydraulic Interval Test Time Versus Drawdown Plots
CH2M Hill - City of Longview, Washington
TH-3A TH-3
30 gpm
50 gpm
91 gpm
75 gpm

TABLES
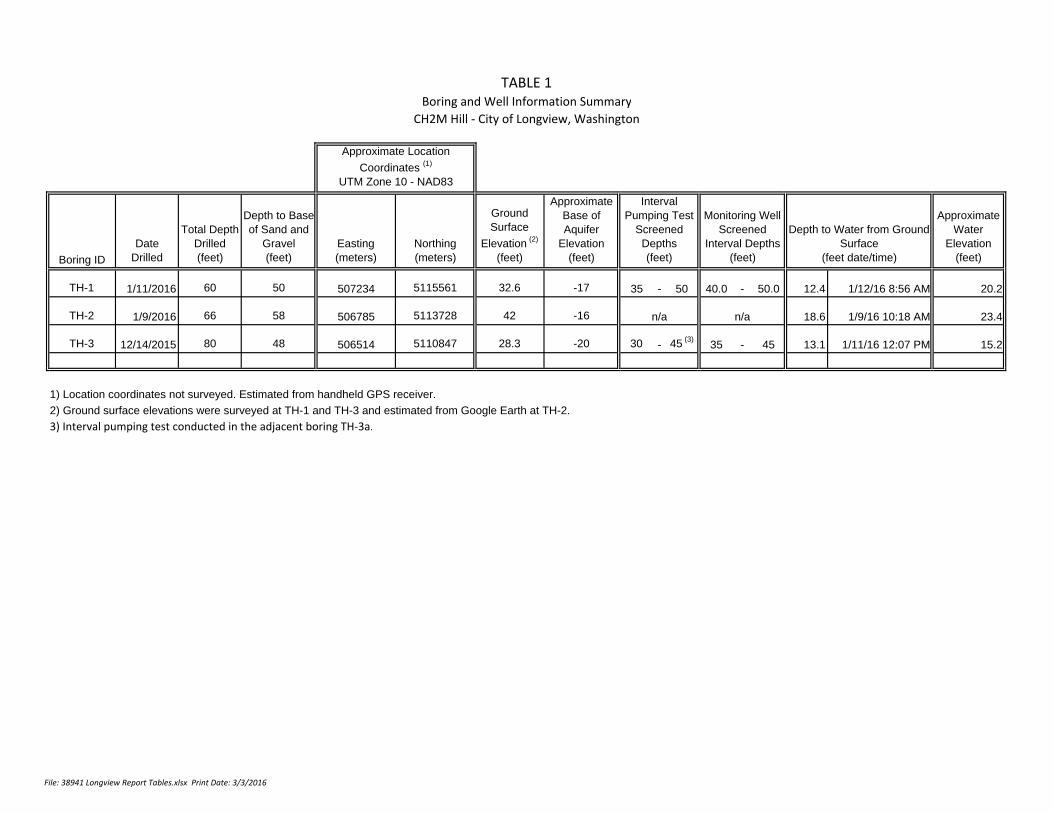
TABLE 1Boring and Well Information Summary
CH2M Hill ‐ City of Longview, Washington
Approximate Location
Coordinates (1)
UTM Zone 10 - NAD83
Boring ID
DateDrilled
Total Depth Drilled(feet)
Depth to Base of Sand and
Gravel(feet)
Easting(meters)
Northing(meters)
Ground Surface
Elevation (2)
(feet)
Approximate Base of Aquifer
Elevation(feet)
Interval Pumping Test
Screened Depths(feet)
Monitoring Well Screened
Interval Depths(feet)
Depth to Water from Ground Surface
(feet date/time)
Approximate Water
Elevation(feet)
TH-1 1/11/2016 60 50 507234 5115561 32.6 -17 35 - 50 40.0 - 50.0 12.4 1/12/16 8:56 AM 20.2
TH-2 1/9/2016 66 58 506785 5113728 42 -16 n/a n/a 18.6 1/9/16 10:18 AM 23.4
TH-3 12/14/2015 80 48 506514 5110847 28.3 -20 30 - 45 (3)35 - 45 13.1 1/11/16 12:07 PM 15.2
1) Location coordinates not surveyed. Estimated from handheld GPS receiver.
2) Ground surface elevations were surveyed at TH-1 and TH-3 and estimated from Google Earth at TH-2.
3) Interval pumping test conducted in the adjacent boring TH‐3a.
File: 38941 Longview Report Tables.xlsx Print Date: 3/3/2016

TABLE 2Grain Size Analysis Results
CH2M Hill - City of Longview, Washington
Effective Grain Size (1) Wentworth Size Fraction (3)
Test Hole ID
Depth Interval(feet)
Coefficient of
Uniformity (2)
(Cu)
D10
(inch)D40
(inch)D50
(inch)D60
(inch)D90
(inch)Gravel
(percent)Sand
(percent)Silt/Clay(percent)
TH-1 25 to 27 3.0 0.007 0.015 0.017 0.021 0.039 1.6% 96.7% 1.8%
30 to 35 46.4 0.013 0.119 0.4 Est. 0.6 Est. > 0.6 62.6% 36.1% 1.4%
40 to 45 35.5 0.020 0.171 0.371 0.7 Est. > 0.7 69.2% 29.6% 1.2%
45 to 50 33.1 0.014 0.132 0.274 0.5 Est. > 0.5 65.1% 33.0% 1.9%
TH-2 45 to 50 3.0 0.004 0.010 0.011 0.013 0.022 0.3% 95.6% 4.1%
50 to 55 3.4 0.004 0.011 0.012 0.014 0.027 0.4% 94.3% 5.3%
55.5 to 58 3.2 0.013 0.028 0.034 0.043 > 0.05 27.6% 70.1% 2.3%
TH-3 32.5 to 35 4.3 0.003 0.011 0.013 0.015 0.030 1.8% 91.3% 6.9%
35 to 40 28.2 0.010 0.029 0.053 0.290 > 0.29 48.0% 49.2% 2.8%
40 to 45 9.8 0.012 0.028 0.039 0.115 > 0.12 43.3% 54.7% 2.1%
45 to 48 9.8 0.012 0.045 0.067 0.122 > 0.13 46.3% 51.4% 2.4%
TH-3a 35 to 40 4.7 0.010 0.025 0.031 0.049 > 0.05 36.3% 61.7% 2.0%
40 to 45 4.1 0.010 0.023 0.029 0.042 > 0.05 32.1% 65.8% 2.1%
1) Effective grain size values represent diameter at percent passing fraction, e.g. D10 = grain diameter at 10% passing size.
Est. ‐ effective grain size estimated when the percent passing the 3/8‐inch sieve is less than the percent passing value
2) Coefficient of Uniformity = D60/D40. Estimated when percent passing the 3/8-inch sieve is <60%
3) Wentworth Grain Size Classification
Classification (millimeters) (approx. inches)
Fines Clay < 1/256 < 0.0002
Silt 1/256 ‐ 1/16 0.0002 ‐ 0.002
Sand Very Fine Sand 1/16 ‐ 1/8 0.002 ‐ 0.005
Fine Sand 1/8 ‐ 1/4 0.005 ‐ 0.01
Medium Sand 1/4 ‐ 1/2 0.01 ‐ 0.02
Coarse Sand 1/2 ‐ 1 0.02 ‐ 0.04
Very Coarse Sand 1 ‐ 2 0.04 ‐ 1/16
Gravel Granules 2 ‐ 4 1/16 ‐ 3/16
Fine Pebbles 4 ‐ 8 3/16 ‐ 5/16
Medium Pebbles 8 ‐ 16 5/16 ‐ 5/8
Coarse Pebbles 16 ‐ 32 5/8 ‐ 1‐1/4
Very Coarse Pebbles 32 ‐ 64 1‐1/4 ‐ 2‐1/2
Cobbles 64 ‐ 256 2‐1/2 ‐ 10
Boulders > 256 > 10
File: 38941 Longview Report Tables.xlsx Print Date: 2/18/2016

TABLE 3Hydraulic Interval Pumping Test Results
CH2M Hill - City of Longview, WashingtonWithout Partial Penetration
CorrectionWith Partial Penetration
Correction
BoringScreen
DiameterScreen
Slot Size
Screen Setting Depth Step
ObservedDrawdown at
End of Pumping Step
Pumping Rate at End
of Step
Observed Specific
Capacity at End of Step
Screen Length as Fraction of
Aquifer Thickness
Partial Penetration
Correction (1)
Estimated Well
Efficiency (2)
Saturated Aquifer
Thickness
Estimated Hydraulic
Conductivity (3)
Estimated
Transmissivity (4)
Estimated Hydraulic
Conductivity (3)
Estimated
Transmissivity (4)
(inches) (inches) (feet) (feet) (gpm) (gpm/ft) ( % ) (feet) (gpd/ft2) (gpd/ft) (gpd/ft2) (gpd/ft)
TH-1 6 0.020 35 - 50 1 0.35 30 85.7 0.40 0.57 94.4% 37.6 3,620 136,100 6,380 240,000
2 0.6 50 83.3 0.40 0.57 91.1% 37.6 3,650 137,300 6,430 242,000
3 0.96 76 79.2 0.40 0.57 87.0% 37.6 3,630 136,500 6,390 240,600
4 1.66 121 72.9 0.40 0.57 80.8% 37.6 3,600 135,300 6,340 238,500
TH-3A 6 0.020 30 - 45 1 1.96 30 15.3 1.00 1 85.0% 13.0 2,770 36,000
2 3.56 50 14.0 1.00 1 77.3% 13.0 2,790 36,300
3 6.23 75 12.0 1.00 1 69.4% 13.0 2,670 34,700
4 8.09 91 11.2 1.00 1 65.2% 13.0 2,650 34,500
1) Partial penetration correction:
(from Driscoll, 1986 based on Kozeny, 1933)
X = partial penetration correction; L = well screen length as a fraction of aquifer thickness; r = well radius; b = saturated aquifer thickness.
2) Well Efficiency estimated based on analysis using the methods of Bruin and Hudson, 1955
3) Hydraulic Conductivity = transmissivity divided by the saturated aquifer thickness, K=T/b
4) Transmissivity given by:
for an unconfined aquifer for a confined aquifer
(Driscoll, 1986)
T = aquifer transmissivity; Q = well pumping rate; s = observed drawdown; X = partial penetration correction; E = well efficiency
EXs
Q
T
1500
EXs
Q
T
2000
X Lr
b L
L
1 7
2 2cos
File: 38941 Longview Report Tables.xlsx Print Date: 2/18/2016 Page 1 of 1

TABLE 4Field Water Quality Summary
CH2M Hill - City of Longview, Washington
Sample Source Date Time
Temperature
(degees F)
Temperature
(degees C)
Specific
Conductance
(uS/cm)
pH
(S.U.)
Iron
(mg/l) Comments
TH‐1 01/12/16 10:00 AM 52.8 11.5 250 6.0 > 5 Step 1
10:31 AM 52.6 11.4 240 6.3 > 5 Step 2
11:01 AM 52.4 11.3 240 6.5 Step 3
11:35 AM 52.2 11.2 240 6.5 > 5 Step 4
TH‐3a 01/07/16 12:49 PM 50.4 10.2 240 During development
1:38 PM 50.2 10.1 220 During development
3:12 PM 50.9 10.5 230 > 5 Step 1
3:50 PM 50.4 10.2 240 6.4 Step 2
4:35 PM 50.7 10.4 230 6.2 Step 3
5:10 PM 50.4 10.2 230 6.4 Step 4
File: 38941 Longview Report Tables.xlsx Print Date: 2/18/2016 Page 1 of 1

TABLE 5TH-1 (Riverside County Park site) Sample Laboratory Water Quality Analysis Results
CH2M Hill - City of Longview, Washington
Analyte Analysis Method
Method
Reporting
Limit
Sample
Result
Duplicate
Result
Average of
Sample and
Duplicate
Results Unit
Ammonia as Nitrogen SM 4500‐NH3 G 0.05 0.366 0.373 0.37 mg/L
Nitrate as Nitrogen 300.0 0.10 ND ND NC mg/L
Nitrite as Nitrogen 300.0 0.10 ND ND NC mg/L
Hardness as CaCO3 200.7/SM 2340B 0.07 82.1 80.6 81.4 mg/L
Chloride 300.0 0.2 7.66 7.66 7.66 mg/L
Fluoride SM 4500‐F‐ C Modified 0.2 ND ND NC mg/L
Sulfate 300.0 0.2 ND ND NC mg/L
Cyanide, Total 335.4 0.01 ND ND NC mg/L
Turbidity 180.1 0.2 16.8 16.5 16.7 NTU
Carbon, Total Organic SM 5310 C 0.5 2.3 2.02 2.16 mg/L
UV254 SM 5910 B 0.119 0.120 0.12 cm‐1
Color SM 2120 B 5 35 35 35 Color Units
Solids, Total Dissolved SM 2540 C 10 143 144 144 mg/L
Conductivity at 25 Degrees Celsius SM 2510 B 2 218 218 218 uMHOS/cm
Oxidation‐Reduction Potential (ORP) ASTM D1498‐00 ‐79.7 ‐79.7 ‐79.7 mV
Oxygen, Dissolved SM 4500‐O G 1.0 1.2 1.0 1.09 mg/L
pH SM 4500‐H+ B 6.79 6.80 6.8 pH Units
Aluminum, Total 200.7 10 43.8 44.4 44.1 ug/L (ppb)
Antimony, Total 200.8 0.05 ND ND NC ug/L (ppb)
Arsenic, Total 200.8 0.5 ND ND NC ug/L (ppb)
Barium, Total 200.7 4 6.1 7.2 6.7 ug/L (ppb)
Beryllium, Total 200.8 0.02 ND ND NC ug/L (ppb)
Cadmium, Total 200.8 0.02 ND ND NC ug/L (ppb)
Calcium, Total 200.7 20 15900 15600 15800 ug/L (ppb)
Chromium, Total 200.8 0.2 ND ND NC ug/L (ppb)
Copper, Total 200.7 4 ND ND NC ug/L (ppb)
Iron, Total 200.7 20 11200 11000 11100 ug/L (ppb)
Lead, Total 200.8 0.02 0.12 0.11 0.11 ug/L (ppb)
Magnesium, Total 200.7 5 10300 10100 10200 ug/L (ppb)
Manganese, Total 200.7 1 293 289 291 ug/L (ppb)
Nickel, Total 200.8 0.2 0.8 0.6 0.7 ug/L (ppb)
Selenium, Total 200.8 1 ND ND NC ug/L (ppb)
Silicon, as SiO2, Total 200.7 500 58200 58250 58200 ug/L (ppb)
Silicon, as SiO2, Dissolved 200.7 500 56100 54500 55300 ug/L (ppb)
Silver, Total 200.8 0.02 ND ND NC ug/L (ppb)
Sodium, Total 200.7 200 10500 10700 10600 ug/L (ppb)
Thallium, Total 200.8 0.02 ND ND NC ug/L (ppb)
Zinc, Total 200.7 4 18.7 20.1 19.4 ug/L (ppb)
Mercury, Total 1631E 0.5 ND NC ng/L
Orthophosphate as Phosphorus SM 4500‐P E 0.05 0.327 0.327 0.327 mg/L
ND ‐ The contaminant was not detected at or above the stated detection limit.
NC ‐ Not calculated
File: 38941 Longview Report Tables.xlsx Print Date: 2/25/2016

TABLE 6TH-3a (FLWTP site) Sample Laboratory Water Quality Analysis Results
CH2M Hill - City of Longview, Washington
Analyte Analysis Method
Method
Reporting
Limit
Sample
Result
Duplicate
Result
Average of
Sample and
Duplicate
Results Unit
Ammonia as Nitrogen SM 4500‐NH3 G 0.05 0.314 0.297 0.305 mg/L
Nitrate as Nitrogen 300.0 0.10 ND ND NC mg/L
Nitrite as Nitrogen 300.0 0.10 ND ND NC mg/L
Hardness as CaCO3 200.7/SM 2340B 0.07 73.8 74.6 74.2 mg/L
Chloride 300.0 0.2 6.19 6.14 6.16 mg/L
Fluoride SM 4500‐F‐ C Modified 0.2 ND ND NC mg/L
Sulfate 300.0 0.2 6.52 6.42 6.47 mg/L
Cyanide 335.4 0.01 ND ND NC mg/L
Turbidity 180.1 0.2 5.11 5.06 5.09 NTU
Carbon, Total Organic SM 5310 C 0.5 1.8 1.68 1.74 mg/L
UV254 SM 5910 B 0.097 0.100 0.0985 cm‐1
Color SM 2120 B 5 20 20 20 Color Units
Solids, Total Dissolved SM 2540 C 10 181 mg/L
Conductivity at 25 Degrees Celsius SM 2510 B 2 243 242 243 uMHOS/cm
Oxidation‐Reduction Potential (ORP) D1498‐00 ‐30.25 ‐30.25 ‐30.3 mV
Oxygen, Dissolved SM 4500‐O G 1.0 2.3 mg/L
pH SM 4500‐H+ B 6.94 6.95 6.95 pH Units
Aluminum, Total 200.7 10 270 247 258 ug/L (ppb)
Antimony, Total 200.8 0.05 ND ND NC ug/L (ppb)
Arsenic, Total 200.8 0.5 ND ND NC ug/L (ppb)
Barium, Total 200.7 4 7 7 7 ug/L (ppb)
Beryllium, Total 200.8 0.02 ND ND NC ug/L (ppb)
Cadmium, Total 200.8 0.02 ND ND NC ug/L (ppb)
Calcium, Total 200.7 20 15700 15800 15800 ug/L (ppb)
Chromium, Total 200.8 0.2 0.4 0.3 0.4 ug/L (ppb)
Copper, Total 200.7 4 4 ND NC ug/L (ppb)
Iron, Total 200.7 20 12500 12600 12500 ug/L (ppb)
Lead, Total 200.8 0.02 0.81 0.73 0.77 ug/L (ppb)
Magnesium, Total 200.7 5 8410 8510 8460 ug/L (ppb)
Manganese, Total 200.7 1 637 644 641 ug/L (ppb)
Nickel, Total 200.8 0.2 1.1 1.1 1.1 ug/L (ppb)
Selenium, Total 200.8 1 ND ND NC ug/L (ppb)
Silicon, as SiO2, Total 200.7 500 48400 49300 48800 ug/L (ppb)
Silicon, as SiO2, Dissolved 200.7 500 46700 47400 47100 ug/L (ppb)
Silver, Total 200.8 0.02 ND ND NC ug/L (ppb)
Sodium, Total 200.7 200 10500 10600 10500 ug/L (ppb)
Thallium, Total 200.8 0.02 ND ND NC ug/L (ppb)
Zinc, Total 200.7 4 41.5 41.1 41.3 ug/L (ppb)
Mercury, Total 1631E 0.5 0.5 NC ng/L
Orthophosphate as Phosphorus SM 4500‐P E 0.05 0.2 0.197 0.198 mg/L
ND ‐ The contaminant was not detected at or above the stated detection limit.
NC ‐ Not calculated
File: 38941 Longview Report Tables.xlsx Print Date: 2/29/2016

TABLE 7Cowlitz River Sample Laboratory Water Quality Analysis Results
CH2M Hill - City of Longview, Washington
Minimum Detection
LimitsMCL or SMCL
Drinking Water Standard
River Water Sample Results
Constituent Units 1/12/16 3:19 PMAluminum mg/l 0.1 0.2 EPA Secondary 0.3Arsenic mg/l 0.005 0.01 EPA Primary NDBarium mg/l 0.3 2.0 EPA Primary NDCadmium mg/l 0.002 0.005 EPA Primary NDCalcium mg/l 2.0 -- 7.1Chromium mg/l 0.01 0.1 EPA Primary NDCopper mg/l 0.004 1.3 EPA Action Level NDIron mg/l 0.02 0.3 EPA Secondary 0.434Lead mg/l 0.002 0.015 EPA Action Level NDLithium mg/l 0.001 -- 0.001Magnesium mg/l 0.10 -- 1.65Manganese mg/l 0.004 0.05 EPA Secondary 0.051Mercury mg/l 0.001 0.002 EPA Primary NDNickel mg/l 0.02 -- NDPotassium mg/l 1.0 -- NDSelenium mg/l 0.02 0.05 EPA Primary NDSilica mg/l 0.1 -- 18.0Silver mg/l 0.002 0.1 EPA Secondary NDSodium mg/l 1 -- 4Strontium 0.001 -- 0.029Uranium 0.001 0.03 EPA Primary NDZinc mg/l 0.004 5 EPA Secondary NDAlkalinity (Total as CaCO3) mg/l 20 -- 28Hardness mg/l 10 24pH S.U. 6.5 to 8.5 EPA Secondary 7.4Total Dissolved Solids mg/l 20 500 EPA Secondary 53Bromide 0.5 -- NDChloride mg/l 5 250 EPA Secondary NDFluoride mg/l 0.5 4 EPA Primary NDNitrate as N mg/l 0.5 10 EPA Primary NDNitrite as N mg/l 0.5 1 EPA Primary NDOrtho Phosphate mg/l 2.0 -- NDSulfate mg/l 5 250 EPA Secondary 5.1
Trihalomethanes, VOCsand Other Organic CompoundsSee Laboratory Reports for list of parameters analyzed. All ND
ND - The contaminant was not detected at or above the stated detection limit.MCL - Maximum contaminant level, SMCL - Secondary maximum contaminant level
File: 38941 Longview Report Tables.xlsx Print Date: 2/29/2016 Page 1 of 1

ATTACHMENT 1 BORING LOGS

FIELD BOREHOLE LOGBOREHOLE NO.:TOTAL DEPTH:
CLIENT:SITE LOCATION:
JOB NO.:
GEOLOGIST:DATE DRILLED:
DRILLER:COORDINATES:
METHOD OF DRILLING:
NOTES:
DEPTH LITHOLOGY
BORING DIAMETER:
Page 1 of 2
0
5
10
15
20
25
30
RECOVERY WELLCONSTRUCTION
WELLDESCRIPTION
RANNEY COLLECTOR WELLS6360 HUNTLEY ROAD
COLUMBUS, OHIO 43229614-888-6263
TOP OF CASING ELEVATION:GRADE ELEVATION:
(feet)
Colors used in the graphic logs are solely to aid in distinguishing the graphic patterns.
City of Longview, Washington - CH2M Hill 38941
Brad Gamble, Layne
1/11/2016
Zane Huckins, Cascade
Rotasonic
Coordinates Not Surveyed, approximately determined with handheld GPS receiver.
TH-160 feet
N 5,115,561 m E 507,234 m
8 inches
Sand, brownish gray, very fine to mediumsand, mostly fine, trace silt, loose, moist.
Sand to Sand and Gravel, dark gray, 70-90%very fine to very coarse sand, mostly coarse,10-30% granules and pebbles up to 2 inches,subrounded to rounded, loose, moist, 2 inchlayer of brown fine sand and silt at 10 feet.
Sand, dark gray, very fine to very coarsesand, mostly coarse, loose, moist.
Sand and Gravel, dark gray, 40-60% very fineto very coarse sand, mostly coarse, 40-60%granules, pebbles and cobbles up to 3 inches, subrounded to rounded, trace silt, loose, wet.
0 to 5 feet,5 feetrecovery
5 to 10 feet,5 feetrecovery
10 to 15 feet,4 feetrecovery
15 to 20 feet,2 feetrecovery
20 to 25 feet,0 feetrecovery
25 to 30 feet,5 feetrecovery
30 to 35 feet,3 feetrecovery
8" borehole
Bentonite seal placedin annulus
2" PVC Casing,threaded joints
North Lexington siteRiverside County Park
32.6 Feet
Water level 12.4 feet below ground surface at 08:56 on 01/12/16.
UTM Zone 10 NAD83

Page 2 of 2
35
40
45
50
55
60
TOTAL DEPTH:BOREHOLE NO.:FIELD BOREHOLE LOG
WELLDESCRIPTIONCONSTRUCTION
WELLRECOVERYLITHOLOGYDEPTH
RANNEY COLLECTOR WELLS6360 HUNTLEY ROAD
COLUMBUS, OHIO 43229614-888-6263
(feet)
Colors used in the graphic logs are solely to aid in distinguishing the graphic patterns.
Sand and Gravel, dark gray, 30-50% very fineto very coarse sand, mostly coarse, 50-70%granules, pebbles and numerous cobbles upto 4 inches, subrounded to rounded, trace silt,loose, wet.
Clay, gray, very soft, wet.
Silty Sand to Sandy Silt, gray, very fine to finesand and silt, trace clay, soft, wet.
Silty Clay, dark gray, soft to firm, wet, withpeaty material.
35 to 40 feet,0 feetrecovery
40 to 45 feet,5 feetrecovery
45 to 50 feet,5 feetrecovery
50 to 55 feet,5 feetrecovery
55 to 60 feet,5 feetrecovery
Sand pack set at 37-50 feet
2" PVC screen,0.010-inch slot set at40-50 feet
TH-160 feet

FIELD BOREHOLE LOGBOREHOLE NO.:TOTAL DEPTH:
CLIENT:SITE LOCATION:
JOB NO.:
GEOLOGIST:DATE DRILLED:
DRILLER:COORDINATES:
METHOD OF DRILLING:
NOTES:
DEPTH LITHOLOGY
BORING DIAMETER:
Page 1 of 2
0
5
10
15
20
25
30
RECOVERY WELLCONSTRUCTION
WELLDESCRIPTION
RANNEY COLLECTOR WELLS6360 HUNTLEY ROAD
COLUMBUS, OHIO 43229614-888-6263
TOP OF CASING ELEVATION:GRADE ELEVATION:
(feet)
Colors used in the graphic logs are solely to aid in distinguishing the graphic patterns.
City of Longview, Washington - CH2M Hill 38941
Brad Gamble, Layne
1/9/2016
Zane Huckins, Cascade
Rotasonic
Coordinates and Elevations Not Surveyed, approximately determined with handheld GPS receiver.
TH-266 feet
N 5,113,728 m E 506,785 m
8 inches
Sand and Gravel, dark gray, 60-80% very fineto very coarse sand, mostly coarse, 20-40%granules, pebbles and cobbles up to 4 inches, trace silt, loose, moist, cemented zone at 4 to 5 feet and partially cemented zone at 12 feet.
Sand and Gravel, dark gray, 40-60% very fineto very coarse sand, mostly coarse, 40-60%granules, pebbles and numerous cobbles upto 4 inches, trace silt, loose, moist.
Sand, dark gray, very fine to coarse sand,mostly coarse, trace granules and pebbles,trace silt, loose, moist.
Clayey Silt, dark gray to black, very soft,moist, with roots and plant matter.
Silty Sand, dark gray, mostly very fine to finesand with silt, trace clay, very soft, wet.
Silty Sand to Sandy Silt, dark gray and brown, very fine to fine sand with silt, trace clay, softto very soft, wet, fragments of decayed wood.
0 to 5 feet,5 feetrecovery
5 to 10 feet,5 feetrecovery
10 to 15 feet,3 feetrecovery
15 to 20 feet,5 feetrecovery
20 to 25 feet,4 feetrecovery
25 to 30 feet,5 feetrecovery
30 to 35 feet,4 feetrecovery
Borehole abandonedwith bentonite chipsafter drilling.
South Lexington siteNear the end of Solomon Road
42 Feet, estimated
Water level 18.6 feet below ground surface at 10:18 on 01/09/16.
UTM Zone 10 NAD83

Page 2 of 2
35
40
45
50
55
60
65
TOTAL DEPTH:BOREHOLE NO.:FIELD BOREHOLE LOG
WELLDESCRIPTIONCONSTRUCTION
WELLRECOVERYLITHOLOGYDEPTH
RANNEY COLLECTOR WELLS6360 HUNTLEY ROAD
COLUMBUS, OHIO 43229614-888-6263
(feet)
Colors used in the graphic logs are solely to aid in distinguishing the graphic patterns.
Silty Sand, gray, very fine to very mediumsand, mostly medium, trace to 15% silt, soft,wet.
Sand, dark gray, very fine to coarse sand,mostly medium, trace silt, loose, wet,fragments of decayed wood from 44 to 45feet.
Clay and Cobbles, dark gray, cobbles up to 4inches in silty clay matrix, dense, wet.
Sand and Gravel, dark gray 50-70% very fineto very coarse sand, mostly coarse, 30-50%granules and pebbles up to 2-1/2 inches,loose, wet.
Clayey Silt, gray and brown, mostly silt withclay, abundant decayed wood and peatymaterial, soft to firm, moist.
Silty Sand, dark gray, very fine to fine sand,mostly fine, trace to 10% silt, soft, wet.
Clayey Silt, same as from 58 to 63 feet.
35 to 40 feet,3 feetrecovery
40 to 45 feet,5 feetrecovery
45 to 51 feet,5 feetrecovery
51 to 56 feet,5 feetrecovery
56 to 61 feet,5 feetrecovery
61 to 66 feet,5 feetrecovery
TH-266 feet

FIELD BOREHOLE LOGBOREHOLE NO.:TOTAL DEPTH:
CLIENT:SITE LOCATION:
JOB NO.:
GEOLOGIST:DATE DRILLED:
DRILLER:COORDINATES:
METHOD OF DRILLING:
NOTES:
DEPTH LITHOLOGY
BORING DIAMETER:
Page 1 of 3
0
5
10
15
20
25
30
RECOVERY WELLCONSTRUCTION
WELLDESCRIPTION
RANNEY COLLECTOR WELLS6360 HUNTLEY ROAD
COLUMBUS, OHIO 43229614-888-6263
TOP OF CASING ELEVATION:GRADE ELEVATION:
(feet)
Colors used in the graphic logs are solely to aid in distinguishing the graphic patterns.
City of Longview, Washington - CH2M Hill 38941
Brad Gamble, Layne
12/14/2015
Zane Shadrick, Cascade
Rotasonic
Coordinates Not Surveyed, approximately determined with handheld GPS receiver.
TH-380 feet
N 5,110,847 m E 506,514 m
6 inches
Fill, dark gray, crushed stone and/or slag, 2 to4 inch material, loose, moist.
Sand, gray, very fine to medium sand, mostlyfine, loose, moist.
Sand, brown, very fine to coarse sand, mostlymedium, trace silt, loose, moist.
Sand and Gravel, dark gray, 70-90% very fineto very coarse sand, mostly coarse, 10-30%granules and pebbles up to 1 inch, loose,moist.
Silty Sand, brown becoming dark gray atabout 14 feet, very fine to coarse sand, mostly medium, trace to 10% silt, slightly cohesive,wet.
Silty Clay, gray, mostly clay with silt, tracevery fine sand, very soft, wet.
Silty Sand to Sandy Silt, gray, silt with veryfine to fine sand, trace clay, slightly cohesive,wet.
Silty Sand, gray, very fine to very mediumsand, mostly fine, trace to 10% silt, slightlycohesive, wet.
Silty Sand, gray, very fine to very coarsesand, mostly medium, trace silt, loose, wet.
0 to 5 feet,5 feetrecovery
5 to 10 feet,4 feetrecovery
10 to 15 feet,4.5 feetrecovery
15 to 20 feet,5 feetrecovery
20 to 25 feet,5 feetrecovery
25 to 35 feet,8 feetrecovery
6" borehole
Bentonite seal placedin annulus
2" PVC Casing,threaded joints
Longview, WAOn north side of Fishers Lane Water Treatment Plant
28.28 Feet
Water level 8.6 feet below ground surface at 14:42 on 12/15/15.
UTM Zone 10 NAD83

Page 2 of 3
35
40
45
50
55
60
65
70
75
TOTAL DEPTH:BOREHOLE NO.:FIELD BOREHOLE LOG
WELLDESCRIPTIONCONSTRUCTION
WELLRECOVERYLITHOLOGYDEPTH
RANNEY COLLECTOR WELLS6360 HUNTLEY ROAD
COLUMBUS, OHIO 43229614-888-6263
(feet)
Colors used in the graphic logs are solely to aid in distinguishing the graphic patterns.
Sand and Gravel, gray 50-70% very fine tovery coarse sand, mostly coarse, 30-50%granules and pebbles up to 2 inches andoccasional cobble up to 4 inches, subangularto rounded, loose, wet.
Silty Clay, brown, firm, moist, with fragmentsof decayed wood.
Clayey Silt with Decayed Wood, dark brown,soft to very soft, moist.
Clayey Silt, gray, mostly silt with clay, tracevery fine to fine sand, soft, wet, traces ofdecayed wood, occasional 2 to 4 inch layersthat are mostly sand.
35 to 45 feet,10 feetrecovery
45 to 55 feet,10 feetrecovery
55 to 60 feet,5 feetrecovery
60 to 65 feet,5 feetrecovery
65 to 80 feet,6 feetrecovery
Sand pack set at 33.5-46 feet
2" PVC screen,0.010-inch slot set at35-45 feet
TH-380 feet

Page 3 of 3
80
TOTAL DEPTH:BOREHOLE NO.:FIELD BOREHOLE LOG
WELLDESCRIPTIONCONSTRUCTION
WELLRECOVERYLITHOLOGYDEPTH
RANNEY COLLECTOR WELLS6360 HUNTLEY ROAD
COLUMBUS, OHIO 43229614-888-6263
(feet)
Colors used in the graphic logs are solely to aid in distinguishing the graphic patterns.
TH-380 feet

ATTACHMENT 2 SIEVE ANALYSIS RESULTS

GRAIN SIZE ANALYSISLayne - Ranney Collector Wells
Project: City of Longview, WashingtonTest Boring: TH-1
Job Number: 38941
0%
10%
20%
30%
40%
50%
60%
70%
80%
90%
100% 0%
10%
20%
30%
40%
50%
60%
70%
80%
90%
100%
0.0010.010.11101001000
Per
cent
Ret
aine
d (%
)
Per
cent
Pas
sing
(%
)
Grain Size (mm)
TH-1 25 to 27 feet TH-1 30 to 35 feet
TH-1 40 to 45 feet TH-1 45 to 50 feet
File: 38941 Sieve Analyses Chart TH1.xlsx Print Date: 2/9/2016 Page 1 of 1

SIEVE ANALYSIS RESULTS
Client: City of Longview, WashingtonJob No. 38941
Boring ID: TH-1Depth Interval: 25 to 27 feet
Sieve Size or Sieve No.
Sieve Size (mm)
Sieve Size (inches)
Weight Retained (grams)
Cumulative Weight (grams)
Cumulative% Retained
Cumulative % Passing
3/8 9.525 0.375 2 2 0.1% 99.9%4 4.760 0.187 4 6 0.4% 99.6%6 3.353 0.132 4 10 0.7% 99.3%8 2.360 0.094 7 17 1.3% 98.7%10 1.999 0.079 4 21 1.6% 98.4%16 1.191 0.047 54 75 5.5% 94.5%20 0.841 0.033 120 195 14.4% 85.6%40 0.419 0.017 520 715 52.9% 47.1%60 0.249 0.010 390 1105 81.7% 18.3%100 0.150 0.006 160 1265 93.6% 6.4%200 0.074 0.003 63 1328 98.2% 1.8%Pan 24 1352 100.0% 0.0%
Total 1352Initial Weight 1361 Gravel Sand Silt or Clay
Difference 0.7% 1.6% 96.7% 1.8%
D10 D40 D50 D60 D90 Cu
(mm) 0.17 0.37 0.44 0.53 1.00 3.03(inches) 0.007 0.015 0.017 0.021 0.039
Boring ID: TH-1Depth Interval: 30 to 35 feet
Sieve Size or Sieve No.
Sieve Size (mm)
Sieve Size (inches)
Weight Retained (grams)
Cumulative Weight (grams)
Cumulative% Retained
Cumulative % Passing
3/8 9.525 0.375 1055 1055 51.4% 48.6%4 4.760 0.187 126 1181 57.6% 42.4%6 3.353 0.132 39 1220 59.5% 40.5%8 2.360 0.094 37 1257 61.3% 38.7%10 1.999 0.079 27 1284 62.6% 37.4%16 1.191 0.047 70 1354 66.0% 34.0%20 0.841 0.033 79 1433 69.8% 30.2%40 0.419 0.017 316 1749 85.2% 14.8%60 0.249 0.010 197 1946 94.8% 5.2%100 0.150 0.006 52 1998 97.4% 2.6%200 0.074 0.003 26 2024 98.6% 1.4%Pan 28 2052 100.0% 0.0%
Total 2052Initial Weight 2060 Gravel Sand Silt or Clay
Difference 0.4% 62.6% 36.1% 1.4%
D10 D40 D50 D60 D90 Cu
(mm) 0.32 3.01 10 15 46(inches) 0.013 0.119 0.40 0.6
941 Sieve Analyses Chart TH1.xlsx Print Date: 2/10/2016 Page 1 of 2
SIEVE ANALYSIS RESULTS
Client: City of Longview, WashingtonJob No. 38941
Boring ID: TH-1Depth Interval: 40 to 45 feet
Sieve Size or Sieve No.
Sieve Size (mm)
Sieve Size (inches)
Weight Retained (grams)
Cumulative Weight (grams)
Cumulative% Retained
Cumulative % Passing
3/8 9.525 0.375 1046 1046 49.9% 50.1%4 4.760 0.187 192 1238 59.0% 41.0%6 3.353 0.132 80 1318 62.8% 37.2%8 2.360 0.094 86 1404 66.9% 33.1%10 1.999 0.079 48 1452 69.2% 30.8%16 1.191 0.047 147 1599 76.2% 23.8%20 0.841 0.033 122 1721 82.0% 18.0%40 0.419 0.017 230 1951 93.0% 7.0%60 0.249 0.010 67 2018 96.2% 3.8%100 0.150 0.006 30 2048 97.6% 2.4%200 0.074 0.003 24 2072 98.8% 1.2%Pan 26 2098 100.0% 0.0%
Total 2098Initial Weight 2105 Gravel Sand Silt or Clay
Difference 0.3% 69.2% 29.6% 1.2%
D10 D40 D50 D60 D90 Cu
(mm) 0.51 4.35 9.42 18 36(inches) 0.020 0.171 0.371 0.7
Boring ID: TH-1Depth Interval: 45 to 50 feet
Sieve Size or Sieve No.
Sieve Size (mm)
Sieve Size (inches)
Weight Retained (grams)
Cumulative Weight (grams)
Cumulative% Retained
Cumulative % Passing
3/8 9.525 0.375 834 834 44.9% 55.1%4 4.760 0.187 210 1044 56.2% 43.8%6 3.353 0.132 71 1115 60.0% 40.0%8 2.360 0.094 65 1180 63.5% 36.5%10 1.999 0.079 30 1210 65.1% 34.9%16 1.191 0.047 118 1328 71.5% 28.5%20 0.841 0.033 106 1434 77.2% 22.8%40 0.419 0.017 211 1645 88.5% 11.5%60 0.249 0.010 97 1742 93.8% 6.2%100 0.150 0.006 47 1789 96.3% 3.7%200 0.074 0.003 34 1823 98.1% 1.9%Pan 35 1858 100.0% 0.0%
Total 1858Initial Weight 1868 Gravel Sand Silt or Clay
Difference 0.5% 65.1% 33.0% 1.9%
D10 D40 D50 D60 D90 Cu
(mm) 0.36 3.36 6.96 12 33(inches) 0.014 0.132 0.274 0.5
941 Sieve Analyses Chart TH1.xlsx Print Date: 2/10/2016 Page 2 of 2

GRAIN SIZE ANALYSISLayne - Ranney Collector Wells
Project: City of Longview, WashingtonTest Boring: TH-2
Job Number: 38941
0%
10%
20%
30%
40%
50%
60%
70%
80%
90%
100% 0%
10%
20%
30%
40%
50%
60%
70%
80%
90%
100%
0.0010.010.11101001000
Per
cent
Ret
aine
d (%
)
Per
cent
Pas
sing
(%
)
Grain Size (mm)
TH-2 45 to 50 feet TH-2 50 to 55 feet
TH-2 55.5 to 58 feet
File: 38941 Sieve Analyses Chart TH2.xlsx Print Date: 2/10/2016 Page 1 of 1

SIEVE ANALYSIS RESULTS
Client: City of Longview, WashingtonJob No. 38941
Boring ID: TH-2Depth Interval: 45 to 50 feet
Sieve Size or Sieve No.
Sieve Size (mm)
Sieve Size (inches)
Weight Retained (grams)
Cumulative Weight (grams)
Cumulative% Retained
Cumulative % Passing
3/8 9.525 0.375 0 0 0.0% 100.0%4 4.760 0.187 0 0 0.0% 100.0%6 3.353 0.132 0 0 0.0% 100.0%8 2.360 0.094 2 2 0.2% 99.8%10 1.999 0.079 1 3 0.3% 99.7%16 1.191 0.047 2 5 0.4% 99.6%20 0.841 0.033 3 8 0.7% 99.3%40 0.419 0.017 191 199 17.1% 82.9%60 0.249 0.010 515 714 61.4% 38.6%100 0.150 0.006 263 977 84.1% 15.9%200 0.074 0.003 137 1114 95.9% 4.1%Pan 48 1162 100.0% 0.0%
Total 1162Initial Weight 1168 Gravel Sand Silt or Clay
Difference 0.5% 0.3% 95.6% 4.1%
D10 D40 D50 D60 D90 Cu
(mm) 0.11 0.25 0.28 0.32 0.57 3.04(inches) 0.004 0.010 0.011 0.013 0.022
Boring ID: TH-2Depth Interval: 50 to 55 feet
Sieve Size or Sieve No.
Sieve Size (mm)
Sieve Size (inches)
Weight Retained (grams)
Cumulative Weight (grams)
Cumulative% Retained
Cumulative % Passing
3/8 9.525 0.375 0 0 0.0% 100.0%4 4.760 0.187 0 0 0.0% 100.0%6 3.353 0.132 1 1 0.1% 99.9%8 2.360 0.094 2 3 0.2% 99.8%10 1.999 0.079 2 5 0.4% 99.6%16 1.191 0.047 14 19 1.5% 98.5%20 0.841 0.033 19 38 3.0% 97.0%40 0.419 0.017 329 367 29.2% 70.8%60 0.249 0.010 481 848 67.4% 32.6%100 0.150 0.006 229 1077 85.6% 14.4%200 0.074 0.003 114 1191 94.7% 5.3%Pan 67 1258 100.0% 0.0%
Total 1258Initial Weight 1263 Gravel Sand Silt or Clay
Difference 0.4% 0.4% 94.3% 5.3%
D10 D40 D50 D60 D90 Cu
(mm) 0.11 0.28 0.32 0.36 0.70 3.39(inches) 0.004 0.011 0.012 0.014 0.027
941 Sieve Analyses Chart TH2.xlsx Print Date: 2/10/2016 Page 1 of 2

SIEVE ANALYSIS RESULTS
Client: City of Longview, WashingtonJob No. 38941
Boring ID: TH-2Depth Interval: 55.5 to 58 feet
Sieve Size or Sieve No.
Sieve Size (mm)
Sieve Size (inches)
Weight Retained (grams)
Cumulative Weight (grams)
Cumulative% Retained
Cumulative % Passing
3/8 9.525 0.375 205 205 13.6% 86.4%4 4.760 0.187 107 312 20.7% 79.3%6 3.353 0.132 40 352 23.4% 76.6%8 2.360 0.094 42 394 26.2% 73.8%10 1.999 0.079 21 415 27.6% 72.4%16 1.191 0.047 125 540 35.9% 64.1%20 0.841 0.033 235 775 51.5% 48.5%40 0.419 0.017 541 1316 87.5% 12.5%60 0.249 0.010 88 1404 93.4% 6.6%100 0.150 0.006 37 1441 95.8% 4.2%200 0.074 0.003 29 1470 97.7% 2.3%Pan 34 1504 100.0% 0.0%
Total 1504Initial Weight 1504 Gravel Sand Silt or Clay
Difference 0.0% 27.6% 70.1% 2.3%
D10 D40 D50 D60 D90 Cu
(mm) 0.34 0.71 0.87 1.09 > 2 3.24(inches) 0.013 0.028 0.034 0.043 > 0.05
941 Sieve Analyses Chart TH2.xlsx Print Date: 2/10/2016 Page 2 of 2

GRAIN SIZE ANALYSISLayne - Ranney Collector Wells
Project: City of Longview, WashingtonTest Boring: TH-3
Job Number: 38941
0%
10%
20%
30%
40%
50%
60%
70%
80%
90%
100% 0%
10%
20%
30%
40%
50%
60%
70%
80%
90%
100%
0.0010.010.11101001000
Per
cent
Ret
aine
d (%
)
Per
cent
Pas
sing
(%
)
Grain Size (mm)
TH-3 32.5 to 35 feet TH-3 35 to 40 feet
TH-3 40 to 45 feet TH-3 45 to 48 feet
File: 38941 Sieve Analyses Chart TH3.xlsx Print Date: 2/10/2016 Page 1 of 1

SIEVE ANALYSIS RESULTS
Client: City of Longview, WashingtonJob No. 38941
Boring ID: TH-3Depth Interval: 32.5 to 35 feet
Sieve Size or Sieve No.
Sieve Size (mm)
Sieve Size (inches)
Weight Retained (grams)
Cumulative Weight (grams)
Cumulative% Retained
Cumulative % Passing
3/8 9.525 0.375 0 0 0.0% 100.0%4 4.760 0.187 4 4 0.4% 99.6%6 3.353 0.132 3 7 0.7% 99.3%8 2.360 0.094 7 14 1.4% 98.6%10 1.999 0.079 4 18 1.8% 98.2%16 1.191 0.047 18 36 3.6% 96.4%20 0.841 0.033 31 67 6.6% 93.4%40 0.419 0.017 280 347 34.3% 65.7%60 0.249 0.010 300 647 63.9% 36.1%100 0.150 0.006 164 811 80.1% 19.9%200 0.074 0.003 131 942 93.1% 6.9%Pan 70 1012 100.0% 0.0%
Total 1012Initial Weight 1013 Gravel Sand Silt or Clay
Difference 0.1% 1.8% 91.3% 6.9%
D10 D40 D50 D60 D90 Cu
(mm) 0.09 0.27 0.32 0.38 0.77 4.33(inches) 0.003 0.011 0.013 0.015 0.030
Boring ID: TH-3Depth Interval: 35 to 40 feet
Sieve Size or Sieve No.
Sieve Size (mm)
Sieve Size (inches)
Weight Retained (grams)
Cumulative Weight (grams)
Cumulative% Retained
Cumulative % Passing
3/8 9.525 0.375 640 640 37.5% 62.5%4 4.760 0.187 115 755 44.2% 55.8%6 3.353 0.132 33 788 46.2% 53.8%8 2.360 0.094 23 811 47.5% 52.5%10 1.999 0.079 9 820 48.0% 52.0%16 1.191 0.047 44 864 50.6% 49.4%20 0.841 0.033 76 940 55.1% 44.9%40 0.419 0.017 430 1370 80.3% 19.7%60 0.249 0.010 183 1553 91.0% 9.0%100 0.150 0.006 61 1614 94.6% 5.4%200 0.074 0.003 46 1660 97.2% 2.8%Pan 47 1707 100.0% 0.0%
Total 1707Initial Weight 1708 Gravel Sand Silt or Clay
Difference 0.1% 48.0% 49.2% 2.8%
D10 D40 D50 D60 D90 Cu
(mm) 0.26 0.73 1.35 7.36 > 8 28.18(inches) 0.010 0.029 0.053 0.290 > 0.29
941 Sieve Analyses Chart TH3.xlsx Print Date: 2/10/2016 Page 1 of 2

SIEVE ANALYSIS RESULTS
Client: City of Longview, WashingtonJob No. 38941
Boring ID: TH-3Depth Interval: 40 to 45 feet
Sieve Size or Sieve No.
Sieve Size (mm)
Sieve Size (inches)
Weight Retained (grams)
Cumulative Weight (grams)
Cumulative% Retained
Cumulative % Passing
3/8 9.525 0.375 450 450 26.4% 73.6%4 4.760 0.187 150 600 35.2% 64.8%6 3.353 0.132 60 660 38.8% 61.2%8 2.360 0.094 55 715 42.0% 58.0%10 1.999 0.079 22 737 43.3% 56.7%16 1.191 0.047 76 813 47.7% 52.3%20 0.841 0.033 77 890 52.3% 47.7%40 0.419 0.017 534 1424 83.6% 16.4%60 0.249 0.010 170 1594 93.6% 6.4%100 0.150 0.006 44 1638 96.2% 3.8%200 0.074 0.003 30 1668 97.9% 2.1%Pan 35 1703 100.0% 0.0%
Total 1703Initial Weight 1703 Gravel Sand Silt or Clay
Difference 0.0% 43.3% 54.7% 2.1%
D10 D40 D50 D60 D90 Cu
(mm) 0.30 0.71 1.00 2.93 > 3 9.75(inches) 0.012 0.028 0.039 0.115 > 0.12
Boring ID: TH-3Depth Interval: 45 to 48 feet
Sieve Size or Sieve No.
Sieve Size (mm)
Sieve Size (inches)
Weight Retained (grams)
Cumulative Weight (grams)
Cumulative% Retained
Cumulative % Passing
3/8 9.525 0.375 403 403 23.2% 76.8%4 4.760 0.187 198 601 34.5% 65.5%6 3.353 0.132 76 677 38.9% 61.1%8 2.360 0.094 85 762 43.8% 56.2%10 1.999 0.079 43 805 46.3% 53.7%16 1.191 0.047 215 1020 58.6% 41.4%20 0.841 0.033 178 1198 68.9% 31.1%40 0.419 0.017 307 1505 86.5% 13.5%60 0.249 0.010 112 1617 92.9% 7.1%100 0.150 0.006 44 1661 95.5% 4.5%200 0.074 0.003 38 1699 97.6% 2.4%Pan 41 1740 100.0% 0.0%
Total 1740Initial Weight 1746 Gravel Sand Silt or Clay
Difference 0.3% 46.3% 51.4% 2.4%
D10 D40 D50 D60 D90 Cu
(mm) 0.32 1.14 1.71 3.10 > 4 9.82(inches) 0.012 0.045 0.067 0.122 > 0.13
941 Sieve Analyses Chart TH3.xlsx Print Date: 2/10/2016 Page 2 of 2

GRAIN SIZE ANALYSISLayne - Ranney Collector Wells
Project: City of Longview, WashingtonTest Boring: TH-3a
Job Number: 38941
0%
10%
20%
30%
40%
50%
60%
70%
80%
90%
100% 0%
10%
20%
30%
40%
50%
60%
70%
80%
90%
100%
0.0010.010.11101001000
Per
cent
Ret
aine
d (%
)
Per
cent
Pas
sing
(%
)
Grain Size (mm)
TH-3a 35 to 40 feet TH-3a 40 to 45 feet
File: 38941 Sieve Analyses Chart TH3a.xlsx Print Date: 2/10/2016 Page 1 of 1

SIEVE ANALYSIS RESULTS
Client: City of Longview, WashingtonJob No. 38941
Boring ID: TH-3aDepth Interval: 35 to 40 feet
Sieve Size or Sieve No.
Sieve Size (mm)
Sieve Size (inches)
Weight Retained (grams)
Cumulative Weight (grams)
Cumulative% Retained
Cumulative % Passing
3/8 9.525 0.375 445 445 27.3% 72.7%4 4.760 0.187 78 523 32.1% 67.9%6 3.353 0.132 31 554 34.0% 66.0%8 2.360 0.094 25 579 35.6% 64.4%10 1.999 0.079 12 591 36.3% 63.7%16 1.191 0.047 65 656 40.3% 59.7%20 0.841 0.033 102 758 46.6% 53.4%40 0.419 0.017 549 1307 80.3% 19.7%60 0.249 0.010 176 1483 91.1% 8.9%100 0.150 0.006 65 1548 95.1% 4.9%200 0.074 0.003 47 1595 98.0% 2.0%Pan 33 1628 100.0% 0.0%
Total 1628Initial Weight 1629 Gravel Sand Silt or Clay
Difference 0.1% 36.3% 61.7% 2.0%
D10 D40 D50 D60 D90 Cu
(mm) 0.26 0.64 0.78 1.24 > 2 4.71(inches) 0.010 0.025 0.031 0.049 > 0.05
Boring ID: TH-3aDepth Interval: 40 to 45 feet
Sieve Size or Sieve No.
Sieve Size (mm)
Sieve Size (inches)
Weight Retained (grams)
Cumulative Weight (grams)
Cumulative% Retained
Cumulative % Passing
3/8 9.525 0.375 270 270 17.3% 82.7%4 4.760 0.187 95 365 23.4% 76.6%6 3.353 0.132 54 419 26.8% 73.2%8 2.360 0.094 57 476 30.5% 69.5%10 1.999 0.079 26 502 32.1% 67.9%16 1.191 0.047 97 599 38.3% 61.7%20 0.841 0.033 77 676 43.3% 56.7%40 0.419 0.017 512 1188 76.0% 24.0%60 0.249 0.010 230 1418 90.7% 9.3%100 0.150 0.006 63 1481 94.8% 5.2%200 0.074 0.003 49 1530 97.9% 2.1%Pan 33 1563 100.0% 0.0%
Total 1563Initial Weight 1565 Gravel Sand Silt or Clay
Difference 0.1% 32.1% 65.8% 2.1%
D10 D40 D50 D60 D90 Cu
(mm) 0.26 0.59 0.73 1.06 > 2 4.14(inches) 0.010 0.023 0.029 0.042 > 0.05
File: 38941 Sieve Analyses Chart TH3a.xlsx Print Date: 2/10/2016 Page 1 of 1
ATTACHMENT 3 HYDRAULIC INTERVAL TEST DATA

Well ID: TH-1 Job No.: 38941
Client: CH2M Hill / City of Longview, WashingtonLocation: Riverside County ParkWell Information: Temporary 0.020-inch slot wire-wrapped screen set from 35 to 50 feet below ground surfaceTest Information: Multiple-rate Hydraulic Interval Step Test with 30 minute stepsMeasuring Point: Top of temporary 6-inch casing, approximately 0.6 feet above ground surface.
Date/Time
ElapsedTime from
Start of Test
ElapsedTime from
Start of Step
Depth toWater
ObservedDrawdown
Totalizer Reading
Meter Pumping
Rate Comments(mo/day/yr hr:min) (minutes) (minutes) (feet) (feet) (gallons) (gpm)
1/12/16 8:56 12.941/12/16 9:17 12.951/12/16 9:37 12.951/12/16 9:39 0 0 0 47.0 Start Step 11/12/16 9:40 1 1 13.29 0.34 49 30.41/12/16 9:41 2 2 13.30 0.35 84 30.41/12/16 9:42 3 3 13.30 0.35 94 30.31/12/16 9:43 4 4 13.30 0.35 124 30.31/12/16 9:44 5 5 13.30 0.35 155 30.11/12/16 9:45 6 6 13.30 0.35 185 30.11/12/16 9:47 8 8 13.30 0.35 244 30.31/12/16 9:49 10 10 13.30 0.35 305 30.31/12/16 9:51 12 12 13.30 0.35 365 30.21/12/16 9:53 14 14 13.30 0.35 425 30.31/12/16 9:55 16 16 13.30 0.35 486 30.21/12/16 9:59 20 20 13.30 0.35 615 30.3
1/12/16 10:04 25 25 13.30 0.35 764 30.31/12/16 10:09 30 30 / 0 13.30 0.35 909 30.1 Start Step 21/12/16 10:10 31 1 13.52 0.57 50.21/12/16 10:11 32 2 13.54 0.59 50.11/12/16 10:12 33 3 13.54 0.59 50.11/12/16 10:13 34 4 13.54 0.59 1101 50.11/12/16 10:14 35 5 13.54 0.59 1156 50.11/12/16 10:15 36 6 13.54 0.59 50.11/12/16 10:17 38 8 13.54 0.59 1301 50.11/12/16 10:19 40 10 13.55 0.60 1400 50.11/12/16 10:21 42 12 13.55 0.60 1501 50.11/12/16 10:23 44 14 13.55 0.60 1603 50.11/12/16 10:25 46 16 13.55 0.60 1701 50.11/12/16 10:30 51 21 13.55 0.60 1957 50.11/12/16 10:34 55 25 13.55 0.60 2152 50.11/12/16 10:39 60 30 / 0 13.55 0.60 2410 50.1 Start Step 31/12/16 10:40 61 1 13.89 0.94 75.51/12/16 10:41 62 2 13.89 0.94 75.41/12/16 10:42 63 3 13.89 0.94 2614 75.51/12/16 10:43 64 4 13.89 0.94 751/12/16 10:44 65 5 13.89 0.94 2768 75.41/12/16 10:45 66 6 13.90 0.95 2842 75.51/12/16 10:47 68 8 13.90 0.95 2993 75.51/12/16 10:49 70 10 13.90 0.95 75.51/12/16 10:52 73 13 13.90 0.95 3370 75.51/12/16 10:54 75 15 13.90 0.95 3533 75.51/12/16 11:00 81 21 13.91 0.96 3974 75.41/12/16 11:05 86 26 13.91 0.96 75.51/12/16 11:09 90 30 13.91 0.96 4654 75.51/12/16 11:10 91 31 / 0 Start Step 41/12/16 11:11 92 1 14.05 1.10 120.91/12/16 11:12 93 2 14.58 1.63 121.01/12/16 11:13 94 3 14.59 1.64 121.01/12/16 11:14 95 4 14.59 1.64 5182 121.01/12/16 11:15 96 5 14.59 1.64 5303 121.0
File: 38941 TB-1 Interval Test Analysis.xlsx Print Date: 2/15/2016 Page 1 of 2

Well ID: TH-1 Job No.: 38941
Client: CH2M Hill / City of Longview, WashingtonLocation: Riverside County ParkWell Information: Temporary 0.020-inch slot wire-wrapped screen set from 35 to 50 feet below ground surfaceTest Information: Multiple-rate Hydraulic Interval Step Test with 30 minute stepsMeasuring Point: Top of temporary 6-inch casing, approximately 0.6 feet above ground surface.
Date/Time
ElapsedTime from
Start of Test
ElapsedTime from
Start of Step
Depth toWater
ObservedDrawdown
Totalizer Reading
Meter Pumping
Rate Comments(mo/day/yr hr:min) (minutes) (minutes) (feet) (feet) (gallons) (gpm)
1/12/16 11:16 97 6 14.59 1.64 5424 121.01/12/16 11:18 99 8 14.59 1.64 56661/12/16 11:20 101 10 14.60 1.65 59081/12/16 11:22 103 12 14.60 1.65 6150 121.11/12/16 11:25 106 15 14.60 1.65 6518 121.01/12/16 11:30 111 20 14.60 1.65 7118 121.01/12/16 11:35 116 25 14.60 1.65 7734 121.11/12/16 11:40 121 30 14.60 1.65 8329 120.91/12/16 11:41 122 31 / 0 14.60 1.65 8459 Pump off, start recovery1/12/16 11:41 122.5 0.5 12.98 0.031/12/16 11:42 123 1 12.97 0.021/12/16 11:43 124 2 12.97 0.021/12/16 11:44 125 3 12.97 0.021/12/16 11:45 126 4 12.97 0.021/12/16 11:46 127 5 12.97 0.02
File: 38941 TB-1 Interval Test Analysis.xlsx Print Date: 2/15/2016 Page 2 of 2

Well ID: TH-3 38941
Client: CH2M Hill / City of Longview, WashingtonLocation: Fishers Lane WTP, 8.5 feet east of TH-3AWell Information: 2-inch ID PVC with 0.010-inch slot screen set from 35 to 45 feet below ground surfaceTest Information: Multiple-rate Hydraulic Interval Step Test with 30 minute stepsMeasuring Point: Top of 2-inch PVC casing, approximately 2.6 feet above ground surface.
Date/Time
ElapsedTime from
Start of Test
ElapsedTime from
Start of Step
Depth toWater
ObservedDrawdown Comments
(mo/day/yr hr:min) (minutes) (minutes) (feet) (feet)
1/7/16 8:57 15.451/7/16 14:07 15.431/7/16 14:38 15.431/7/16 14:56 0 0 Start Step 11/7/16 14:59 3 3 15.80 0.371/7/16 15:01 5 5 15.81 0.381/7/16 15:02 6 6 15.81 0.381/7/16 15:03 7 7 15.82 0.391/7/16 15:05 9 9 15.82 0.391/7/16 15:06 10 10 15.82 0.391/7/16 15:09 13 13 15.83 0.401/7/16 15:12 16 16 15.83 0.401/7/16 15:15 19 19 15.83 0.401/7/16 15:16 20 20 15.83 0.401/7/16 15:22 26 26 15.85 0.421/7/16 15:27 31 31 / 0 15.84 0.41 Start Step 21/7/16 15:29 33 2 16.05 0.621/7/16 15:30 34 3 16.08 0.651/7/16 15:32 36 5 16.10 0.671/7/16 15:35 39 8 16.08 0.651/7/16 15:38 42 11 16.10 0.671/7/16 15:40 44 13 16.11 0.681/7/16 15:42 46 15 16.11 0.681/7/16 15:44 48 17 16.12 0.691/7/16 15:48 52 21 16.11 0.681/7/16 15:53 57 26 16.12 0.691/7/16 15:58 62 31 16.12 0.691/7/16 16:04 68 37 16.12 0.691/7/16 16:13 77 46 16.13 0.701/7/16 16:14 78 47 / 0 Start Step 31/7/16 16:18 82 4 16.42 0.991/7/16 16:20 84 6 16.45 1.021/7/16 16:22 86 8 16.45 1.021/7/16 16:25 89 11 16.47 1.041/7/16 16:31 95 17 16.45 1.021/7/16 16:37 101 23 16.45 1.021/7/16 16:41 105 27 16.48 1.051/7/16 16:45 109 31 16.44 1.011/7/16 16:47 111 33 / 0 Start Step 41/7/16 16:52 116 5 16.62 1.191/7/16 16:54 118 7 16.64 1.211/7/16 16:58 122 11 16.64 1.211/7/16 17:00 124 13 16.64 1.21
File: 38941 TB-3A Interval Test Analysis.xlsx Print Date: 2/15/2016 Page 1 of 2

Well ID: TH-3 38941
Client: CH2M Hill / City of Longview, WashingtonLocation: Fishers Lane WTP, 8.5 feet east of TH-3AWell Information: 2-inch ID PVC with 0.010-inch slot screen set from 35 to 45 feet below ground surfaceTest Information: Multiple-rate Hydraulic Interval Step Test with 30 minute stepsMeasuring Point: Top of 2-inch PVC casing, approximately 2.6 feet above ground surface.
Date/Time
ElapsedTime from
Start of Test
ElapsedTime from
Start of Step
Depth toWater
ObservedDrawdown Comments
(mo/day/yr hr:min) (minutes) (minutes) (feet) (feet)
1/7/16 17:04 128 17 16.65 1.221/7/16 17:08 132 21 16.65 1.221/7/16 17:13 137 26 16.65 1.221/7/16 17:18 142 31 16.65 1.221/7/16 17:19 143 32 / 0 Pump off, start recovery1/7/16 17:19 143.5 0.5 16.17 0.741/7/16 17:20 144 1 15.66 0.231/7/16 17:21 145 2 15.61 0.181/7/16 17:22 146 3 15.58 0.151/7/16 17:23 147 4 15.58 0.151/7/16 17:24 148 5 15.55 0.121/7/16 17:25 149 6 15.55 0.121/7/16 17:27 151 8 15.53 0.101/7/16 17:29 153 10 15.52 0.091/7/16 17:31 155 12 15.51 0.08
File: 38941 TB-3A Interval Test Analysis.xlsx Print Date: 2/15/2016 Page 2 of 2

Well ID: TH-3A Job No.: 38941
Client: CH2M Hill / City of Longview, WashingtonLocation: Fishers Lane WTP, 8.5 feet west of TH-3Well Information: Temporary 0.020-inch slot wire-wrapped screen set from 30 to 45 feet below ground surfaceTest Information: Multiple-rate Hydraulic Interval Step Test with 30 minute stepsMeasuring Point: Top of temporary 6-inch casing, approximately 0.65 feet above ground surface.
Date/Time
ElapsedTime from
Start of Test
ElapsedTime from
Start of Step
Depth toWater
ObservedDrawdown
Totalizer Reading
Meter Pumping
Rate Comments(mo/day/yr hr:min) (minutes) (minutes) (feet) (feet) (gallons) (gpm)
1/7/16 14:04 13.531/7/16 14:29 13.531/7/16 14:48 13.531/7/16 14:56 0 0 0 63.0 Start Step 11/7/16 14:58 2 2 15.36 1.83 30.01/7/16 14:59 3 3 15.42 1.891/7/16 15:00 4 4 15.43 1.901/7/16 15:02 6 6 15.44 1.911/7/16 15:03 7 7 15.44 1.91 30.11/7/16 15:05 9 9 15.44 1.91 245 30.31/7/16 15:06 10 10 15.45 1.92 290 30.11/7/16 15:08 12 12 15.45 1.92 352 30.01/7/16 15:11 15 15 15.47 1.94 441 30.01/7/16 15:14 18 18 15.47 1.94 531 30.31/7/16 15:16 20 20 15.48 1.95 5941/7/16 15:21 25 25 15.48 1.95 742 30.11/7/16 15:27 31 31 / 0 15.49 1.96 923 30.2 Start Step 21/7/16 15:28 32 1 16.70 3.171/7/16 15:30 34 3 16.84 3.31 50.11/7/16 15:31 35 4 16.90 3.37 50.11/7/16 15:32 36 5 16.91 3.38 50.21/7/16 15:33 37 6 16.93 3.40 50.11/7/16 15:34 38 7 16.94 3.41 1260 50.11/7/16 15:35 39 8 16.96 3.43 50.01/7/16 15:36 40 9 16.96 3.43 1367 50.11/7/16 15:37 41 10 16.97 3.44 1405 50.11/7/16 15:39 43 12 16.98 3.45 1506 50.21/7/16 15:41 45 14 17.00 3.47 1615 50.21/7/16 15:43 47 16 17.00 3.47 1711 50.11/7/16 15:47 51 20 17.03 3.50 1907 50.21/7/16 15:52 56 25 17.10 3.57 2168 50.11/7/16 15:57 61 30 17.06 3.53 2411 50.21/7/16 16:04 68 37 17.07 3.54 2761 50.21/7/16 16:13 77 46 17.09 3.56 50.21/7/16 16:14 78 47 / 0 Start Step 31/7/16 16:15 79 1 19.00 5.47 751/7/16 16:16 80 2 19.26 5.731/7/16 16:17 81 3 19.35 5.82 75.41/7/16 16:18 82 4 19.44 5.91 75.11/7/16 16:19 83 5 19.49 5.96 75.21/7/16 16:21 85 7 19.54 6.01 3788 75.31/7/16 16:23 87 9 19.58 6.05 3925 75.31/7/16 16:26 90 12 19.62 6.09 4150 75.31/7/16 16:28 92 14 19.64 6.11 75.31/7/16 16:29 93 15 19.66 6.13 4401 75.31/7/16 16:33 97 19 19.68 6.15 4679 75.21/7/16 16:38 102 24 19.72 6.19 75.31/7/16 16:39 103 25 19.72 6.19 5129 75.31/7/16 16:46 110 32 19.76 6.23 5656 75.31/7/16 16:47 111 33 / 0 Start Step 41/7/16 16:48 112 1 21.10 7.57 90.0
File: 38941 TB-3A Interval Test Analysis.xlsx Print Date: 2/15/2016 Page 1 of 2

Well ID: TH-3A Job No.: 38941
Client: CH2M Hill / City of Longview, WashingtonLocation: Fishers Lane WTP, 8.5 feet west of TH-3Well Information: Temporary 0.020-inch slot wire-wrapped screen set from 30 to 45 feet below ground surfaceTest Information: Multiple-rate Hydraulic Interval Step Test with 30 minute stepsMeasuring Point: Top of temporary 6-inch casing, approximately 0.65 feet above ground surface.
Date/Time
ElapsedTime from
Start of Test
ElapsedTime from
Start of Step
Depth toWater
ObservedDrawdown
Totalizer Reading
Meter Pumping
Rate Comments(mo/day/yr hr:min) (minutes) (minutes) (feet) (feet) (gallons) (gpm)
1/7/16 16:49 113 2 21.23 7.70 90.31/7/16 16:50 114 3 21.29 7.76 6000 90.31/7/16 16:52 116 5 21.35 7.82 90.81/7/16 16:53 117 6 21.43 7.90 6277 90.91/7/16 16:55 119 8 21.46 7.93 90.71/7/16 16:57 121 10 21.48 7.95 6648 90.91/7/16 16:59 123 12 21.51 7.98 90.81/7/16 17:02 126 15 21.53 8.00 90.91/7/16 17:03 127 16 21.56 8.03 7176 90.81/7/16 17:07 131 20 21.58 8.05 7549 90.71/7/16 17:12 136 25 21.60 8.07 7994 90.71/7/16 17:18 142 31 21.62 8.09 8542 90.61/7/16 17:19 143 32 / 0 Pump off, start recovery1/7/16 17:20 144 1 13.92 0.391/7/16 17:21 145 2 13.72 0.191/7/16 17:22 146 3 13.68 0.151/7/16 17:23 147 4 13.67 0.141/7/16 17:24 148 5 13.64 0.111/7/16 17:25 149 6 13.63 0.101/7/16 17:27 151 8 13.63 0.101/7/16 17:29 153 10 13.62 0.091/7/16 17:31 155 12 13.60 0.07
File: 38941 TB-3A Interval Test Analysis.xlsx Print Date: 2/15/2016 Page 2 of 2

ATTACHMENT 4 TH‐1 AND TH‐3a SAMPLES
LABORATORY ANALYSIS RESULTS

January 29, 2016 Analytical Report for Service Request No: K1600294
Brad PhelpsCH2M Hill2020 SW 4th Ave.Suite 300Portland, OR 97201
Analyses were performed according to our laboratory’s NELAP-approved quality assurance program. The test results meet requirements of the current NELAP standards, where applicable, and except as noted in the laboratory case narrative provided. For a specific list of NELAP-accredited analytes, refer to the certifications section at www.alsglobal.com. All results are intended to be considered in their entirety, and ALS Group USA Corp. dba ALS Environmental (ALS) is not responsible for use of less than the complete report. Results apply only to the items submitted to the laboratory for analysis and individual items (samples) analyzed, as listed in the report.
For your reference, these analyses have been assigned our service request numberEnclosed are the results of the sample(s) submitted to our laboratory January 12, 2016
RE: Riverside Park
Dear Brad,
K1600294.
Please contact me if you have any questions. My extension is 3275. You may also contact me via email at [email protected].
Respectfully submitted,
ALS Group USA, Corp. dba ALS Environmental
Chris LeafProject Manager
ALS Group USA, Corp1317 South 13th AvenueKelso, WA 98626
+1 360 577 7222+1 360 636 1068
T :F :
ALS Environmental
www.alsglobal.com
RIGHT SOLUTIONS | RIGHT PARTNERPage 1 of 108
www.alsglobal.com
ALS Environmental
F :T :
+1 360 636 1068+1 360 577 7222
Kelso, WA 986261317 South 13th AvenueALS Group USA, Corp
Table of Contents
RIGHT SOLUTIONS | RIGHT PARTNER
Acronyms
Qualifiers
State Certifications, Accreditations, And Licenses
Case Narrative
Chain of Custody
General Chemistry
Metals
Diesel and Residual Range Organics
Gasoline Range Organics
Subcontract Lab Results
Page 2 of 108

ASTM American Society for Testing and Materials
A2LA American Association for Laboratory Accreditation
CARB California Air Resources Board
CAS Number Chemical Abstract Service registry Number
CFC Chlorofluorocarbon
CFU Colony-Forming Unit
DEC Department of Environmental Conservation
DEQ Department of Environmental Quality
DHS Department of Health Services
DOE Department of Ecology
DOH Department of Health
EPA U. S. Environmental Protection Agency
ELAP Environmental Laboratory Accreditation Program
GC Gas Chromatography
GC/MS Gas Chromatography/Mass Spectrometry
LOD Limit of Detection
LOQ Limit of Quantitation
LUFT Leaking Underground Fuel Tank
M ModifiedMCL Maximum Contaminant Level is the highest permissible concentration of a substance
allowed in drinking water as established by the USEPA.
MDL Method Detection Limit
MPN Most Probable Number
MRL Method Reporting Limit
NA Not Applicable
NC Not Calculated
NCASI National Council of the Paper Industry for Air and Stream Improvement
ND Not Detected
NIOSH National Institute for Occupational Safety and Health
PQL Practical Quantitation Limit
RCRA Resource Conservation and Recovery Act
SIM Selected Ion Monitoring
TPH Total Petroleum Hydrocarbonstr Trace level is the concentration of an analyte that is less than the PQL but greater than or
equal to the MDL.
Acronyms
Page 3 of 108

Inorganic Data Qualifiers
* The result is an outlier. See case narrative.
# The control limit criteria is not applicable. See case narrative.
B The analyte was found in the associated method blank at a level that is significant relative to the sample result as defined by the DOD or NELAC standards.
E The result is an estimate amount because the value exceeded the instrument calibration range.
J The result is an estimated value.
U The analyte was analyzed for, but was not detected ("Non-detect") at or above the MRL/MDL. DOD-QSM 4.2 definition : Analyte was not detected and is reported as less than the LOD or as defined by the project. The detection limit is adjusted for dilution.
i The MRL/MDL or LOQ/LOD is elevated due to a matrix interference.
X See case narrative.
Q See case narrative. One or more quality control criteria was outside the limits.
H The holding time for this test is immediately following sample collection. The samples were analyzed as soon as possible afterreceipt by the laboratory.
Metals Data Qualifiers
# The control limit criteria is not applicable. See case narrative.
J The result is an estimated value.
E The percent difference for the serial dilution was greater than 10%, indicating a possible matrix interference in the sample.
M The duplicate injection precision was not met.
N The Matrix Spike sample recovery is not within control limits. See case narrative.
S The reported value was determined by the Method of Standard Additions (MSA).
U The analyte was analyzed for, but was not detected ("Non-detect") at or above the MRL/MDL. DOD-QSM 4.2 definition : Analyte was not detected and is reported as less than the LOD or as defined by the project. The detection limit is adjusted for dilution.
W The post-digestion spike for furnace AA analysis is out of control limits, while sample absorbance is less than 50% of spike absorbance.
i The MRL/MDL or LOQ/LOD is elevated due to a matrix interference.
X See case narrative.
+ The correlation coefficient for the MSA is less than 0.995.
Q See case narrative. One or more quality control criteria was outside the limits.
Organic Data Qualifiers
* The result is an outlier. See case narrative.
# The control limit criteria is not applicable. See case narrative.
A A tentatively identified compound, a suspected aldol-condensation product.
B The analyte was found in the associated method blank at a level that is significant relative to the sample result as defined by the DOD or NELAC standards.
C The analyte was qualitatively confirmed using GC/MS techniques, pattern recognition, or by comparing to historical data.
D The reported result is from a dilution.
E The result is an estimated value.
J The result is an estimated value.
N The result is presumptive. The analyte was tentatively identified, but a confirmation analysis was not performed.
PThe GC or HPLC confirmation criteria was exceeded. The relative percent difference is greater than 40% between the two analytical results.
U The analyte was analyzed for, but was not detected ("Non-detect") at or above the MRL/MDL. DOD-QSM 4.2 definition : Analyte was not detected and is reported as less than the LOD or as defined by the project. The detection limit is adjusted for dilution.
i The MRL/MDL or LOQ/LOD is elevated due to a chromatographic interference.
X See case narrative.
Q See case narrative. One or more quality control criteria was outside the limits.
Additional Petroleum Hydrocarbon Specific Qualifiers
F The chromatographic fingerprint of the sample matches the elution pattern of the calibration standard.
L The chromatographic fingerprint of the sample resembles a petroleum product, but the elution pattern indicates the presence of a greater amount of lighter molecular weight constituents than the calibration standard.
H The chromatographic fingerprint of the sample resembles a petroleum product, but the elution pattern indicates the presence of a greater amount of heavier molecular weight constituents than the calibration standard.
O The chromatographic fingerprint of the sample resembles an oil, but does not match the calibration standard.
Y The chromatographic fingerprint of the sample resembles a petroleum product eluting in approximately the correct carbon range, but the elution pattern does not match the calibration standard.
Z The chromatographic fingerprint does not resemble a petroleum product.
Page 4 of 108

Agency Web Site Number
Alaska DEC UST http://dec.alaska.gov/applications/eh/ehllabreports/USTLabs.aspx UST-040
Arizona DHS http://www.azdhs.gov/lab/license/env.htm AZ0339
Arkansas - DEQ http://www.adeq.state.ar.us/techsvs/labcert.htm 88-0637
California DHS (ELAP) http://www.cdph.ca.gov/certlic/labs/Pages/ELAP.aspx 2795
DOD ELAP http://www.denix.osd.mil/edqw/Accreditation/AccreditedLabs.cfm L14-51
Florida DOH http://www.doh.state.fl.us/lab/EnvLabCert/WaterCert.htm E87412
Hawaii DOH Not available -
Idaho DHWhttp://www.healthandwelfare.idaho.gov/Health/Labs/CertificationDrinkingWaterLabs/tabid/1833/Default.aspx -
ISO 17025 http://www.pjlabs.com/ L14-50
Louisiana DEQhttp://www.deq.louisiana.gov/portal/DIVISIONS/PublicParticipationandPermitSupport/LouisianaLaboratoryAccreditationProgram.aspx 03016
Maine DHS Not available WA01276
Michigan DEQ http://www.michigan.gov/deq/0,1607,7-135-3307_4131_4156---,00.html 9949
Minnesota DOH http://www.health.state.mn.us/accreditation 053-999-457
Montana DPHHS http://www.dphhs.mt.gov/publichealth/ CERT0047
Nevada DEP http://ndep.nv.gov/bsdw/labservice.htm WA01276
New Jersey DEP http://www.nj.gov/dep/oqa/ WA005
North Carolina DWQ http://www.dwqlab.org/ 605
Oklahoma DEQ http://www.deq.state.ok.us/CSDnew/labcert.htm 9801
Oregon – DEQ (NELAP)http://public.health.oregon.gov/LaboratoryServices/EnvironmentalLaboratoryAccreditation/Pages/index.aspx WA100010
South Carolina DHEC http://www.scdhec.gov/environment/envserv/ 61002
Texas CEQ http://www.tceq.texas.gov/field/qa/env_lab_accreditation.html T104704427
Washington DOE http://www.ecy.wa.gov/programs/eap/labs/lab-accreditation.html C544
Wisconsin DNR http://dnr.wi.gov/ 998386840
Wyoming (EPA Region 8) http://www.epa.gov/region8/water/dwhome/wyomingdi.html -
Kelso Laboratory Website www.alsglobal.com NA
ALS Group USA Corp. dba ALS Environmental (ALS) - KelsoState Certifications, Accreditations, and Licenses
Analyses were performed according to our laboratory’s NELAP-approved quality assurance program. A complete listing of specific NELAP-certified analytes, can be found in the certification section at www.ALSGlobal.com or at the accreditation bodies web site.Please refer to the certification and/or accreditation body's web site if samples are submitted for compliance purposes. The states highlighted above, require the analysis be listed on the state certification if used for compliance purposes and if the method/anlayte is offered by that state.
Page 5 of 108

Case Narrative
ALS Environmental—Kelso Laboratory 1317 South 13th Avenue, Kelso, WA 98626 Phone (360)577-7222 Fax (360)636-1068 www.alsglobal.com
RIGHT SOLUTIONS | RIGHT PARTNER
Page 6 of 108
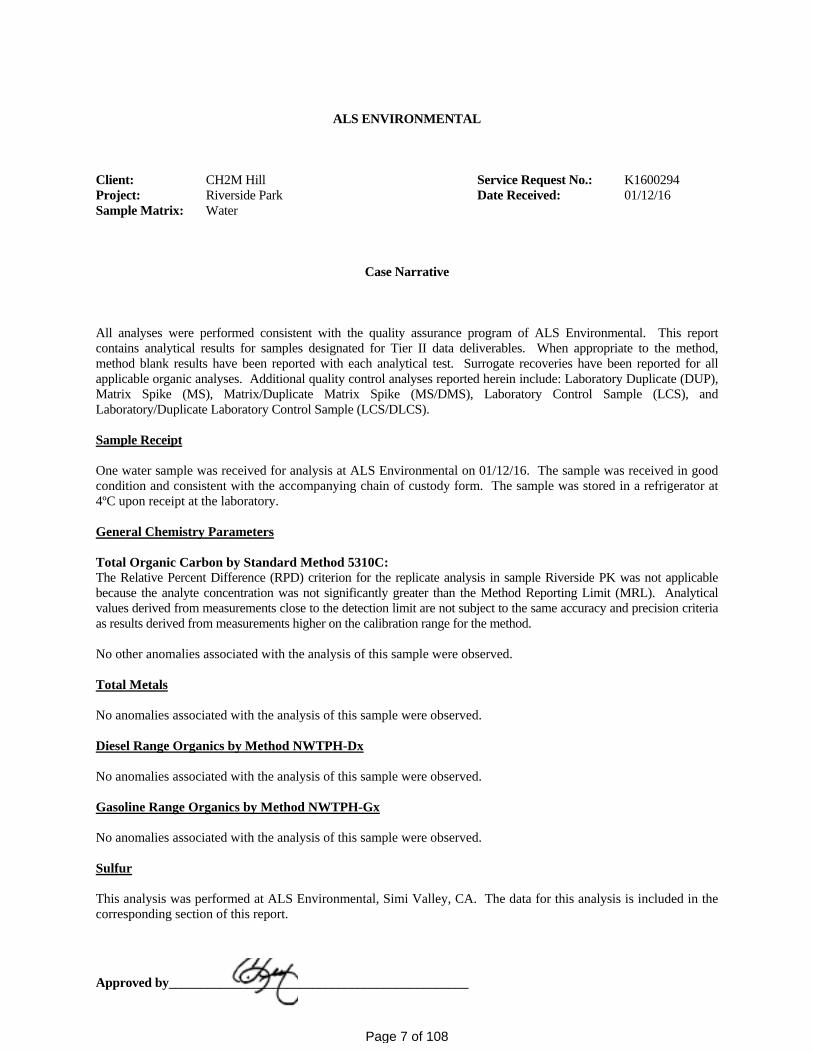
Approved by______________________________________________
ALS ENVIRONMENTAL Client: CH2M Hill Service Request No.: K1600294 Project: Riverside Park Date Received: 01/12/16 Sample Matrix: Water
Case Narrative All analyses were performed consistent with the quality assurance program of ALS Environmental. This report contains analytical results for samples designated for Tier II data deliverables. When appropriate to the method, method blank results have been reported with each analytical test. Surrogate recoveries have been reported for all applicable organic analyses. Additional quality control analyses reported herein include: Laboratory Duplicate (DUP), Matrix Spike (MS), Matrix/Duplicate Matrix Spike (MS/DMS), Laboratory Control Sample (LCS), and Laboratory/Duplicate Laboratory Control Sample (LCS/DLCS). Sample Receipt One water sample was received for analysis at ALS Environmental on 01/12/16. The sample was received in good condition and consistent with the accompanying chain of custody form. The sample was stored in a refrigerator at 4ºC upon receipt at the laboratory. General Chemistry Parameters Total Organic Carbon by Standard Method 5310C: The Relative Percent Difference (RPD) criterion for the replicate analysis in sample Riverside PK was not applicable because the analyte concentration was not significantly greater than the Method Reporting Limit (MRL). Analytical values derived from measurements close to the detection limit are not subject to the same accuracy and precision criteria as results derived from measurements higher on the calibration range for the method. No other anomalies associated with the analysis of this sample were observed. Total Metals No anomalies associated with the analysis of this sample were observed. Diesel Range Organics by Method NWTPH-Dx No anomalies associated with the analysis of this sample were observed. Gasoline Range Organics by Method NWTPH-Gx No anomalies associated with the analysis of this sample were observed. Sulfur This analysis was performed at ALS Environmental, Simi Valley, CA. The data for this analysis is included in the corresponding section of this report.
Page 7 of 108

Chain of Custody
ALS Environmental—Kelso Laboratory 1317 South 13th Avenue, Kelso, WA 98626 Phone (360)577-7222 Fax (360)636-1068 www.alsglobal.com
RIGHT SOLUTIONS | RIGHT PARTNER
Page 8 of 108
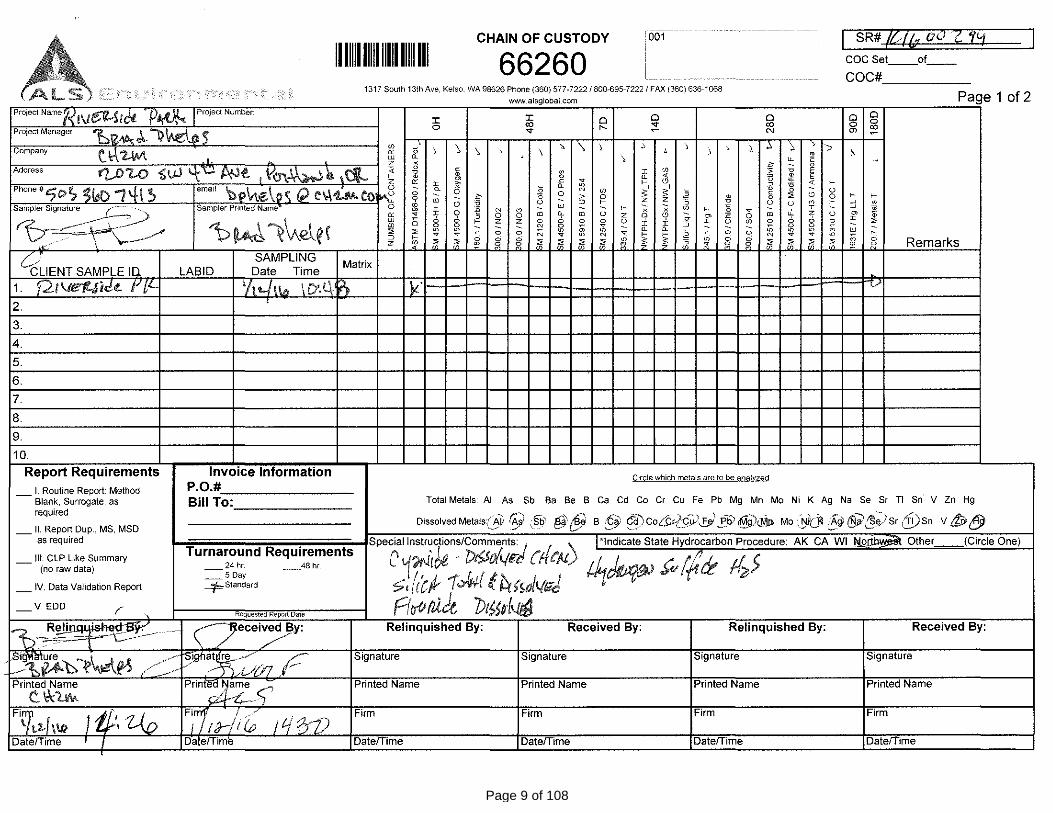
www_alsglobal_com
:r: :r: 0 ro
"' ' ~ ' \ 0 ' \ \ ~
Company
X 0 c 0 l! • • rn oc I g " 0 0
~ :'1 ~ ~
0 > ~ ;; ~ ~
rn • ~ N ~ " ~ 9 0 q. 0 0 ~ z 0 0
~ ~ ~ ~ ~ 0 " " " ~ ~ ~ 2 0 i)j i)j w 0
Address
0 0 r-- "' ' ~
' )
' I w ~ < ~ " w ' ~' 0 ~ ~
~ z z 0
:; ll 6 w
0 ± 0
" I ~ ~ ~ Q N ~ ~ ~ i)j s s 0
.\ '
~ ~ § rn ~
~ u ~ 0 ~ 0 0 0
l
" 0 w 0 0 0
'
~ ~
" " f i w
" ~ Remarks
c:c~IENT SAMPLE 10. SAMPLING
Matrix LA BID Date Time
1. Y21 \le1lJif!(. r v-2.
3.
4.
5.
6.
7.
8.
9.
10.
Report Requirements L Routine Report: Method
- Blank, Surrogate, as required
_II. Report Dup., MS, MSD as required
_ 111. CLP Like Summary (no raw data)
_IV. Data Validation Report
'Itt-/ 111> 1 cr. t\. n '
Invoice Information P.O.#~------Bill To: ______ _
Turnaround Requirements 24 hr
_5Day _:::J=Standard
_48hr
V. EDD t' Requeste<J Report Dale
... -~:--~~ \ / /' Rel.iJlll4_ _i ishe<!:BY<' _ ~~ece-iv-ed ~y:
Printed Name Prinafd 1~ame .,.,---; c_ tic b'Y.. 9'-f--z;:_.. ')
Date/Time I Date/Time
y·
Circle which metals are to be analyzed
Total Metals: AI As Sb Ba Be 8 Ca Cd Co Cr Cu Fe Pb Mg Mn Mo Ni K Ag Na Se Sr Tl Sn· V Zn Hg
DissolvedMetals(AV Q ;sb· "''"'d B.& Cci)co.::&..fc~lj.PIY";)<MI> Mo .'.,J,i> iiw@.~;)sr :'fi)sn v tl)""" ..____ ./ - -- e9 v L.-7 -.._,_/ '----~ --- ~- Yu:' -- --~ ---- 0
Relinquished By: Received By: Relinquished By: Received By:
Signature Signature Signature Signature
Printed Name Printed Name Printed Name Printed Name
Firm Firm Firm Firm
Date/Time Date/Time Date/Time Date/Time
Page 9 of 108

A 1111111111111111111111 Ill
I
66260 I
COCSet __ of __
COC# 1317 South 13th Ave, Kelso, WA 98626 Phone (360) 577-7222 I 800-.695-7222/ FAX (360) 636-1068
Page 2 of 2 .. ·. \NVIIW_alsglobal com
CHAIN OF CUSTODY SR#
ProJect Name Project Number 0 0 0 0>
Project Manager "' 0> ~ 0>
Company ~
\ ' u' oc ' u ' w - .. .. z u u Address ~ 8 .
~ • ~ z z Phone# email 0
8 ~
~ u 0 ~ ~ " . . z I Sampler S1gnature Sampler Printed Name 0
~ .. ~ ~ ~ oc • w ~ ~ 2 • 0 w - ~ ~ ~ • ~ ,_ a ~ ::;
~ 0 0
il ~ Remarks z 0 0
SAMPLING Matrix
CLIENT SAMPLE'-10 LA BID Date Time 1. a<.:v'u<Z-\d.J r.w~ lb( 2.
3.
4.
5.
6.
7.
8.
9.
10.
Report Requirements Invoice Information Qjrcle ~high metals are to be aoa[)l;::ed
_ l. Routine Report: Method P.O.# Blank, Surrogate, as Bill To: Total Metals: AI As Sb Ba Be B Ca Cd Co Cr Cu Fe Pb Mg Mn Mo N; K Ag Na Se Sr T! Sn V Zn Hg required
Cd Co Cr Cu Fe Pb Mg K Ag Na Se Sr Tl Sn V Zn Hg Dissolved Metals: AI As Sb Ba Be B Ca Mn Mo N; _II. Report Dup., MS, MSD
as required Special Instructions/Comments: 1 *Indicate State Hydrocarbon Procedure: AK CA WI Northwest Other (Circle One)
_IlL CLP Like Summary Turnaround Requirements
{no raw data) - 24 hr -~48hr _SDay
_ IV_ Data Validation Report - Standard
V. EOO Requested Report Date
Relinquished By: Received By: Relinquished By: Received By: Relinquished By: Received By:
Signature Signature Signature Signature Signature Signature
Printed Name Printed Name Printed Name Printed Name Printed Name Printed Name
Firm Firm Firm Firm Firm Firm
Date/Time Date/Time Date/Time Date/Time Date/Time Date/Time
Page 10 of 108

PC~-() __ ,
1 1 1 Cooler Receipt and Preservation Form _
Client ~ l~ N HI [I ~ervice, Request K16 . i 0 0 Z 1 L( __ . Rece1ved: 1112-[1 \f Opened: 1 1 By:(p / Unloaded: i /t~tr~~ --.... By~:J?_ / 1. Samples were received via? Mail Fed Ex UPS DHL PDX Courier Vand De/iyergfJJ
2. Samples were received in: (circle) ~~ , Box Envelope Other - .. ____ ·- .. --~-i . , NA
3. Were custody seals on coolers? NA ~) N If yes, how many and where? {).U.J! · lt{..t. v /J .
If present, were custody seals intact? Y . N If present, were they signed and dated? {jJ N
Raw ..... Corr. I · Thermometer. 1- ·._· ·•- Cooler/COC ID . Tracking Numbe~ corrected. Raw Corrected ---~ COolerTefnp cOole;~;nP Te~P-Btahk Te;~-Biank l'ac,!Or I 10 ·1. -__ - __ - -)(A'
• Filed
I !.fl 1\ JJ I;; ::t-- ~~- 7- (/) ::f!c ftJ ~
. " ' (
~~~:: . .,. '""" 4. Packing material: Inserts~gie"-"-~~ Gel Packs Wet Ice Dry Ice Sleeves
5. Were custody papers properly filled out (ink, signed, etc.)? NA Cl./ N ~
6. Did all bottles arrive in good condition (unbroken)? Indicate in the table below. NA (L N
7. Were all sample labels complete (i.e analysis, preservation, etc.)? NA @, N
8. Did all sample labels and tags agree with custody papers? Indicate major discrepancies in the table on page 2. NA <.i N
9. Were appropriate bottles/containers and volumes received for the tests indicated? NA C3 N
10. Were the pH-preserved bottles (see SMO GEN SOP) received at the appropriate pH? Indicate in the table below
11. Were VOA vials received without headspace? Indicate in the table below.
12. Was Cl2/Res negative?
NA ~ N
'NA 00 N
CJ::!b) y N
Samole ID on Bottle Samole 10 on COC Identified by:
Bottle Count Out of Head- Volume Reagent Lot SampleiD Bottle Type Temp space Broke pH Reagent added Number Initials Time
- .••. ,., ~ Jl ,- ~~ f\ '1' ~. 1\.ft t:. lt!IWU ,J!M1 1s r1 ~1;"1 ~,:n "'" '
" . ~· n ~ . .. " ;;:::n ~"· t1 :i'
'·
Page __ of_ __ _
Page 11 of 108

General Chemistry
ALS Environmental—Kelso Laboratory 1317 South 13th Avenue, Kelso, WA 98626 Phone (360)577-7222 Fax (360)636-1068 www.alsglobal.com
RIGHT SOLUTIONS | RIGHT PARTNER
Page 12 of 108

Client:
01/12/16
K1600294
Date Received:Date Collected:
Service Request:
WaterRiverside ParkCH2M Hill
Sample Matrix:Project: 01/12/16
Turbidity
Basis:Units: NTU
NA180.1NonePrep Method:
Analysis Method:
Lab CodeSample NameDate
AnalyzedDil.MRLResult Q
Riverside PK 01/13/16 07:0010.2016.8K1600294-001Method Blank 01/13/16 07:0010.20 UNDK1600294-MB2
Analytical Report
ALS Group USA, Corp. dba ALS Environmental
Printed 1/21/2016 3:33:26 PM 16-0000361103 rev 00Superset Reference:
Page 13 of 108

ALS Group USA, Corp.dba ALS Environmental
QA/QC Report
Client:ProjectSample Matrix:
Prep Method:Analysis Method:
CH2M HillRiverside ParkWater
180.1None
Service Request:Date Collected:Date Received:
Basis:Units:
K160029401/12/1601/12/16
NTUNA
Replicate Sample SummaryTurbidity
Sample Name: Lab Code:Date
AnalyzedRPDLimitMRL RPD
DuplicateResult Average
SampleResult
2 0.20 16.8 16.5 16.7 20Riverside PK K1600294-001DUP 01/13/16
Results flagged with an asterisk (*) indicate values outside control criteria.
Results flagged with a pound (#) indicate the control criteria is not applicable.
Percent recoveries and relative percent differences (RPD) are determined by the software using values in the calculation which have not been rounded.
Printed 1/21/2016 3:33:29 PM 16-0000361103 rev 00Superset Reference:
Page 14 of 108

Riverside ParkClient: Project: Sample Matrix:
Service Request:CH2M Hill K1600294
Water
QA/QC Report
Date Analyzed: 1/13/16
Lab Control Sample SummaryGeneral Chemistry Parameters
ALS Group USA, Corp. dba ALS Environmental
Units:NABasis:
Analyte Name% Rec Limits
Lab Control Sample
% RecSpike
AmountResultMethod
NTU
K1600294-LCS2
Turbidity 4.23 106 90 - 110180.1 4.50
Page 15 of 108

Client:
01/12/16
K1600294
Date Received:Date Collected:
Service Request:
WaterRiverside ParkCH2M Hill
Sample Matrix:Project: 01/12/16
Chloride
Basis:Units: mg/L
NA300.0MethodPrep Method:
Analysis Method:
Lab CodeSample NameDate
AnalyzedDate
ExtractedDil.MRLResult Q
Riverside PK 01/13/16 09:54 1/13/1620.207.66K1600294-001Method Blank 01/13/16 09:40 1/13/1610.10 UNDK1600294-MB1
Analytical Report
ALS Group USA, Corp. dba ALS Environmental
Printed 1/21/2016 3:33:08 PM 16-0000361103 rev 00Superset Reference:
Page 16 of 108

ALS Group USA, Corp.
QA/QC Report
Client:ProjectSample Matrix: Water
Riverside ParkCH2M Hill Service Request: K1600294
01/12/16Date Collected:Date Received: 01/12/16
01/13/16Date Analyzed:
Replicate Sample SummaryGeneral Chemistry Parameters
Riverside PK mg/LBasis:Units:
K1600294-001 NALab Code:Sample Name:
RPD LimitMRLAnalysis Method RPD
Duplicate SampleK1600294-
001DUP Result Average
SampleResultAnalyte Name
dba ALS Environmental
Chloride <1 0.20 7.66 7.66 7.66 20300.0
Results flagged with an asterisk (*) indicate values outside control criteria.
Results flagged with a pound (#) indicate the control criteria is not applicable.
Percent recoveries and relative percent differences (RPD) are determined by the software using values in the calculation which have not been rounded.
Printed 1/21/2016 3:33:09 PM 16-0000361103 rev 00Superset Reference:
Page 17 of 108

QA/QC Report
mg/LK1600294-001 Basis:Lab Code:
Units:Sample Name: Riverside PK
ChlorideDuplicate Matrix Spike Summary
NA
Client:Project:Sample Matrix:
CH2M HillRiverside ParkWater
Service Request:
Date Analyzed:Date Received:
K1600294
01/13/1601/12/16
Date Collected: 01/12/16
Method300.0
Prep Method:Analysis Method:
Analyte NameRPD LimitRPDResult
Sample Result
Spike Amount % Rec
Matrix SpikeK1600294-001MS K1600294-001DMS
Duplicate Matrix Spike
% RecSpike
AmountResult% Rec Limits
ALS Group USA, Corp.dba ALS Environmental
01/13/16Date Extracted:
Chloride 7.66 16.8 10.0 91 16.9 10.0 92 90-110 <1 20
Results flagged with an asterisk (*) indicate values outside control criteria.
Results flagged with a pound (#) indicate the control criteria is not applicable.
Percent recoveries and relative percent differences (RPD) are determined by the software using values in the calculation which have not been rounded.
Printed 1/21/2016 3:33:09 PM 16-0000361103 rev 00Superset Reference:
Page 18 of 108

Sample Name
K1600294Date Analyzed:Service Request:
WaterRiverside ParkCH2M Hill
Sample Matrix:Project:Client:
Lab Control Sample SummaryChloride
Analysis Method:Prep Method:
300.0Method NA
mg/LBasis:Units:
Analysis Lot: 479966
01/13/16
Spike AmountResult % Rec
% Rec Limits
01/13/16Date Extracted:
Lab Code
dba ALS EnvironmentalALS Group USA, Corp.
QA/QC Report
Lab Control Sample 90-11095 5.004.74K1600294-LCS1
16-0000361103 rev 00Superset Reference:Printed 1/21/2016 3:33:09 PM
Page 19 of 108
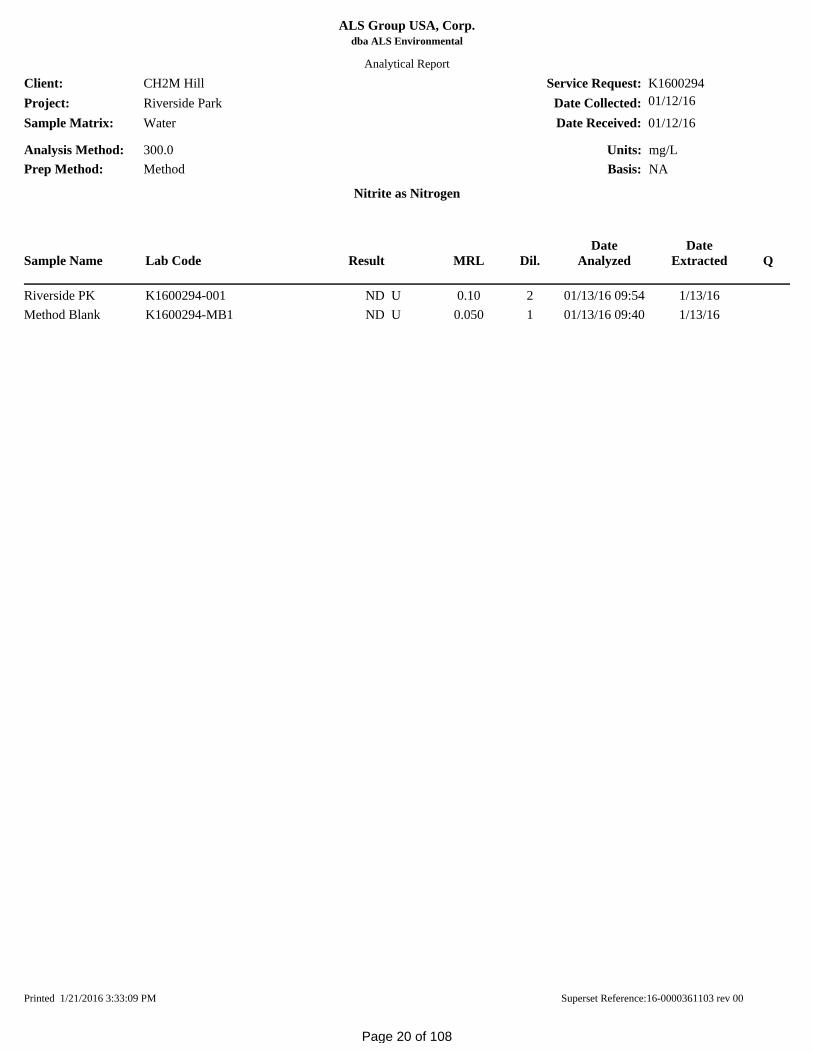
Client:
01/12/16
K1600294
Date Received:Date Collected:
Service Request:
WaterRiverside ParkCH2M Hill
Sample Matrix:Project: 01/12/16
Nitrite as Nitrogen
Basis:Units: mg/L
NA300.0MethodPrep Method:
Analysis Method:
Lab CodeSample NameDate
AnalyzedDate
ExtractedDil.MRLResult Q
Riverside PK 01/13/16 09:54 1/13/1620.10 UNDK1600294-001Method Blank 01/13/16 09:40 1/13/1610.050 UNDK1600294-MB1
Analytical Report
ALS Group USA, Corp. dba ALS Environmental
Printed 1/21/2016 3:33:09 PM 16-0000361103 rev 00Superset Reference:
Page 20 of 108

ALS Group USA, Corp.
QA/QC Report
Client:ProjectSample Matrix: Water
Riverside ParkCH2M Hill Service Request: K1600294
01/12/16Date Collected:Date Received: 01/12/16
01/13/16Date Analyzed:
Replicate Sample SummaryGeneral Chemistry Parameters
Riverside PK mg/LBasis:Units:
K1600294-001 NALab Code:Sample Name:
RPD LimitMRLAnalysis Method RPD
Duplicate SampleK1600294-
001DUP Result Average
SampleResultAnalyte Name
dba ALS Environmental
Nitrite as Nitrogen NC 0.10 ND U ND U NC 20300.0
Results flagged with an asterisk (*) indicate values outside control criteria.
Results flagged with a pound (#) indicate the control criteria is not applicable.
Percent recoveries and relative percent differences (RPD) are determined by the software using values in the calculation which have not been rounded.
Printed 1/21/2016 3:33:09 PM 16-0000361103 rev 00Superset Reference:
Page 21 of 108

QA/QC Report
mg/LK1600294-001 Basis:Lab Code:
Units:Sample Name: Riverside PK
Nitrite as NitrogenDuplicate Matrix Spike Summary
NA
Client:Project:Sample Matrix:
CH2M HillRiverside ParkWater
Service Request:
Date Analyzed:Date Received:
K1600294
01/13/1601/12/16
Date Collected: 01/12/16
Method300.0
Prep Method:Analysis Method:
Analyte NameRPD LimitRPDResult
Sample Result
Spike Amount % Rec
Matrix SpikeK1600294-001MS K1600294-001DMS
Duplicate Matrix Spike
% RecSpike
AmountResult% Rec Limits
ALS Group USA, Corp.dba ALS Environmental
01/13/16Date Extracted:
Nitrite as Nitrogen ND U 10.3 10.0 103 10.3 10.0 103 90-110 <1 20
Results flagged with an asterisk (*) indicate values outside control criteria.
Results flagged with a pound (#) indicate the control criteria is not applicable.
Percent recoveries and relative percent differences (RPD) are determined by the software using values in the calculation which have not been rounded.
Printed 1/21/2016 3:33:10 PM 16-0000361103 rev 00Superset Reference:
Page 22 of 108

Sample Name
K1600294Date Analyzed:Service Request:
WaterRiverside ParkCH2M Hill
Sample Matrix:Project:Client:
Lab Control Sample SummaryNitrite as Nitrogen
Analysis Method:Prep Method:
300.0Method NA
mg/LBasis:Units:
Analysis Lot: 479966
01/13/16
Spike AmountResult % Rec
% Rec Limits
01/13/16Date Extracted:
Lab Code
dba ALS EnvironmentalALS Group USA, Corp.
QA/QC Report
Lab Control Sample 90-110102 2.502.54K1600294-LCS1
16-0000361103 rev 00Superset Reference:Printed 1/21/2016 3:33:10 PM
Page 23 of 108

Client:
01/12/16
K1600294
Date Received:Date Collected:
Service Request:
WaterRiverside ParkCH2M Hill
Sample Matrix:Project: 01/12/16
Nitrate as Nitrogen
Basis:Units: mg/L
NA300.0MethodPrep Method:
Analysis Method:
Lab CodeSample NameDate
AnalyzedDate
ExtractedDil.MRLResult Q
Riverside PK 01/13/16 09:54 1/13/1620.10 UNDK1600294-001Method Blank 01/13/16 09:40 1/13/1610.050 UNDK1600294-MB1
Analytical Report
ALS Group USA, Corp. dba ALS Environmental
Printed 1/21/2016 3:33:10 PM 16-0000361103 rev 00Superset Reference:
Page 24 of 108
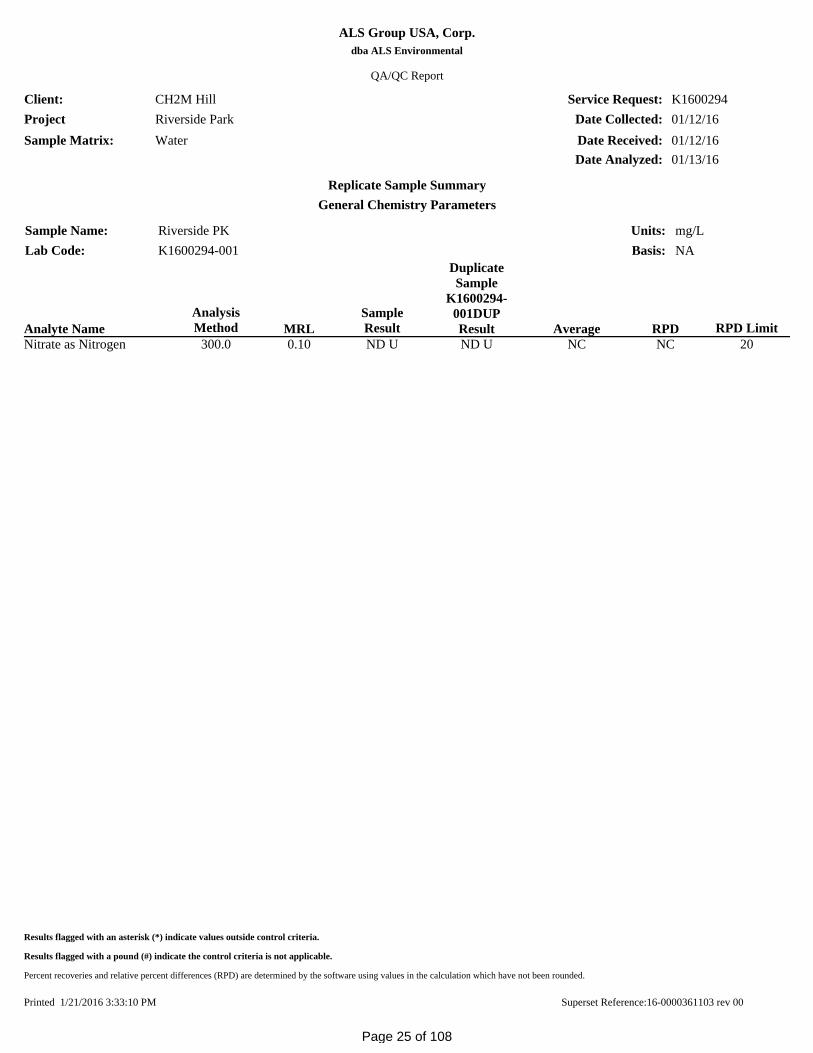
ALS Group USA, Corp.
QA/QC Report
Client:ProjectSample Matrix: Water
Riverside ParkCH2M Hill Service Request: K1600294
01/12/16Date Collected:Date Received: 01/12/16
01/13/16Date Analyzed:
Replicate Sample SummaryGeneral Chemistry Parameters
Riverside PK mg/LBasis:Units:
K1600294-001 NALab Code:Sample Name:
RPD LimitMRLAnalysis Method RPD
Duplicate Sample
K1600294-001DUP Result Average
SampleResultAnalyte Name
dba ALS Environmental
Nitrate as Nitrogen NC 0.10 ND U ND U NC 20300.0
Results flagged with an asterisk (*) indicate values outside control criteria.
Results flagged with a pound (#) indicate the control criteria is not applicable.
Percent recoveries and relative percent differences (RPD) are determined by the software using values in the calculation which have not been rounded.
Printed 1/21/2016 3:33:10 PM 16-0000361103 rev 00Superset Reference:
Page 25 of 108

QA/QC Report
mg/LK1600294-001 Basis:Lab Code:
Units:Sample Name: Riverside PK
Nitrate as NitrogenDuplicate Matrix Spike Summary
NA
Client:Project:Sample Matrix:
CH2M HillRiverside ParkWater
Service Request:
Date Analyzed:Date Received:
K1600294
01/13/1601/12/16
Date Collected: 01/12/16
Method300.0
Prep Method:Analysis Method:
Analyte NameRPD LimitRPDResult
Sample Result
Spike Amount % Rec
Matrix SpikeK1600294-001MS K1600294-001DMS
Duplicate Matrix Spike
% RecSpike
AmountResult% Rec Limits
ALS Group USA, Corp.dba ALS Environmental
01/13/16Date Extracted:
Nitrate as Nitrogen ND U 9.44 10.0 94 9.41 10.0 94 90-110 <1 20
Results flagged with an asterisk (*) indicate values outside control criteria.
Results flagged with a pound (#) indicate the control criteria is not applicable.
Percent recoveries and relative percent differences (RPD) are determined by the software using values in the calculation which have not been rounded.
Printed 1/21/2016 3:33:11 PM 16-0000361103 rev 00Superset Reference:
Page 26 of 108

Sample Name
K1600294Date Analyzed:Service Request:
WaterRiverside ParkCH2M Hill
Sample Matrix:Project:Client:
Lab Control Sample SummaryNitrate as Nitrogen
Analysis Method:Prep Method:
300.0Method NA
mg/LBasis:Units:
Analysis Lot: 479966
01/13/16
Spike AmountResult % Rec
% Rec Limits
01/13/16Date Extracted:
Lab Code
dba ALS EnvironmentalALS Group USA, Corp.
QA/QC Report
Lab Control Sample 90-11094 2.502.35K1600294-LCS1
16-0000361103 rev 00Superset Reference:Printed 1/21/2016 3:33:11 PM
Page 27 of 108

Client:
01/12/16
K1600294
Date Received:Date Collected:
Service Request:
WaterRiverside ParkCH2M Hill
Sample Matrix:Project: 01/12/16
Sulfate
Basis:Units: mg/L
NA300.0MethodPrep Method:
Analysis Method:
Lab CodeSample NameDate
AnalyzedDate
ExtractedDil.MRLResult Q
Riverside PK 01/13/16 09:54 1/13/1620.20 UNDK1600294-001Method Blank 01/13/16 09:40 1/13/1610.10 UNDK1600294-MB1
Analytical Report
ALS Group USA, Corp. dba ALS Environmental
Printed 1/21/2016 3:33:11 PM 16-0000361103 rev 00Superset Reference:
Page 28 of 108
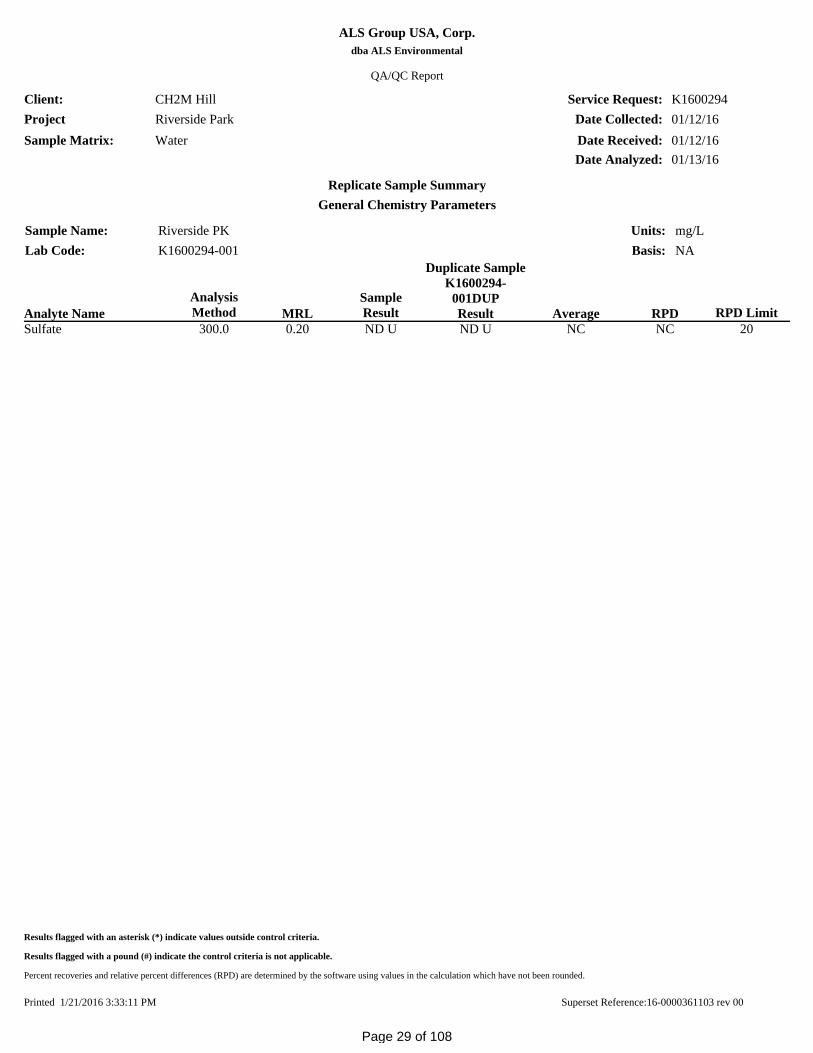
ALS Group USA, Corp.
QA/QC Report
Client:ProjectSample Matrix: Water
Riverside ParkCH2M Hill Service Request: K1600294
01/12/16Date Collected:Date Received: 01/12/16
01/13/16Date Analyzed:
Replicate Sample SummaryGeneral Chemistry Parameters
Riverside PK mg/LBasis:Units:
K1600294-001 NALab Code:Sample Name:
RPD LimitMRLAnalysis Method RPD
Duplicate SampleK1600294-
001DUP Result Average
SampleResultAnalyte Name
dba ALS Environmental
Sulfate NC 0.20 ND U ND U NC 20300.0
Results flagged with an asterisk (*) indicate values outside control criteria.
Results flagged with a pound (#) indicate the control criteria is not applicable.
Percent recoveries and relative percent differences (RPD) are determined by the software using values in the calculation which have not been rounded.
Printed 1/21/2016 3:33:11 PM 16-0000361103 rev 00Superset Reference:
Page 29 of 108

QA/QC Report
mg/LK1600294-001 Basis:Lab Code:
Units:Sample Name: Riverside PK
SulfateDuplicate Matrix Spike Summary
NA
Client:Project:Sample Matrix:
CH2M HillRiverside ParkWater
Service Request:
Date Analyzed:Date Received:
K1600294
01/13/1601/12/16
Date Collected: 01/12/16
Method300.0
Prep Method:Analysis Method:
Analyte NameRPD LimitRPDResult
Sample Result
Spike Amount % Rec
Matrix SpikeK1600294-001MS K1600294-001DMS
Duplicate Matrix Spike
% RecSpike
AmountResult% Rec Limits
ALS Group USA, Corp.dba ALS Environmental
01/13/16Date Extracted:
Sulfate ND U 9.36 10.0 94 9.34 10.0 93 90-110 <1 20
Results flagged with an asterisk (*) indicate values outside control criteria.
Results flagged with a pound (#) indicate the control criteria is not applicable.
Percent recoveries and relative percent differences (RPD) are determined by the software using values in the calculation which have not been rounded.
Printed 1/21/2016 3:33:11 PM 16-0000361103 rev 00Superset Reference:
Page 30 of 108
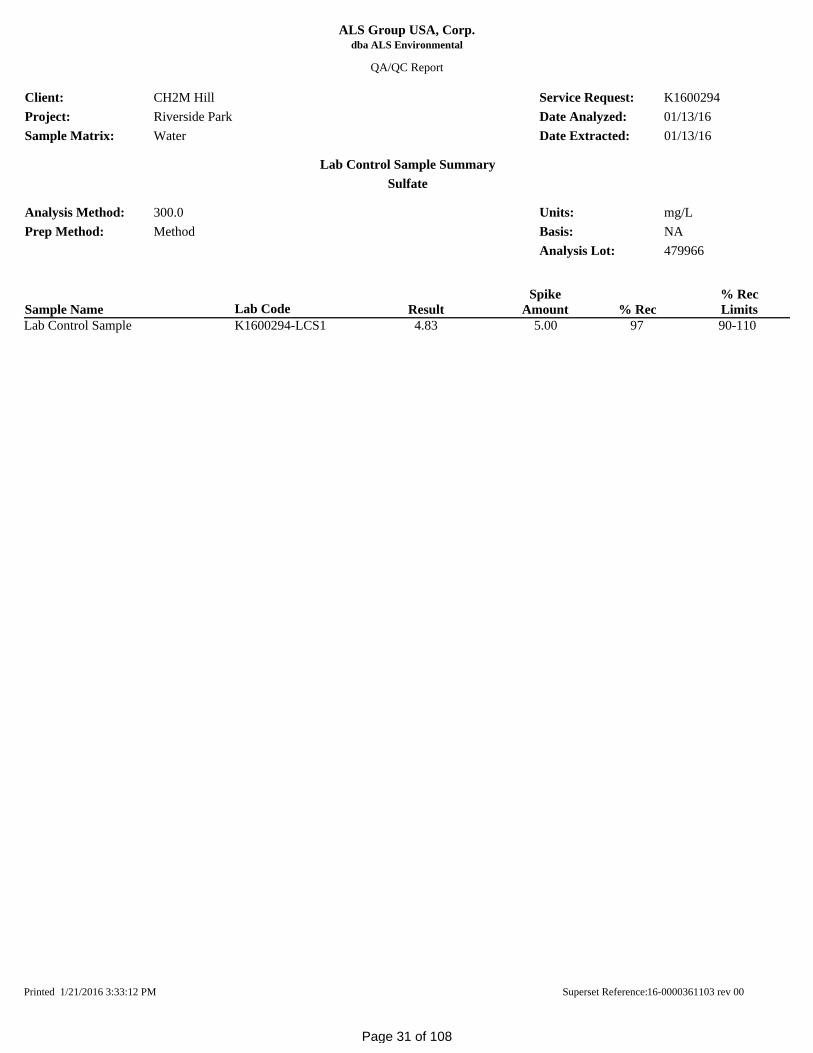
Sample Name
K1600294Date Analyzed:Service Request:
WaterRiverside ParkCH2M Hill
Sample Matrix:Project:Client:
Lab Control Sample SummarySulfate
Analysis Method:Prep Method:
300.0Method NA
mg/LBasis:Units:
Analysis Lot: 479966
01/13/16
Spike AmountResult % Rec
% Rec Limits
01/13/16Date Extracted:
Lab Code
dba ALS EnvironmentalALS Group USA, Corp.
QA/QC Report
Lab Control Sample 90-11097 5.004.83K1600294-LCS1
16-0000361103 rev 00Superset Reference:Printed 1/21/2016 3:33:12 PM
Page 31 of 108

Client:
01/12/16
K1600294
Date Received:Date Collected:
Service Request:
WaterRiverside ParkCH2M Hill
Sample Matrix:Project: 01/12/16
Cyanide, Total
Basis:Units: mg/L
NA335.4MethodPrep Method:
Analysis Method:
Lab CodeSample NameDate
AnalyzedDate
ExtractedDil.MRLResult Q
Riverside PK 01/20/16 09:18 1/19/1610.010 UNDK1600294-001Method Blank 01/20/16 09:18 1/19/1610.010 UNDK1600294-MB1
Analytical Report
ALS Group USA, Corp. dba ALS Environmental
Printed 1/21/2016 3:33:12 PM 16-0000361103 rev 00Superset Reference:
Page 32 of 108

ALS Group USA, Corp.
QA/QC Report
Client:ProjectSample Matrix: Water
Riverside ParkCH2M Hill Service Request: K1600294
01/12/16Date Collected:Date Received: 01/12/16
01/20/16Date Analyzed:
Replicate Sample SummaryGeneral Chemistry Parameters
Riverside PK mg/LBasis:Units:
K1600294-001 NALab Code:Sample Name:
RPD LimitMRLAnalysis Method RPD
Duplicate SampleK1600294-
001DUP Result Average
SampleResultAnalyte Name
dba ALS Environmental
Cyanide, Total NC 0.010 ND U ND U NC 20335.4
Results flagged with an asterisk (*) indicate values outside control criteria.
Results flagged with a pound (#) indicate the control criteria is not applicable.
Percent recoveries and relative percent differences (RPD) are determined by the software using values in the calculation which have not been rounded.
Printed 1/21/2016 3:33:12 PM 16-0000361103 rev 00Superset Reference:
Page 33 of 108
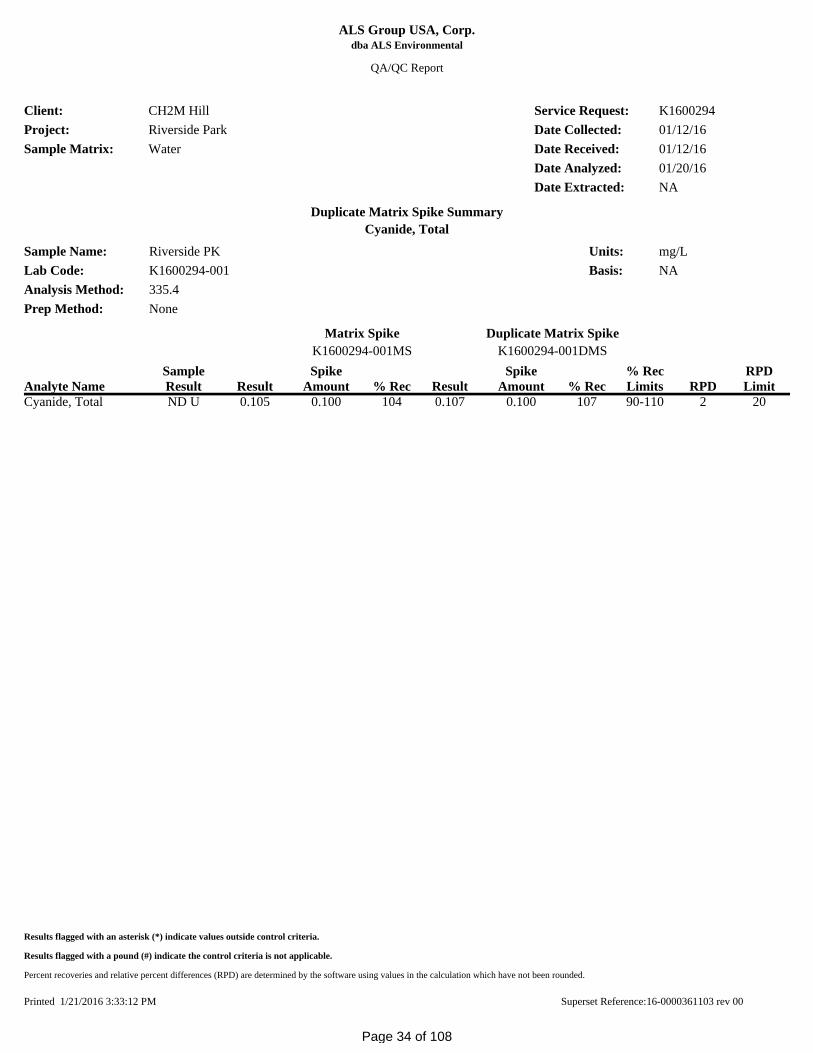
QA/QC Report
mg/LK1600294-001 Basis:Lab Code:
Units:Sample Name: Riverside PK
Cyanide, TotalDuplicate Matrix Spike Summary
NA
Client:Project:Sample Matrix:
CH2M HillRiverside ParkWater
Service Request:
Date Analyzed:Date Received:
K1600294
01/20/1601/12/16
Date Collected: 01/12/16
None335.4
Prep Method:Analysis Method:
Analyte NameRPD LimitRPDResult
Sample Result
Spike Amount % Rec
Matrix SpikeK1600294-001MS K1600294-001DMS
Duplicate Matrix Spike
% RecSpike
AmountResult% Rec Limits
ALS Group USA, Corp.dba ALS Environmental
NADate Extracted:
Cyanide, Total ND U 0.107 0.100 107 0.105 0.100 104 90-110 2 20
Results flagged with an asterisk (*) indicate values outside control criteria.
Results flagged with a pound (#) indicate the control criteria is not applicable.
Percent recoveries and relative percent differences (RPD) are determined by the software using values in the calculation which have not been rounded.
Printed 1/21/2016 3:33:12 PM 16-0000361103 rev 00Superset Reference:
Page 34 of 108

Sample Name
K1600294Date Analyzed:Service Request:
WaterRiverside ParkCH2M Hill
Sample Matrix:Project:Client:
Lab Control Sample SummaryCyanide, Total
Analysis Method:Prep Method:
335.4None NA
mg/LBasis:Units:
Analysis Lot: 480624
01/20/16
Spike AmountResult % Rec
% Rec Limits
NADate Extracted:
Lab Code
dba ALS EnvironmentalALS Group USA, Corp.
QA/QC Report
Lab Control Sample 90-11092 0.1500.138K1600294-LCS1
16-0000361103 rev 00Superset Reference:Printed 1/21/2016 3:33:12 PM
Page 35 of 108

Client:
01/12/16
K1600294
Date Received:Date Collected:
Service Request:
WaterRiverside ParkCH2M Hill
Sample Matrix:Project: 01/12/16
Oxidation-Reduction Potential (ORP)
Basis:Units: mV
NAASTM D1498-00NonePrep Method:
Analysis Method:
Lab CodeSample NameDate
AnalyzedDil.MRLResult Q
Riverside PK 01/12/16 16:301--79.65 HK1600294-001
Analytical Report
ALS Group USA, Corp. dba ALS Environmental
Printed 1/21/2016 3:33:13 PM 16-0000361103 rev 00Superset Reference:
Page 36 of 108

ALS Group USA, Corp.
QA/QC Report
Client:ProjectSample Matrix: Water
Riverside ParkCH2M Hill Service Request: K1600294
01/12/16Date Collected:Date Received: 01/12/16
01/12/16Date Analyzed:
Replicate Sample SummaryGeneral Chemistry Parameters
Riverside PK mVBasis:Units:
K1600294-001 NALab Code:Sample Name:
RPD LimitMRLAnalysis Method RPD
Duplicate Sample
K1600294-001DUP Result Average
SampleResultAnalyte Name
dba ALS Environmental
Oxidation-Reduction Potential (ORP) <1 - -79.7 -79.7 -79.7 20ASTM D1498-00
Results flagged with an asterisk (*) indicate values outside control criteria.
Results flagged with a pound (#) indicate the control criteria is not applicable.
Percent recoveries and relative percent differences (RPD) are determined by the software using values in the calculation which have not been rounded.
Printed 1/22/2016 10:35:44 AM 16-0000361103 rev 00Superset Reference:
Page 37 of 108

Sample Name
K1600294Date Analyzed:Service Request:
WaterRiverside ParkCH2M Hill
Sample Matrix:Project:Client:
Lab Control Sample SummaryOxidation-Reduction Potential (ORP)
Analysis Method:Prep Method:
ASTM D1498-00None NA
mVBasis:Units:
Analysis Lot: 479738
01/12/16
Spike AmountResult % Rec
% Rec Limits
NADate Extracted:
Lab Code
dba ALS EnvironmentalALS Group USA, Corp.
QA/QC Report
Lab Control Sample 85-11595 480457K1600294-LCS1Lab Control Sample 85-11595 480456K1600294-LCS2
16-0000361103 rev 00Superset Reference:Printed 1/21/2016 3:33:13 PM
Page 38 of 108
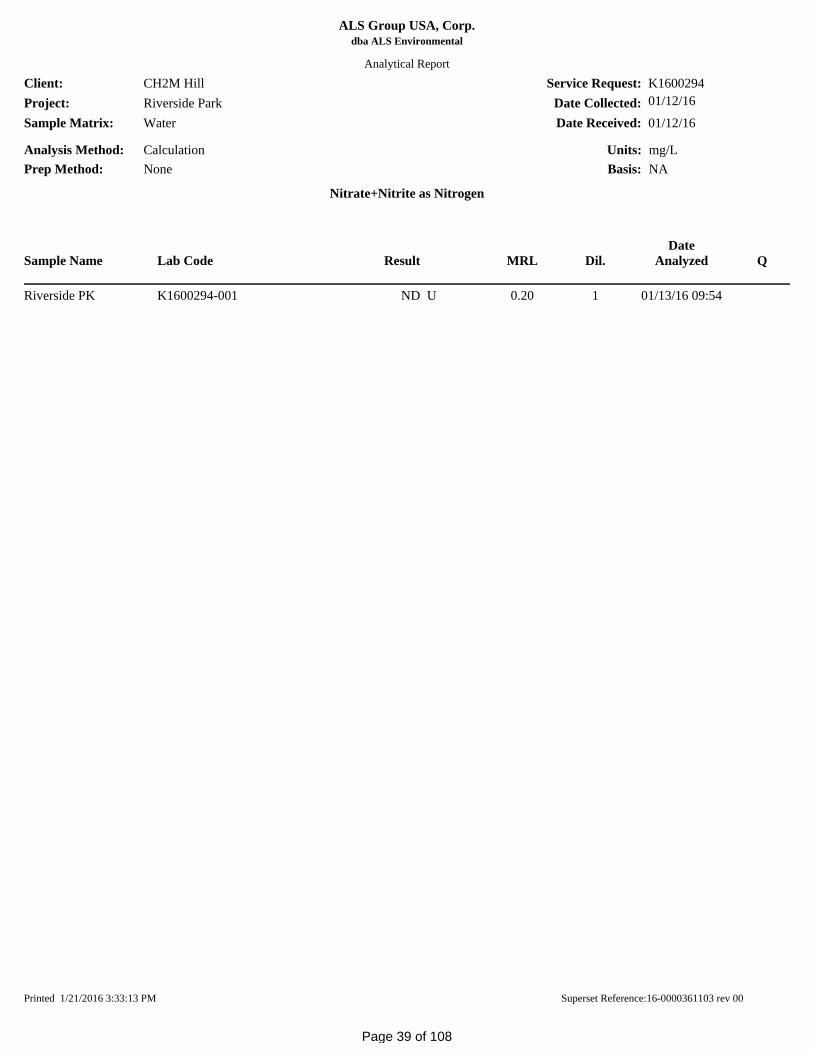
Client:
01/12/16
K1600294
Date Received:Date Collected:
Service Request:
WaterRiverside ParkCH2M Hill
Sample Matrix:Project: 01/12/16
Nitrate+Nitrite as Nitrogen
Basis:Units: mg/L
NACalculationNonePrep Method:
Analysis Method:
Lab CodeSample NameDate
AnalyzedDil.MRLResult Q
Riverside PK 01/13/16 09:5410.20 UNDK1600294-001
Analytical Report
ALS Group USA, Corp. dba ALS Environmental
Printed 1/21/2016 3:33:13 PM 16-0000361103 rev 00Superset Reference:
Page 39 of 108

Client:
01/12/16
K1600294
Date Received:Date Collected:
Service Request:
WaterRiverside ParkCH2M Hill
Sample Matrix:Project: 01/12/16
Color
Basis:Units: ColorUnits
NASM 2120 BNonePrep Method:
Analysis Method:
Lab CodeSample NameDate
AnalyzedDil.MRLResult Q
Riverside PK 01/13/16 09:5615.035.0K1600294-001Method Blank 01/13/16 09:4615.0 UNDK1600294-MB1
Analytical Report
ALS Group USA, Corp. dba ALS Environmental
Printed 1/21/2016 3:33:13 PM 16-0000361103 rev 00Superset Reference:
Page 40 of 108

ALS Group USA, Corp.
QA/QC Report
Client:ProjectSample Matrix: Water
Riverside ParkCH2M Hill Service Request: K1600294
01/12/16Date Collected:Date Received: 01/12/16
01/13/16Date Analyzed:
Replicate Sample SummaryGeneral Chemistry Parameters
Riverside PK ColorUnitsBasis:Units:
K1600294-001 NALab Code:Sample Name:
RPD LimitMRLAnalysis Method RPD
Duplicate Sample
K1600294-001DUP Result Average
SampleResultAnalyte Name
dba ALS Environmental
Color <1 5.0 35.0 35.0 35.0 20SM 2120 B
Results flagged with an asterisk (*) indicate values outside control criteria.
Results flagged with a pound (#) indicate the control criteria is not applicable.
Percent recoveries and relative percent differences (RPD) are determined by the software using values in the calculation which have not been rounded.
Printed 1/21/2016 3:33:14 PM 16-0000361103 rev 00Superset Reference:
Page 41 of 108

Sample Name
K1600294Date Analyzed:Service Request:
WaterRiverside ParkCH2M Hill
Sample Matrix:Project:Client:
Lab Control Sample SummaryColor
Analysis Method:Prep Method:
SM 2120 BNone NA
ColorUnitsBasis:Units:
Analysis Lot: 479803
01/13/16
Spike AmountResult % Rec
% Rec Limits
NADate Extracted:
Lab Code
dba ALS EnvironmentalALS Group USA, Corp.
QA/QC Report
Lab Control Sample 85-115100 50.050.0K1600294-LCS1
16-0000361103 rev 00Superset Reference:Printed 1/21/2016 3:33:14 PM
Page 42 of 108

Client:
01/12/16
K1600294
Date Received:Date Collected:
Service Request:
WaterRiverside ParkCH2M Hill
Sample Matrix:Project: 01/12/16
Conductivity at 25 Degrees Celsius
Basis:Units: uMHOS/cm
NASM 2510 BNonePrep Method:
Analysis Method:
Lab CodeSample NameDate
AnalyzedDil.MRLResult Q
Riverside PK 01/18/16 11:0312.0218K1600294-001Method Blank 01/18/16 11:0312.0 UNDK1600294-MB1Method Blank 01/18/16 11:0312.0 UNDK1600294-MB2
Analytical Report
ALS Group USA, Corp. dba ALS Environmental
Printed 1/21/2016 3:33:14 PM 16-0000361103 rev 00Superset Reference:
Page 43 of 108

ALS Group USA, Corp.
QA/QC Report
Client:ProjectSample Matrix: Water
Riverside ParkCH2M Hill Service Request: K1600294
01/12/16Date Collected:Date Received: 01/12/16
01/18/16Date Analyzed:
Replicate Sample SummaryGeneral Chemistry Parameters
Riverside PK uMHOS/cmBasis:Units:
K1600294-001 NALab Code:Sample Name:
RPD LimitMRLAnalysis Method RPD
Duplicate Sample
K1600294-001DUP Result Average
SampleResultAnalyte Name
dba ALS Environmental
Conductivity at 25 Degrees Celsius <1 2.0 218 218 218 20SM 2510 B
Results flagged with an asterisk (*) indicate values outside control criteria.
Results flagged with a pound (#) indicate the control criteria is not applicable.
Percent recoveries and relative percent differences (RPD) are determined by the software using values in the calculation which have not been rounded.
Printed 1/21/2016 3:33:14 PM 16-0000361103 rev 00Superset Reference:
Page 44 of 108
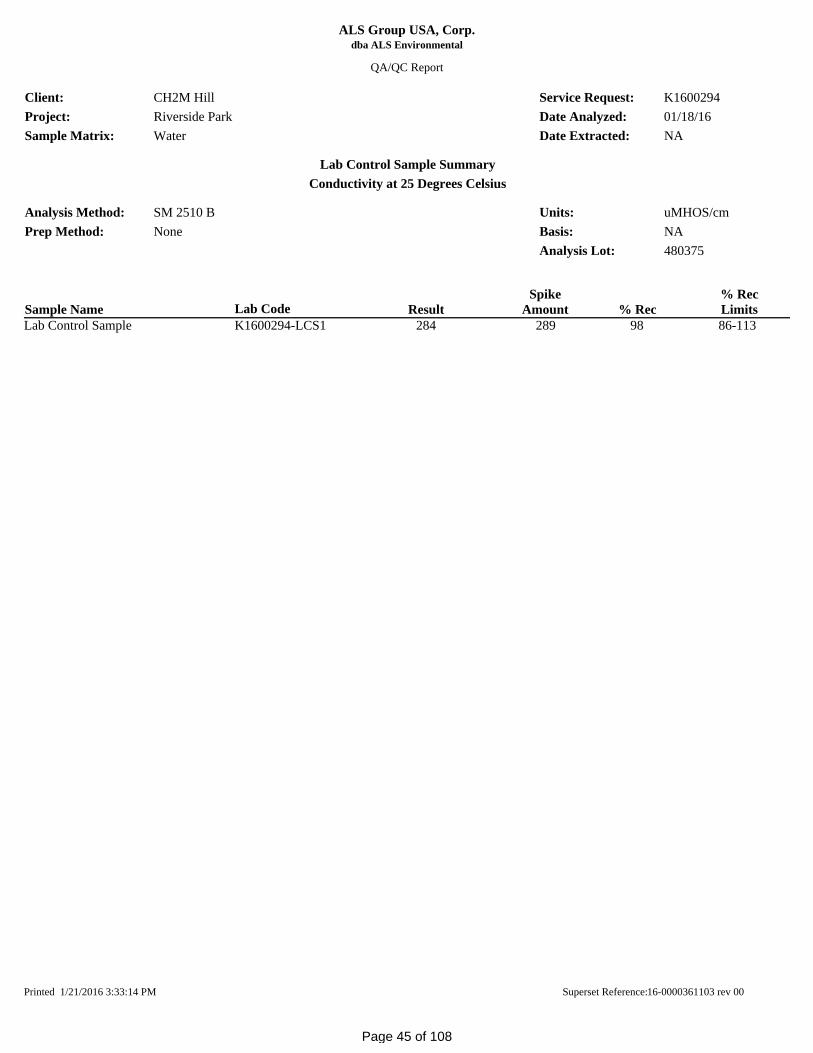
Sample Name
K1600294Date Analyzed:Service Request:
WaterRiverside ParkCH2M Hill
Sample Matrix:Project:Client:
Lab Control Sample SummaryConductivity at 25 Degrees Celsius
Analysis Method:Prep Method:
SM 2510 BNone NA
uMHOS/cmBasis:Units:
Analysis Lot: 480375
01/18/16
Spike AmountResult % Rec
% Rec Limits
NADate Extracted:
Lab Code
dba ALS EnvironmentalALS Group USA, Corp.
QA/QC Report
Lab Control Sample 86-11398 289284K1600294-LCS1
16-0000361103 rev 00Superset Reference:Printed 1/21/2016 3:33:14 PM
Page 45 of 108
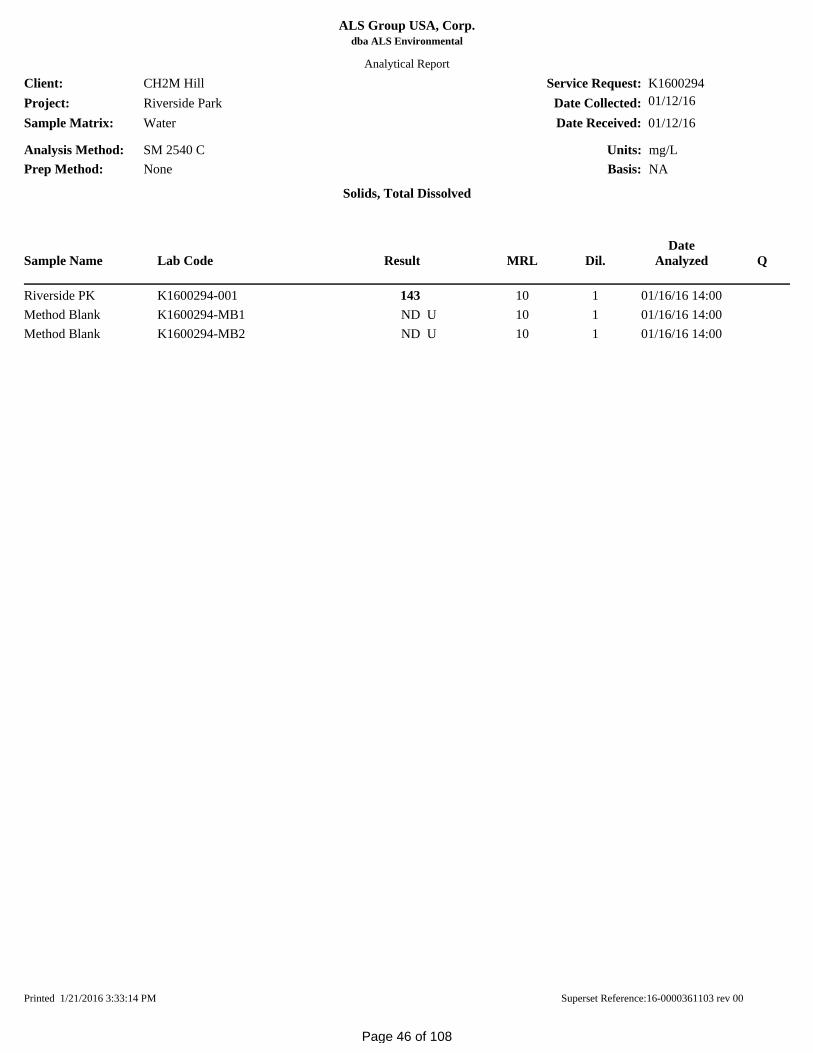
Client:
01/12/16
K1600294
Date Received:Date Collected:
Service Request:
WaterRiverside ParkCH2M Hill
Sample Matrix:Project: 01/12/16
Solids, Total Dissolved
Basis:Units: mg/L
NASM 2540 CNonePrep Method:
Analysis Method:
Lab CodeSample NameDate
AnalyzedDil.MRLResult Q
Riverside PK 01/16/16 14:00110143K1600294-001Method Blank 01/16/16 14:00110 UNDK1600294-MB1Method Blank 01/16/16 14:00110 UNDK1600294-MB2
Analytical Report
ALS Group USA, Corp. dba ALS Environmental
Printed 1/21/2016 3:33:14 PM 16-0000361103 rev 00Superset Reference:
Page 46 of 108

ALS Group USA, Corp.dba ALS Environmental
QA/QC Report
Client:ProjectSample Matrix:
Prep Method:Analysis Method:
CH2M HillRiverside ParkWater
SM 2540 CNone
Service Request:Date Collected:Date Received:
Basis:Units:
K160029401/12/1601/12/16
mg/LNA
Replicate Sample SummarySolids, Total Dissolved
Sample Name: Lab Code:Date
AnalyzedRPDLimitMRL RPD
DuplicateResult Average
SampleResult
<1 10 143 144 144 10Riverside PK K1600294-001DUP 01/16/167 10 126 117 122 10Batch QC K1600389-001DUP 01/16/16
Results flagged with an asterisk (*) indicate values outside control criteria.
Results flagged with a pound (#) indicate the control criteria is not applicable.
Percent recoveries and relative percent differences (RPD) are determined by the software using values in the calculation which have not been rounded.
Printed 1/21/2016 3:33:14 PM 16-0000361103 rev 00Superset Reference:
Page 47 of 108

Sample Name
K1600294Date Analyzed:Service Request:
WaterRiverside ParkCH2M Hill
Sample Matrix:Project:Client:
Lab Control Sample SummarySolids, Total Dissolved
Analysis Method:Prep Method:
SM 2540 CNone NA
mg/LBasis:Units:
Analysis Lot: 480051
01/16/16
Spike AmountResult % Rec
% Rec Limits
NADate Extracted:
Lab Code
dba ALS EnvironmentalALS Group USA, Corp.
QA/QC Report
Lab Control Sample 85-11591 714650K1600294-LCS1
16-0000361103 rev 00Superset Reference:Printed 1/21/2016 3:33:14 PM
Page 48 of 108

Client:
01/12/16
K1600294
Date Received:Date Collected:
Service Request:
WaterRiverside ParkCH2M Hill
Sample Matrix:Project: 01/12/16
Fluoride
Basis:Units: mg/L
NASM 4500-F- C ModifiedNonePrep Method:
Analysis Method:
Lab CodeSample NameDate
AnalyzedDil.MRLResult Q
Riverside PK 01/19/16 10:0010.20 UNDK1600294-001Method Blank 01/19/16 10:0010.20 UNDK1600294-MB1
Analytical Report
ALS Group USA, Corp. dba ALS Environmental
Printed 1/21/2016 3:33:15 PM 16-0000361103 rev 00Superset Reference:
Page 49 of 108

ALS Group USA, Corp.
QA/QC Report
Client:ProjectSample Matrix: Water
Riverside ParkCH2M Hill Service Request: K1600294
01/12/16Date Collected:Date Received: 01/12/16
01/19/16Date Analyzed:
Replicate Sample SummaryGeneral Chemistry Parameters
Riverside PK mg/LBasis:Units:
K1600294-001 NALab Code:Sample Name:
RPD LimitMRLAnalysis Method RPD
Duplicate Sample
K1600294-001DUP Result Average
SampleResultAnalyte Name
dba ALS Environmental
Fluoride NC 0.20 ND U ND U NC 20SM 4500-F- C Modified
Results flagged with an asterisk (*) indicate values outside control criteria.
Results flagged with a pound (#) indicate the control criteria is not applicable.
Percent recoveries and relative percent differences (RPD) are determined by the software using values in the calculation which have not been rounded.
Printed 1/21/2016 3:33:15 PM 16-0000361103 rev 00Superset Reference:
Page 50 of 108

QA/QC Report
mg/LK1600294-001 Basis:Lab Code:
Units:Sample Name: Riverside PK
FluorideMatrix Spike Summary
NA
Client:Project:Sample Matrix:
CH2M HillRiverside ParkWater
Service Request:
Date Analyzed:Date Received:
K1600294
01/19/1601/12/16
Date Collected: 01/12/16
NoneSM 4500-F- C Modified
Prep Method:Analysis Method:
Analyte Name ResultSample Result Spike Amount % Rec
Matrix SpikeK1600294-001MS
% Rec Limits
ALS Group USA, Corp.dba ALS Environmental
NADate Extracted:
Fluoride ND U 26.5 25.0 106 74-128
Results flagged with an asterisk (*) indicate values outside control criteria.
Results flagged with a pound (#) indicate the control criteria is not applicable.
Percent recoveries and relative percent differences (RPD) are determined by the software using values in the calculation which have not been rounded.
Printed 1/21/2016 3:33:15 PM 16-0000361103 rev 00Superset Reference:
Page 51 of 108

Sample Name
K1600294Date Analyzed:Service Request:
WaterRiverside ParkCH2M Hill
Sample Matrix:Project:Client:
Lab Control Sample SummaryFluoride
Analysis Method:Prep Method:
SM 4500-F- C ModifiedNone NA
mg/LBasis:Units:
Analysis Lot: 480535
01/19/16
Spike AmountResult % Rec
% Rec Limits
NADate Extracted:
Lab Code
dba ALS EnvironmentalALS Group USA, Corp.
QA/QC Report
Lab Control Sample 87-117108 8.529.20K1600294-LCS1
16-0000361103 rev 00Superset Reference:Printed 1/21/2016 3:33:15 PM
Page 52 of 108

Client:
01/12/16
K1600294
Date Received:Date Collected:
Service Request:
WaterRiverside ParkCH2M Hill
Sample Matrix:Project: 01/12/16
pH
Basis:Units: pH Units
NASM 4500-H+ BNonePrep Method:
Analysis Method:
Lab CodeSample NameDate
AnalyzedDil.MRLResult Q
Riverside PK 01/13/16 10:231-6.79 HK1600294-001
Analytical Report
ALS Group USA, Corp. dba ALS Environmental
Printed 1/21/2016 3:33:15 PM 16-0000361103 rev 00Superset Reference:
Page 53 of 108

ALS Group USA, Corp.
QA/QC Report
Client:ProjectSample Matrix: Water
Riverside ParkCH2M Hill Service Request: K1600294
01/12/16Date Collected:Date Received: 01/12/16
01/13/16Date Analyzed:
Replicate Sample SummaryGeneral Chemistry Parameters
Riverside PK pH UnitsBasis:Units:
K1600294-001 NALab Code:Sample Name:
RPD LimitMRLAnalysis Method RPD
Duplicate Sample
K1600294-001DUP Result Average
SampleResultAnalyte Name
dba ALS Environmental
pH <1 - 6.79 6.80 6.80 20SM 4500-H+ B
Results flagged with an asterisk (*) indicate values outside control criteria.
Results flagged with a pound (#) indicate the control criteria is not applicable.
Percent recoveries and relative percent differences (RPD) are determined by the software using values in the calculation which have not been rounded.
Printed 1/21/2016 3:33:15 PM 16-0000361103 rev 00Superset Reference:
Page 54 of 108

Sample Name
K1600294Date Analyzed:Service Request:
WaterRiverside ParkCH2M Hill
Sample Matrix:Project:Client:
Lab Control Sample SummarypH
Analysis Method:Prep Method:
SM 4500-H+ BNone NA
pH UnitsBasis:Units:
Analysis Lot: 479839
01/13/16
Spike AmountResult % Rec
% Rec Limits
NADate Extracted:
Lab Code
dba ALS EnvironmentalALS Group USA, Corp.
QA/QC Report
Lab Control Sample 85-115100 8.328.28K1600294-LCS1
16-0000361103 rev 00Superset Reference:Printed 1/21/2016 3:33:16 PM
Page 55 of 108
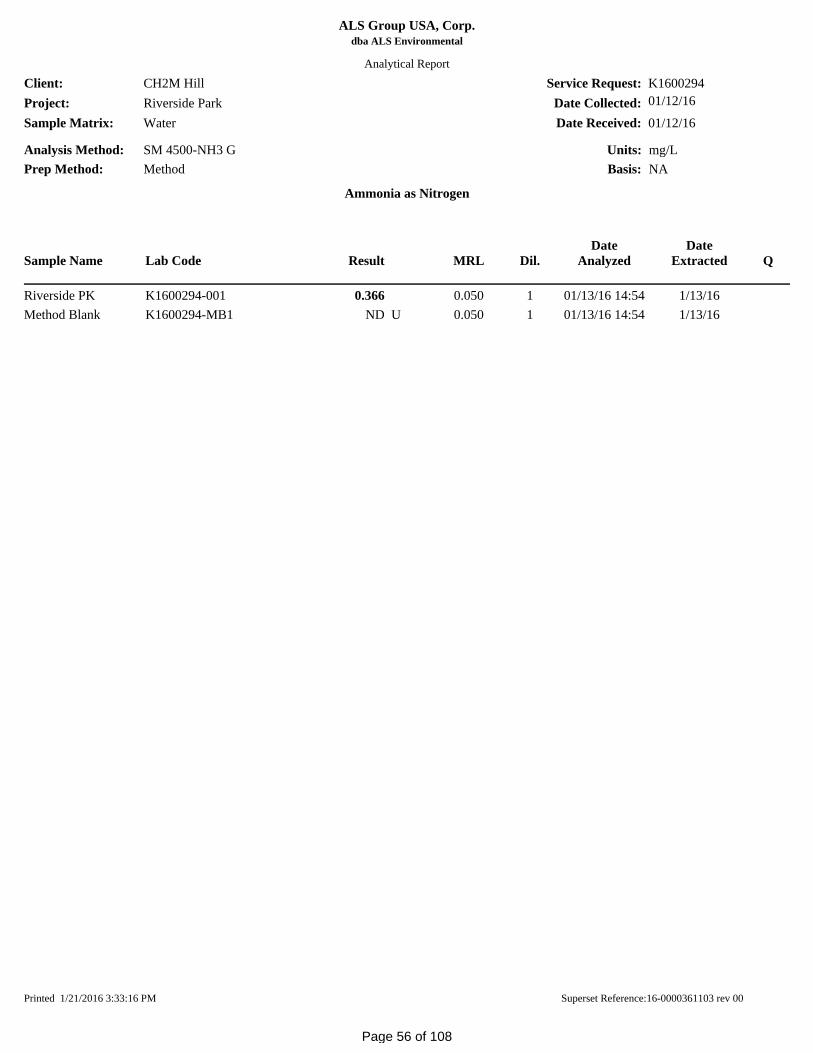
Client:
01/12/16
K1600294
Date Received:Date Collected:
Service Request:
WaterRiverside ParkCH2M Hill
Sample Matrix:Project: 01/12/16
Ammonia as Nitrogen
Basis:Units: mg/L
NASM 4500-NH3 GMethodPrep Method:
Analysis Method:
Lab CodeSample NameDate
AnalyzedDate
ExtractedDil.MRLResult Q
Riverside PK 01/13/16 14:54 1/13/1610.0500.366K1600294-001Method Blank 01/13/16 14:54 1/13/1610.050 UNDK1600294-MB1
Analytical Report
ALS Group USA, Corp. dba ALS Environmental
Printed 1/21/2016 3:33:16 PM 16-0000361103 rev 00Superset Reference:
Page 56 of 108

ALS Group USA, Corp.dba ALS Environmental
QA/QC Report
Client:ProjectSample Matrix:
Prep Method:Analysis Method:
CH2M HillRiverside ParkWater
SM 4500-NH3 GMethod
Service Request:Date Collected:Date Received:
Basis:Units:
K160029401/12/1601/12/16
mg/LNA
Replicate Sample SummaryAmmonia as Nitrogen
Sample Name: Lab Code:Date
AnalyzedRPDLimitMRL RPD
DuplicateResult Average
SampleResult
2 0.050 0.366 0.373 0.370 20Riverside PK K1600294-001DUP 01/13/16
Results flagged with an asterisk (*) indicate values outside control criteria.
Results flagged with a pound (#) indicate the control criteria is not applicable.
Percent recoveries and relative percent differences (RPD) are determined by the software using values in the calculation which have not been rounded.
Printed 1/21/2016 3:34:06 PM 16-0000361103 rev 00Superset Reference:
Page 57 of 108

QA/QC Report
mg/LK1600294-001 Basis:Lab Code:
Units:Sample Name: Riverside PK
Ammonia as NitrogenDuplicate Matrix Spike Summary
NA
Client:Project:Sample Matrix:
CH2M HillRiverside ParkWater
Service Request:
Date Analyzed:Date Received:
K1600294
01/13/1601/12/16
Date Collected: 01/12/16
MethodSM 4500-NH3 G
Prep Method:Analysis Method:
Analyte NameRPD LimitRPDResult
Sample Result
Spike Amount % Rec
Matrix SpikeK1600294-001MS K1600294-001DMS
Duplicate Matrix Spike
% RecSpike
AmountResult% Rec Limits
ALS Group USA, Corp.dba ALS Environmental
01/13/16Date Extracted:
Ammonia as Nitrogen 0.366 2.49 2.00 106 2.42 2.00 103 90-110 3 20
Results flagged with an asterisk (*) indicate values outside control criteria.
Results flagged with a pound (#) indicate the control criteria is not applicable.
Percent recoveries and relative percent differences (RPD) are determined by the software using values in the calculation which have not been rounded.
Printed 1/21/2016 3:34:09 PM 16-0000361103 rev 00Superset Reference:
Page 58 of 108

Sample Name
K1600294Date Analyzed:Service Request:
WaterRiverside ParkCH2M Hill
Sample Matrix:Project:Client:
Lab Control Sample SummaryAmmonia as Nitrogen
Analysis Method:Prep Method:
SM 4500-NH3 GMethod NA
mg/LBasis:Units:
Analysis Lot: 479836
01/13/16
Spike AmountResult % Rec
% Rec Limits
01/13/16Date Extracted:
Lab Code
dba ALS EnvironmentalALS Group USA, Corp.
QA/QC Report
Lab Control Sample 90-11099 1.621.61K1600294-LCS1
16-0000361103 rev 00Superset Reference:Printed 1/21/2016 3:33:16 PM
Page 59 of 108

Client:
01/12/16
K1600294
Date Received:Date Collected:
Service Request:
WaterRiverside ParkCH2M Hill
Sample Matrix:Project: 01/12/16
Oxygen, Dissolved
Basis:Units: mg/L
NASM 4500-O GNonePrep Method:
Analysis Method:
Lab CodeSample NameDate
AnalyzedDil.MRLResult Q
Riverside PK 01/12/16 16:3811.01.2 HK1600294-001
Analytical Report
ALS Group USA, Corp. dba ALS Environmental
Printed 1/21/2016 3:33:17 PM 16-0000361103 rev 00Superset Reference:
Page 60 of 108

ALS Group USA, Corp.
QA/QC Report
Client:ProjectSample Matrix: Water
Riverside ParkCH2M Hill Service Request: K1600294
01/12/16Date Collected:Date Received: 01/12/16
01/12/16Date Analyzed:
Replicate Sample SummaryGeneral Chemistry Parameters
Riverside PK mg/LBasis:Units:
K1600294-001 NALab Code:Sample Name:
RPD LimitMRLAnalysis Method RPD
Duplicate Sample
K1600294-001DUP Result Average
SampleResultAnalyte Name
dba ALS Environmental
Oxygen, Dissolved 13 1.0 1.2 1.0 1.09 20SM 4500-O G
Results flagged with an asterisk (*) indicate values outside control criteria.
Results flagged with a pound (#) indicate the control criteria is not applicable.
Percent recoveries and relative percent differences (RPD) are determined by the software using values in the calculation which have not been rounded.
Printed 1/21/2016 3:33:17 PM 16-0000361103 rev 00Superset Reference:
Page 61 of 108

Client:
01/12/16
K1600294
Date Received:Date Collected:
Service Request:
WaterRiverside ParkCH2M Hill
Sample Matrix:Project: 01/12/16
Orthophosphate as Phosphorus
Basis:Units: mg/L
NASM 4500-P ENonePrep Method:
Analysis Method:
Lab CodeSample NameDate
AnalyzedDil.MRLResult Q
Riverside PK 01/13/16 07:5510.0500.327K1600294-001Method Blank 01/13/16 07:5510.050 UNDK1600294-MB1
Analytical Report
ALS Group USA, Corp. dba ALS Environmental
Printed 1/21/2016 3:33:17 PM 16-0000361103 rev 00Superset Reference:
Page 62 of 108

ALS Group USA, Corp.
QA/QC Report
Client:ProjectSample Matrix: Water
Riverside ParkCH2M Hill Service Request: K1600294
01/12/16Date Collected:Date Received: 01/12/16
01/13/16Date Analyzed:
Replicate Sample SummaryGeneral Chemistry Parameters
Riverside PK mg/LBasis:Units:
K1600294-001 NALab Code:Sample Name:
RPD LimitMRLAnalysis Method RPD
Duplicate Sample
K1600294-001DUP Result Average
SampleResultAnalyte Name
dba ALS Environmental
Orthophosphate as Phosphorus <1 0.050 0.327 0.327 0.327 20SM 4500-P E
Results flagged with an asterisk (*) indicate values outside control criteria.
Results flagged with a pound (#) indicate the control criteria is not applicable.
Percent recoveries and relative percent differences (RPD) are determined by the software using values in the calculation which have not been rounded.
Printed 1/21/2016 3:33:17 PM 16-0000361103 rev 00Superset Reference:
Page 63 of 108
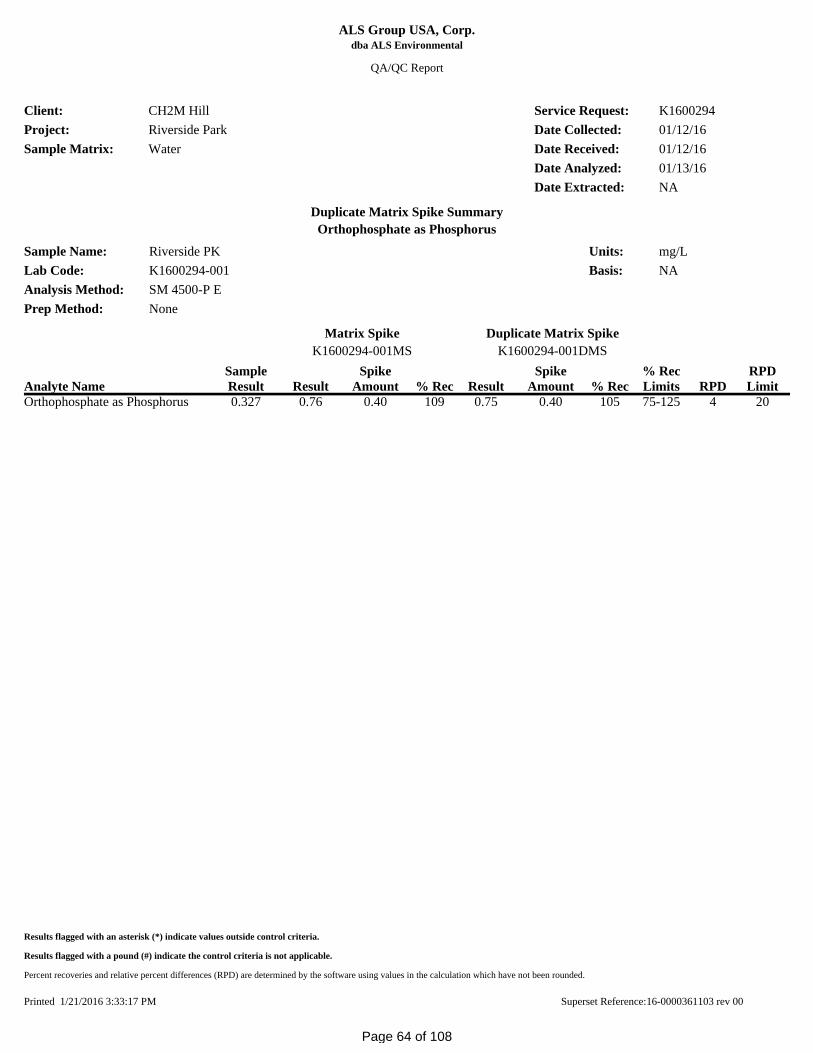
QA/QC Report
mg/LK1600294-001 Basis:Lab Code:
Units:Sample Name: Riverside PK
Orthophosphate as PhosphorusDuplicate Matrix Spike Summary
NA
Client:Project:Sample Matrix:
CH2M HillRiverside ParkWater
Service Request:
Date Analyzed:Date Received:
K1600294
01/13/1601/12/16
Date Collected: 01/12/16
NoneSM 4500-P E
Prep Method:Analysis Method:
Analyte NameRPD LimitRPDResult
Sample Result
Spike Amount % Rec
Matrix SpikeK1600294-001MS K1600294-001DMS
Duplicate Matrix Spike
% RecSpike
AmountResult% Rec Limits
ALS Group USA, Corp.dba ALS Environmental
NADate Extracted:
Orthophosphate as Phosphorus 0.327 0.75 0.40 105 0.76 0.40 109 75-125 4 20
Results flagged with an asterisk (*) indicate values outside control criteria.
Results flagged with a pound (#) indicate the control criteria is not applicable.
Percent recoveries and relative percent differences (RPD) are determined by the software using values in the calculation which have not been rounded.
Printed 1/21/2016 3:33:17 PM 16-0000361103 rev 00Superset Reference:
Page 64 of 108

Sample Name
K1600294Date Analyzed:Service Request:
WaterRiverside ParkCH2M Hill
Sample Matrix:Project:Client:
Lab Control Sample SummaryOrthophosphate as Phosphorus
Analysis Method:Prep Method:
SM 4500-P ENone NA
mg/LBasis:Units:
Analysis Lot: 479940
01/13/16
Spike AmountResult % Rec
% Rec Limits
NADate Extracted:
Lab Code
dba ALS EnvironmentalALS Group USA, Corp.
QA/QC Report
Lab Control Sample 85-115100 2.542.54K1600294-LCS1
16-0000361103 rev 00Superset Reference:Printed 1/21/2016 3:33:18 PM
Page 65 of 108

Client:
01/12/16
K1600294
Date Received:Date Collected:
Service Request:
WaterRiverside ParkCH2M Hill
Sample Matrix:Project: 01/12/16
Carbon, Total Organic
Basis:Units: mg/L
NASM 5310 CNonePrep Method:
Analysis Method:
Lab CodeSample NameDate
AnalyzedDil.MRLResult Q
Riverside PK 01/14/16 11:1910.502.30K1600294-001Method Blank 01/14/16 11:1910.50 UNDK1600294-MB1
Analytical Report
ALS Group USA, Corp. dba ALS Environmental
Printed 1/21/2016 3:33:18 PM 16-0000361103 rev 00Superset Reference:
Page 66 of 108
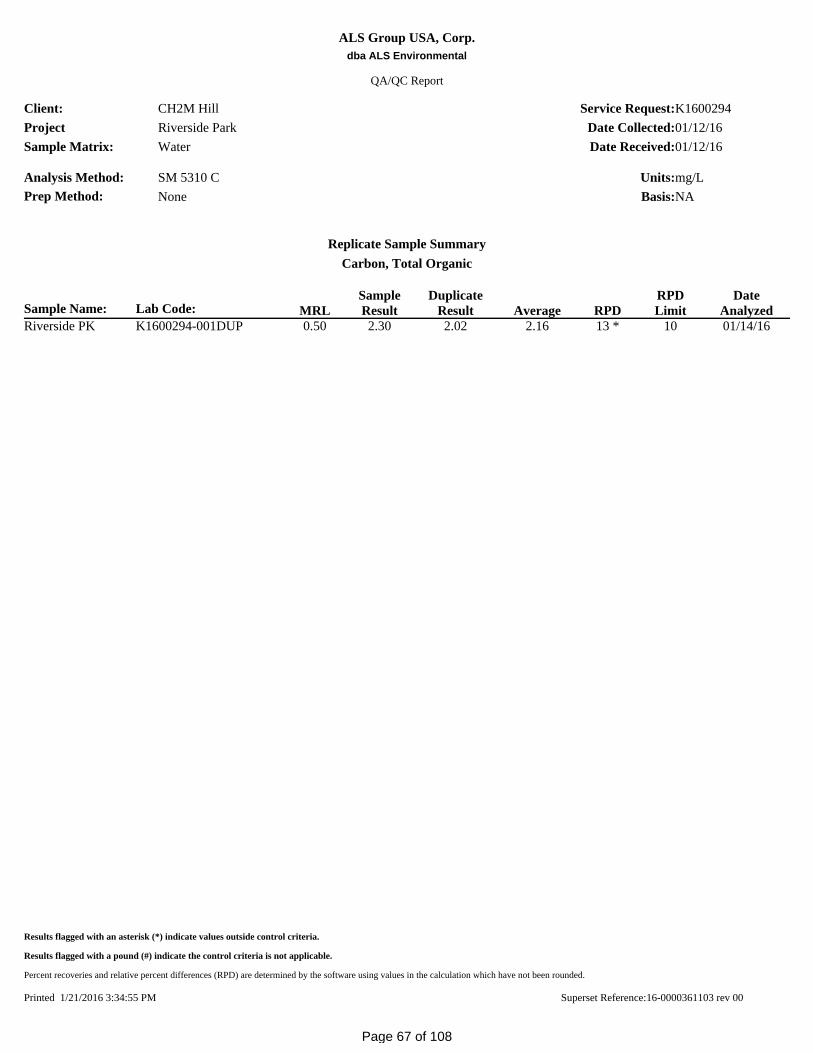
ALS Group USA, Corp.dba ALS Environmental
QA/QC Report
Client:ProjectSample Matrix:
Prep Method:Analysis Method:
CH2M HillRiverside ParkWater
SM 5310 CNone
Service Request:Date Collected:Date Received:
Basis:Units:
K160029401/12/1601/12/16
mg/LNA
Replicate Sample SummaryCarbon, Total Organic
Sample Name: Lab Code:Date
AnalyzedRPDLimitMRL RPD
DuplicateResult Average
SampleResult
13 *0.50 2.30 2.02 2.16 10Riverside PK K1600294-001DUP 01/14/16
Results flagged with an asterisk (*) indicate values outside control criteria.
Results flagged with a pound (#) indicate the control criteria is not applicable.
Percent recoveries and relative percent differences (RPD) are determined by the software using values in the calculation which have not been rounded.
Printed 1/21/2016 3:34:55 PM 16-0000361103 rev 00Superset Reference:
Page 67 of 108

QA/QC Report
mg/LK1600294-001 Basis:Lab Code:
Units:Sample Name: Riverside PK
Carbon, Total OrganicMatrix Spike Summary
NA
Client:Project:Sample Matrix:
CH2M HillRiverside ParkWater
Service Request:
Date Analyzed:Date Received:
K1600294
01/14/1601/12/16
Date Collected: 01/12/16
NoneSM 5310 C
Prep Method:Analysis Method:
Analyte Name ResultSample Result Spike Amount % Rec
Matrix SpikeK1600294-001MS
% Rec Limits
ALS Group USA, Corp.dba ALS Environmental
NADate Extracted:
Carbon, Total Organic 2.30 26.8 25.0 98 83-117
Results flagged with an asterisk (*) indicate values outside control criteria.
Results flagged with a pound (#) indicate the control criteria is not applicable.
Percent recoveries and relative percent differences (RPD) are determined by the software using values in the calculation which have not been rounded.
Printed 1/21/2016 3:34:43 PM 16-0000361103 rev 00Superset Reference:
Page 68 of 108

Sample Name
K1600294Date Analyzed:Service Request:
WaterRiverside ParkCH2M Hill
Sample Matrix:Project:Client:
Lab Control Sample SummaryCarbon, Total Organic
Analysis Method:Prep Method:
SM 5310 CNone NA
mg/LBasis:Units:
Analysis Lot: 479960
01/14/16
Spike AmountResult % Rec
% Rec Limits
NADate Extracted:
Lab Code
dba ALS EnvironmentalALS Group USA, Corp.
QA/QC Report
Lab Control Sample 83-11794 19.818.5K1600294-LCS1
16-0000361103 rev 00Superset Reference:Printed 1/21/2016 3:33:19 PM
Page 69 of 108
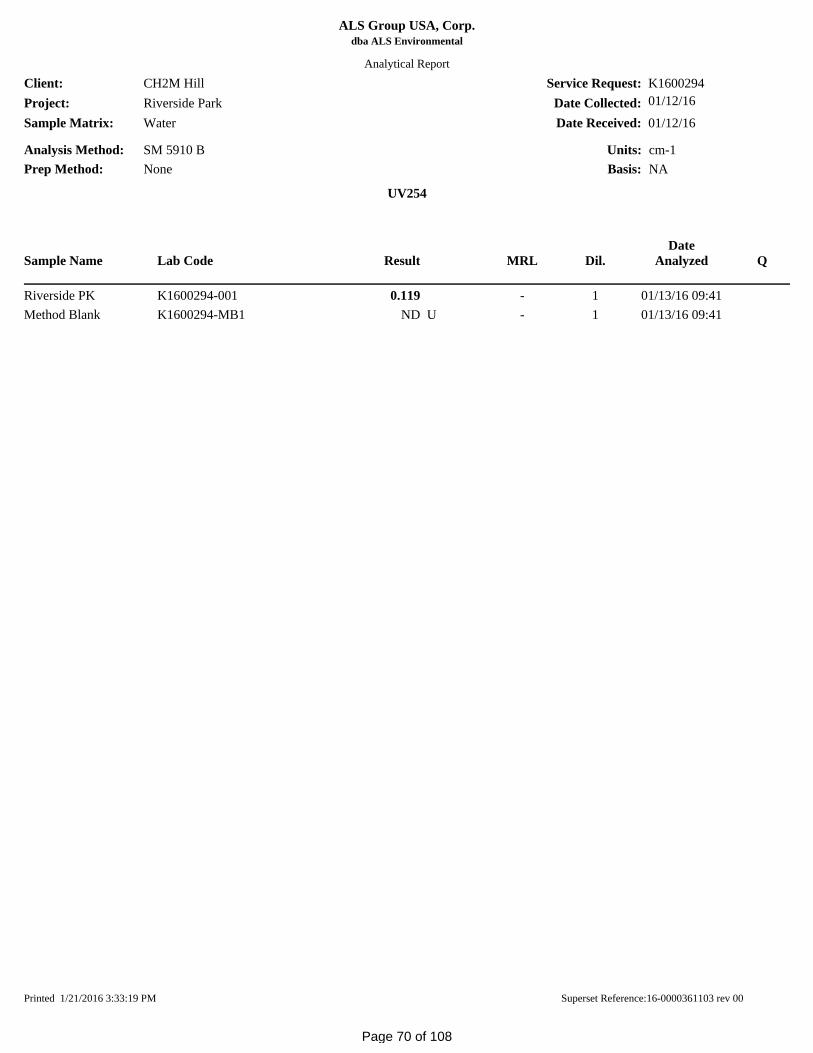
Client:
01/12/16
K1600294
Date Received:Date Collected:
Service Request:
WaterRiverside ParkCH2M Hill
Sample Matrix:Project: 01/12/16
UV254
Basis:Units: cm-1
NASM 5910 BNonePrep Method:
Analysis Method:
Lab CodeSample NameDate
AnalyzedDil.MRLResult Q
Riverside PK 01/13/16 09:411-0.119K1600294-001Method Blank 01/13/16 09:411- UNDK1600294-MB1
Analytical Report
ALS Group USA, Corp. dba ALS Environmental
Printed 1/21/2016 3:33:19 PM 16-0000361103 rev 00Superset Reference:
Page 70 of 108

ALS Group USA, Corp.
QA/QC Report
Client:ProjectSample Matrix: Water
Riverside ParkCH2M Hill Service Request: K1600294
01/12/16Date Collected:Date Received: 01/12/16
01/13/16Date Analyzed:
Replicate Sample SummaryGeneral Chemistry Parameters
Riverside PK cm-1Basis:Units:
K1600294-001 NALab Code:Sample Name:
RPD LimitMRLAnalysis Method RPD
Duplicate Sample
K1600294-001DUP Result Average
SampleResultAnalyte Name
dba ALS Environmental
UV254 <1 - 0.119 0.120 0.120 20SM 5910 B
Results flagged with an asterisk (*) indicate values outside control criteria.
Results flagged with a pound (#) indicate the control criteria is not applicable.
Percent recoveries and relative percent differences (RPD) are determined by the software using values in the calculation which have not been rounded.
Printed 1/21/2016 3:33:19 PM 16-0000361103 rev 00Superset Reference:
Page 71 of 108

Metals
ALS Environmental—Kelso Laboratory 1317 South 13th Avenue, Kelso, WA 98626 Phone (360)577-7222 Fax (360)636-1068 www.alsglobal.com
RIGHT SOLUTIONS | RIGHT PARTNER
Page 72 of 108

ALS Group USA, Corp.dba ALS Environmental
Analytical Report
Client: CH2M Hill Service Request: K1600294
Project: Riverside Park Date Collected: 01/12/16
Sample Matrix: Water Date Received: 01/12/16
Hardness as CaCO3
Prep Method: CLAA Units: mg/L (ppm)
Analysis Method: 200.7/SM 2340B Basis: NA
Test Notes:
Dilution Date Date ResultSample Name Lab Code MRL Factor Extracted Analyzed Result Notes
Riverside PK K1600294-001 0.07 1 01/13/16 01/19/16 82.1
Method Blank K1600294-MB 0.07 1 01/13/16 01/19/16 ND
K1600294icp.jc1 - Sample 01/20/16 Page No.:
Page 73 of 108

ALS Group USA, Corp.dba ALS Environmental
QA/QC Report
Client: CH2M Hill Service Request: K1600294
Project: Riverside Park Date Collected: 01/12/16
Sample Matrix: Water Date Received: 01/12/16
Date Extracted: 01/13/16
Date Analyzed: 01/19/16
Duplicate SummaryMetals
Sample Name: Riverside PK Units: mg/L (ppm)
Lab Code: K1600294-001D Basis: NA
Test Notes:
Duplicate RelativePrep Analysis Sample Sample Percent Result
Analyte Method Method MRL Result Result Average Difference Notes
Hardness as CaCO3 CLAA 200.7/SM 2340B 0.07 82.1 80.6 81.4 2
K1600294icp.jc1 - DUP 01/20/16 Page No.:
Page 74 of 108

ALS Group USA, Corp.dba ALS Environmental
Analytical Report
Client: CH2M Hill Service Request: K1600294
Project: Riverside Park Date Collected: 01/12/16
Sample Matrix: Water Date Received: 01/12/16
Mercury, Total
Prep Method: METHOD Units: ng/L
Analysis Method: 1631E Basis: NA
Test Notes:
Dilution Date Date ResultSample Name Lab Code MRL Factor Extracted Analyzed Result Notes
Riverside PK K1600294-001 0.5 1 01/19/16 01/20/16 ND
Method Blank 1 K1600294-MB1 0.5 1 01/19/16 01/20/16 ND
Method Blank 2 K1600294-MB2 0.5 1 01/19/16 01/20/16 ND
Method Blank 3 K1600294-MB3 0.5 1 01/19/16 01/20/16 ND
K1600294icp.jb1 - Sample 01/21/16 Page No.:
Page 75 of 108

ALS Group USA, Corp.dba ALS Environmental
QA/QC Report
Client: CH2M Hill Service Request: K1600294Project: Riverside Park Date Collected: 01/12/16Sample Matrix: Water Date Received: 01/12/16
Date Extracted: 01/19/16Date Analyzed: 01/20/16
Matrix Spike/Duplicate Matrix Spike Summary
Total Metals
Sample Name: Riverside PK Units: ng/L
Lab Code: K1600294-001MS, K1600294-001MSD Basis: NATest Notes:
P e r c e n t R e c o v e r y
ALS RelativePrep Analysis Spike Level Sample Spike Result Acceptance Percent Result
Analyte Method Method MRL MS DMS Result MS DMS MS DMS Limits Difference Notes Mercury METHOD 1631E 0.5 50 50 ND 48.7 50.6 97 101 71-125 4
K1600294icp.jb1 - DMS 01/21/16 Page No.:
Page 76 of 108
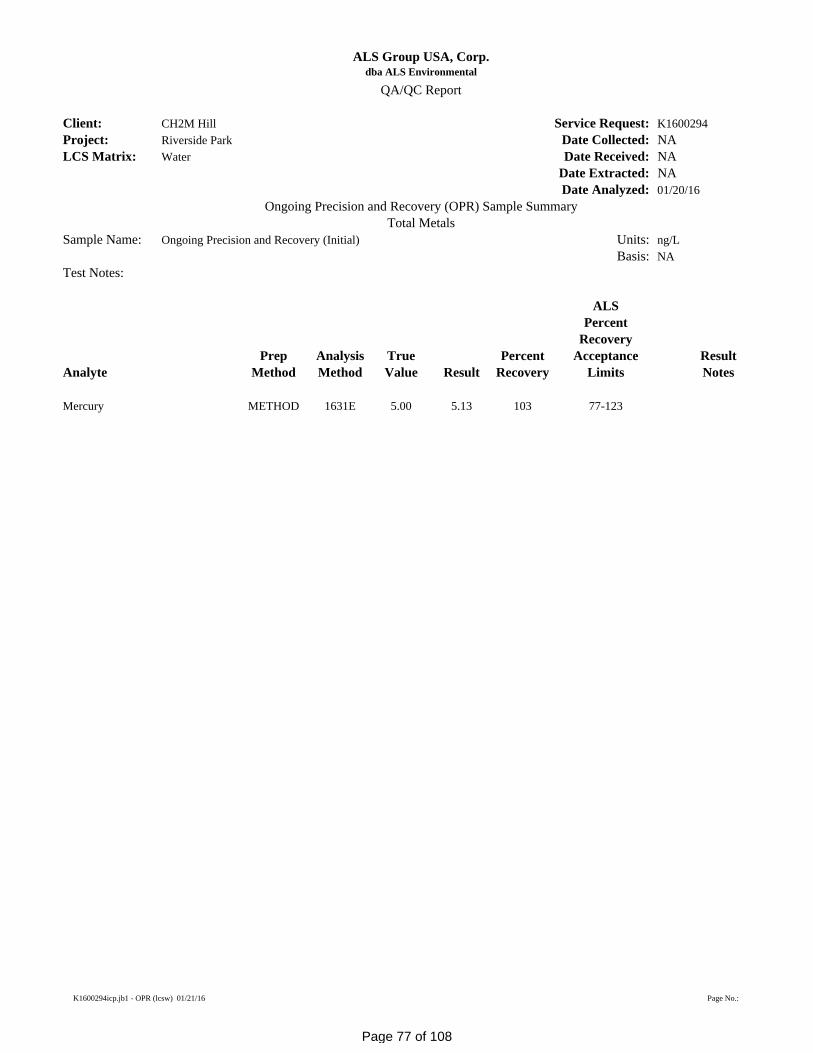
ALS Group USA, Corp.dba ALS Environmental
QA/QC Report
Client: CH2M Hill Service Request: K1600294
Project: Riverside Park Date Collected: NALCS Matrix: Water Date Received: NA
Date Extracted: NADate Analyzed: 01/20/16
Ongoing Precision and Recovery (OPR) Sample SummaryTotal Metals
Sample Name: Ongoing Precision and Recovery (Initial) Units: ng/L
Basis: NA
Test Notes:
ALSPercent
RecoveryPrep Analysis True Percent Acceptance Result
Analyte Method Method Value Result Recovery Limits Notes
Mercury METHOD 1631E 5.00 5.13 103 77-123
K1600294icp.jb1 - OPR (lcsw) 01/21/16 Page No.:
Page 77 of 108

ALS Group USA, Corp.dba ALS Environmental
QA/QC Report
Client: CH2M Hill Service Request: K1600294
Project: Riverside Park Date Collected: NALCS Matrix: Water Date Received: NA
Date Extracted: NADate Analyzed: 01/20/16
Ongoing Precision and Recovery (OPR) Sample SummaryTotal Metals
Sample Name: Ongoing Precision and Recovery (Final) Units: ng/L
Basis: NA
Test Notes:
ALSPercent
RecoveryPrep Analysis True Percent Acceptance Result
Analyte Method Method Value Result Recovery Limits Notes
Mercury METHOD 1631E 5.00 5.24 105 77-123
K1600294icp.jb1 - OPR (lcsw) (2) 01/21/16 Page No.:
Page 78 of 108

ALS Group USA, Corp.dba ALS Environmental
QA/QC Report
Client: CH2M Hill Service Request: K1600294
Project: Riverside Park Date Collected: NALCS Matrix: Water Date Received: NA
Date Extracted: NADate Analyzed: 01/20/16
Quality Control Sample (QCS) SummaryTotal Metals
Sample Name: Quality Control Sample Units: ng/L
Basis: NA
Test Notes:
ALSPercent
RecoveryPrep Analysis True Percent Acceptance Result
Analyte Method Method Value Result Recovery Limits Notes
Mercury METHOD 1631E 5.00 5.35 107 77-123
K1600294icp.jb1 - QCS (icv) 01/21/16 Page No.:
Page 79 of 108
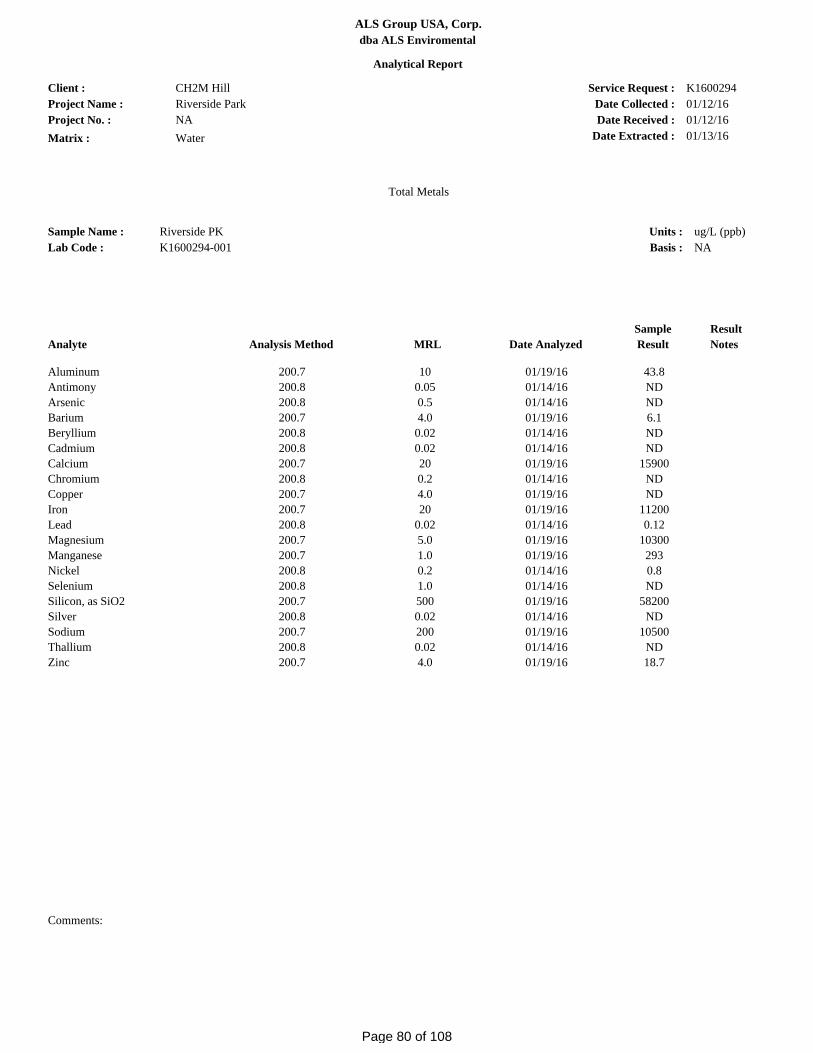
Client :
Project Name :
Matrix :
Date Collected :
Date Received :
Service Request :
ALS Group USA, Corp.
Lab Code :
Sample Name : Units :
Basis :
Date Extracted :
Project No. :
K1600294-001Riverside PK
CH2M HillRiverside ParkNAWater
K160029401/12/1601/12/16
ug/L (ppb)NA
Total Metals
Analytical Report
01/13/16
dba ALS Enviromental
MRLAnalysis Method Date Analyzed
Sample
Result
Result
NotesAnalyte
Aluminum 200.7 10 01/19/16 43.8Antimony 200.8 0.05 01/14/16 NDArsenic 200.8 0.5 01/14/16 NDBarium 200.7 4.0 01/19/16 6.1Beryllium 200.8 0.02 01/14/16 NDCadmium 200.8 0.02 01/14/16 NDCalcium 200.7 20 01/19/16 15900Chromium 200.8 0.2 01/14/16 NDCopper 200.7 4.0 01/19/16 NDIron 200.7 20 01/19/16 11200Lead 200.8 0.02 01/14/16 0.12Magnesium 200.7 5.0 01/19/16 10300Manganese 200.7 1.0 01/19/16 293Nickel 200.8 0.2 01/14/16 0.8Selenium 200.8 1.0 01/14/16 NDSilicon, as SiO2 200.7 500 01/19/16 58200Silver 200.8 0.02 01/14/16 NDSodium 200.7 200 01/19/16 10500Thallium 200.8 0.02 01/14/16 NDZinc 200.7 4.0 01/19/16 18.7
Comments:
Page 80 of 108

Client :
Project Name :
Matrix :
Date Collected :
Date Received :
Service Request :
ALS Group USA, Corp.
Lab Code :
Sample Name : Units :
Basis :
Date Extracted :
Project No. :
K1600294-001Riverside PK
CH2M HillRiverside ParkNAWater
K160029401/12/1601/12/16
ug/L (ppb)NA
Dissolved Metals
Analytical Report
01/13/16
dba ALS Enviromental
MRLAnalysis Method Date Analyzed
Sample
Result
Result
NotesAnalyte
Silicon, as SiO2 200.7 500 01/19/16 56100
Comments:
Page 81 of 108

Client :
Project Name :
Matrix :
Date Collected :
Date Received :
Service Request :
ALS Group USA, Corp.
Lab Code :
Sample Name : Units :
Basis :
Date Extracted :
Project No. :
K1600294-MBMethod Blank
CH2M HillRiverside ParkNAWater
K1600294NANA
ug/L (ppb)NA
Total Metals
Analytical Report
01/13/16
dba ALS Enviromental
MRLAnalysis Method Date Analyzed
Sample
Result
Result
NotesAnalyte
Aluminum 200.7 10 01/19/16 NDAntimony 200.8 0.05 01/14/16 NDArsenic 200.8 0.5 01/14/16 NDBarium 200.7 4.0 01/19/16 NDBeryllium 200.8 0.02 01/14/16 NDCadmium 200.8 0.02 01/14/16 NDCalcium 200.7 20 01/19/16 NDChromium 200.8 0.2 01/14/16 NDCopper 200.7 4.0 01/19/16 NDIron 200.7 20 01/19/16 NDLead 200.8 0.02 01/14/16 NDMagnesium 200.7 5.0 01/19/16 NDManganese 200.7 1.0 01/19/16 NDNickel 200.8 0.2 01/14/16 NDSelenium 200.8 1.0 01/14/16 NDSilicon, as SiO2 200.7 500 01/19/16 NDSilver 200.8 0.02 01/14/16 NDSodium 200.7 200 01/19/16 NDThallium 200.8 0.02 01/14/16 NDZinc 200.7 4.0 01/19/16 ND
Comments:
Page 82 of 108

Client :
Project Name :
Matrix :
Date Collected :
Date Received :
Service Request :
ALS Group USA, Corp.
Lab Code :
Sample Name : Units :
Basis :
Date Extracted :
Project No. :
K1600294-001DRiverside PK
CH2M HillRiverside ParkNAWater
K160029401/12/1601/12/16
ug/L (ppb)NA
Date Analyzed :
Dissolved Metals
QA/QC Report
01/13/1601/19/16
Duplicate Summary
dba ALS Enviromental
Analyte Analysis Method MRL
Sample
Result
Duplicate
Sample
Result Average
Result
Notes
Relative
Percent
Difference
Silicon, as SiO2 200.7 500 5450056100 55300 3
Comments:
Page 83 of 108

Client :
Project Name :
Matrix :
Date Collected :
Date Received :
Service Request :
ALS Group USA, Corp.
Lab Code :
Sample Name : Units :
Basis :
Date Extracted :
Project No. :
K1600294-001SRiverside PK
CH2M HillRiverside ParkNAWater
K160029401/12/1601/12/16
ug/L (ppb)NA
Date Analyzed :
Dissolved Metals
QA/QC Report
01/13/1601/19/16
Matrix Spike Summary
dba ALS Enviromental
Analyte MRL Spike Level
Sample
Result
Spiked
Sample
Result
Percent
Recovery
ALS Percent
Recovery
Acceptance
Limits
Result
Notes
500Silicon, as SiO2 7640021400 56100 95 70-130
Comments:
Page 84 of 108
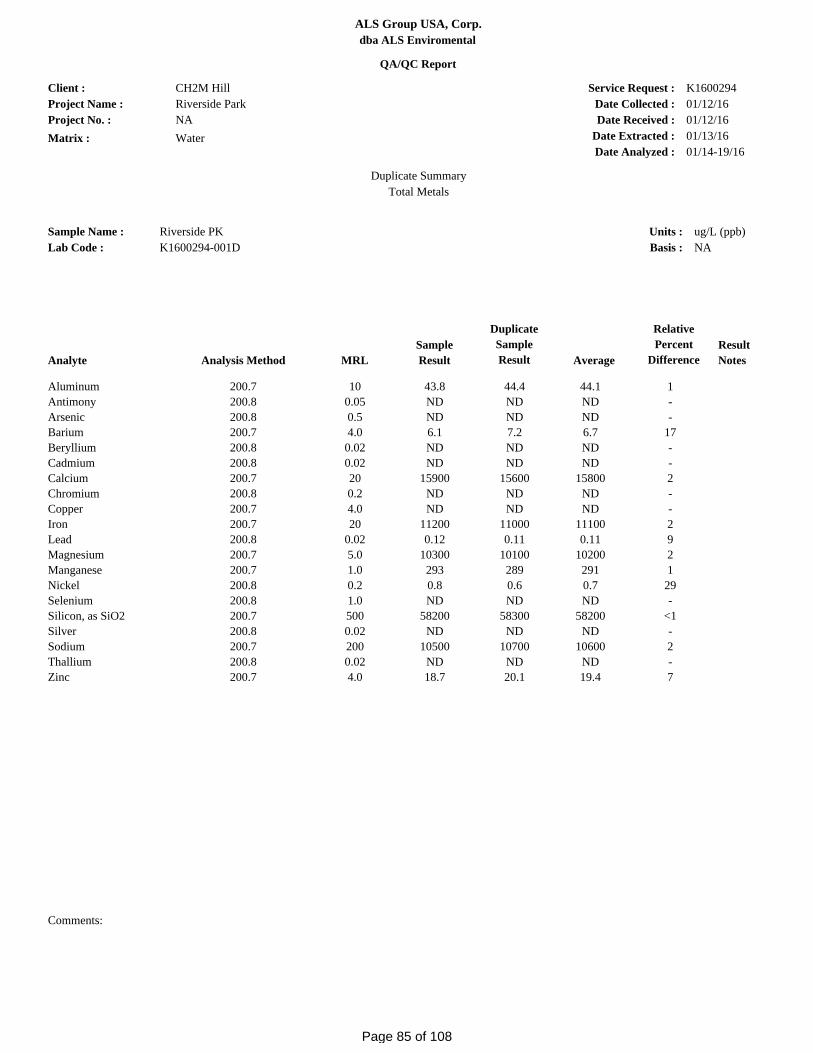
Client :
Project Name :
Matrix :
Date Collected :
Date Received :
Service Request :
ALS Group USA, Corp.
Lab Code :
Sample Name : Units :
Basis :
Date Extracted :
Project No. :
K1600294-001DRiverside PK
CH2M HillRiverside ParkNAWater
K160029401/12/1601/12/16
ug/L (ppb)NA
Date Analyzed :
Total Metals
QA/QC Report
01/13/1601/14-19/16
Duplicate Summary
dba ALS Enviromental
Analyte Analysis Method MRL
Sample
Result
Duplicate
Sample
Result Average
Result
Notes
Relative
Percent
Difference
Aluminum 200.7 10 44.443.8 44.1 1Antimony 200.8 0.05 NDND ND -Arsenic 200.8 0.5 NDND ND -Barium 200.7 4.0 7.26.1 6.7 17Beryllium 200.8 0.02 NDND ND -Cadmium 200.8 0.02 NDND ND -Calcium 200.7 20 1560015900 15800 2Chromium 200.8 0.2 NDND ND -Copper 200.7 4.0 NDND ND -Iron 200.7 20 1100011200 11100 2Lead 200.8 0.02 0.110.12 0.11 9Magnesium 200.7 5.0 1010010300 10200 2Manganese 200.7 1.0 289293 291 1Nickel 200.8 0.2 0.60.8 0.7 29Selenium 200.8 1.0 NDND ND -Silicon, as SiO2 200.7 500 5830058200 58200 <1Silver 200.8 0.02 NDND ND -Sodium 200.7 200 1070010500 10600 2Thallium 200.8 0.02 NDND ND -Zinc 200.7 4.0 20.118.7 19.4 7
Comments:
Page 85 of 108
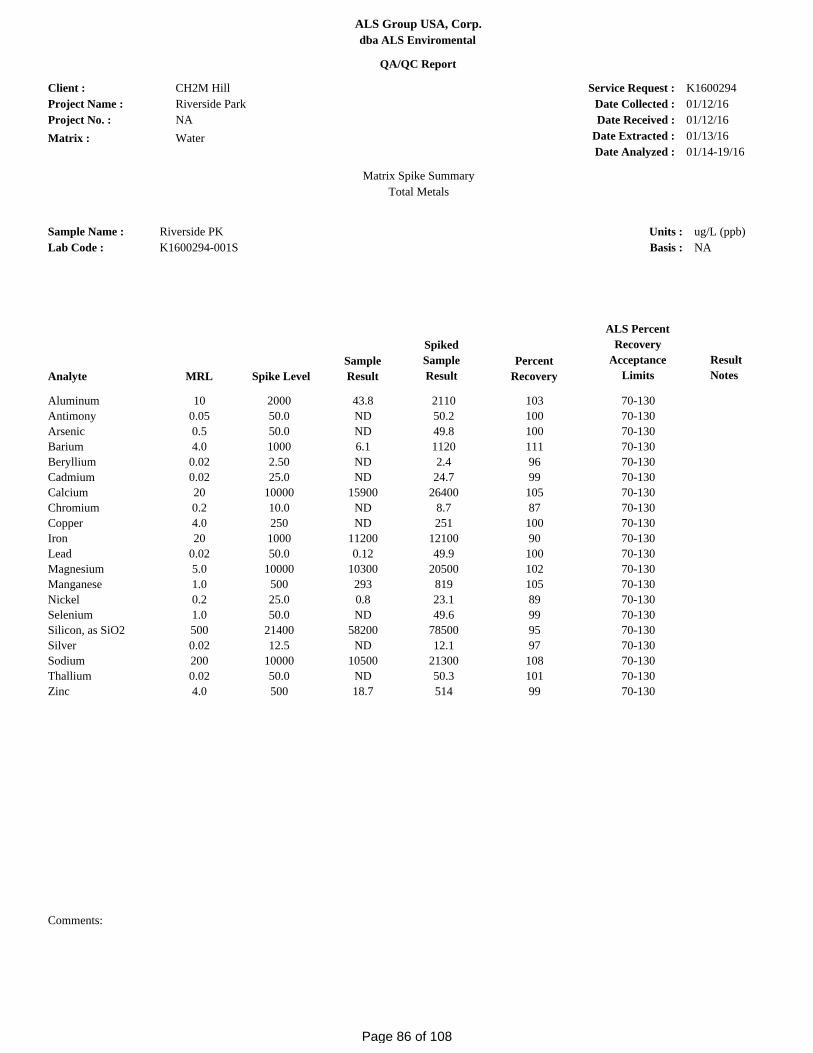
Client :
Project Name :
Matrix :
Date Collected :
Date Received :
Service Request :
ALS Group USA, Corp.
Lab Code :
Sample Name : Units :
Basis :
Date Extracted :
Project No. :
K1600294-001SRiverside PK
CH2M HillRiverside ParkNAWater
K160029401/12/1601/12/16
ug/L (ppb)NA
Date Analyzed :
Total Metals
QA/QC Report
01/13/1601/14-19/16
Matrix Spike Summary
dba ALS Enviromental
Analyte MRL Spike Level
Sample
Result
Spiked
Sample
Result
Percent
Recovery
ALS Percent
Recovery
Acceptance
Limits
Result
Notes
10Aluminum 21102000 43.8 103 70-1300.05Antimony 50.250.0 ND 100 70-1300.5Arsenic 49.850.0 ND 100 70-1304.0Barium 11201000 6.1 111 70-130
0.02Beryllium 2.42.50 ND 96 70-1300.02Cadmium 24.725.0 ND 99 70-13020Calcium 2640010000 15900 105 70-1300.2Chromium 8.710.0 ND 87 70-1304.0Copper 251250 ND 100 70-13020Iron 121001000 11200 90 70-130
0.02Lead 49.950.0 0.12 100 70-1305.0Magnesium 2050010000 10300 102 70-1301.0Manganese 819500 293 105 70-1300.2Nickel 23.125.0 0.8 89 70-1301.0Selenium 49.650.0 ND 99 70-130500Silicon, as SiO2 7850021400 58200 95 70-1300.02Silver 12.112.5 ND 97 70-130200Sodium 2130010000 10500 108 70-1300.02Thallium 50.350.0 ND 101 70-1304.0Zinc 514500 18.7 99 70-130
Comments:
Page 86 of 108

Client :
Project Name :
Matrix :
Date Collected :
Date Received :
Service Request :
ALS Group USA, Corp.
Lab Code :
Sample Name : Units :
Basis :
Date Extracted :
Project No. :
K1600294-LCSLaboratory Control Sample
CH2M HillRiverside ParkNAWater
K1600294NANA
ug/L (ppb)NA
Date Analyzed :
Total Metals
QA/QC Report
01/13/1601/14-19/16
Laboratory Control Sample Summary
dba ALS Enviromental
Analyte Analysis Method True Value Result Percent
Recovery
Result
Notes
ALS Percent
Recovery
Acceptance
Limits
Aluminum 200.7 5000 5090 102 85-115Antimony 200.8 50.0 48.3 97 85-115Arsenic 200.8 50.0 47.7 95 85-115Barium 200.7 5000 5230 105 85-115Beryllium 200.8 2.50 2.4 95 85-115Cadmium 200.8 25.0 23.9 96 85-115Calcium 200.7 12500 12700 101 85-115Chromium 200.8 10.0 9.6 96 85-115Copper 200.7 625 595 95 85-115Iron 200.7 2500 2530 101 85-115Lead 200.8 50.0 48.0 96 85-115Magnesium 200.7 12500 12600 100 85-115Manganese 200.7 1250 1280 103 85-115Nickel 200.8 25.0 24.0 96 85-115Selenium 200.8 50.0 47.8 96 85-115Silicon, as SiO2 200.7 21400 21600 101 85-115Silver 200.8 12.5 11.8 95 85-115Sodium 200.7 12500 12500 100 85-115Thallium 200.8 50.0 48.7 97 85-115Zinc 200.7 1250 1180 94 85-115
Comments:
Page 87 of 108

Diesel and Residual Range Organics
ALS Environmental—Kelso Laboratory 1317 South 13th Avenue, Kelso, WA 98626 Phone (360)577-7222 Fax (360)636-1068 www.alsglobal.com
RIGHT SOLUTIONS | RIGHT PARTNER
Page 88 of 108

Analytical Results
CH2M Hill K1600294
K1600294-001
ug/L
NA
Riverside PK
01/12/2016
01/12/2016
Riverside Park
Water
Client:
Project:
Sample Matrix:
Service Request:
Date Collected:
Date Received:
ALS Group USA, Corp. dba ALS Environmental
Units:
Basis:
Sample Name:
Diesel and Residual Range Organics
Lab Code:
Level: LowExtraction Method:
Analysis Method:
METHOD
NWTPH-Dx
NoteMRLQResultAnalyte Name
Extraction
Lot
Date
Analyzed
Date
Extracted
Dilution
Factor
260 01/13/161 KWG160035301/14/16UNDDiesel Range Organics (DRO)
520 01/13/161 KWG160035301/14/16UNDResidual Range Organics (RRO)
Surrogate Name %Rec
Control
Limits NoteDate
Analyzed
50-150 Acceptableo-Terphenyl 01/14/1678
50-150 Acceptablen-Triacontane 01/14/1678
Comments:
1of1Page14:48:4301/15/2016Printed: Form 1A - Organic
Merged SuperSet Reference: RR185524u:\Stealth\Crystal.rpt\Form1mNew.rpt
Page 89 of 108

Analytical Results
CH2M Hill K1600294
KWG1600353-4
ug/L
NA
Method Blank
NA
NA
Riverside Park
Water
Client:
Project:
Sample Matrix:
Service Request:
Date Collected:
Date Received:
ALS Group USA, Corp. dba ALS Environmental
Units:
Basis:
Sample Name:
Diesel and Residual Range Organics
Lab Code:
Level: LowExtraction Method:
Analysis Method:
METHOD
NWTPH-Dx
NoteMRLQResultAnalyte Name
Extraction
Lot
Date
Analyzed
Date
Extracted
Dilution
Factor
250 01/13/161 KWG160035301/14/16UNDDiesel Range Organics (DRO)
500 01/13/161 KWG160035301/14/16UNDResidual Range Organics (RRO)
Surrogate Name %Rec
Control
Limits NoteDate
Analyzed
50-150 Acceptableo-Terphenyl 01/14/1677
50-150 Acceptablen-Triacontane 01/14/1677
Comments:
1of1Page14:48:4701/15/2016Printed: Form 1A - Organic
Merged SuperSet Reference: RR185524u:\Stealth\Crystal.rpt\Form1mNew.rpt
Page 90 of 108

ALS Group USA, Corp. dba ALS Environmental
Extraction Method:
QA/QC Report
Surrogate Recovery Summary
CH2M Hill K1600294
Low
Water
Riverside Park
Client:
Project:
Sample Matrix:
Service Request:
Units:
Level:
Sample Name Lab Code
Diesel and Residual Range Organics
METHOD
Analysis Method: NWTPH-Dx
Sur1 Sur2
Percent
K1600294-001Riverside PK 78 78
KWG1600353-2Riverside PKDUP 80 76
KWG1600353-4Method Blank 77 77
KWG1600353-3Lab Control Sample 85 86
Form 2A - OrganicPrinted: 01/15/2016 14:48:51 1 of 1
Surrogate Recovery Control Limits (%)
50-150
50-150
o-Terphenyl
n-Triacontane
Results flagged with an asterisk (*) indicate values outside control criteria.
Page
Results flagged with a pound (#) indicate the control criteria is not applicable.
RR185524SuperSet Reference:
Sur1
Sur2
=
=
u:\Stealth\Crystal.rpt\Form2.rpt
Page 91 of 108
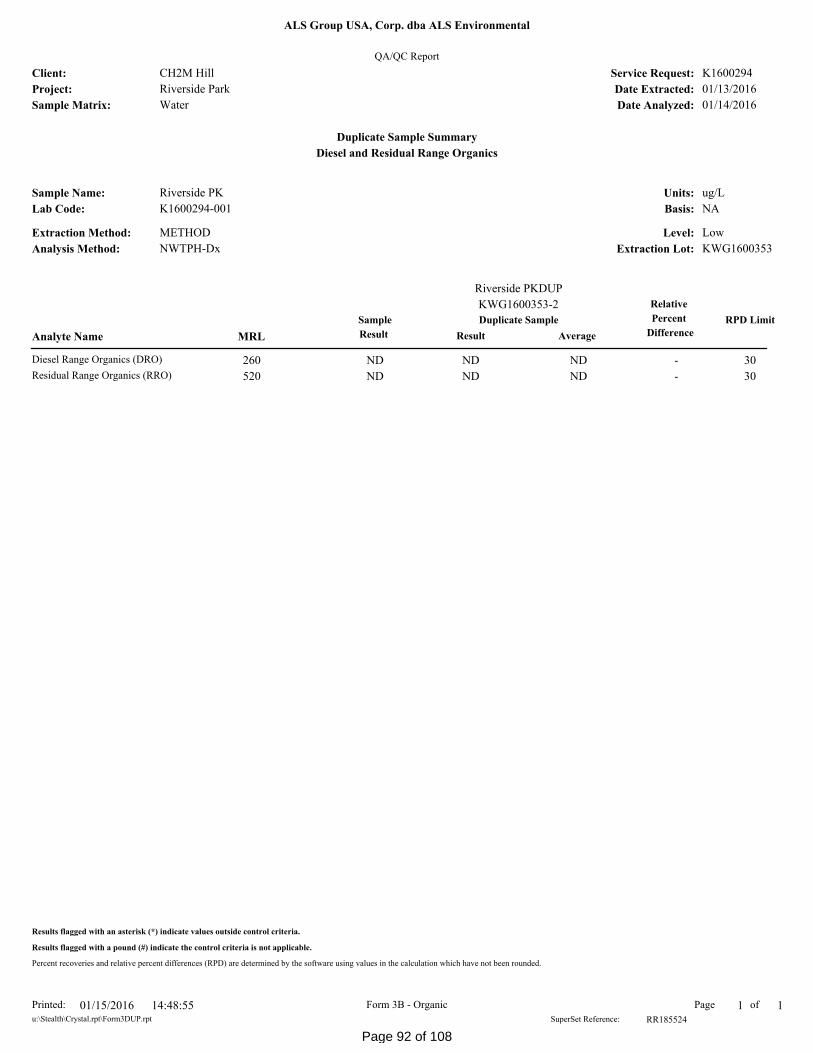
QA/QC Report
Duplicate Sample Summary
Diesel and Residual Range Organics
CH2M Hill
Riverside Park
K1600294
NA
ug/L
Low
KWG1600353
K1600294-001
Riverside PK
METHOD
NWTPH-Dx
Water
Sample
Result Average
Relative
Percent
DifferenceRPD Limit
01/13/2016
Client:
Project:
Sample Matrix:
Service Request:
Date Extracted:
Date Analyzed:
Units:
Basis:
Level:
Extraction Lot:
Extraction Method:
Analysis Method:
Lab Code:
Sample Name:
Analyte Name MRL
ALS Group USA, Corp. dba ALS Environmental
01/14/2016
Result
Duplicate Sample
KWG1600353-2
Riverside PKDUP
ND ND260 30ND -Diesel Range Organics (DRO)
ND ND520 30ND -Residual Range Organics (RRO)
Form 3B - OrganicPrinted: 01/15/2016 14:48:55 1of1Page
Results flagged with an asterisk (*) indicate values outside control criteria.
Results flagged with a pound (#) indicate the control criteria is not applicable.
RR185524SuperSet Reference:
Percent recoveries and relative percent differences (RPD) are determined by the software using values in the calculation which have not been rounded.
u:\Stealth\Crystal.rpt\Form3DUP.rpt
Page 92 of 108

Lab Control Spike Summary
%Rec
Lab Control Spike
%Rec
Limits
QA/QC Report
CH2M Hill K1600294
NWTPH-Dx
ug/L
NA
Lab Control Sample
KWG1600353-3
Diesel and Residual Range Organics
KWG1600353
Water
Low
Riverside Park
Client:
Project:
Sample Matrix:
Service Request:
Units:
Basis:
Level:
Extraction Lot:
Analyte Name Result
Extraction Method:
Analysis Method:
ALS Group USA, Corp. dba ALS Environmental
Date Extracted:
Date Analyzed: 01/14/2016
01/13/2016
METHOD
Spike
Amount
46-1403200 792540Diesel Range Organics (DRO)
45-1591600 861380Residual Range Organics (RRO)
Form 3C - OrganicPrinted: 01/15/2016 14:48:59 Page 1 of 1
Results flagged with an asterisk (*) indicate values outside control criteria.
RR185524SuperSet Reference:
Percent recoveries and relative percent differences (RPD) are determined by the software using values in the calculation which have not been rounded.
u:\Stealth\Crystal.rpt\Form3LCS.rpt
Page 93 of 108

Gasoline Range Organics
ALS Environmental—Kelso Laboratory 1317 South 13th Avenue, Kelso, WA 98626 Phone (360)577-7222 Fax (360)636-1068 www.alsglobal.com
RIGHT SOLUTIONS | RIGHT PARTNER
Page 94 of 108
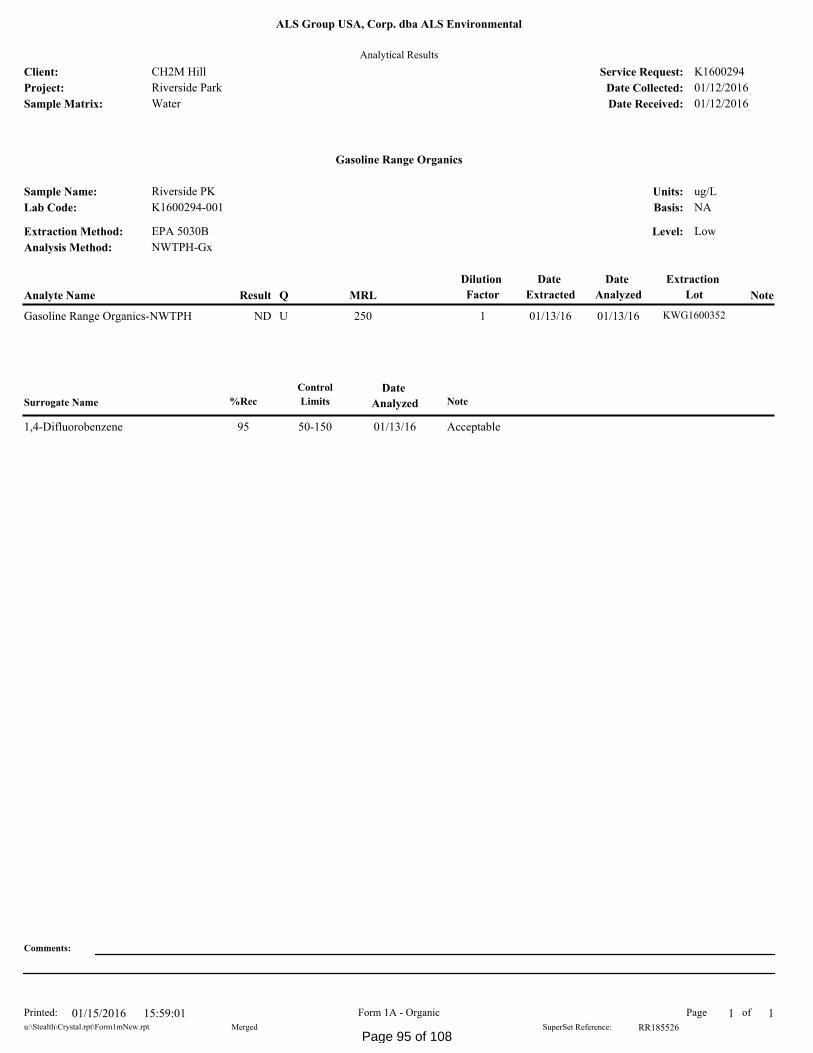
Analytical Results
CH2M Hill K1600294
K1600294-001
ug/L
NA
Riverside PK
01/12/2016
01/12/2016
Riverside Park
Water
Client:
Project:
Sample Matrix:
Service Request:
Date Collected:
Date Received:
ALS Group USA, Corp. dba ALS Environmental
Units:
Basis:
Sample Name:
Gasoline Range Organics
Lab Code:
Level: LowExtraction Method:
Analysis Method:
EPA 5030B
NWTPH-Gx
NoteMRLQResultAnalyte Name
Extraction
Lot
Date
Analyzed
Date
Extracted
Dilution
Factor
250 01/13/161 KWG160035201/13/16UNDGasoline Range Organics-NWTPH
Surrogate Name %Rec
Control
Limits NoteDate
Analyzed
50-150 Acceptable1,4-Difluorobenzene 01/13/1695
Comments:
1of1Page15:59:0101/15/2016Printed: Form 1A - Organic
Merged SuperSet Reference: RR185526u:\Stealth\Crystal.rpt\Form1mNew.rpt
Page 95 of 108

Analytical Results
CH2M Hill K1600294
KWG1600352-3
ug/L
NA
Method Blank
NA
NA
Riverside Park
Water
Client:
Project:
Sample Matrix:
Service Request:
Date Collected:
Date Received:
ALS Group USA, Corp. dba ALS Environmental
Units:
Basis:
Sample Name:
Gasoline Range Organics
Lab Code:
Level: LowExtraction Method:
Analysis Method:
EPA 5030B
NWTPH-Gx
NoteMRLQResultAnalyte Name
Extraction
Lot
Date
Analyzed
Date
Extracted
Dilution
Factor
250 01/13/161 KWG160035201/13/16UNDGasoline Range Organics-NWTPH
Surrogate Name %Rec
Control
Limits NoteDate
Analyzed
50-150 Acceptable1,4-Difluorobenzene 01/13/1696
Comments:
1of1Page15:59:0501/15/2016Printed: Form 1A - Organic
Merged SuperSet Reference: RR185526u:\Stealth\Crystal.rpt\Form1mNew.rpt
Page 96 of 108

ALS Group USA, Corp. dba ALS Environmental
Extraction Method:
QA/QC Report
Surrogate Recovery Summary
CH2M Hill K1600294
Low
Water
Riverside Park
Client:
Project:
Sample Matrix:
Service Request:
Units:
Level:
Sample Name Lab Code
Gasoline Range Organics
EPA 5030B
Analysis Method: NWTPH-Gx
Sur1
Percent
K1600294-001Riverside PK 95
KWG1600352-1Riverside PKDUP 98
KWG1600352-3Method Blank 96
KWG1600352-2Lab Control Sample 99
Form 2A - OrganicPrinted: 01/15/2016 15:59:09 1 of 1
Surrogate Recovery Control Limits (%)
50-1501,4-Difluorobenzene
Results flagged with an asterisk (*) indicate values outside control criteria.
Page
Results flagged with a pound (#) indicate the control criteria is not applicable.
RR185526SuperSet Reference:
Sur1 =
u:\Stealth\Crystal.rpt\Form2.rpt
Page 97 of 108

QA/QC Report
Duplicate Sample Summary
Gasoline Range Organics
CH2M Hill
Riverside Park
K1600294
NA
ug/L
Low
KWG1600352
K1600294-001
Riverside PK
EPA 5030B
NWTPH-Gx
Water
Sample
Result Average
Relative
Percent
DifferenceRPD Limit
01/13/2016
Client:
Project:
Sample Matrix:
Service Request:
Date Extracted:
Date Analyzed:
Units:
Basis:
Level:
Extraction Lot:
Extraction Method:
Analysis Method:
Lab Code:
Sample Name:
Analyte Name MRL
ALS Group USA, Corp. dba ALS Environmental
01/13/2016
Result
Duplicate Sample
KWG1600352-1
Riverside PKDUP
ND ND250 30ND -Gasoline Range Organics-NWTPH
Form 3B - OrganicPrinted: 01/15/2016 15:59:13 1of1Page
Results flagged with an asterisk (*) indicate values outside control criteria.
Results flagged with a pound (#) indicate the control criteria is not applicable.
RR185526SuperSet Reference:
Percent recoveries and relative percent differences (RPD) are determined by the software using values in the calculation which have not been rounded.
u:\Stealth\Crystal.rpt\Form3DUP.rpt
Page 98 of 108

Lab Control Spike Summary
%Rec
Lab Control Spike
%Rec
Limits
QA/QC Report
CH2M Hill K1600294
NWTPH-Gx
ug/L
NA
Lab Control Sample
KWG1600352-2
Gasoline Range Organics
KWG1600352
Water
Low
Riverside Park
Client:
Project:
Sample Matrix:
Service Request:
Units:
Basis:
Level:
Extraction Lot:
Analyte Name Result
Extraction Method:
Analysis Method:
ALS Group USA, Corp. dba ALS Environmental
Date Extracted:
Date Analyzed: 01/13/2016
01/13/2016
EPA 5030B
Spike
Amount
80-119500 103515Gasoline Range Organics-NWTPH
Form 3C - OrganicPrinted: 01/15/2016 15:59:17 Page 1 of 1
Results flagged with an asterisk (*) indicate values outside control criteria.
RR185526SuperSet Reference:
Percent recoveries and relative percent differences (RPD) are determined by the software using values in the calculation which have not been rounded.
u:\Stealth\Crystal.rpt\Form3LCS.rpt
Page 99 of 108

Subcontract Lab Results
ALS Environmental—Kelso Laboratory 1317 South 13th Avenue, Kelso, WA 98626 Phone (360)577-7222 Fax (360)636-1068 www.alsglobal.com
RIGHT SOLUTIONS | RIGHT PARTNER
Page 100 of 108

LABORATORY REPORT January 20, 2016 Brad Phelps CH2M Hill 2020 SW 4th Ave. Suite 300 Portland, OR 97201 RE: Riverside Park Dear Brad: Enclosed are the results of the sample submitted to our laboratory on January 12, 2016. For your reference, this analysis has been assigned our service request number K1600294. All analyses were performed according to our laboratory’s NELAP and DoD-ELAP-approved quality assurance program. The test results meet requirements of the current NELAP and DoD-ELAP standards, where applicable, and except as noted in the laboratory case narrative provided. For a specific list of NELAP and DoD-ELAP-accredited analytes, refer to the certifications section at www.alsglobal.com. Results are intended to be considered in their entirety and apply only to the samples analyzed and reported herein. If you have any questions, please call me at (805) 526-7161. Respectfully submitted, ALS | Environmental Kate Aguilera Project Manager
Page 101 of 108

Client: CH2M Hill Service Request No: K1600294 Project: Riverside Park _______________________________________________________________________________
CASE NARRATIVE
The sample was received intact under chain of custody at the Simi Valley facility on January 14, 2016 and was stored in accordance with the analytical method requirements. Please refer to the sample acceptance check form for additional information. The results reported herein are applicable only to the condition of the sample at the time of sample receipt. Hydrogen Sulfide Analysis The sample was analyzed for hydrogen sulfide using a gas chromatograph equipped with a sulfur chemiluminescence detector (SCD). This method is not included on the laboratory’s NELAP, DoD-ELAP, or AIHA-LAP scope of accreditation. ______________________________________________________________________________________ The results of analyses are given in the attached laboratory report. All results are intended to be considered in their entirety, and ALS Environmental (ALS) is not responsible for utilization of less than the complete report. Use of ALS Environmental (ALS)’s Name. Client shall not use ALS’s name or trademark in any marketing or reporting materials, press releases or in any other manner (“Materials”) whatsoever and shall not attribute to ALS any test result, tolerance or specification derived from ALS’s data (“Attribution”) without ALS’s prior written consent, which may be withheld by ALS for any reason in its sole discretion. To request ALS’s consent, Client shall provide copies of the proposed Materials or Attribution and describe in writing Client’s proposed use of such Materials or Attribution. If ALS has not provided written approval of the Materials or Attribution within ten (10) days of receipt from Client, Client’s request to use ALS’s name or trademark in any Materials or Attribution shall be deemed denied. ALS may, in its discretion, reasonably charge Client for its time in reviewing Materials or Attribution requests. Client acknowledges and agrees that the unauthorized use of ALS’s name or trademark may cause ALS to incur irreparable harm for which the recovery of money damages will be inadequate. Accordingly, Client acknowledges and agrees that a violation shall justify preliminary injunctive relief. For questions contact the laboratory.
Page 102 of 108

ALS Environmental – Simi Valley
CERTIFICATIONS, ACCREDITATIONS, AND REGISTRATIONS
Agency Web Site Number
AIHA http://www.aihaaccreditedlabs.org 101661
Arizona DHS http://www.azdhs.gov/lab/license/env.htm AZ0694
DoD ELAP http://www.pjlabs.com/search-accredited-labs L15-398
Florida DOH (NELAP)
http://www.doh.state.fl.us/lab/EnvLabCert/WaterCert.htm E871020
Maine DHHS http://www.maine.gov/dhhs/mecdc/environmental-health/water/dwp-services/labcert/labcert.htm
2014025
Minnesota DOH (NELAP)
http://www.health.state.mn.us/accreditation 977273
New Jersey DEP (NELAP)
http://www.nj.gov/dep/oqa/ CA009
New York DOH (NELAP)
http://www.wadsworth.org/labcert/elap/elap.html 11221
Oregon PHD (NELAP)
http://public.health.oregon.gov/LaboratoryServices/EnvironmentalLaboratoryAccreditation/Pages/index.aspx
4068-001
Pennsylvania DEP http://www.depweb.state.pa.us/labs 68-03307
(Registration) Texas CEQ (NELAP)
http://www.tceq.texas.gov/field/qa/env_lab_accreditation.html T104704413-
15-6 Utah DOH (NELAP)
http://www.health.utah.gov/lab/labimp/certification/index.html CA01627201
5-5
Washington DOE http://www.ecy.wa.gov/programs/eap/labs/lab-accreditation.html C946
Analyses were performed according to our laboratory’s NELAP and DoD-ELAP approved quality assurance program. A complete listing of specific NELAP and DoD-ELAP certified analytes can be found in the certifications section at www.alsglobal.com, or at the accreditation body’s website. Each of the certifications listed above have an explicit Scope of Accreditation that applies to specific matrices/methods/analytes; therefore, please contact the laboratory for information corresponding to a particular certification.
Page 103 of 108
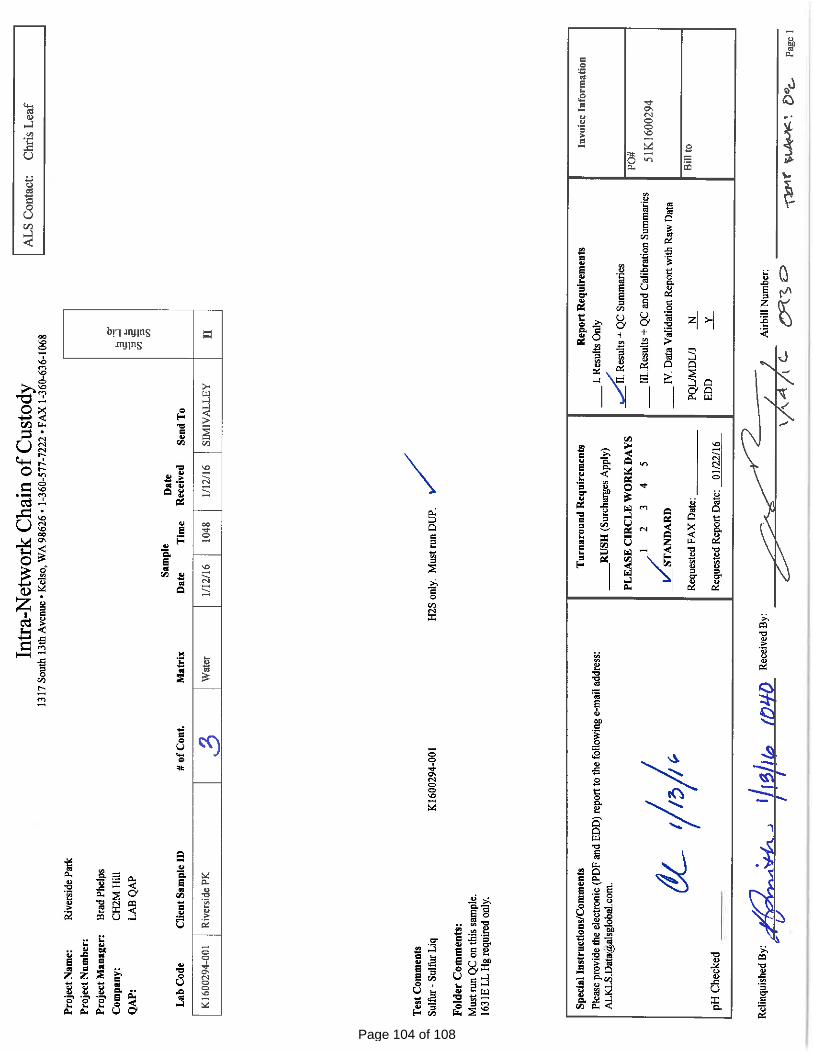
Page 104 of 108
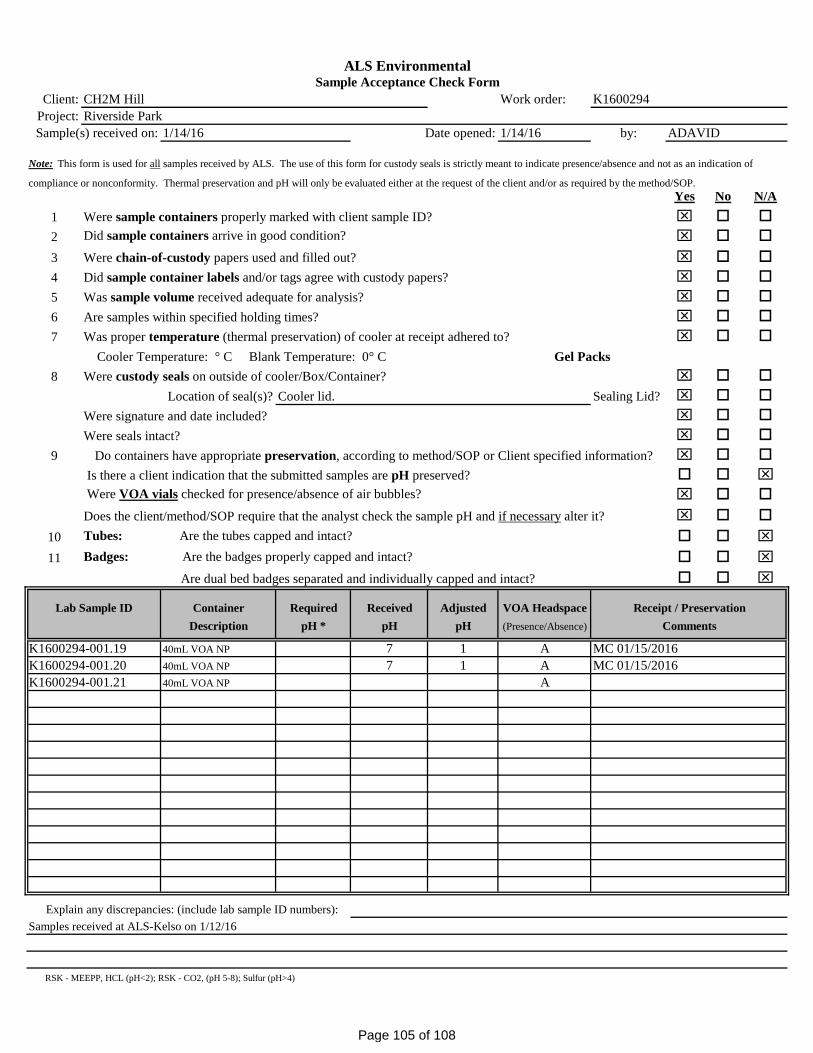
ALS EnvironmentalSample Acceptance Check Form
Client: CH2M Hill Work order: K1600294Project: Riverside ParkSample(s) received on: 1/14/16 Date opened: 1/14/16 by: ADAVID
Note: This form is used for all samples received by ALS. The use of this form for custody seals is strictly meant to indicate presence/absence and not as an indication of
compliance or nonconformity. Thermal preservation and pH will only be evaluated either at the request of the client and/or as required by the method/SOP.Yes No N/A
1 Were sample containers properly marked with client sample ID? 2 Did sample containers arrive in good condition? 3 Were chain-of-custody papers used and filled out? 4 Did sample container labels and/or tags agree with custody papers? 5 Was sample volume received adequate for analysis? 6 Are samples within specified holding times? 7 Was proper temperature (thermal preservation) of cooler at receipt adhered to?
Cooler Temperature: ° C Blank Temperature: 0° C
8 Were custody seals on outside of cooler/Box/Container? Location of seal(s)? Cooler lid. Sealing Lid?
Were signature and date included? Were seals intact?
9 Is there a client indication that the submitted samples are pH preserved? Were VOA vials checked for presence/absence of air bubbles?
10 Tubes: Are the tubes capped and intact? 11 Badges: Are the badges properly capped and intact?
Are dual bed badges separated and individually capped and intact?
Lab Sample ID Container Required Received Adjusted VOA Headspace
Description pH * pH pH (Presence/Absence) Comments
40mL VOA NP 7 1 A40mL VOA NP 7 1 A40mL VOA NP A
Samples received at ALS-Kelso on 1/12/16
RSK - MEEPP, HCL (pH<2); RSK - CO2, (pH 5-8); Sulfur (pH>4)
Do containers have appropriate preservation, according to method/SOP or Client specified information?
Does the client/method/SOP require that the analyst check the sample pH and if necessary alter it?
Receipt / Preservation
K1600294-001.19K1600294-001.20K1600294-001.21
MC 01/15/2016
Explain any discrepancies: (include lab sample ID numbers):
Gel Packs
MC 01/15/2016
Page 105 of 108

ALS ENVIRONMENTAL
RESULTS OF ANALYSIS
Page 1 of 1
Client: CH2M HillClient Project ID: Riverside Park ALS Project ID: K1600294
Hydrogen Sulfide
Test Code: GC/SCD Reduced Sulfur AnalysisInstrument ID: Agilent 6890A/GC13/SCD Date(s) Collected: 1/12/16Analyst: Mike Conejo Date Received: 1/12/16Sample Type: Water Date Analyzed: 1/15/16Test Notes:
Liquid Amount: Purge Injection
Client Sample ID ALS Sample ID Amount Volume Volume Result MRL Data
ml(s) Liter(s) ml(s) µg/L µg/L Qualifier
Riverside PK K1600294-001 10.0 0.30 1.0 ND 0.84
Method Blank P160115-MB 10.0 0.30 1.0 ND 0.84
ND = Compound was analyzed for, but not detected above the laboratory reporting limit.MRL = Method Reporting Limit - The minimum quantity of a target analyte that can be confidently determined by the referenced method.
Page 106 of 108

ALS ENVIRONMENTAL
LABORATORY CONTROL SAMPLE / DUPLICATE LABORATORY CONTROL SAMPLE SUMMARY
Page 1 of 1
Client: CH2M HillClient Sample ID: Duplicate Lab Control Sample ALS Project ID: K1600294Client Project ID: Riverside Park ALS Sample ID: P160115-DLCS
Test Code: GC/SCD Reduced Sulfur Analysis Date Collected: NAInstrument ID: Agilent 6890A/GC13/SCD Date Received: NAAnalyst: Mike Conejo Date Analyzed: 1/15/16Sample Type: Water Liquid Amount: 10.0 ml(s)Test Notes: Purge Volume: 0.30 Liter(s) Injection Volume: 0.20 ml(s)
Spike Amount Result ALS
CAS # Compound LCS / DLCS LCS DLCS % Recovery Acceptance RPD RPD Dataug/L ug/L ug/L LCS DLCS Limits Limit Qualifier
7783-06-4 Hydrogen Sulfide 418 419 436 100 104 45-151 4 28
Page 107 of 108

ALS ENVIRONMENTAL
LABORATORY DUPLICATE SUMMARY RESULTS
Page 1 of 1
Client: CH2M HillClient Sample ID: Riverside PK ALS Project ID: K1600294Client Project ID: Riverside Park ALS Sample ID: K1600294-001DUP
Test Code: GC/SCD Reduced Sulfur Analysis Date Collected: 1/12/16Instrument ID: Agilent 6890A/GC13/SCD Date Received: 1/12/16Analyst: Mike Conejo Date Analyzed: 1/15/16Sample Type: Water Liquid Amount: 1.0 ml(s)Test Notes: Purge Volume: 0.30 Liter(s) Injection Volume(s): 1.0 ml(s)
Duplicate
CAS # Compound Sample Result Sample Result Average % RPD RPD Dataµg/L µg/L Limit Qualifier
7783-06-4 Hydrogen Sulfide ND ND - - 28
ND = Compound was analyzed for, but not detected above the laboratory reporting limit.
Page 108 of 108

February 4, 2016 Analytical Report for Service Request No: K1600170
Brad PhelpsCH2M Hill2020 SW 4th Ave.Suite 300Portland, OR 97201
Analyses were performed according to our laboratory’s NELAP-approved quality assurance program. The test results meet requirements of the current NELAP standards, where applicable, and except as noted in the laboratory case narrative provided. For a specific list of NELAP-accredited analytes, refer to the certifications section at www.alsglobal.com. All results are intended to be considered in their entirety, and ALS Group USA Corp. dba ALS Environmental (ALS) is not responsible for use of less than the complete report. Results apply only to the items submitted to the laboratory for analysis and individual items (samples) analyzed, as listed in the report.
For your reference, these analyses have been assigned our service request numberEnclosed are the results of the sample(s) submitted to our laboratory January 08, 2016
RE: City of Longview Ranney
Dear Brad,
K1600170.
Please contact me if you have any questions. My extension is 3275. You may also contact me via email at [email protected].
Respectfully submitted,
ALS Group USA, Corp. dba ALS Environmental
Chris LeafProject Manager
ALS Group USA, Corp1317 South 13th AvenueKelso, WA 98626
+1 360 577 7222+1 360 636 1068
T :F :
ALS Environmental
www.alsglobal.com
RIGHT SOLUTIONS | RIGHT PARTNER1 of 113

www.alsglobal.com
ALS Environmental
F :T :
+1 360 636 1068+1 360 577 7222
Kelso, WA 986261317 South 13th AvenueALS Group USA, Corp
Table of Contents
RIGHT SOLUTIONS | RIGHT PARTNER
Acronyms
Qualifiers
State Certifications, Accreditations, And Licenses
Case Narrative
Chain of Custody
General Chemistry
Metals
Diesel and Residual Range Organics
Gasoline Range Organics
Subcontract Lab Results
2 of 113
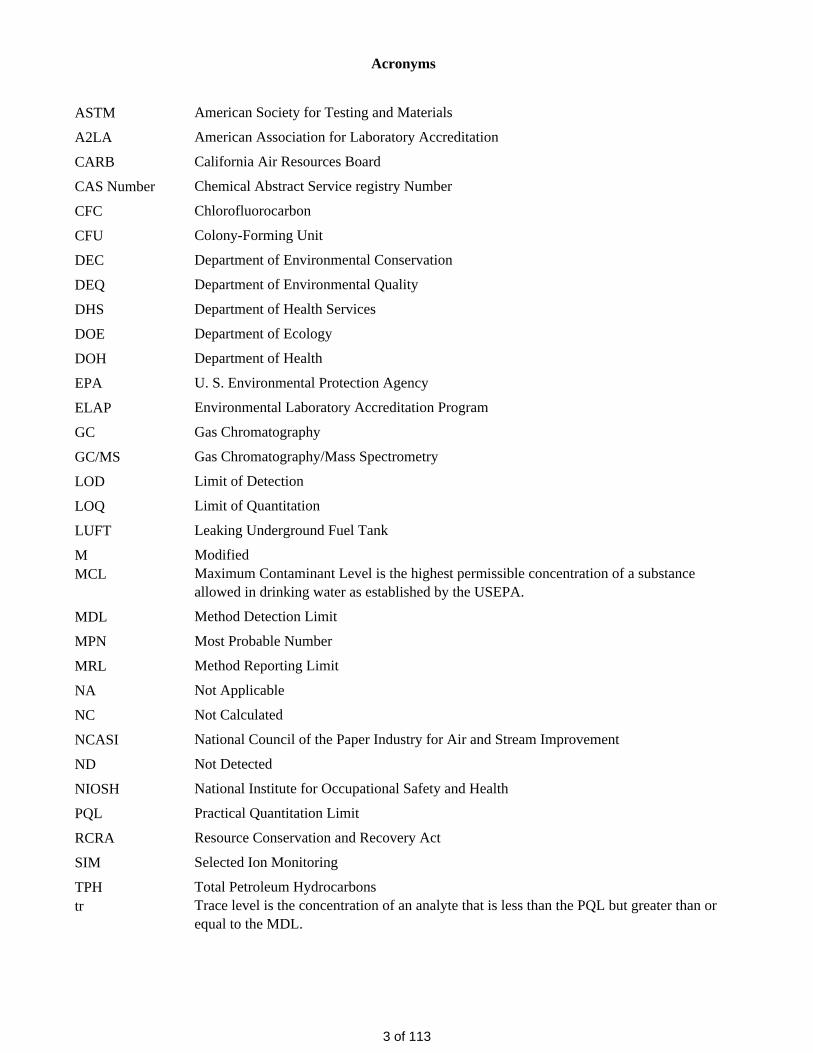
ASTM American Society for Testing and Materials
A2LA American Association for Laboratory Accreditation
CARB California Air Resources Board
CAS Number Chemical Abstract Service registry Number
CFC Chlorofluorocarbon
CFU Colony-Forming Unit
DEC Department of Environmental Conservation
DEQ Department of Environmental Quality
DHS Department of Health Services
DOE Department of Ecology
DOH Department of Health
EPA U. S. Environmental Protection Agency
ELAP Environmental Laboratory Accreditation Program
GC Gas Chromatography
GC/MS Gas Chromatography/Mass Spectrometry
LOD Limit of Detection
LOQ Limit of Quantitation
LUFT Leaking Underground Fuel Tank
M ModifiedMCL Maximum Contaminant Level is the highest permissible concentration of a substance
allowed in drinking water as established by the USEPA.
MDL Method Detection Limit
MPN Most Probable Number
MRL Method Reporting Limit
NA Not Applicable
NC Not Calculated
NCASI National Council of the Paper Industry for Air and Stream Improvement
ND Not Detected
NIOSH National Institute for Occupational Safety and Health
PQL Practical Quantitation Limit
RCRA Resource Conservation and Recovery Act
SIM Selected Ion Monitoring
TPH Total Petroleum Hydrocarbonstr Trace level is the concentration of an analyte that is less than the PQL but greater than or
equal to the MDL.
Acronyms
3 of 113

Inorganic Data Qualifiers
* The result is an outlier. See case narrative.
# The control limit criteria is not applicable. See case narrative.
B The analyte was found in the associated method blank at a level that is significant relative to the sample result as defined by the DOD or NELAC standards.
E The result is an estimate amount because the value exceeded the instrument calibration range.
J The result is an estimated value.
U The analyte was analyzed for, but was not detected ("Non-detect") at or above the MRL/MDL. DOD-QSM 4.2 definition : Analyte was not detected and is reported as less than the LOD or as defined by the project. The detection limit is adjusted for dilution.
i The MRL/MDL or LOQ/LOD is elevated due to a matrix interference.
X See case narrative.
Q See case narrative. One or more quality control criteria was outside the limits.
H The holding time for this test is immediately following sample collection. The samples were analyzed as soon as possible afterreceipt by the laboratory.
Metals Data Qualifiers
# The control limit criteria is not applicable. See case narrative.
J The result is an estimated value.
E The percent difference for the serial dilution was greater than 10%, indicating a possible matrix interference in the sample.
M The duplicate injection precision was not met.
N The Matrix Spike sample recovery is not within control limits. See case narrative.
S The reported value was determined by the Method of Standard Additions (MSA).
U The analyte was analyzed for, but was not detected ("Non-detect") at or above the MRL/MDL. DOD-QSM 4.2 definition : Analyte was not detected and is reported as less than the LOD or as defined by the project. The detection limit is adjusted for dilution.
W The post-digestion spike for furnace AA analysis is out of control limits, while sample absorbance is less than 50% of spike absorbance.
i The MRL/MDL or LOQ/LOD is elevated due to a matrix interference.
X See case narrative.
+ The correlation coefficient for the MSA is less than 0.995.
Q See case narrative. One or more quality control criteria was outside the limits.
Organic Data Qualifiers
* The result is an outlier. See case narrative.
# The control limit criteria is not applicable. See case narrative.
A A tentatively identified compound, a suspected aldol-condensation product.
B The analyte was found in the associated method blank at a level that is significant relative to the sample result as defined by the DOD or NELAC standards.
C The analyte was qualitatively confirmed using GC/MS techniques, pattern recognition, or by comparing to historical data.
D The reported result is from a dilution.
E The result is an estimated value.
J The result is an estimated value.
N The result is presumptive. The analyte was tentatively identified, but a confirmation analysis was not performed.
PThe GC or HPLC confirmation criteria was exceeded. The relative percent difference is greater than 40% between the two analytical results.
U The analyte was analyzed for, but was not detected ("Non-detect") at or above the MRL/MDL. DOD-QSM 4.2 definition : Analyte was not detected and is reported as less than the LOD or as defined by the project. The detection limit is adjusted for dilution.
i The MRL/MDL or LOQ/LOD is elevated due to a chromatographic interference.
X See case narrative.
Q See case narrative. One or more quality control criteria was outside the limits.
Additional Petroleum Hydrocarbon Specific Qualifiers
F The chromatographic fingerprint of the sample matches the elution pattern of the calibration standard.
L The chromatographic fingerprint of the sample resembles a petroleum product, but the elution pattern indicates the presence of a greater amount of lighter molecular weight constituents than the calibration standard.
H The chromatographic fingerprint of the sample resembles a petroleum product, but the elution pattern indicates the presence of a greater amount of heavier molecular weight constituents than the calibration standard.
O The chromatographic fingerprint of the sample resembles an oil, but does not match the calibration standard.
Y The chromatographic fingerprint of the sample resembles a petroleum product eluting in approximately the correct carbon range, but the elution pattern does not match the calibration standard.
Z The chromatographic fingerprint does not resemble a petroleum product.
4 of 113

Agency Web Site Number
Alaska DEC UST http://dec.alaska.gov/applications/eh/ehllabreports/USTLabs.aspx UST-040
Arizona DHS http://www.azdhs.gov/lab/license/env.htm AZ0339
Arkansas - DEQ http://www.adeq.state.ar.us/techsvs/labcert.htm 88-0637
California DHS (ELAP) http://www.cdph.ca.gov/certlic/labs/Pages/ELAP.aspx 2795
DOD ELAP http://www.denix.osd.mil/edqw/Accreditation/AccreditedLabs.cfm L14-51
Florida DOH http://www.doh.state.fl.us/lab/EnvLabCert/WaterCert.htm E87412
Hawaii DOH Not available -
Idaho DHWhttp://www.healthandwelfare.idaho.gov/Health/Labs/CertificationDrinkingWaterLabs/tabid/1833/Default.aspx -
ISO 17025 http://www.pjlabs.com/ L14-50
Louisiana DEQhttp://www.deq.louisiana.gov/portal/DIVISIONS/PublicParticipationandPermitSupport/LouisianaLaboratoryAccreditationProgram.aspx 03016
Maine DHS Not available WA01276
Michigan DEQ http://www.michigan.gov/deq/0,1607,7-135-3307_4131_4156---,00.html 9949
Minnesota DOH http://www.health.state.mn.us/accreditation 053-999-457
Montana DPHHS http://www.dphhs.mt.gov/publichealth/ CERT0047
Nevada DEP http://ndep.nv.gov/bsdw/labservice.htm WA01276
New Jersey DEP http://www.nj.gov/dep/oqa/ WA005
North Carolina DWQ http://www.dwqlab.org/ 605
Oklahoma DEQ http://www.deq.state.ok.us/CSDnew/labcert.htm 9801
Oregon – DEQ (NELAP)http://public.health.oregon.gov/LaboratoryServices/EnvironmentalLaboratoryAccreditation/Pages/index.aspx WA100010
South Carolina DHEC http://www.scdhec.gov/environment/envserv/ 61002
Texas CEQ http://www.tceq.texas.gov/field/qa/env_lab_accreditation.html T104704427
Washington DOE http://www.ecy.wa.gov/programs/eap/labs/lab-accreditation.html C544
Wisconsin DNR http://dnr.wi.gov/ 998386840
Wyoming (EPA Region 8) http://www.epa.gov/region8/water/dwhome/wyomingdi.html -
Kelso Laboratory Website www.alsglobal.com NA
ALS Group USA Corp. dba ALS Environmental (ALS) - KelsoState Certifications, Accreditations, and Licenses
Analyses were performed according to our laboratory’s NELAP-approved quality assurance program. A complete listing of specific NELAP-certified analytes, can be found in the certification section at www.ALSGlobal.com or at the accreditation bodies web site.Please refer to the certification and/or accreditation body's web site if samples are submitted for compliance purposes. The states highlighted above, require the analysis be listed on the state certification if used for compliance purposes and if the method/anlayte is offered by that state.
5 of 113

Case Narrative
ALS Environmental—Kelso Laboratory 1317 South 13th Avenue, Kelso, WA 98626 Phone (360)577-7222 Fax (360)636-1068 www.alsglobal.com
RIGHT SOLUTIONS | RIGHT PARTNER
6 of 113

Approved by______________________________________________
ALS ENVIRONMENTAL Client: CH2M Hill Service Request No.: K1600170 Project: City of Longview Ranney Date Received: 01/07/15-01/08/15 Sample Matrix: Water
Case Narrative All analyses were performed consistent with the quality assurance program of ALS Environmental. This report contains analytical results for samples designated for Tier II data deliverables. When appropriate to the method, method blank results have been reported with each analytical test. Surrogate recoveries have been reported for all applicable organic analyses. Additional quality control analyses reported herein include: Laboratory Duplicate (DUP), Matrix Spike (MS), Matrix/Duplicate Matrix Spike (MS/DMS), Laboratory Control Sample (LCS), and Laboratory/Duplicate Laboratory Control Sample (LCS/DLCS). Sample Receipt Two water samples were received for analysis at ALS Environmental between 01/07/15 and 01/08/15. The samples were received in good condition and consistent with the accompanying chain of custody form. The samples were stored in a refrigerator at 4ºC upon receipt at the laboratory. General Chemistry Parameters Sulfate by EPA Method 300.0: The matrix spike recoveries for sample WTP TEST WELL were outside control criteria because of suspected matrix interference. As a result of the interference, the results for this analyte contained a potential high bias. No further corrective action was taken. No other anomalies associated with the analysis of this sample were observed. Total Metals No anomalies associated with the analysis of this sample were observed. Diesel Range Organics by Method NWTPH-Dx No anomalies associated with the analysis of this sample were observed. Gasoline Range Organics by Method NWTPH-Gx No anomalies associated with the analysis of this sample were observed. Sulfur This analysis was performed at ALS Environmental, Simi Valley, CA. The data for this analysis is included in the corresponding section of this report.
7 of 113

Chain of Custody
ALS Environmental—Kelso Laboratory 1317 South 13th Avenue, Kelso, WA 98626 Phone (360)577-7222 Fax (360)636-1068 www.alsglobal.com
RIGHT SOLUTIONS | RIGHT PARTNER
8 of 113

Project Manager e,r-.,.,_J.. Company
Address
Phone#
tC'uENT SAMPLE ID
I~" 3. , ..................
4. " 5.
CHAIN OF CUSTODY
1111111111111111111111111 66252 1001
I
I 1317 South 13th Ave, Kelso, WA 98626 Phone (360) 577-7222/800-695-7222 I FAX (360) 636-1068
www.alsglobal.com
J: J: 0 0 0 "' "" .. .. Project Number
w i ~ w ~ z K
~ 0 c • ~ • • ?;: ~ ~ z ~ I 0 ~ ~
" 0 0 0 0
N w 2 "' > 0 ~ ::\ m
" u ~ ~ ~ 3 0 m • ~ ;;; ;:; w
" ~ ~ I 9 ~ m w 0 0 0 " 0 0 0 3 ~ m 0 0 - 0 ;;; ~
" " ~ w ~ ~ ~
~ ~ ~ ~ ~ ~ ~ ~ w z w " " m " " " 0 ~
Sampler Printed Name
LA BID SAMPLING I
Date Time Matrix
0
"' "'
~ ~ ~ g E <
~ c
" 0
" M
;;; I z 0 0 ~ 0
~ ~ ~
" "
0 0
"' ~
~
" 0 ~
;:; ;:; ~
"
SR# ~ttonll1::1V COG Set __ of __
COC# I "of' 3
Page 1 of 2 0 0> 0> 0>
Remarks
6. .. / ........... 7.
8.
9. •• "
Report Requirements _ f. Routine Report: Method
Blank, Surrogate, as required
_II. Report Dup., MS, MSD as required
Ill. CLP Like Summary - (no raw data)
_ IV. Data Validation Report
V.EDD
Relinquished By:
'
Date/Tillhe . '
Invoice nformation P.O.#_~---,--Bill To: C;;.i of Lo~, •. ~
Turnaround Requirements _24hr
5 Day _!(__Standard
_48hr
Requested Repor1 ate
/1 Rac~iyed By: ;xr~-..
Circle whtch metals are to be analyzed
Total Metals: AI As Sb Ba Be 8 Ca Cd Co Cr Cu Fe Pb Mg Mn Mo Ni K Ag Na Se Sr Tl Sn V Zn Hg
Dissolved MetalsQ!} @> (®> @)~ B ~ Co®~®®>~ Mo ~@ ®> Sr@ So V @@ Special Instructions/Comments: !*Indicate State Hydrocarbon Procedure: AK CA Wlit:Lorthweq' Other (Circle One)
c1,dt - "··~"'~' ... J- C !'leo~! /~yJ-.r~ s..,fp:tfe. ( tlz:5) S"J-cA - '1:o-; .. L -<nJ '!> ~<,)o\.><J
fl·~n).t.. - ';i.~~·'"'J (~') Relinquished By: Received By: Relinquished By: Received By:
Signature Signature Signature Signature
J\t~Name Printed Name Printed Name Printed Name Printed Name
Firm Firm Firm Firm
D tel ·me Date/Time Daternme DateiTime Date/Time
9 of 113

ProjectManageri3rct..l. fk~lpS
Company
Address
Phone# So)'&_ '5"7 2..- '-{ 1 ., '-{
Sampler Signatur:-0.."i>
~-\v {_-·.
CLIENT SAMPLE ID
2.
3.
4.
5.
6.
7.
8.
9.
10.
Report Requirements L Routine Report: Method
-Blank, Surrogate, as required
_II. Report Dup., MS, MSD as required
_ IlL CLP Like Summary (no raw data)
_ JV. Data Validation Report
V. EDD
Relinquished By: ./)_
Fir{! itZII\i\ Date/Time
CHAIN OF CUSTODY
1111111111111111111111111 66254 1317 South 13th Ave, Kelso, WA 98626 Phone (360} 577·72221800-695-72221 FAX (360) 636-1068
Project Number
email p / f/ ~r .. /. >. f}(! c ZJ'<. C<>""'-Sampler Printed Name
~\>~[fX LA BID
SAMPLING Date Time
Invoice Information
Matrix
w ~ ~ w
" z w i! I
~ z ~ 0
0 5 ~ z 0 X ~ ± w m
" ~
" ~
z 5
www.alsglobal.com
0 0
"' 0
"'
I w ~ ~ ~ " ' 5' s ~ z z ~
X
~ ~
0 rn
± :: I ~ ~
~ ~ ~ s s ~ Remarks
Cjrcle which metals are to be analyzed
sR#~~la n01q<D 1
COC Set __ of __
COG# 3 .::>£ J Page 1 of 1
p .0.#:---;:,-..,-----;--Bill To: Ctr ,f
LOI\j < ,-.,..., Total Metals: AI As Sb Ba Be 8 Ca Cd Co Cr Cu Fe Pb Mg Mn Mo Ni K Ag Na Se Sr Tl Sn V Zn Hg
Dissolved Metals: AI As Sb Ba Be B Ca Cd Co Cr Cu Fe Pb Mg Mn Mo Ni K Ag Na Se Sr Tl Sn V Zn Hg
Turnaround Requirements 24 hr
_soay _Standard
_48hr
equested Report Date
I.!_ R\'!>f'ived By: ~~ \Nu-Jiv
D~te/lime
Special Instructions/Comments:
Relinquished By:
Signature
Printed Name
Firm
Date/Time
I "Indicate State Hydrocarbon Procedure: AK CA WI Northwest Other (Circle One)
Received By: Relinquished By: Received By:
Signature Signature Signature
Printed Name Printed Name Printed Name
Firm Firm Firm
Date/Time Date/Time Date/Time
10 of 113

A lllllllllllllllllllllllll HAIN OF CUSTODY iO R#
66252 I COG Set__ of __
--- ------ ---------- COC# 2. of 3 1317 South 13th Ave, Kelso WA 98626 Phone {360) 577-7222/800-695-7222/ FAX (360) 636-1068
Page 2 of 2 . www alsglobal.com
c 01 s
Project Name Project Number 0
"' ProJect Manager "' "' Company
w ~ 0 w " z 0
Address ~ M
" 0
" z z Phone# ema11 0 N " 0 0 ~ " z Sampler Signature Sampler Pnnted Name 0 ~ " ~ 0 w
" " ro " " a *
~ z ;;'i - Remarks
SAMPLING Matrix CLIENT SAMPLE 10 LASlO Date Time
1.
2.
3.
4.
5.
6.
7.
8. .
9.
10. Report Requirements Invoice Information
Qir!<!~ which metals are to bS! S!Q@I)(Zed
_ I. Routine Report: Method P.O.# Blank, Surrogate, as Bill To: Total Metals: AI As Sb Ba Be B Ca Cd Co Cr Cu Fe Pb Mg Mn Mo Ni K Ag Na Se Sr Tl Sn V Zn Hg required
Dissolved Metals: AI As Sb Ba Be B Ca Cd Co Cr Cu Fe Pb Mg Mn Mo Ni K Ag Na Se Sr Tl Sn v Zn Hg _II. Report Dup., MS, MSD
as required Special Instructions/Comments: I *Indicate State Hydrocarbon Procedure: AK CA WI Northwest Other (Circle One)
_Ill. CLP Uke Summary Turnaround Requirements
(no raw data) 24 hr _48hr _5Day
_IV. Data Validation Report - Standard
V. EDD Request Report Date
Relinquished By: Received By: Relinquished By: Received By: Relinquished By: Received By:
Signature Signature Signature Signature Signature Signature
Printed Name Printed Name Printed Name Printed Name Printed Name Printed Name
Firm Firm Firm Firm Firm Firm
Date/Time Date/Time Date/Time Date/Time DatefTime DatefTime
11 of 113

A PC (!f._ Cooler Receipt and Preservation Form
Client {!tf!lm Ud( -~/e~RequestKJ6 atJIW ptf3 Received: t/ ~ft (R Opened: l /:1jUe By: ~ Unloaded:lf'1_J£v By: 1 1 r , I. Sampleswerereceivedvia? Mail FedEx UPS DHL PDX Courier ~ 2. Samples were received in: (circle) Envelope NA
3. Were custody seals on coolers?
If present, were custody seals intact?
8 Box
NA rNJ N
(!j)N
Other fyiDif dwhere? ft ~ If yes, how many an ' ,__!
If present, were they signed and dated? N
··. I .. ·._ .• -.• .:..., .• · .. . ·• · .• Corr,_ I .•. T~ermometer poo!eriCOC I~ ll ·• .. • .Tracking Number .
DFiled RaW'<'> COrrected. ~!!~eted .·~
CoolerXeri1P COoter Tenin Terhn:Biank Tern Blank Factor .· IIY . ·•• . ·.·. ·.· NA . . 12. ,'-_; III/ .. $? t:LS ll-~ -f:3 :3':'5/ -If!).,~ JJ... '1 ~ --j-. -:?~ De:./_)
/ ")., /
5. Were custody papers properly filled out (ink, signed, etc.)?
6. Did all bottles arrive in good condition (unbroken)? Indicate in the table below.
7. Were all sample labels complete (i.e analysis, preservation, etc.)?
8. Did all sample labels and tags agree with custody papers? Indicate major discrepancies in the table on page 2.
9. Were appropriate bottles/containers and volumes received for the tests indicated?
I 0. Were the pH-preserved bottles (see SMO GEN SOP) received at the appropriate pH? Indicate in the table below
II. Were VOA vials received without headspace? Indicate in the table below.
Sample 10 on Bottle Sample 10 on COC Identified by:
NA
NA
NA
NA
NA
NA
NA
-
~N
I . N j
<rv<y ·, N
ffl<...:___; N
N
N
v@
Bottle Count Out of Head- Volume Reagent Lot Sample 10 BoHle Type Temo soace Broke DH Reaaent added Number Initials Time
IA.rrrY -res+ tJ.til mr /J(}fll A X .. . .
Notes, Discrepancies, & Resolutions: _____________________________________ _
~ v,\! \8 Aii0M F*' li:iP \4 'it/ fifi4). \1\
I ~
Page __ of __
12 of 113

ProjectManager~ 'P/J'!!Jif
~
CLIENT SAMPLE ID
2.
3.
4.
5.
6.
7.
8.
9.
10. Report Requirements
_ l. Routine Report: Method Blank, Surrogate, as required
_ II. Report Dup., MS, MSD as required
_Ill. CLP Like Summary (no raw data)
_ IV_ Data Validation Report
V.EDD
Relinquished~
Si~<'!t" ~ ~
Firm ~ cifZ;Yl Date/Time lfflf.J_ Cl' 1.1/'
t -,~ ' I VlfM
1111111111111111111111111
CHAIN OF CUSTODY
66851 1 sR# ~~ 11n or11J CDC Set_l_ot_l_ COG# ____ _
1317 South 13th Ave. Kelso, WA 98626 Phone (360) 577-722218004395-7222 I FAX (360) 636-1068
www.alsglobaLcom Page 1 of 1
Remarks
LA BID SAMPLING
Date Time Matrix
Invoice Information p .0.#:--,-r---;;---r::-~--Bill To: (', q w ~1/!p>.)
7b lfm'l /)qi.; Turnaround Requirements
24 hr _48hr 5 Day X standard
___,.J equested Report O?Je' ,/
Printeo Name
.n-rc Firm
1_
r!s>lu DatefTime
-~ ..
q
Circle which metals are to be analyzed
Total Metals: AI As Sb Ba Be B Ca Cd Co Cr Cu Fe Pb Mg Mn Mo Ni K Ag Na Se Sr Tl Sn V Zn Hg
Dissolved Metals: AI As Sb Ba Be 8 Ca Cd Co Cr Cu Fe Pb Mg Mn Mo Ni K Ag Na Se Sr Tl Sn V Zn Hg
Special Instructions/Comments: I *Indicate State Hydrocarbon Procedure: AK CA WI Northwest Other (Circle One)
Relinquished By: Received By: Relinquished By: Received By:
Signature Signature Signature Signature
Printed Name Printed Name Printed Name Printed Name
Firm Firm Firm Firm
Date/Time Dateffime Date/Time Dateffime
13 of 113

PC CL Cooler Receipt and Preservation Form
Client &J/211/1 /f;?& Service RequestKJ6
;/Y/rv Opened: ;U /;c By:~ ~ I
Unloaded:
oor:m 1ft /;G By_;;c. Received:
I. Samples were received via? Mail Fed Ex UPS
2. Samples were received in: (circle) ("1;~ Box
DHL PDX Courier ~;) Envelope Other __________ _ NA
3. Were custody seals on coolers? ~@ N
If present, were custody seals intact? 0 N
If yes, how many and where? _____ __,:....L'---------
If present, were they signed and dated? IV ·.
i .. : . ,..w-:c- .. ... ·.·, Corr. Thermometer Cooleri(;!'C ~ Trac~i'1g Number · · · """ "'w -' Cotrecte~~ 1 Corrected ~· Factor I· ID . NA ·,· ·.· lNA -cooler T-emp CoolerTem TemDBiank TemnBiank .·
5.& •? '1 ;?, g ? / o.J ~n -:>, ,,
.r.::.=~- ';.,c:.=:· l Jib' '\ 4. Packing material: ~~Ble Wrajl ~;:Jss Wet lee Dry lee Sleeves
5. Were custody papers properly filled out (ink, signed, etc.)?
6. Did all bottles arrive in good condition (unbroken)? Indicate in the table below.
7. Were all sample labels complete (i.e analysis, preservation, etc.)?
8. Did all sample labels and tags agree with custody papers? Indicate major discrepancies in the table on page 2.
9. Were appropriate bottles/containers and volumes received for the tests indicated?
10. Were the pH-preserved bottles (see SMO GEN SOP) received at the appropriate pH? Indicate in the table below
II. Were VOA vials received without headspace? Indicate in the table below.
.· Sample lD on Bottle Sample 10 on COC Identified by:
Bottle Count Out of Head- Volume Reagent Lot
-
NA Cf.__J
NA '¥' NA (0
NA @ NA cf.J !':)A? y
NA @
N
...: .
)ned
N
N
N
N
N
N
N
Sample ID Bottle Tvoe Temo soace Broke pH Reaaent added Number Initials Time
- -·--
Notes, Discrepancies, & Resolutions: Kn 'o tS V/ (rt s: (5 !lc_f ') , tJ 17/ 9 fr J 1"-'o rcacm-0 .I ?
tJtJ c' ct.
--
Page __ of. __ _
14 of 113
General Chemistry
ALS Environmental—Kelso Laboratory 1317 South 13th Avenue, Kelso, WA 98626 Phone (360)577-7222 Fax (360)636-1068 www.alsglobal.com
RIGHT SOLUTIONS | RIGHT PARTNER
15 of 113

Client:
01/7/16
K1600170
Date Received:Date Collected:
Service Request:
WaterCity of Longview RanneyCH2M Hill
Sample Matrix:Project: 01/7/16
Turbidity
Basis:Units: NTU
NA180.1NonePrep Method:
Analysis Method:
Lab CodeSample NameDate
AnalyzedDil.MRLResult Q
WTP TEST WELL 01/08/16 08:5610.205.11K1600170-001Method Blank 01/07/16 15:0010.20 UNDK1600170-MB1
Analytical Report
ALS Group USA, Corp. dba ALS Environmental
Printed 1/19/2016 11:46:04 AM 16-0000360691 rev 00Superset Reference:
16 of 113

ALS Group USA, Corp.dba ALS Environmental
QA/QC Report
Client:ProjectSample Matrix:
Prep Method:Analysis Method:
CH2M HillCity of Longview RanneyWater
180.1None
Service Request:Date Collected:Date Received:
Basis:Units:
K160017001/07/1601/07/16
NTUNA
Replicate Sample SummaryTurbidity
Sample Name: Lab Code:Date
AnalyzedRPDLimitMRL RPD
DuplicateResult Average
SampleResult
1 0.20 0.46 0.47 0.465 20Batch QC K1600148-005DUP 01/07/16<1 0.20 5.11 5.06 5.09 20WTP TEST WELL K1600170-001DUP 01/08/16
Results flagged with an asterisk (*) indicate values outside control criteria.
Results flagged with a pound (#) indicate the control criteria is not applicable.
Percent recoveries and relative percent differences (RPD) are determined by the software using values in the calculation which have not been rounded.
Printed 1/19/2016 11:46:04 AM 16-0000360691 rev 00Superset Reference:
17 of 113

Sample Name
K1600170Date Analyzed:Service Request:
WaterCity of Longview RanneyCH2M Hill
Sample Matrix:Project:Client:
Lab Control Sample SummaryTurbidity
Analysis Method:Prep Method:
180.1None NA
NTUBasis:Units:
Analysis Lot: 479379
01/07/16
Spike AmountResult % Rec
% Rec Limits
NADate Extracted:
Lab Code
dba ALS EnvironmentalALS Group USA, Corp.
QA/QC Report
Lab Control Sample 90-110101 4.234.29K1600170-LCS1
16-0000360691 rev 00Superset Reference:Printed 1/19/2016 11:46:05 AM
18 of 113

Client:
01/7/16
K1600170
Date Received:Date Collected:
Service Request:
WaterCity of Longview RanneyCH2M Hill
Sample Matrix:Project: 01/7/16
Chloride
Basis:Units: mg/L
NA300.0MethodPrep Method:
Analysis Method:
Lab CodeSample NameDate
AnalyzedDate
ExtractedDil.MRLResult Q
WTP TEST WELL 01/08/16 11:07 1/7/1620.206.19K1600170-001Method Blank 01/08/16 10:53 1/7/1610.10 UNDK1600170-MB1
Analytical Report
ALS Group USA, Corp. dba ALS Environmental
Printed 2/1/2016 1:24:35 PM 16-0000360691 rev 00Superset Reference:
19 of 113

ALS Group USA, Corp.dba ALS Environmental
QA/QC Report
Client:ProjectSample Matrix:
Prep Method:Analysis Method:
CH2M HillCity of Longview RanneyWater
300.0Method
Service Request:Date Collected:Date Received:
Basis:Units:
K160017001/07/1601/07/16
mg/LNA
Replicate Sample SummaryChloride
Sample Name: Lab Code:Date
AnalyzedRPDLimitMRL RPD
DuplicateResult Average
SampleResult
<1 0.20 6.19 6.14 6.16 20WTP TEST WELL K1600170-001DUP1 01/08/16NC 0.10 ND U 0.46 NC 20Batch QC K1600179-001DUP 01/09/16
Results flagged with an asterisk (*) indicate values outside control criteria.
Results flagged with a pound (#) indicate the control criteria is not applicable.
Percent recoveries and relative percent differences (RPD) are determined by the software using values in the calculation which have not been rounded.
Printed 2/1/2016 1:24:35 PM 16-0000360691 rev 00Superset Reference:
20 of 113

QA/QC Report
mg/LK1600170-001 Basis:Lab Code:
Units:Sample Name: WTP TEST WELL
ChlorideDuplicate Matrix Spike Summary
NA
Client:Project:Sample Matrix:
CH2M HillCity of Longview RanneyWater
Service Request:
Date Analyzed:Date Received:
K1600170
01/8/1601/07/16
Date Collected: 01/07/16
Method300.0
Prep Method:Analysis Method:
Analyte NameRPD LimitRPDResult
Sample Result
Spike Amount % Rec
Matrix SpikeK1600170-001MS1 K1600170-001DMS1
Duplicate Matrix Spike
% RecSpike
AmountResult% Rec Limits
ALS Group USA, Corp.dba ALS Environmental
01/7/16Date Extracted:
Chloride 6.19 10.6 4.00 110 10.7 4.00 112 * 90-110 <1 20
Results flagged with an asterisk (*) indicate values outside control criteria.
Results flagged with a pound (#) indicate the control criteria is not applicable.
Percent recoveries and relative percent differences (RPD) are determined by the software using values in the calculation which have not been rounded.
Printed 2/1/2016 1:24:36 PM 16-0000360691 rev 00Superset Reference:
21 of 113
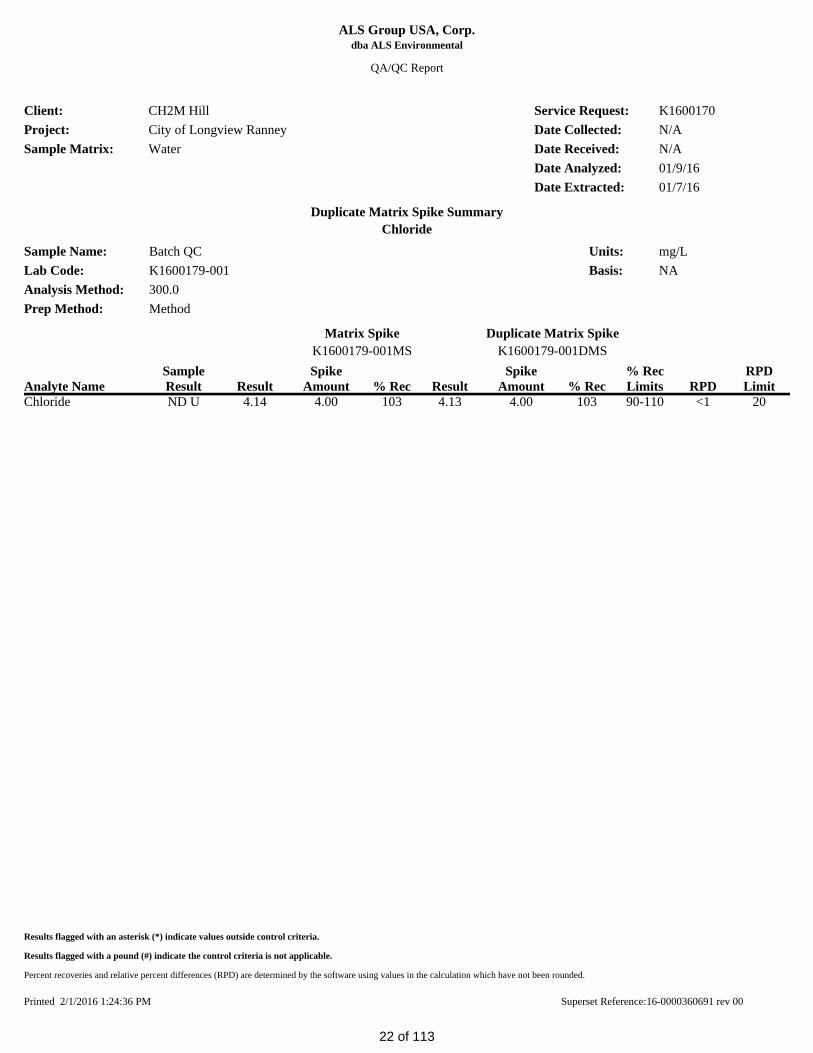
QA/QC Report
mg/LK1600179-001 Basis:Lab Code:
Units:Sample Name: Batch QC
ChlorideDuplicate Matrix Spike Summary
NA
Client:Project:Sample Matrix:
CH2M HillCity of Longview RanneyWater
Service Request:
Date Analyzed:Date Received:
K1600170
01/9/16N/A
Date Collected: N/A
Method300.0
Prep Method:Analysis Method:
Analyte NameRPD LimitRPDResult
Sample Result
Spike Amount % Rec
Matrix SpikeK1600179-001MS K1600179-001DMS
Duplicate Matrix Spike
% RecSpike
AmountResult% Rec Limits
ALS Group USA, Corp.dba ALS Environmental
01/7/16Date Extracted:
Chloride ND U 4.13 4.00 103 4.14 4.00 103 90-110 <1 20
Results flagged with an asterisk (*) indicate values outside control criteria.
Results flagged with a pound (#) indicate the control criteria is not applicable.
Percent recoveries and relative percent differences (RPD) are determined by the software using values in the calculation which have not been rounded.
Printed 2/1/2016 1:24:36 PM 16-0000360691 rev 00Superset Reference:
22 of 113

Sample Name
K1600170Date Analyzed:Service Request:
WaterCity of Longview RanneyCH2M Hill
Sample Matrix:Project:Client:
Lab Control Sample SummaryChloride
Analysis Method:Prep Method:
300.0Method NA
mg/LBasis:Units:
Analysis Lot: 479376
01/08/16
Spike AmountResult % Rec
% Rec Limits
01/07/16Date Extracted:
Lab Code
dba ALS EnvironmentalALS Group USA, Corp.
QA/QC Report
Lab Control Sample 90-11096 5.004.82K1600170-LCS1
16-0000360691 rev 00Superset Reference:Printed 2/1/2016 1:24:36 PM
23 of 113

Client:
01/7/16
K1600170
Date Received:Date Collected:
Service Request:
WaterCity of Longview RanneyCH2M Hill
Sample Matrix:Project: 01/7/16
Nitrite as Nitrogen
Basis:Units: mg/L
NA300.0MethodPrep Method:
Analysis Method:
Lab CodeSample NameDate
AnalyzedDate
ExtractedDil.MRLResult Q
WTP TEST WELL 01/08/16 11:07 1/7/1620.10 UNDK1600170-001Method Blank 01/08/16 10:53 1/7/1610.050 UNDK1600170-MB1
Analytical Report
ALS Group USA, Corp. dba ALS Environmental
Printed 2/1/2016 1:24:36 PM 16-0000360691 rev 00Superset Reference:
24 of 113

ALS Group USA, Corp.
QA/QC Report
Client:ProjectSample Matrix: Water
City of Longview RanneyCH2M Hill Service Request: K1600170
01/07/16Date Collected:Date Received: 01/07/16
01/08/16Date Analyzed:
Replicate Sample SummaryGeneral Chemistry Parameters
WTP TEST WELL mg/LBasis:Units:
K1600170-001 NALab Code:Sample Name:
RPD LimitMRLAnalysis Method RPD
Duplicate SampleK1600170-001DUP1
Result AverageSampleResultAnalyte Name
dba ALS Environmental
Nitrite as Nitrogen NC 0.10 ND U ND U NC 20300.0
Results flagged with an asterisk (*) indicate values outside control criteria.
Results flagged with a pound (#) indicate the control criteria is not applicable.
Percent recoveries and relative percent differences (RPD) are determined by the software using values in the calculation which have not been rounded.
Printed 2/1/2016 1:24:36 PM 16-0000360691 rev 00Superset Reference:
25 of 113

QA/QC Report
mg/LK1600170-001 Basis:Lab Code:
Units:Sample Name: WTP TEST WELL
Nitrite as NitrogenDuplicate Matrix Spike Summary
NA
Client:Project:Sample Matrix:
CH2M HillCity of Longview RanneyWater
Service Request:
Date Analyzed:Date Received:
K1600170
01/8/1601/07/16
Date Collected: 01/07/16
Method300.0
Prep Method:Analysis Method:
Analyte NameRPD LimitRPDResult
Sample Result
Spike Amount % Rec
Matrix SpikeK1600170-001MS1 K1600170-001DMS1
Duplicate Matrix Spike
% RecSpike
AmountResult% Rec Limits
ALS Group USA, Corp.dba ALS Environmental
01/7/16Date Extracted:
Nitrite as Nitrogen ND U 4.21 4.00 105 4.28 4.00 107 90-110 2 20
Results flagged with an asterisk (*) indicate values outside control criteria.
Results flagged with a pound (#) indicate the control criteria is not applicable.
Percent recoveries and relative percent differences (RPD) are determined by the software using values in the calculation which have not been rounded.
Printed 2/1/2016 1:24:36 PM 16-0000360691 rev 00Superset Reference:
26 of 113

Sample Name
K1600170Date Analyzed:Service Request:
WaterCity of Longview RanneyCH2M Hill
Sample Matrix:Project:Client:
Lab Control Sample SummaryNitrite as Nitrogen
Analysis Method:Prep Method:
300.0Method NA
mg/LBasis:Units:
Analysis Lot: 479376
01/08/16
Spike AmountResult % Rec
% Rec Limits
01/07/16Date Extracted:
Lab Code
dba ALS EnvironmentalALS Group USA, Corp.
QA/QC Report
Lab Control Sample 90-110105 2.502.63K1600170-LCS1
16-0000360691 rev 00Superset Reference:Printed 2/4/2016 10:39:43 AM
27 of 113

Client:
01/7/16
K1600170
Date Received:Date Collected:
Service Request:
WaterCity of Longview RanneyCH2M Hill
Sample Matrix:Project: 01/7/16
Nitrate as Nitrogen
Basis:Units: mg/L
NA300.0MethodPrep Method:
Analysis Method:
Lab CodeSample NameDate
AnalyzedDate
ExtractedDil.MRLResult Q
WTP TEST WELL 01/08/16 11:07 1/7/1620.10 UNDK1600170-001Method Blank 01/08/16 10:53 1/7/1610.050 UNDK1600170-MB1
Analytical Report
ALS Group USA, Corp. dba ALS Environmental
Printed 2/1/2016 1:24:36 PM 16-0000360691 rev 00Superset Reference:
28 of 113

ALS Group USA, Corp.dba ALS Environmental
QA/QC Report
Client:ProjectSample Matrix:
Prep Method:Analysis Method:
CH2M HillCity of Longview RanneyWater
300.0Method
Service Request:Date Collected:Date Received:
Basis:Units:
K160017001/07/1601/07/16
mg/LNA
Replicate Sample SummaryNitrate as Nitrogen
Sample Name: Lab Code:Date
AnalyzedRPDLimitMRL RPD
DuplicateResult Average
SampleResult
NC 0.10 ND U ND U NC 20WTP TEST WELL K1600170-001DUP1 01/08/162 0.050 0.219 0.216 0.217 20Batch QC K1600179-001DUP 01/09/16
Results flagged with an asterisk (*) indicate values outside control criteria.
Results flagged with a pound (#) indicate the control criteria is not applicable.
Percent recoveries and relative percent differences (RPD) are determined by the software using values in the calculation which have not been rounded.
Printed 2/1/2016 1:24:36 PM 16-0000360691 rev 00Superset Reference:
29 of 113
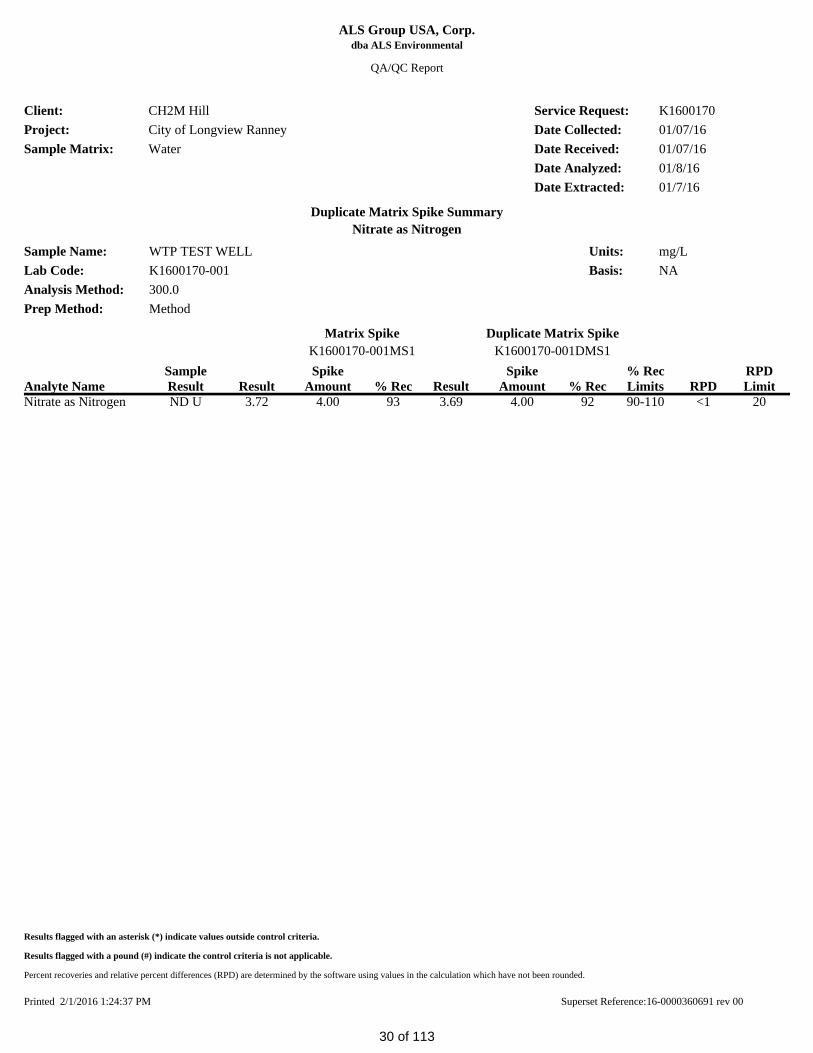
QA/QC Report
mg/LK1600170-001 Basis:Lab Code:
Units:Sample Name: WTP TEST WELL
Nitrate as NitrogenDuplicate Matrix Spike Summary
NA
Client:Project:Sample Matrix:
CH2M HillCity of Longview RanneyWater
Service Request:
Date Analyzed:Date Received:
K1600170
01/8/1601/07/16
Date Collected: 01/07/16
Method300.0
Prep Method:Analysis Method:
Analyte NameRPD LimitRPDResult
Sample Result
Spike Amount % Rec
Matrix SpikeK1600170-001MS1 K1600170-001DMS1
Duplicate Matrix Spike
% RecSpike
AmountResult% Rec Limits
ALS Group USA, Corp.dba ALS Environmental
01/7/16Date Extracted:
Nitrate as Nitrogen ND U 3.69 4.00 92 3.72 4.00 93 90-110 <1 20
Results flagged with an asterisk (*) indicate values outside control criteria.
Results flagged with a pound (#) indicate the control criteria is not applicable.
Percent recoveries and relative percent differences (RPD) are determined by the software using values in the calculation which have not been rounded.
Printed 2/1/2016 1:24:37 PM 16-0000360691 rev 00Superset Reference:
30 of 113

QA/QC Report
mg/LK1600179-001 Basis:Lab Code:
Units:Sample Name: Batch QC
Nitrate as NitrogenDuplicate Matrix Spike Summary
NA
Client:Project:Sample Matrix:
CH2M HillCity of Longview RanneyWater
Service Request:
Date Analyzed:Date Received:
K1600170
01/9/16N/A
Date Collected: N/A
Method300.0
Prep Method:Analysis Method:
Analyte NameRPD LimitRPDResult
Sample Result
Spike Amount % Rec
Matrix SpikeK1600179-001MS K1600179-001DMS
Duplicate Matrix Spike
% RecSpike
AmountResult% Rec Limits
ALS Group USA, Corp.dba ALS Environmental
01/7/16Date Extracted:
Nitrate as Nitrogen 0.219 4.17 4.00 99 4.13 4.00 98 90-110 1 20
Results flagged with an asterisk (*) indicate values outside control criteria.
Results flagged with a pound (#) indicate the control criteria is not applicable.
Percent recoveries and relative percent differences (RPD) are determined by the software using values in the calculation which have not been rounded.
Printed 2/1/2016 1:24:37 PM 16-0000360691 rev 00Superset Reference:
31 of 113

Sample Name
K1600170Date Analyzed:Service Request:
WaterCity of Longview RanneyCH2M Hill
Sample Matrix:Project:Client:
Lab Control Sample SummaryNitrate as Nitrogen
Analysis Method:Prep Method:
300.0Method NA
mg/LBasis:Units:
Analysis Lot: 479376
01/08/16
Spike AmountResult % Rec
% Rec Limits
01/07/16Date Extracted:
Lab Code
dba ALS EnvironmentalALS Group USA, Corp.
QA/QC Report
Lab Control Sample 90-11095 2.502.38K1600170-LCS1
16-0000360691 rev 00Superset Reference:Printed 2/1/2016 1:24:37 PM
32 of 113

Client:
01/7/16
K1600170
Date Received:Date Collected:
Service Request:
WaterCity of Longview RanneyCH2M Hill
Sample Matrix:Project: 01/7/16
Sulfate
Basis:Units: mg/L
NA300.0MethodPrep Method:
Analysis Method:
Lab CodeSample NameDate
AnalyzedDate
ExtractedDil.MRLResult Q
WTP TEST WELL 01/08/16 11:07 1/7/1620.206.52K1600170-001Method Blank 01/08/16 10:53 1/7/1610.10 UNDK1600170-MB1
Analytical Report
ALS Group USA, Corp. dba ALS Environmental
Printed 1/19/2016 11:46:08 AM 16-0000360691 rev 00Superset Reference:
33 of 113

ALS Group USA, Corp.dba ALS Environmental
QA/QC Report
Client:ProjectSample Matrix:
Prep Method:Analysis Method:
CH2M HillCity of Longview RanneyWater
300.0Method
Service Request:Date Collected:Date Received:
Basis:Units:
K160017001/07/1601/07/16
mg/LNA
Replicate Sample SummarySulfate
Sample Name: Lab Code:Date
AnalyzedRPDLimitMRL RPD
DuplicateResult Average
SampleResult
2 0.20 6.52 6.42 6.47 20WTP TEST WELL K1600170-001DUP 01/08/162 0.10 1.80 1.76 1.78 20Batch QC K1600179-001DUP 01/09/16
Results flagged with an asterisk (*) indicate values outside control criteria.
Results flagged with a pound (#) indicate the control criteria is not applicable.
Percent recoveries and relative percent differences (RPD) are determined by the software using values in the calculation which have not been rounded.
Printed 1/19/2016 11:46:08 AM 16-0000360691 rev 00Superset Reference:
34 of 113

QA/QC Report
mg/LK1600170-001 Basis:Lab Code:
Units:Sample Name: WTP TEST WELL
SulfateDuplicate Matrix Spike Summary
NA
Client:Project:Sample Matrix:
CH2M HillCity of Longview RanneyWater
Service Request:
Date Analyzed:Date Received:
K1600170
01/8/1601/07/16
Date Collected: 01/07/16
Method300.0
Prep Method:Analysis Method:
Analyte NameRPD LimitRPDResult
Sample Result
Spike Amount % Rec
Matrix SpikeK1600170-001MS K1600170-001DMS
Duplicate Matrix Spike
% RecSpike
AmountResult% Rec Limits
ALS Group USA, Corp.dba ALS Environmental
01/7/16Date Extracted:
Sulfate 6.52 11.0 4.00 113 *11.0 4.00 113 * 90-110 <1 20
Results flagged with an asterisk (*) indicate values outside control criteria.
Results flagged with a pound (#) indicate the control criteria is not applicable.
Percent recoveries and relative percent differences (RPD) are determined by the software using values in the calculation which have not been rounded.
Printed 1/19/2016 11:46:09 AM 16-0000360691 rev 00Superset Reference:
35 of 113

QA/QC Report
mg/LK1600179-001 Basis:Lab Code:
Units:Sample Name: Batch QC
SulfateDuplicate Matrix Spike Summary
NA
Client:Project:Sample Matrix:
CH2M HillCity of Longview RanneyWater
Service Request:
Date Analyzed:Date Received:
K1600170
01/9/16N/A
Date Collected: N/A
Method300.0
Prep Method:Analysis Method:
Analyte NameRPD LimitRPDResult
Sample Result
Spike Amount % Rec
Matrix SpikeK1600179-001MS K1600179-001DMS
Duplicate Matrix Spike
% RecSpike
AmountResult% Rec Limits
ALS Group USA, Corp.dba ALS Environmental
01/7/16Date Extracted:
Sulfate 1.80 5.84 4.00 101 5.73 4.00 98 90-110 2 20
Results flagged with an asterisk (*) indicate values outside control criteria.
Results flagged with a pound (#) indicate the control criteria is not applicable.
Percent recoveries and relative percent differences (RPD) are determined by the software using values in the calculation which have not been rounded.
Printed 1/19/2016 11:46:09 AM 16-0000360691 rev 00Superset Reference:
36 of 113

Sample Name
K1600170Date Analyzed:Service Request:
WaterCity of Longview RanneyCH2M Hill
Sample Matrix:Project:Client:
Lab Control Sample SummarySulfate
Analysis Method:Prep Method:
300.0Method NA
mg/LBasis:Units:
Analysis Lot: 479376
01/08/16
Spike AmountResult % Rec
% Rec Limits
01/07/16Date Extracted:
Lab Code
dba ALS EnvironmentalALS Group USA, Corp.
QA/QC Report
Lab Control Sample 90-11095 5.004.76K1600170-LCS1
16-0000360691 rev 00Superset Reference:Printed 1/19/2016 11:46:09 AM
37 of 113

Client:
01/7/16
K1600170
Date Received:Date Collected:
Service Request:
WaterCity of Longview RanneyCH2M Hill
Sample Matrix:Project: 01/7/16
Cyanide, Total
Basis:Units: mg/L
NA335.4MethodPrep Method:
Analysis Method:
Lab CodeSample NameDate
AnalyzedDate
ExtractedDil.MRLResult Q
WTP TEST WELL 01/12/16 15:57 1/12/1610.010 UNDK1600170-001Method Blank 01/12/16 15:57 1/12/1610.010 UNDK1600170-MB1
Analytical Report
ALS Group USA, Corp. dba ALS Environmental
Printed 1/19/2016 11:46:09 AM 16-0000360691 rev 00Superset Reference:
38 of 113

ALS Group USA, Corp.
QA/QC Report
Client:ProjectSample Matrix: Water
City of Longview RanneyCH2M Hill Service Request: K1600170
01/07/16Date Collected:Date Received: 01/07/16
01/12/16Date Analyzed:
Replicate Sample SummaryGeneral Chemistry Parameters
WTP TEST WELL mg/LBasis:Units:
K1600170-001 NALab Code:Sample Name:
RPD LimitMRLAnalysis Method RPD
Duplicate SampleK1600170-
001DUP Result Average
SampleResultAnalyte Name
dba ALS Environmental
Cyanide, Total NC 0.010 ND U ND U NC 20335.4
Results flagged with an asterisk (*) indicate values outside control criteria.
Results flagged with a pound (#) indicate the control criteria is not applicable.
Percent recoveries and relative percent differences (RPD) are determined by the software using values in the calculation which have not been rounded.
Printed 1/19/2016 11:46:09 AM 16-0000360691 rev 00Superset Reference:
39 of 113

QA/QC Report
mg/LK1600170-001 Basis:Lab Code:
Units:Sample Name: WTP TEST WELL
Cyanide, TotalDuplicate Matrix Spike Summary
NA
Client:Project:Sample Matrix:
CH2M HillCity of Longview RanneyWater
Service Request:
Date Analyzed:Date Received:
K1600170
01/12/1601/07/16
Date Collected: 01/07/16
Method335.4
Prep Method:Analysis Method:
Analyte NameRPD LimitRPDResult
Sample Result
Spike Amount % Rec
Matrix SpikeK1600170-001MS K1600170-001DMS
Duplicate Matrix Spike
% RecSpike
AmountResult% Rec Limits
ALS Group USA, Corp.dba ALS Environmental
01/12/16Date Extracted:
Cyanide, Total ND U 0.103 0.100 103 0.104 0.100 104 90-110 <1 20
Results flagged with an asterisk (*) indicate values outside control criteria.
Results flagged with a pound (#) indicate the control criteria is not applicable.
Percent recoveries and relative percent differences (RPD) are determined by the software using values in the calculation which have not been rounded.
Printed 1/19/2016 11:46:09 AM 16-0000360691 rev 00Superset Reference:
40 of 113
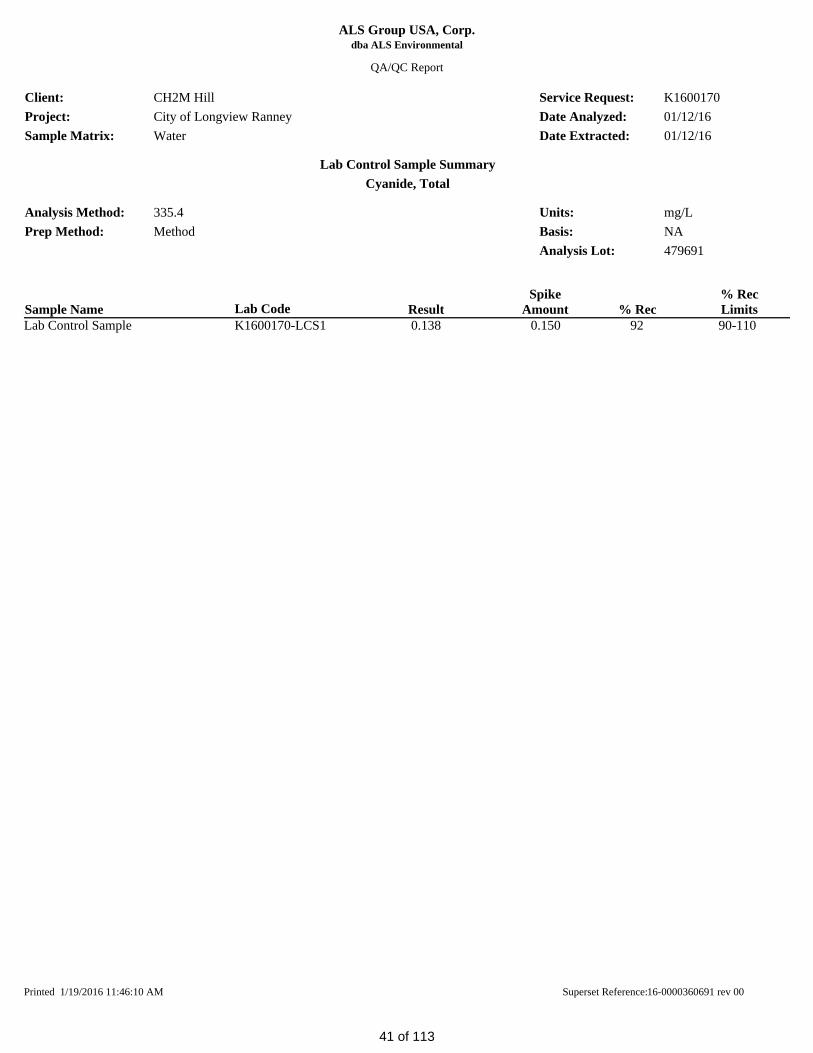
Sample Name
K1600170Date Analyzed:Service Request:
WaterCity of Longview RanneyCH2M Hill
Sample Matrix:Project:Client:
Lab Control Sample SummaryCyanide, Total
Analysis Method:Prep Method:
335.4Method NA
mg/LBasis:Units:
Analysis Lot: 479691
01/12/16
Spike AmountResult % Rec
% Rec Limits
01/12/16Date Extracted:
Lab Code
dba ALS EnvironmentalALS Group USA, Corp.
QA/QC Report
Lab Control Sample 90-11092 0.1500.138K1600170-LCS1
16-0000360691 rev 00Superset Reference:Printed 1/19/2016 11:46:10 AM
41 of 113

Client:
01/7/16
K1600170
Date Received:Date Collected:
Service Request:
WaterCity of Longview RanneyCH2M Hill
Sample Matrix:Project: 01/7/16
Oxidation-Reduction Potential (ORP)
Basis:Units: mV
NAASTM D1498-00NonePrep Method:
Analysis Method:
Lab CodeSample NameDate
AnalyzedDil.MRLResult Q
WTP TEST WELL 01/08/16 09:001--30.25 HK1600170-001
Analytical Report
ALS Group USA, Corp. dba ALS Environmental
Printed 1/19/2016 2:23:15 PM 16-0000360691 rev 00Superset Reference:
42 of 113

ALS Group USA, Corp.
QA/QC Report
Client:ProjectSample Matrix: Water
City of Longview RanneyCH2M Hill Service Request: K1600170
01/07/16Date Collected:Date Received: 01/07/16
01/08/16Date Analyzed:
Replicate Sample SummaryGeneral Chemistry Parameters
WTP TEST WELL mVBasis:Units:
K1600170-001 NALab Code:Sample Name:
RPD LimitMRLAnalysis Method RPD
Duplicate Sample
K1600170-001DUP Result Average
SampleResultAnalyte Name
dba ALS Environmental
Oxidation-Reduction Potential (ORP) NC - -30.25 -30.25 -30.3 20ASTM D1498-00
Results flagged with an asterisk (*) indicate values outside control criteria.
Results flagged with a pound (#) indicate the control criteria is not applicable.
Percent recoveries and relative percent differences (RPD) are determined by the software using values in the calculation which have not been rounded.
Printed 1/19/2016 2:23:15 PM 16-0000360691 rev 00Superset Reference:
43 of 113

Sample Name
K1600170Date Analyzed:Service Request:
WaterCity of Longview RanneyCH2M Hill
Sample Matrix:Project:Client:
Lab Control Sample SummaryOxidation-Reduction Potential (ORP)
Analysis Method:Prep Method:
ASTM D1498-00None NA
mVBasis:Units:
Analysis Lot: 479333
01/08/16
Spike AmountResult % Rec
% Rec Limits
NADate Extracted:
Lab Code
dba ALS EnvironmentalALS Group USA, Corp.
QA/QC Report
Lab Control Sample 85-11594 480452K1600170-LCS1Lab Control Sample 85-11594 480452K1600170-LCS2
16-0000360691 rev 00Superset Reference:Printed 1/19/2016 11:46:10 AM
44 of 113

Client:
01/7/16
K1600170
Date Received:Date Collected:
Service Request:
WaterCity of Longview RanneyCH2M Hill
Sample Matrix:Project: 01/7/16
Nitrate+Nitrite as Nitrogen
Basis:Units: mg/L
NACalculationNonePrep Method:
Analysis Method:
Lab CodeSample NameDate
AnalyzedDil.MRLResult Q
WTP TEST WELL 01/07/16 23:1010.20 UNDK1600170-001
Analytical Report
ALS Group USA, Corp. dba ALS Environmental
Printed 1/19/2016 11:46:10 AM 16-0000360691 rev 00Superset Reference:
45 of 113

Client:
01/7/16
K1600170
Date Received:Date Collected:
Service Request:
WaterCity of Longview RanneyCH2M Hill
Sample Matrix:Project: 01/7/16
Color
Basis:Units: ColorUnits
NASM 2120 BNonePrep Method:
Analysis Method:
Lab CodeSample NameDate
AnalyzedDil.MRLResult Q
WTP TEST WELL 01/08/16 09:3215.020.0K1600170-001Method Blank 01/07/16 16:1915.0 UNDK1600170-MB1
Analytical Report
ALS Group USA, Corp. dba ALS Environmental
Printed 1/19/2016 11:46:11 AM 16-0000360691 rev 00Superset Reference:
46 of 113

ALS Group USA, Corp.
QA/QC Report
Client:ProjectSample Matrix: Water
City of Longview RanneyCH2M Hill Service Request: K1600170
01/07/16Date Collected:Date Received: 01/07/16
01/08/16Date Analyzed:
Replicate Sample SummaryGeneral Chemistry Parameters
WTP TEST WELL ColorUnitsBasis:Units:
K1600170-001 NALab Code:Sample Name:
RPD LimitMRLAnalysis Method RPD
Duplicate Sample
K1600170-001DUP Result Average
SampleResultAnalyte Name
dba ALS Environmental
Color <1 5.0 20.0 20.0 20.0 20SM 2120 B
Results flagged with an asterisk (*) indicate values outside control criteria.
Results flagged with a pound (#) indicate the control criteria is not applicable.
Percent recoveries and relative percent differences (RPD) are determined by the software using values in the calculation which have not been rounded.
Printed 1/19/2016 11:46:11 AM 16-0000360691 rev 00Superset Reference:
47 of 113
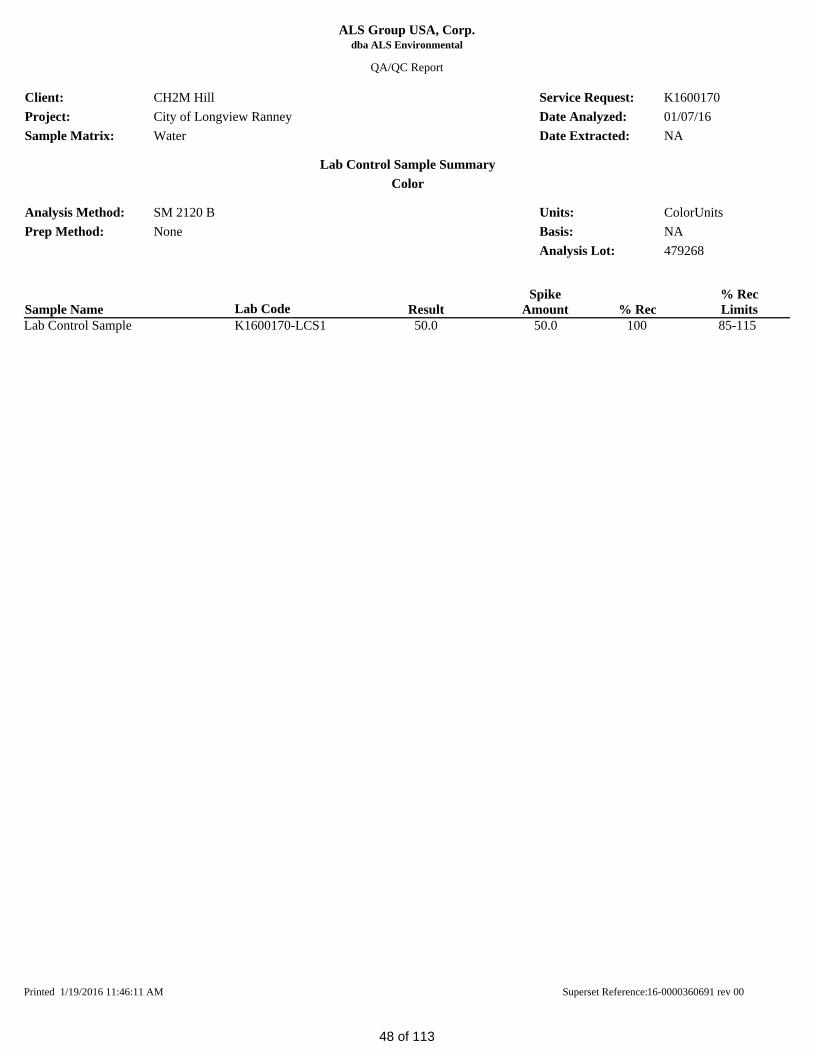
Sample Name
K1600170Date Analyzed:Service Request:
WaterCity of Longview RanneyCH2M Hill
Sample Matrix:Project:Client:
Lab Control Sample SummaryColor
Analysis Method:Prep Method:
SM 2120 BNone NA
ColorUnitsBasis:Units:
Analysis Lot: 479268
01/07/16
Spike AmountResult % Rec
% Rec Limits
NADate Extracted:
Lab Code
dba ALS EnvironmentalALS Group USA, Corp.
QA/QC Report
Lab Control Sample 85-115100 50.050.0K1600170-LCS1
16-0000360691 rev 00Superset Reference:Printed 1/19/2016 11:46:11 AM
48 of 113

Client:
01/7/16
K1600170
Date Received:Date Collected:
Service Request:
WaterCity of Longview RanneyCH2M Hill
Sample Matrix:Project: 01/7/16
Conductivity at 25 Degrees Celsius
Basis:Units: uMHOS/cm
NASM 2510 BNonePrep Method:
Analysis Method:
Lab CodeSample NameDate
AnalyzedDil.MRLResult Q
WTP TEST WELL 01/08/16 09:3512.0243K1600170-001Method Blank 01/08/16 09:3512.0 UNDK1600170-MB1Method Blank 01/08/16 09:3512.0 UNDK1600170-MB2
Analytical Report
ALS Group USA, Corp. dba ALS Environmental
Printed 1/19/2016 11:46:11 AM 16-0000360691 rev 00Superset Reference:
49 of 113

ALS Group USA, Corp.
QA/QC Report
Client:ProjectSample Matrix: Water
City of Longview RanneyCH2M Hill Service Request: K1600170
01/07/16Date Collected:Date Received: 01/07/16
01/08/16Date Analyzed:
Replicate Sample SummaryGeneral Chemistry Parameters
WTP TEST WELL uMHOS/cmBasis:Units:
K1600170-001 NALab Code:Sample Name:
RPD LimitMRLAnalysis Method RPD
Duplicate Sample
K1600170-001DUP Result Average
SampleResultAnalyte Name
dba ALS Environmental
Conductivity at 25 Degrees Celsius <1 2.0 243 242 243 20SM 2510 B
Results flagged with an asterisk (*) indicate values outside control criteria.
Results flagged with a pound (#) indicate the control criteria is not applicable.
Percent recoveries and relative percent differences (RPD) are determined by the software using values in the calculation which have not been rounded.
Printed 1/19/2016 11:46:11 AM 16-0000360691 rev 00Superset Reference:
50 of 113

Sample Name
K1600170Date Analyzed:Service Request:
WaterCity of Longview RanneyCH2M Hill
Sample Matrix:Project:Client:
Lab Control Sample SummaryConductivity at 25 Degrees Celsius
Analysis Method:Prep Method:
SM 2510 BNone NA
uMHOS/cmBasis:Units:
Analysis Lot: 479294
01/08/16
Spike AmountResult % Rec
% Rec Limits
NADate Extracted:
Lab Code
dba ALS EnvironmentalALS Group USA, Corp.
QA/QC Report
Lab Control Sample 86-11398 289283K1600170-LCS1
16-0000360691 rev 00Superset Reference:Printed 1/19/2016 11:46:11 AM
51 of 113

Client:
01/7/16
K1600170
Date Received:Date Collected:
Service Request:
WaterCity of Longview RanneyCH2M Hill
Sample Matrix:Project: 01/7/16
Solids, Total Dissolved
Basis:Units: mg/L
NASM 2540 CNonePrep Method:
Analysis Method:
Lab CodeSample NameDate
AnalyzedDil.MRLResult Q
WTP TEST WELL 01/08/16 16:12110181K1600170-001Method Blank 01/08/16 16:12110 UNDK1600170-MB1Method Blank 01/08/16 16:12110 UNDK1600170-MB2
Analytical Report
ALS Group USA, Corp. dba ALS Environmental
Printed 1/19/2016 11:46:11 AM 16-0000360691 rev 00Superset Reference:
52 of 113

ALS Group USA, Corp.dba ALS Environmental
QA/QC Report
Client:ProjectSample Matrix:
Prep Method:Analysis Method:
CH2M HillCity of Longview RanneyWater
SM 2540 CNone
Service Request:Date Collected:Date Received:
Basis:Units:
K1600170NANA
mg/LNA
Replicate Sample SummarySolids, Total Dissolved
Sample Name: Lab Code:Date
AnalyzedRPDLimitMRL RPD
DuplicateResult Average
SampleResult
7 10 203 190 197 10Batch QC K1600142-001DUP 01/08/162 10 508 500 504 10Batch QC K1600146-001DUP 01/08/16
Results flagged with an asterisk (*) indicate values outside control criteria.
Results flagged with a pound (#) indicate the control criteria is not applicable.
Percent recoveries and relative percent differences (RPD) are determined by the software using values in the calculation which have not been rounded.
Printed 1/19/2016 11:46:11 AM 16-0000360691 rev 00Superset Reference:
53 of 113

Sample Name
K1600170Date Analyzed:Service Request:
WaterCity of Longview RanneyCH2M Hill
Sample Matrix:Project:Client:
Lab Control Sample SummarySolids, Total Dissolved
Analysis Method:Prep Method:
SM 2540 CNone NA
mg/LBasis:Units:
Analysis Lot: 479357
01/08/16
Spike AmountResult % Rec
% Rec Limits
NADate Extracted:
Lab Code
dba ALS EnvironmentalALS Group USA, Corp.
QA/QC Report
Lab Control Sample 85-115101 714724K1600170-LCS1
16-0000360691 rev 00Superset Reference:Printed 1/19/2016 11:46:12 AM
54 of 113

Client:
01/7/16
K1600170
Date Received:Date Collected:
Service Request:
WaterCity of Longview RanneyCH2M Hill
Sample Matrix:Project: 01/7/16
Fluoride
Basis:Units: mg/L
NASM 4500-F- C ModifiedNonePrep Method:
Analysis Method:
Lab CodeSample NameDate
AnalyzedDil.MRLResult Q
WTP TEST WELL 01/18/16 03:1510.20 UNDK1600170-001Method Blank 01/18/16 03:1510.20 UNDK1600170-MB1
Analytical Report
ALS Group USA, Corp. dba ALS Environmental
Printed 1/19/2016 11:46:12 AM 16-0000360691 rev 00Superset Reference:
55 of 113

ALS Group USA, Corp.
QA/QC Report
Client:ProjectSample Matrix: Water
City of Longview RanneyCH2M Hill Service Request: K1600170
01/07/16Date Collected:Date Received: 01/07/16
01/18/16Date Analyzed:
Replicate Sample SummaryGeneral Chemistry Parameters
WTP TEST WELL mg/LBasis:Units:
K1600170-001 NALab Code:Sample Name:
RPD LimitMRLAnalysis Method RPD
Duplicate Sample
K1600170-001DUP Result Average
SampleResultAnalyte Name
dba ALS Environmental
Fluoride NC 0.20 ND U ND U NC 20SM 4500-F- C Modified
Results flagged with an asterisk (*) indicate values outside control criteria.
Results flagged with a pound (#) indicate the control criteria is not applicable.
Percent recoveries and relative percent differences (RPD) are determined by the software using values in the calculation which have not been rounded.
Printed 1/19/2016 11:46:12 AM 16-0000360691 rev 00Superset Reference:
56 of 113

QA/QC Report
mg/LK1600170-001 Basis:Lab Code:
Units:Sample Name: WTP TEST WELL
FluorideMatrix Spike Summary
NA
Client:Project:Sample Matrix:
CH2M HillCity of Longview RanneyWater
Service Request:
Date Analyzed:Date Received:
K1600170
01/18/1601/07/16
Date Collected: 01/07/16
NoneSM 4500-F- C Modified
Prep Method:Analysis Method:
Analyte Name ResultSample Result Spike Amount % Rec
Matrix SpikeK1600170-001MS
% Rec Limits
ALS Group USA, Corp.dba ALS Environmental
NADate Extracted:
Fluoride ND U 24.5 25.0 98 74-128
Results flagged with an asterisk (*) indicate values outside control criteria.
Results flagged with a pound (#) indicate the control criteria is not applicable.
Percent recoveries and relative percent differences (RPD) are determined by the software using values in the calculation which have not been rounded.
Printed 1/19/2016 11:46:12 AM 16-0000360691 rev 00Superset Reference:
57 of 113

Sample Name
K1600170Date Analyzed:Service Request:
WaterCity of Longview RanneyCH2M Hill
Sample Matrix:Project:Client:
Lab Control Sample SummaryFluoride
Analysis Method:Prep Method:
SM 4500-F- C ModifiedNone NA
mg/LBasis:Units:
Analysis Lot: 478805
01/18/16
Spike AmountResult % Rec
% Rec Limits
NADate Extracted:
Lab Code
dba ALS EnvironmentalALS Group USA, Corp.
QA/QC Report
Lab Control Sample 87-11796 8.528.16K1600170-LCS1
16-0000360691 rev 00Superset Reference:Printed 1/19/2016 11:46:12 AM
58 of 113

Client:
01/7/16
K1600170
Date Received:Date Collected:
Service Request:
WaterCity of Longview RanneyCH2M Hill
Sample Matrix:Project: 01/7/16
pH
Basis:Units: pH Units
NASM 4500-H+ BNonePrep Method:
Analysis Method:
Lab CodeSample NameDate
AnalyzedDil.MRLResult Q
WTP TEST WELL 01/08/16 15:051-6.94 HK1600170-001
Analytical Report
ALS Group USA, Corp. dba ALS Environmental
Printed 1/19/2016 11:46:13 AM 16-0000360691 rev 00Superset Reference:
59 of 113

ALS Group USA, Corp.
QA/QC Report
Client:ProjectSample Matrix: Water
City of Longview RanneyCH2M Hill Service Request: K1600170
01/07/16Date Collected:Date Received: 01/07/16
01/08/16Date Analyzed:
Replicate Sample SummaryGeneral Chemistry Parameters
WTP TEST WELL pH UnitsBasis:Units:
K1600170-001 NALab Code:Sample Name:
RPD LimitMRLAnalysis Method RPD
Duplicate Sample
K1600170-001DUP Result Average
SampleResultAnalyte Name
dba ALS Environmental
pH <1 - 6.94 6.95 6.95 20SM 4500-H+ B
Results flagged with an asterisk (*) indicate values outside control criteria.
Results flagged with a pound (#) indicate the control criteria is not applicable.
Percent recoveries and relative percent differences (RPD) are determined by the software using values in the calculation which have not been rounded.
Printed 1/19/2016 11:46:13 AM 16-0000360691 rev 00Superset Reference:
60 of 113

Sample Name
K1600170Date Analyzed:Service Request:
WaterCity of Longview RanneyCH2M Hill
Sample Matrix:Project:Client:
Lab Control Sample SummarypH
Analysis Method:Prep Method:
SM 4500-H+ BNone NA
pH UnitsBasis:Units:
Analysis Lot: 479344
01/08/16
Spike AmountResult % Rec
% Rec Limits
NADate Extracted:
Lab Code
dba ALS EnvironmentalALS Group USA, Corp.
QA/QC Report
Lab Control Sample 85-11599 8.328.27K1600170-LCS1
16-0000360691 rev 00Superset Reference:Printed 1/19/2016 11:46:13 AM
61 of 113

Client:
01/7/16
K1600170
Date Received:Date Collected:
Service Request:
WaterCity of Longview RanneyCH2M Hill
Sample Matrix:Project: 01/7/16
Ammonia as Nitrogen
Basis:Units: mg/L
NASM 4500-NH3 GMethodPrep Method:
Analysis Method:
Lab CodeSample NameDate
AnalyzedDate
ExtractedDil.MRLResult Q
WTP TEST WELL 01/08/16 11:09 1/8/1610.0500.314K1600170-001Method Blank 01/08/16 11:09 1/8/1610.050 UNDK1600170-MB1
Analytical Report
ALS Group USA, Corp. dba ALS Environmental
Printed 1/19/2016 11:46:13 AM 16-0000360691 rev 00Superset Reference:
62 of 113

ALS Group USA, Corp.
QA/QC Report
Client:ProjectSample Matrix: Water
City of Longview RanneyCH2M Hill Service Request: K1600170
01/07/16Date Collected:Date Received: 01/07/16
01/08/16Date Analyzed:
Replicate Sample SummaryGeneral Chemistry Parameters
WTP TEST WELL mg/LBasis:Units:
K1600170-001 NALab Code:Sample Name:
RPD LimitMRLAnalysis Method RPD
Duplicate Sample
K1600170-001DUP Result Average
SampleResultAnalyte Name
dba ALS Environmental
Ammonia as Nitrogen 6 0.050 0.314 0.297 0.305 20SM 4500-NH3 G
Results flagged with an asterisk (*) indicate values outside control criteria.
Results flagged with a pound (#) indicate the control criteria is not applicable.
Percent recoveries and relative percent differences (RPD) are determined by the software using values in the calculation which have not been rounded.
Printed 1/19/2016 11:46:13 AM 16-0000360691 rev 00Superset Reference:
63 of 113

QA/QC Report
mg/LK1600170-001 Basis:Lab Code:
Units:Sample Name: WTP TEST WELL
Ammonia as NitrogenDuplicate Matrix Spike Summary
NA
Client:Project:Sample Matrix:
CH2M HillCity of Longview RanneyWater
Service Request:
Date Analyzed:Date Received:
K1600170
01/8/1601/07/16
Date Collected: 01/07/16
MethodSM 4500-NH3 G
Prep Method:Analysis Method:
Analyte NameRPD LimitRPDResult
Sample Result
Spike Amount % Rec
Matrix SpikeK1600170-001MS K1600170-001DMS
Duplicate Matrix Spike
% RecSpike
AmountResult% Rec Limits
ALS Group USA, Corp.dba ALS Environmental
01/8/16Date Extracted:
Ammonia as Nitrogen 0.314 2.29 2.00 99 2.31 2.00 100 90-110 1 20
Results flagged with an asterisk (*) indicate values outside control criteria.
Results flagged with a pound (#) indicate the control criteria is not applicable.
Percent recoveries and relative percent differences (RPD) are determined by the software using values in the calculation which have not been rounded.
Printed 1/19/2016 11:46:13 AM 16-0000360691 rev 00Superset Reference:
64 of 113
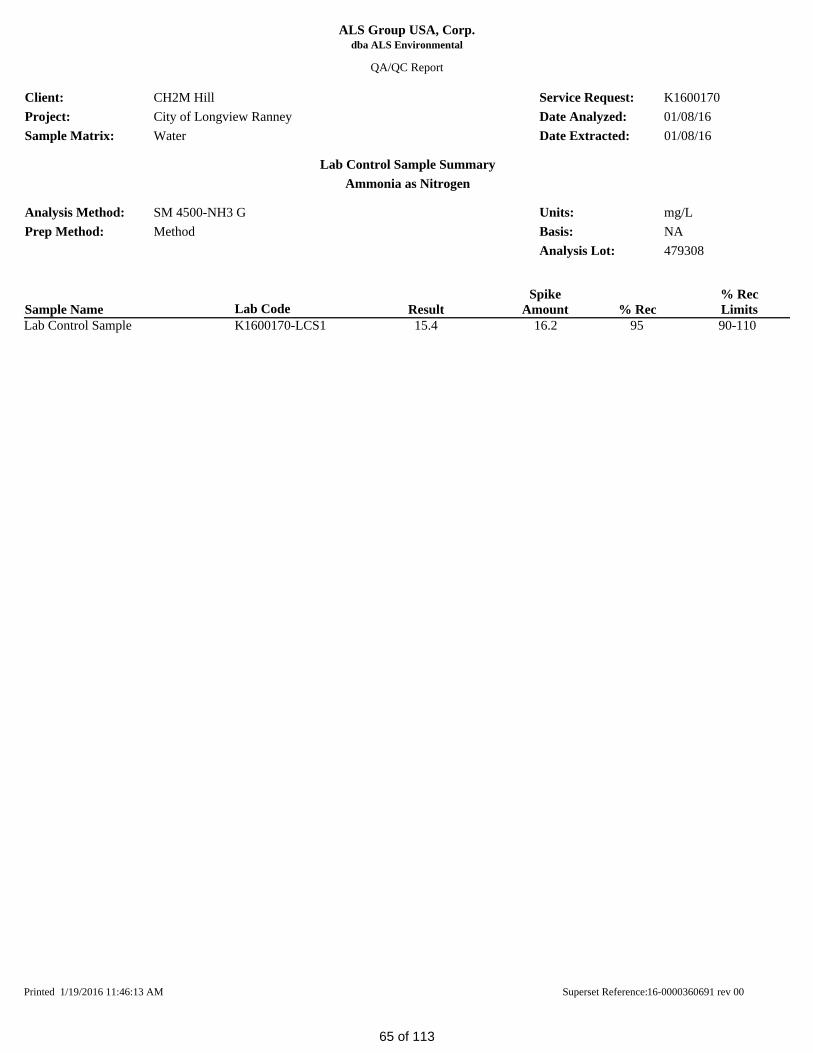
Sample Name
K1600170Date Analyzed:Service Request:
WaterCity of Longview RanneyCH2M Hill
Sample Matrix:Project:Client:
Lab Control Sample SummaryAmmonia as Nitrogen
Analysis Method:Prep Method:
SM 4500-NH3 GMethod NA
mg/LBasis:Units:
Analysis Lot: 479308
01/08/16
Spike AmountResult % Rec
% Rec Limits
01/08/16Date Extracted:
Lab Code
dba ALS EnvironmentalALS Group USA, Corp.
QA/QC Report
Lab Control Sample 90-11095 16.215.4K1600170-LCS1
16-0000360691 rev 00Superset Reference:Printed 1/19/2016 11:46:13 AM
65 of 113
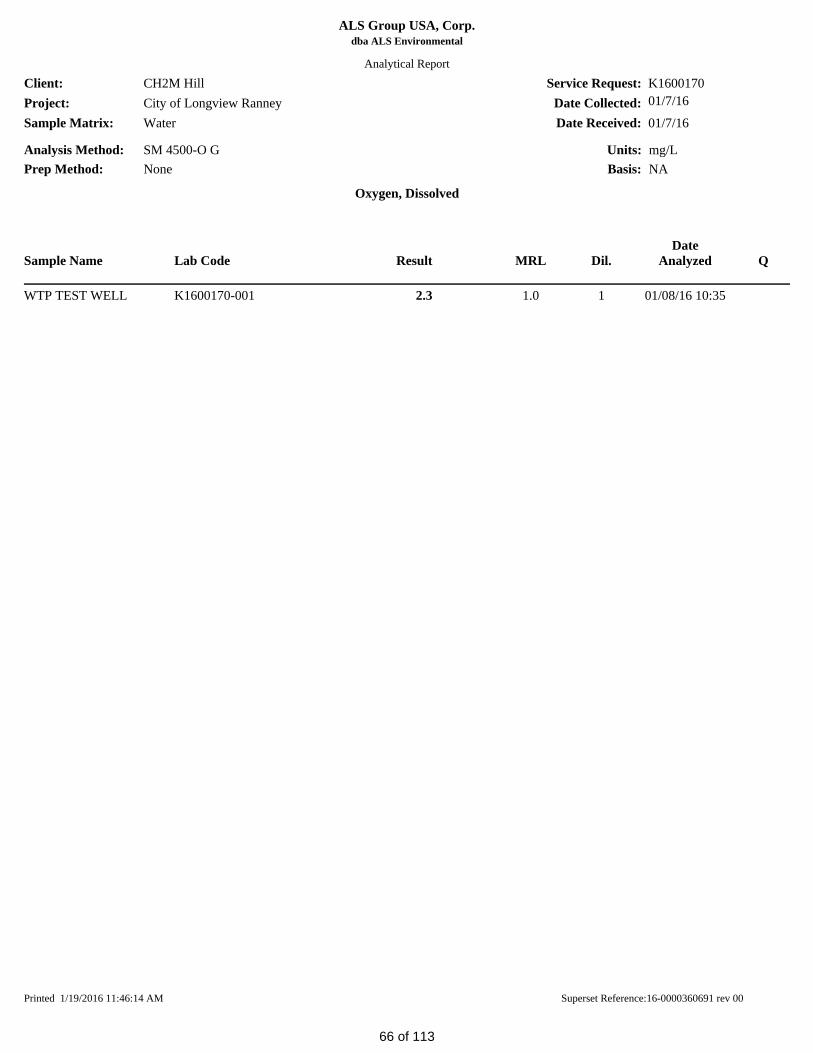
Client:
01/7/16
K1600170
Date Received:Date Collected:
Service Request:
WaterCity of Longview RanneyCH2M Hill
Sample Matrix:Project: 01/7/16
Oxygen, Dissolved
Basis:Units: mg/L
NASM 4500-O GNonePrep Method:
Analysis Method:
Lab CodeSample NameDate
AnalyzedDil.MRLResult Q
WTP TEST WELL 01/08/16 10:3511.02.3K1600170-001
Analytical Report
ALS Group USA, Corp. dba ALS Environmental
Printed 1/19/2016 11:46:14 AM 16-0000360691 rev 00Superset Reference:
66 of 113

Client:
01/7/16
K1600170
Date Received:Date Collected:
Service Request:
WaterCity of Longview RanneyCH2M Hill
Sample Matrix:Project: 01/7/16
Orthophosphate as Phosphorus
Basis:Units: mg/L
NASM 4500-P ENonePrep Method:
Analysis Method:
Lab CodeSample NameDate
AnalyzedDil.MRLResult Q
WTP TEST WELL 01/08/16 12:3910.0500.200K1600170-001Method Blank 01/08/16 12:3910.050 UNDK1600170-MB1
Analytical Report
ALS Group USA, Corp. dba ALS Environmental
Printed 1/19/2016 11:46:14 AM 16-0000360691 rev 00Superset Reference:
67 of 113

ALS Group USA, Corp.
QA/QC Report
Client:ProjectSample Matrix: Water
City of Longview RanneyCH2M Hill Service Request: K1600170
01/07/16Date Collected:Date Received: 01/07/16
01/08/16Date Analyzed:
Replicate Sample SummaryGeneral Chemistry Parameters
WTP TEST WELL mg/LBasis:Units:
K1600170-001 NALab Code:Sample Name:
RPD LimitMRLAnalysis Method RPD
Duplicate Sample
K1600170-001DUP Result Average
SampleResultAnalyte Name
dba ALS Environmental
Orthophosphate as Phosphorus 2 0.050 0.200 0.197 0.198 20SM 4500-P E
Results flagged with an asterisk (*) indicate values outside control criteria.
Results flagged with a pound (#) indicate the control criteria is not applicable.
Percent recoveries and relative percent differences (RPD) are determined by the software using values in the calculation which have not been rounded.
Printed 1/19/2016 11:46:14 AM 16-0000360691 rev 00Superset Reference:
68 of 113

QA/QC Report
mg/LK1600170-001 Basis:Lab Code:
Units:Sample Name: WTP TEST WELL
Orthophosphate as PhosphorusDuplicate Matrix Spike Summary
NA
Client:Project:Sample Matrix:
CH2M HillCity of Longview RanneyWater
Service Request:
Date Analyzed:Date Received:
K1600170
01/8/1601/07/16
Date Collected: 01/07/16
NoneSM 4500-P E
Prep Method:Analysis Method:
Analyte NameRPD LimitRPDResult
Sample Result
Spike Amount % Rec
Matrix SpikeK1600170-001MS K1600170-001DMS
Duplicate Matrix Spike
% RecSpike
AmountResult% Rec Limits
ALS Group USA, Corp.dba ALS Environmental
NADate Extracted:
Orthophosphate as Phosphorus 0.200 0.57 0.40 92 0.53 0.40 82 75-125 11 20
Results flagged with an asterisk (*) indicate values outside control criteria.
Results flagged with a pound (#) indicate the control criteria is not applicable.
Percent recoveries and relative percent differences (RPD) are determined by the software using values in the calculation which have not been rounded.
Printed 1/19/2016 11:46:14 AM 16-0000360691 rev 00Superset Reference:
69 of 113

Sample Name
K1600170Date Analyzed:Service Request:
WaterCity of Longview RanneyCH2M Hill
Sample Matrix:Project:Client:
Lab Control Sample SummaryOrthophosphate as Phosphorus
Analysis Method:Prep Method:
SM 4500-P ENone NA
mg/LBasis:Units:
Analysis Lot: 479388
01/08/16
Spike AmountResult % Rec
% Rec Limits
NADate Extracted:
Lab Code
dba ALS EnvironmentalALS Group USA, Corp.
QA/QC Report
Lab Control Sample 85-11599 2.542.53K1600170-LCS1
16-0000360691 rev 00Superset Reference:Printed 1/19/2016 11:46:14 AM
70 of 113

Client:
01/7/16
K1600170
Date Received:Date Collected:
Service Request:
WaterCity of Longview RanneyCH2M Hill
Sample Matrix:Project: 01/7/16
Carbon, Total Organic
Basis:Units: mg/L
NASM 5310 CNonePrep Method:
Analysis Method:
Lab CodeSample NameDate
AnalyzedDil.MRLResult Q
WTP TEST WELL 01/14/16 11:1910.501.80K1600170-001Method Blank 01/14/16 11:1910.50 UNDK1600170-MB1
Analytical Report
ALS Group USA, Corp. dba ALS Environmental
Printed 1/19/2016 11:46:15 AM 16-0000360691 rev 00Superset Reference:
71 of 113

ALS Group USA, Corp.dba ALS Environmental
QA/QC Report
Client:ProjectSample Matrix:
Prep Method:Analysis Method:
CH2M HillCity of Longview RanneyWater
SM 5310 CNone
Service Request:Date Collected:Date Received:
Basis:Units:
K160017001/07/1601/07/16
mg/LNA
Replicate Sample SummaryCarbon, Total Organic
Sample Name: Lab Code:Date
AnalyzedRPDLimitMRL RPD
DuplicateResult Average
SampleResult
7 0.50 1.80 1.68 1.74 10WTP TEST WELL K1600170-001DUP 01/14/16
Results flagged with an asterisk (*) indicate values outside control criteria.
Results flagged with a pound (#) indicate the control criteria is not applicable.
Percent recoveries and relative percent differences (RPD) are determined by the software using values in the calculation which have not been rounded.
Printed 1/19/2016 11:47:13 AM 16-0000360691 rev 00Superset Reference:
72 of 113

QA/QC Report
mg/LK1600170-001 Basis:Lab Code:
Units:Sample Name: WTP TEST WELL
Carbon, Total OrganicMatrix Spike Summary
NA
Client:Project:Sample Matrix:
CH2M HillCity of Longview RanneyWater
Service Request:
Date Analyzed:Date Received:
K1600170
01/14/1601/07/16
Date Collected: 01/07/16
NoneSM 5310 C
Prep Method:Analysis Method:
Analyte Name ResultSample Result Spike Amount % Rec
Matrix SpikeK1600170-001MS
% Rec Limits
ALS Group USA, Corp.dba ALS Environmental
NADate Extracted:
Carbon, Total Organic 1.80 26.6 25.0 99 83-117
Results flagged with an asterisk (*) indicate values outside control criteria.
Results flagged with a pound (#) indicate the control criteria is not applicable.
Percent recoveries and relative percent differences (RPD) are determined by the software using values in the calculation which have not been rounded.
Printed 1/19/2016 11:47:19 AM 16-0000360691 rev 00Superset Reference:
73 of 113

Sample Name
K1600170Date Analyzed:Service Request:
WaterCity of Longview RanneyCH2M Hill
Sample Matrix:Project:Client:
Lab Control Sample SummaryCarbon, Total Organic
Analysis Method:Prep Method:
SM 5310 CNone NA
mg/LBasis:Units:
Analysis Lot: 479960
01/14/16
Spike AmountResult % Rec
% Rec Limits
NADate Extracted:
Lab Code
dba ALS EnvironmentalALS Group USA, Corp.
QA/QC Report
Lab Control Sample 83-11794 19.818.5K1600170-LCS1
16-0000360691 rev 00Superset Reference:Printed 1/19/2016 11:46:16 AM
74 of 113

Client:
01/7/16
K1600170
Date Received:Date Collected:
Service Request:
WaterCity of Longview RanneyCH2M Hill
Sample Matrix:Project: 01/7/16
UV254
Basis:Units: cm-1
NASM 5910 BNonePrep Method:
Analysis Method:
Lab CodeSample NameDate
AnalyzedDil.MRLResult Q
WTP TEST WELL 01/08/16 11:321-0.097K1600170-001Method Blank 01/08/16 11:321- UNDK1600170-MB1Method Blank 01/08/16 11:321- UNDK1600170-MB2
Analytical Report
ALS Group USA, Corp. dba ALS Environmental
Printed 1/19/2016 11:46:16 AM 16-0000360691 rev 00Superset Reference:
75 of 113

ALS Group USA, Corp.
QA/QC Report
Client:ProjectSample Matrix: Water
City of Longview RanneyCH2M Hill Service Request: K1600170
01/07/16Date Collected:Date Received: 01/07/16
01/08/16Date Analyzed:
Replicate Sample SummaryGeneral Chemistry Parameters
WTP TEST WELL cm-1Basis:Units:
K1600170-001 NALab Code:Sample Name:
RPD LimitMRLAnalysis Method RPD
Duplicate Sample
K1600170-001DUP Result Average
SampleResultAnalyte Name
dba ALS Environmental
UV254 3 - 0.097 0.100 0.0985 20SM 5910 B
Results flagged with an asterisk (*) indicate values outside control criteria.
Results flagged with a pound (#) indicate the control criteria is not applicable.
Percent recoveries and relative percent differences (RPD) are determined by the software using values in the calculation which have not been rounded.
Printed 1/19/2016 11:46:16 AM 16-0000360691 rev 00Superset Reference:
76 of 113

Metals
ALS Environmental—Kelso Laboratory 1317 South 13th Avenue, Kelso, WA 98626 Phone (360)577-7222 Fax (360)636-1068 www.alsglobal.com
RIGHT SOLUTIONS | RIGHT PARTNER
77 of 113

ALS Group USA, Corp.dba ALS Environmental
Analytical Report
Client: CH2M Hill Service Request: K1600170
Project: City of Longview Ranney Date Collected: 01/07/16
Sample Matrix: Water Date Received: 01/07/16
Hardness as CaCO3
Prep Method: CLAA Units: mg/L (ppm)
Analysis Method: 200.7/SM 2340B Basis: NA
Test Notes:
Dilution Date Date ResultSample Name Lab Code MRL Factor Extracted Analyzed Result Notes
WTP TEST WELL K1600170-001 0.07 1 01/13/16 01/19/16 73.8
Method Blank K1600170-MB 0.07 1 01/13/16 01/19/16 ND
K1600170icp.sp1 - Sample 01/20/16 Page No.:
78 of 113

ALS Group USA, Corp.dba ALS Environmental
QA/QC Report
Client: CH2M Hill Service Request: K1600170
Project: City of Longview Ranney Date Collected: 01/07/16
Sample Matrix: Water Date Received: 01/07/16
Date Extracted: 01/13/16
Date Analyzed: 01/19/16
Duplicate SummaryMetals
Sample Name: WTP TEST WELL Units: mg/L (ppm)
Lab Code: K1600170-001D Basis: NA
Test Notes:
Duplicate RelativePrep Analysis Sample Sample Percent Result
Analyte Method Method MRL Result Result Average Difference Notes
Hardness as CaCO3 CLAA 200.7/SM 2340B 0.07 73.8 74.6 74.2 1
K1600170icp.sp1 - DUP 01/20/16 Page No.:
79 of 113

ALS Group USA, Corp.dba ALS Environmental
Analytical Report
Client: CH2M Hill Service Request: K1600170
Project: City of Longview Ranney Date Collected: 01/07/16
Sample Matrix: Water Date Received: 01/07/16
Mercury, Total
Prep Method: METHOD Units: ng/L
Analysis Method: 1631E Basis: NA
Test Notes:
Dilution Date Date ResultSample Name Lab Code MRL Factor Extracted Analyzed Result Notes
WTP TEST WELL K1600170-001 0.5 1 01/07/16 01/08/16 0.5
Method Blank 1 K1600170-MB1 0.5 1 01/07/16 01/08/16 ND
Method Blank 2 K1600170-MB2 0.5 1 01/07/16 01/08/16 ND
Method Blank 3 K1600170-MB3 0.5 1 01/07/16 01/08/16 ND
K1600170ICP.JB1 - Sample 01/11/16 Page No.:
80 of 113

ALS Group USA, Corp.dba ALS Environmental
QA/QC Report
Client: CH2M Hill Service Request: K1600170Project: City of Longview Ranney Date Collected: 01/07/16Sample Matrix: Water Date Received: 01/07/16
Date Extracted: 01/07/16Date Analyzed: 01/08/16
Matrix Spike/Duplicate Matrix Spike Summary
Total Metals
Sample Name: WTP TEST WELL Units: ng/L
Lab Code: K1600170-001MS, K1600170-001MSD Basis: NATest Notes:
P e r c e n t R e c o v e r y
ALS RelativePrep Analysis Spike Level Sample Spike Result Acceptance Percent Result
Analyte Method Method MRL MS DMS Result MS DMS MS DMS Limits Difference Notes Mercury METHOD 1631E 0.5 50 50 0.5 47.5 49.8 94 99 71-125 5
K1600170ICP.JB1 - DMS 01/11/16 Page No.:
81 of 113

ALS Group USA, Corp.dba ALS Environmental
QA/QC Report
Client: CH2M Hill Service Request: K1600170
Project: City of Longview Ranney Date Collected: NALCS Matrix: Water Date Received: NA
Date Extracted: NADate Analyzed: 01/08/16
Ongoing Precision and Recovery (OPR) Sample SummaryTotal Metals
Sample Name: Ongoing Precision and Recovery (Initial) Units: ng/L
Basis: NA
Test Notes:
ALSPercent
RecoveryPrep Analysis True Percent Acceptance Result
Analyte Method Method Value Result Recovery Limits Notes
Mercury METHOD 1631E 5.00 4.97 99 77-123
K1600170ICP.JB1 - OPR (lcsw) 01/11/16 Page No.:
82 of 113

ALS Group USA, Corp.dba ALS Environmental
QA/QC Report
Client: CH2M Hill Service Request: K1600170
Project: City of Longview Ranney Date Collected: NALCS Matrix: Water Date Received: NA
Date Extracted: NADate Analyzed: 01/08/16
Ongoing Precision and Recovery (OPR) Sample SummaryTotal Metals
Sample Name: Ongoing Precision and Recovery (Final) Units: ng/L
Basis: NA
Test Notes:
ALSPercent
RecoveryPrep Analysis True Percent Acceptance Result
Analyte Method Method Value Result Recovery Limits Notes
Mercury METHOD 1631E 5.00 4.73 95 77-123
K1600170ICP.JB1 - OPR (lcsw) (2) 01/11/16 Page No.:
83 of 113

ALS Group USA, Corp.dba ALS Environmental
QA/QC Report
Client: CH2M Hill Service Request: K1600170
Project: City of Longview Ranney Date Collected: NALCS Matrix: Water Date Received: NA
Date Extracted: NADate Analyzed: 01/08/16
Quality Control Sample (QCS) SummaryTotal Metals
Sample Name: Quality Control Sample Units: ng/L
Basis: NA
Test Notes:
ALSPercent
RecoveryPrep Analysis True Percent Acceptance Result
Analyte Method Method Value Result Recovery Limits Notes
Mercury METHOD 1631E 5.00 5.23 105 77-123
K1600170ICP.JB1 - QCS (icv) 01/11/16 Page No.:
84 of 113

Client :
Project Name :
Matrix :
Date Collected :
Date Received :
Service Request :
ALS Group USA, Corp.
Lab Code :
Sample Name : Units :
Basis :
Date Extracted :
Project No. :
K1600170-001WTP TEST WELL
CH2M HillCity of Longview RanneyNAWater
K160017001/07/1601/07/16
ug/L (ppb)NA
Total Metals
Analytical Report
01/13/16
dba ALS Enviromental
MRLAnalysis Method Date Analyzed
Sample
Result
Result
NotesAnalyte
Aluminum 200.7 10 01/19/16 270Antimony 200.8 0.05 01/14/16 NDArsenic 200.8 0.5 01/14/16 NDBarium 200.7 4.0 01/19/16 7.0Beryllium 200.8 0.02 01/14/16 NDCadmium 200.8 0.02 01/14/16 NDCalcium 200.7 20 01/19/16 15700Chromium 200.8 0.2 01/14/16 0.4Copper 200.7 4.0 01/19/16 4.0Iron 200.7 20 01/19/16 12500Lead 200.8 0.02 01/14/16 0.81Magnesium 200.7 5.0 01/19/16 8410Manganese 200.7 1.0 01/19/16 637Nickel 200.8 0.2 01/14/16 1.1Selenium 200.8 1.0 01/14/16 NDSilicon, as SiO2 200.7 500 01/19/16 48400Silver 200.8 0.02 01/14/16 NDSodium 200.7 200 01/19/16 10500Thallium 200.8 0.02 01/14/16 NDZinc 200.7 4.0 01/19/16 41.5
Comments:
85 of 113

Client :
Project Name :
Matrix :
Date Collected :
Date Received :
Service Request :
ALS Group USA, Corp.
Lab Code :
Sample Name : Units :
Basis :
Date Extracted :
Project No. :
K1600170-001WTP TEST WELL
CH2M HillCity of Longview RanneyNAWater
K160017001/07/1601/07/16
ug/L (ppb)NA
Dissolved Metals
Analytical Report
01/13/16
dba ALS Enviromental
MRLAnalysis Method Date Analyzed
Sample
Result
Result
NotesAnalyte
Silicon, as SiO2 200.7 500 01/19/16 46700
Comments:
86 of 113
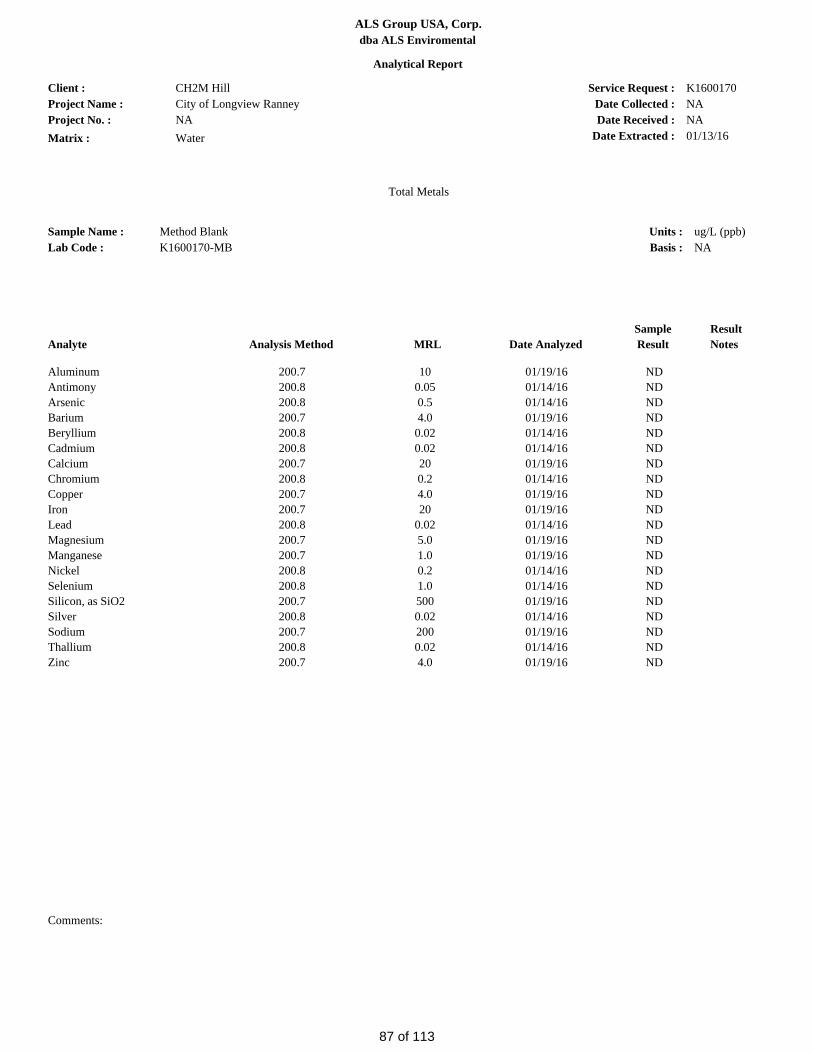
Client :
Project Name :
Matrix :
Date Collected :
Date Received :
Service Request :
ALS Group USA, Corp.
Lab Code :
Sample Name : Units :
Basis :
Date Extracted :
Project No. :
K1600170-MBMethod Blank
CH2M HillCity of Longview RanneyNAWater
K1600170NANA
ug/L (ppb)NA
Total Metals
Analytical Report
01/13/16
dba ALS Enviromental
MRLAnalysis Method Date Analyzed
Sample
Result
Result
NotesAnalyte
Aluminum 200.7 10 01/19/16 NDAntimony 200.8 0.05 01/14/16 NDArsenic 200.8 0.5 01/14/16 NDBarium 200.7 4.0 01/19/16 NDBeryllium 200.8 0.02 01/14/16 NDCadmium 200.8 0.02 01/14/16 NDCalcium 200.7 20 01/19/16 NDChromium 200.8 0.2 01/14/16 NDCopper 200.7 4.0 01/19/16 NDIron 200.7 20 01/19/16 NDLead 200.8 0.02 01/14/16 NDMagnesium 200.7 5.0 01/19/16 NDManganese 200.7 1.0 01/19/16 NDNickel 200.8 0.2 01/14/16 NDSelenium 200.8 1.0 01/14/16 NDSilicon, as SiO2 200.7 500 01/19/16 NDSilver 200.8 0.02 01/14/16 NDSodium 200.7 200 01/19/16 NDThallium 200.8 0.02 01/14/16 NDZinc 200.7 4.0 01/19/16 ND
Comments:
87 of 113

Client :
Project Name :
Matrix :
Date Collected :
Date Received :
Service Request :
ALS Group USA, Corp.
Lab Code :
Sample Name : Units :
Basis :
Date Extracted :
Project No. :
K1600170-001DWTP TEST WELL
CH2M HillCity of Longview RanneyNAWater
K160017001/07/1601/07/16
ug/L (ppb)NA
Date Analyzed :
Total Metals
QA/QC Report
01/13/1601/14-19/16
Duplicate Summary
dba ALS Enviromental
Analyte Analysis Method MRL
Sample
Result
Duplicate
Sample
Result Average
Result
Notes
Relative
Percent
Difference
Aluminum 200.7 10 247270 258 9Antimony 200.8 0.05 NDND ND -Arsenic 200.8 0.5 NDND ND -Barium 200.7 4.0 7.07.0 7.0 <1Beryllium 200.8 0.02 NDND ND -Cadmium 200.8 0.02 NDND ND -Calcium 200.7 20 1580015700 15800 <1Chromium 200.8 0.2 0.30.4 0.4 29Copper 200.7 4.0 ND4.0 NC NCIron 200.7 20 1260012500 12500 <1Lead 200.8 0.02 0.730.81 0.77 10Magnesium 200.7 5.0 85108410 8460 1Manganese 200.7 1.0 644637 641 1Nickel 200.8 0.2 1.11.1 1.1 <1Selenium 200.8 1.0 NDND ND -Silicon, as SiO2 200.7 500 4930048400 48800 2Silver 200.8 0.02 NDND ND -Sodium 200.7 200 1060010500 10500 <1Thallium 200.8 0.02 NDND ND -Zinc 200.7 4.0 41.141.5 41.3 <1
Comments:
88 of 113

Client :
Project Name :
Matrix :
Date Collected :
Date Received :
Service Request :
ALS Group USA, Corp.
Lab Code :
Sample Name : Units :
Basis :
Date Extracted :
Project No. :
K1600170-001DWTP TEST WELL
CH2M HillCity of Longview RanneyNAWater
K160017001/07/1601/07/16
ug/L (ppb)NA
Date Analyzed :
Dissolved Metals
QA/QC Report
01/13/1601/19/16
Duplicate Summary
dba ALS Enviromental
Analyte Analysis Method MRL
Sample
Result
Duplicate
Sample
Result Average
Result
Notes
Relative
Percent
Difference
Silicon, as SiO2 200.7 500 4740046700 47100 1
Comments:
89 of 113

Client :
Project Name :
Matrix :
Date Collected :
Date Received :
Service Request :
ALS Group USA, Corp.
Lab Code :
Sample Name : Units :
Basis :
Date Extracted :
Project No. :
K1600170-001SWTP TEST WELL
CH2M HillCity of Longview RanneyNAWater
K160017001/07/1601/07/16
ug/L (ppb)NA
Date Analyzed :
Total Metals
QA/QC Report
01/13/1601/14-19/16
Matrix Spike Summary
dba ALS Enviromental
Analyte MRL Spike Level
Sample
Result
Spiked
Sample
Result
Percent
Recovery
ALS Percent
Recovery
Acceptance
Limits
Result
Notes
10Aluminum 22402000 270 99 70-1300.05Antimony 48.950.0 ND 98 70-1300.5Arsenic 49.350.0 ND 99 70-1304.0Barium 10901000 7.0 108 70-130
0.02Beryllium 2.432.50 ND 97 70-1300.02Cadmium 24.625.0 ND 98 70-13020Calcium 2580010000 15700 101 70-1300.2Chromium 9.210.0 0.4 88 70-1304.0Copper 246250 4.0 97 70-13020Iron 134001000 12500 90 70-130
0.02Lead 50.250.0 0.81 99 70-1305.0Magnesium 1860010000 8410 102 70-1301.0Manganese 1160500 637 105 70-1300.2Nickel 23.625.0 1.1 90 70-1301.0Selenium 49.350.0 ND 99 70-130500Silicon, as SiO2 7060021400 48400 104 70-1300.02Silver 12.012.5 ND 96 70-130200Sodium 2090010000 10500 104 70-1300.02Thallium 49.950.0 ND 100 70-1304.0Zinc 527500 41.5 97 70-130
Comments:
90 of 113

Client :
Project Name :
Matrix :
Date Collected :
Date Received :
Service Request :
ALS Group USA, Corp.
Lab Code :
Sample Name : Units :
Basis :
Date Extracted :
Project No. :
K1600170-001SWTP TEST WELL
CH2M HillCity of Longview RanneyNAWater
K160017001/07/1601/07/16
ug/L (ppb)NA
Date Analyzed :
Dissolved Metals
QA/QC Report
01/13/1601/19/16
Matrix Spike Summary
dba ALS Enviromental
Analyte MRL Spike Level
Sample
Result
Spiked
Sample
Result
Percent
Recovery
ALS Percent
Recovery
Acceptance
Limits
Result
Notes
500Silicon, as SiO2 6760021400 46700 98 70-130
Comments:
91 of 113

Client :
Project Name :
Matrix :
Date Collected :
Date Received :
Service Request :
ALS Group USA, Corp.
Lab Code :
Sample Name : Units :
Basis :
Date Extracted :
Project No. :
K1600170-LCSLaboratory Control Sample
CH2M HillCity of Longview RanneyNAWater
K1600170NANA
ug/L (ppb)NA
Date Analyzed :
Total Metals
QA/QC Report
01/13/1601/14-19/16
Laboratory Control Sample Summary
dba ALS Enviromental
Analyte Analysis Method True Value Result Percent
Recovery
Result
Notes
ALS Percent
Recovery
Acceptance
Limits
Aluminum 200.7 5000 5090 102 85-115Antimony 200.8 50.0 48.3 97 85-115Arsenic 200.8 50.0 47.7 95 85-115Barium 200.7 5000 5230 105 85-115Beryllium 200.8 2.50 2.38 95 85-115Cadmium 200.8 25.0 23.9 96 85-115Calcium 200.7 12500 12700 101 85-115Chromium 200.8 10.0 9.6 96 85-115Copper 200.7 625 595 95 85-115Iron 200.7 2500 2530 101 85-115Lead 200.8 50.0 48.0 96 85-115Magnesium 200.7 12500 12600 100 85-115Manganese 200.7 1250 1280 103 85-115Nickel 200.8 25.0 24.0 96 85-115Selenium 200.8 50.0 47.8 96 85-115Silicon, as SiO2 200.7 21400 21500 101 85-115Silver 200.8 12.5 11.8 95 85-115Sodium 200.7 12500 12500 100 85-115Thallium 200.8 50.0 48.7 97 85-115Zinc 200.7 1250 1180 94 85-115
Comments:
92 of 113

Diesel and Residual Range Organics
ALS Environmental—Kelso Laboratory 1317 South 13th Avenue, Kelso, WA 98626 Phone (360)577-7222 Fax (360)636-1068 www.alsglobal.com
RIGHT SOLUTIONS | RIGHT PARTNER
93 of 113
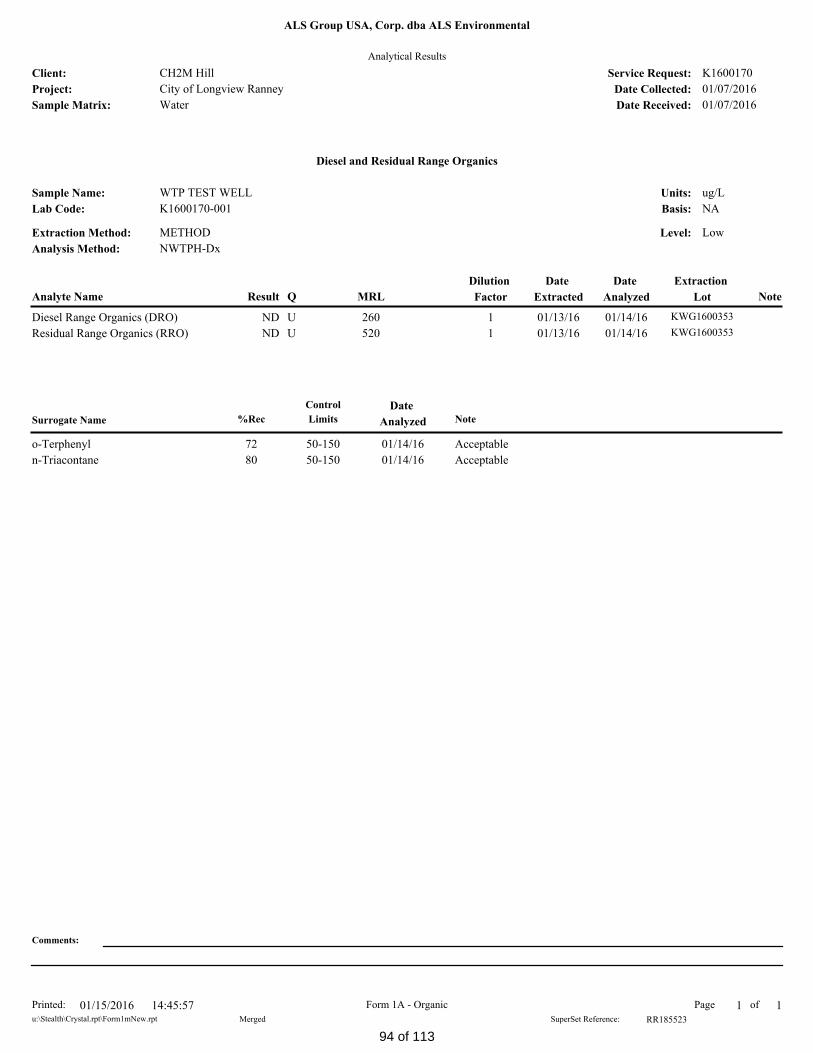
Analytical Results
CH2M Hill K1600170
K1600170-001
ug/L
NA
WTP TEST WELL
01/07/2016
01/07/2016
City of Longview Ranney
Water
Client:
Project:
Sample Matrix:
Service Request:
Date Collected:
Date Received:
ALS Group USA, Corp. dba ALS Environmental
Units:
Basis:
Sample Name:
Diesel and Residual Range Organics
Lab Code:
Level: LowExtraction Method:
Analysis Method:
METHOD
NWTPH-Dx
NoteMRLQResultAnalyte Name
Extraction
Lot
Date
Analyzed
Date
Extracted
Dilution
Factor
260 01/13/161 KWG160035301/14/16UNDDiesel Range Organics (DRO)
520 01/13/161 KWG160035301/14/16UNDResidual Range Organics (RRO)
Surrogate Name %Rec
Control
Limits NoteDate
Analyzed
50-150 Acceptableo-Terphenyl 01/14/1672
50-150 Acceptablen-Triacontane 01/14/1680
Comments:
1of1Page14:45:5701/15/2016Printed: Form 1A - Organic
Merged SuperSet Reference: RR185523u:\Stealth\Crystal.rpt\Form1mNew.rpt
94 of 113

Analytical Results
CH2M Hill K1600170
KWG1600353-4
ug/L
NA
Method Blank
NA
NA
City of Longview Ranney
Water
Client:
Project:
Sample Matrix:
Service Request:
Date Collected:
Date Received:
ALS Group USA, Corp. dba ALS Environmental
Units:
Basis:
Sample Name:
Diesel and Residual Range Organics
Lab Code:
Level: LowExtraction Method:
Analysis Method:
METHOD
NWTPH-Dx
NoteMRLQResultAnalyte Name
Extraction
Lot
Date
Analyzed
Date
Extracted
Dilution
Factor
250 01/13/161 KWG160035301/14/16UNDDiesel Range Organics (DRO)
500 01/13/161 KWG160035301/14/16UNDResidual Range Organics (RRO)
Surrogate Name %Rec
Control
Limits NoteDate
Analyzed
50-150 Acceptableo-Terphenyl 01/14/1677
50-150 Acceptablen-Triacontane 01/14/1677
Comments:
1of1Page14:46:0101/15/2016Printed: Form 1A - Organic
Merged SuperSet Reference: RR185523u:\Stealth\Crystal.rpt\Form1mNew.rpt
95 of 113

ALS Group USA, Corp. dba ALS Environmental
Extraction Method:
QA/QC Report
Surrogate Recovery Summary
CH2M Hill K1600170
Low
Water
City of Longview Ranney
Client:
Project:
Sample Matrix:
Service Request:
Units:
Level:
Sample Name Lab Code
Diesel and Residual Range Organics
METHOD
Analysis Method: NWTPH-Dx
Sur1 Sur2
Percent
K1600170-001WTP TEST WELL 72 80
KWG1600353-1WTP TEST WELLDUP 70 66
KWG1600353-4Method Blank 77 77
KWG1600353-3Lab Control Sample 85 86
Form 2A - OrganicPrinted: 01/15/2016 14:46:05 1 of 1
Surrogate Recovery Control Limits (%)
50-150
50-150
o-Terphenyl
n-Triacontane
Results flagged with an asterisk (*) indicate values outside control criteria.
Page
Results flagged with a pound (#) indicate the control criteria is not applicable.
RR185523SuperSet Reference:
Sur1
Sur2
=
=
u:\Stealth\Crystal.rpt\Form2.rpt
96 of 113

QA/QC Report
Duplicate Sample Summary
Diesel and Residual Range Organics
CH2M Hill
City of Longview Ranney
K1600170
NA
ug/L
Low
KWG1600353
K1600170-001
WTP TEST WELL
METHOD
NWTPH-Dx
Water
Sample
Result Average
Relative
Percent
DifferenceRPD Limit
01/13/2016
Client:
Project:
Sample Matrix:
Service Request:
Date Extracted:
Date Analyzed:
Units:
Basis:
Level:
Extraction Lot:
Extraction Method:
Analysis Method:
Lab Code:
Sample Name:
Analyte Name MRL
ALS Group USA, Corp. dba ALS Environmental
01/14/2016
Result
Duplicate Sample
KWG1600353-1
WTP TEST WELLDUP
ND ND260 30ND -Diesel Range Organics (DRO)
ND ND520 30ND -Residual Range Organics (RRO)
Form 3B - OrganicPrinted: 01/15/2016 14:46:10 1of1Page
Results flagged with an asterisk (*) indicate values outside control criteria.
Results flagged with a pound (#) indicate the control criteria is not applicable.
RR185523SuperSet Reference:
Percent recoveries and relative percent differences (RPD) are determined by the software using values in the calculation which have not been rounded.
u:\Stealth\Crystal.rpt\Form3DUP.rpt
97 of 113

Lab Control Spike Summary
%Rec
Lab Control Spike
%Rec
Limits
QA/QC Report
CH2M Hill K1600170
NWTPH-Dx
ug/L
NA
Lab Control Sample
KWG1600353-3
Diesel and Residual Range Organics
KWG1600353
Water
Low
City of Longview Ranney
Client:
Project:
Sample Matrix:
Service Request:
Units:
Basis:
Level:
Extraction Lot:
Analyte Name Result
Extraction Method:
Analysis Method:
ALS Group USA, Corp. dba ALS Environmental
Date Extracted:
Date Analyzed: 01/14/2016
01/13/2016
METHOD
Spike
Amount
46-1403200 792540Diesel Range Organics (DRO)
45-1591600 861380Residual Range Organics (RRO)
Form 3C - OrganicPrinted: 01/15/2016 14:46:14 Page 1 of 1
Results flagged with an asterisk (*) indicate values outside control criteria.
RR185523SuperSet Reference:
Percent recoveries and relative percent differences (RPD) are determined by the software using values in the calculation which have not been rounded.
u:\Stealth\Crystal.rpt\Form3LCS.rpt
98 of 113

Gasoline Range Organics
ALS Environmental—Kelso Laboratory 1317 South 13th Avenue, Kelso, WA 98626 Phone (360)577-7222 Fax (360)636-1068 www.alsglobal.com
RIGHT SOLUTIONS | RIGHT PARTNER
99 of 113

Analytical Results
CH2M Hill K1600170
K1600170-002
ug/L
NA
WTP TEST WELL 1/8/16
01/08/2016
01/08/2016
City of Longview Ranney
Water
Client:
Project:
Sample Matrix:
Service Request:
Date Collected:
Date Received:
ALS Group USA, Corp. dba ALS Environmental
Units:
Basis:
Sample Name:
Gasoline Range Organics
Lab Code:
Level: LowExtraction Method:
Analysis Method:
EPA 5030B
NWTPH-Gx
NoteMRLQResultAnalyte Name
Extraction
Lot
Date
Analyzed
Date
Extracted
Dilution
Factor
250 01/11/161 KWG160031501/11/16UNDGasoline Range Organics-NWTPH
Surrogate Name %Rec
Control
Limits NoteDate
Analyzed
50-150 Acceptable1,4-Difluorobenzene 01/11/1697
Comments:
1of1Page16:12:4701/12/2016Printed: Form 1A - Organic
Merged SuperSet Reference: RR185445u:\Stealth\Crystal.rpt\Form1mNew.rpt
100 of 113

Analytical Results
CH2M Hill K1600170
KWG1600315-3
ug/L
NA
Method Blank
NA
NA
City of Longview Ranney
Water
Client:
Project:
Sample Matrix:
Service Request:
Date Collected:
Date Received:
ALS Group USA, Corp. dba ALS Environmental
Units:
Basis:
Sample Name:
Gasoline Range Organics
Lab Code:
Level: LowExtraction Method:
Analysis Method:
EPA 5030B
NWTPH-Gx
NoteMRLQResultAnalyte Name
Extraction
Lot
Date
Analyzed
Date
Extracted
Dilution
Factor
250 01/11/161 KWG160031501/11/16UNDGasoline Range Organics-NWTPH
Surrogate Name %Rec
Control
Limits NoteDate
Analyzed
50-150 Acceptable1,4-Difluorobenzene 01/11/1697
Comments:
1of1Page16:12:5101/12/2016Printed: Form 1A - Organic
Merged SuperSet Reference: RR185445u:\Stealth\Crystal.rpt\Form1mNew.rpt
101 of 113

ALS Group USA, Corp. dba ALS Environmental
Extraction Method:
QA/QC Report
Surrogate Recovery Summary
CH2M Hill K1600170
Low
Water
City of Longview Ranney
Client:
Project:
Sample Matrix:
Service Request:
Units:
Level:
Sample Name Lab Code
Gasoline Range Organics
EPA 5030B
Analysis Method: NWTPH-Gx
Sur1
Percent
K1600170-002WTP TEST WELL 1/8/16 97
KWG1600315-1WTP TEST WELL 1/8/16DUP 96
KWG1600315-3Method Blank 97
KWG1600315-2Lab Control Sample 100
Form 2A - OrganicPrinted: 01/12/2016 16:12:55 1 of 1
Surrogate Recovery Control Limits (%)
50-1501,4-Difluorobenzene
Results flagged with an asterisk (*) indicate values outside control criteria.
Page
Results flagged with a pound (#) indicate the control criteria is not applicable.
RR185445SuperSet Reference:
Sur1 =
u:\Stealth\Crystal.rpt\Form2.rpt
102 of 113

QA/QC Report
Duplicate Sample Summary
Gasoline Range Organics
CH2M Hill
City of Longview Ranney
K1600170
NA
ug/L
Low
KWG1600315
K1600170-002
WTP TEST WELL 1/8/16
EPA 5030B
NWTPH-Gx
Water
Sample
Result Average
Relative
Percent
DifferenceRPD Limit
01/11/2016
Client:
Project:
Sample Matrix:
Service Request:
Date Extracted:
Date Analyzed:
Units:
Basis:
Level:
Extraction Lot:
Extraction Method:
Analysis Method:
Lab Code:
Sample Name:
Analyte Name MRL
ALS Group USA, Corp. dba ALS Environmental
01/11/2016
Result
Duplicate Sample
KWG1600315-1
WTP TEST WELL 1/8/16DUP
ND ND250 30ND -Gasoline Range Organics-NWTPH
Form 3B - OrganicPrinted: 01/12/2016 16:12:59 1of1Page
Results flagged with an asterisk (*) indicate values outside control criteria.
Results flagged with a pound (#) indicate the control criteria is not applicable.
RR185445SuperSet Reference:
Percent recoveries and relative percent differences (RPD) are determined by the software using values in the calculation which have not been rounded.
u:\Stealth\Crystal.rpt\Form3DUP.rpt
103 of 113
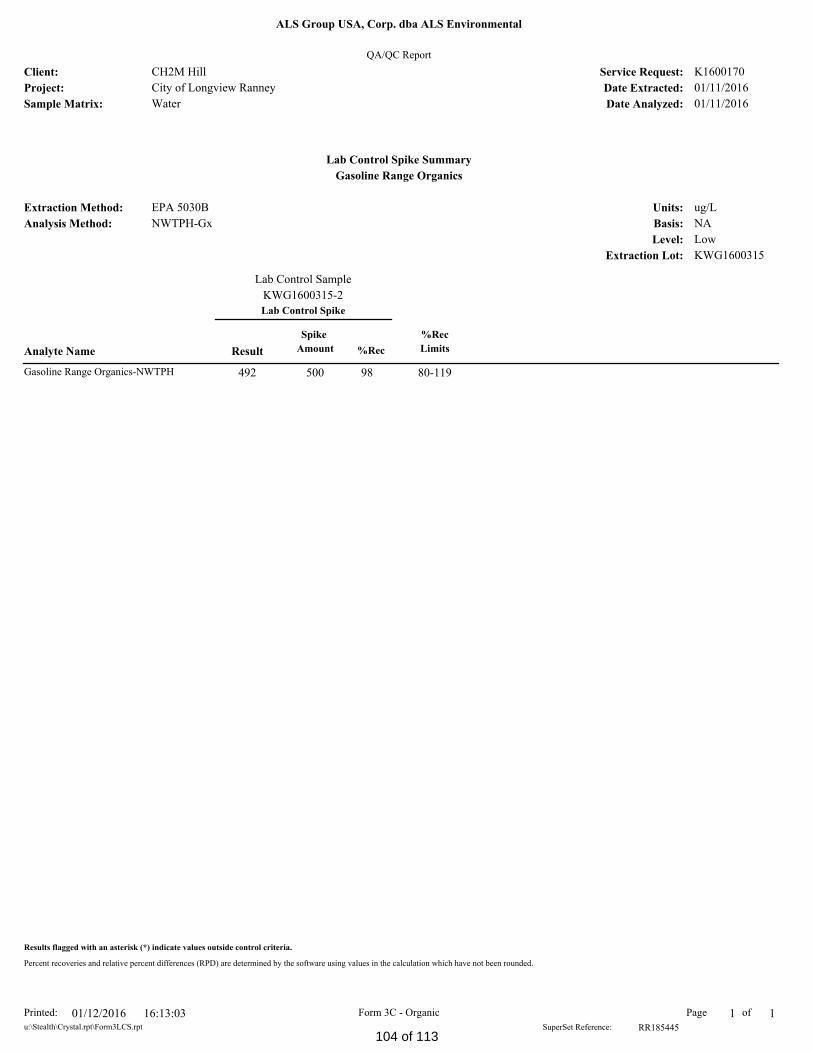
Lab Control Spike Summary
%Rec
Lab Control Spike
%Rec
Limits
QA/QC Report
CH2M Hill K1600170
NWTPH-Gx
ug/L
NA
Lab Control Sample
KWG1600315-2
Gasoline Range Organics
KWG1600315
Water
Low
City of Longview Ranney
Client:
Project:
Sample Matrix:
Service Request:
Units:
Basis:
Level:
Extraction Lot:
Analyte Name Result
Extraction Method:
Analysis Method:
ALS Group USA, Corp. dba ALS Environmental
Date Extracted:
Date Analyzed: 01/11/2016
01/11/2016
EPA 5030B
Spike
Amount
80-119500 98492Gasoline Range Organics-NWTPH
Form 3C - OrganicPrinted: 01/12/2016 16:13:03 Page 1 of 1
Results flagged with an asterisk (*) indicate values outside control criteria.
RR185445SuperSet Reference:
Percent recoveries and relative percent differences (RPD) are determined by the software using values in the calculation which have not been rounded.
u:\Stealth\Crystal.rpt\Form3LCS.rpt
104 of 113

Subcontract Lab Results
ALS Environmental—Kelso Laboratory 1317 South 13th Avenue, Kelso, WA 98626 Phone (360)577-7222 Fax (360)636-1068 www.alsglobal.com
RIGHT SOLUTIONS | RIGHT PARTNER
105 of 113

LABORATORY REPORT January 18, 2016 Brad Phelps CH2M Hill 2020 SW 4th Ave. Suite 300 Portland, OR 97201 RE: City of Longview Ranney Dear Brad: Enclosed are the results of the sample submitted to our laboratory on January 12, 2016. For your reference, this analysis has been assigned our service request number K1600170. All analyses were performed according to our laboratory’s NELAP and DoD-ELAP-approved quality assurance program. The test results meet requirements of the current NELAP and DoD-ELAP standards, where applicable, and except as noted in the laboratory case narrative provided. For a specific list of NELAP and DoD-ELAP-accredited analytes, refer to the certifications section at www.alsglobal.com. Results are intended to be considered in their entirety and apply only to the samples analyzed and reported herein. If you have any questions, please call me at (805) 526-7161. Respectfully submitted, ALS | Environmental Kate Aguilera Project Manager
106 of 113
Client: CH2M Hill Service Request No: K1600170 Project: City of Longview Ranney _______________________________________________________________________________
CASE NARRATIVE
The sample was received intact under chain of custody at the Simi Valley facility on January 12, 2016 and were stored in accordance with the analytical method requirements. Please refer to the sample acceptance check form for additional information. The results reported herein are applicable only to the condition of the sample(s) at the time of sample receipt. Hydrogen Sulfide Analysis The sample was analyzed for hydrogen sulfide using a gas chromatograph equipped with a sulfur chemiluminescence detector (SCD). This method is not included on the laboratory’s NELAP, DoD-ELAP, or AIHA-LAP scope of accreditation. ______________________________________________________________________________________ The results of analyses are given in the attached laboratory report. All results are intended to be considered in their entirety, and ALS Environmental (ALS) is not responsible for utilization of less than the complete report. Use of ALS Environmental (ALS)’s Name. Client shall not use ALS’s name or trademark in any marketing or reporting materials, press releases or in any other manner (“Materials”) whatsoever and shall not attribute to ALS any test result, tolerance or specification derived from ALS’s data (“Attribution”) without ALS’s prior written consent, which may be withheld by ALS for any reason in its sole discretion. To request ALS’s consent, Client shall provide copies of the proposed Materials or Attribution and describe in writing Client’s proposed use of such Materials or Attribution. If ALS has not provided written approval of the Materials or Attribution within ten (10) days of receipt from Client, Client’s request to use ALS’s name or trademark in any Materials or Attribution shall be deemed denied. ALS may, in its discretion, reasonably charge Client for its time in reviewing Materials or Attribution requests. Client acknowledges and agrees that the unauthorized use of ALS’s name or trademark may cause ALS to incur irreparable harm for which the recovery of money damages will be inadequate. Accordingly, Client acknowledges and agrees that a violation shall justify preliminary injunctive relief. For questions contact the laboratory.
107 of 113

ALS Environmental – Simi Valley
CERTIFICATIONS, ACCREDITATIONS, AND REGISTRATIONS
Agency Web Site Number
AIHA http://www.aihaaccreditedlabs.org 101661
Arizona DHS http://www.azdhs.gov/lab/license/env.htm AZ0694
DoD ELAP http://www.pjlabs.com/search-accredited-labs L15-398
Florida DOH (NELAP)
http://www.doh.state.fl.us/lab/EnvLabCert/WaterCert.htm E871020
Maine DHHS http://www.maine.gov/dhhs/mecdc/environmental-health/water/dwp-services/labcert/labcert.htm
2014025
Minnesota DOH (NELAP)
http://www.health.state.mn.us/accreditation 977273
New Jersey DEP (NELAP)
http://www.nj.gov/dep/oqa/ CA009
New York DOH (NELAP)
http://www.wadsworth.org/labcert/elap/elap.html 11221
Oregon PHD (NELAP)
http://public.health.oregon.gov/LaboratoryServices/EnvironmentalLaboratoryAccreditation/Pages/index.aspx
4068-001
Pennsylvania DEP http://www.depweb.state.pa.us/labs 68-03307
(Registration) Texas CEQ (NELAP)
http://www.tceq.texas.gov/field/qa/env_lab_accreditation.html T104704413-
15-6 Utah DOH (NELAP)
http://www.health.utah.gov/lab/labimp/certification/index.html CA01627201
5-5
Washington DOE http://www.ecy.wa.gov/programs/eap/labs/lab-accreditation.html C946
Analyses were performed according to our laboratory’s NELAP and DoD-ELAP approved quality assurance program. A complete listing of specific NELAP and DoD-ELAP certified analytes can be found in the certifications section at www.alsglobal.com, or at the accreditation body’s website. Each of the certifications listed above have an explicit Scope of Accreditation that applies to specific matrices/methods/analytes; therefore, please contact the laboratory for information corresponding to a particular certification.
108 of 113

109 of 113

ALS EnvironmentalSample Acceptance Check Form
Client: CH2M Hill Work order: K1600170Project: City of Longview RanneySample(s) received on: 1/12/16 Date opened: 1/12/16 by: KKELPE
Note: This form is used for all samples received by ALS. The use of this form for custody seals is strictly meant to indicate presence/absence and not as an indication of
compliance or nonconformity. Thermal preservation and pH will only be evaluated either at the request of the client and/or as required by the method/SOP.Yes No N/A
1 Were sample containers properly marked with client sample ID? 2 Did sample containers arrive in good condition? 3 Were chain-of-custody papers used and filled out? 4 Did sample container labels and/or tags agree with custody papers? 5 Was sample volume received adequate for analysis? 6 Are samples within specified holding times? 7 Was proper temperature (thermal preservation) of cooler at receipt adhered to?
Cooler Temperature: ° C Blank Temperature: 1° C
8 Were custody seals on outside of cooler/Box/Container? Location of seal(s)? SEALING COOLER Sealing Lid?
Were signature and date included? Were seals intact?
9 Is there a client indication that the submitted samples are pH preserved? Were VOA vials checked for presence/absence of air bubbles?
10 Tubes: Are the tubes capped and intact? 11 Badges: Are the badges properly capped and intact?
Are dual bed badges separated and individually capped and intact?
Lab Sample ID Container Required Received Adjusted VOA Headspace
Description pH * pH pH (Presence/Absence) Comments
40mL VOA NP 7 1 A40mL VOA NP 7 1 A40mL VOA NP A
The samples were received at ALS-Kelso on 1/8/16
RSK - MEEPP, HCL (pH<2); RSK - CO2, (pH 5-8); Sulfur (pH>4)
Gel Packs
MC 01/15/2016
Explain any discrepancies: (include lab sample ID numbers):
Do containers have appropriate preservation, according to method/SOP or Client specified information?
Does the client/method/SOP require that the analyst check the sample pH and if necessary alter it?
Receipt / Preservation
K1600170-002.19K1600170-002.20K1600170-002.21
MC 01/15/2016
110 of 113

ALS ENVIRONMENTAL
RESULTS OF ANALYSIS
Page 1 of 1
Client: CH2M HillClient Project ID: City of Longview Ranney ALS Project ID: K1600170
Hydrogen Sulfide
Test Code: GC/SCD Reduced Sulfur AnalysisInstrument ID: Agilent 6890A/GC13/SCD Date(s) Collected: 1/8/16Analyst: Mike Conejo Date Received: 1/8/16Sample Type: Water Date Analyzed: 1/15/16Test Notes:
Liquid Amount: Purge Injection
Client Sample ID ALS Sample ID Amount Volume Volume Result MRL Data
ml(s) Liter(s) ml(s) µg/L µg/L Qualifier
WTP TEST WELL 1/8/16 K1600170-002 10.0 0.30 1.00 ND 0.84
Method Blank P160115-MB 10.0 0.30 1.00 ND 0.84
ND = Compound was analyzed for, but not detected above the laboratory reporting limit.MRL = Method Reporting Limit - The minimum quantity of a target analyte that can be confidently determined by the referenced method.
111 of 113

ALS ENVIRONMENTAL
LABORATORY CONTROL SAMPLE / DUPLICATE LABORATORY CONTROL SAMPLE SUMMARY
Page 1 of 1
Client: CH2M HillClient Sample ID: Duplicate Lab Control Sample ALS Project ID: K1600170Client Project ID: City of Longview Ranney ALS Sample ID: P160115-DLCS
Test Code: GC/SCD Reduced Sulfur Analysis Date Collected: NAInstrument ID: Agilent 6890A/GC13/SCD Date Received: NAAnalyst: Mike Conejo Date Analyzed: 1/15/16Sample Type: Water Liquid Amount: 10.0 ml(s)Test Notes: Purge Volume: 0.30 Liter(s) Injection Volume: 0.20 ml(s)
Spike Amount Result ALS
CAS # Compound LCS / DLCS LCS DLCS % Recovery Acceptance RPD RPD Dataug/L ug/L ug/L LCS DLCS Limits Limit Qualifier
7783-06-4 Hydrogen Sulfide 418 419 436 100 104 45-151 4 28
112 of 113

ALS ENVIRONMENTAL
LABORATORY DUPLICATE SUMMARY RESULTS
Page 1 of 1
Client: CH2M HillClient Sample ID: WTP TEST WELL 1/8/16 ALS Project ID: K1600170Client Project ID: City of Longview Ranney ALS Sample ID: K1600170-002DUP
Test Code: GC/SCD Reduced Sulfur Analysis Date Collected: 1/8/16Instrument ID: Agilent 6890A/GC13/SCD Date Received: 1/8/16Analyst: Mike Conejo Date Analyzed: 1/15/16Sample Type: Water Liquid Amount: 1.00 ml(s)Test Notes: Purge Volume: 0.30 Liter(s) Injection Volume(s): 1.00 ml(s)
Duplicate
CAS # Compound Sample Result Sample Result Average % RPD RPD Dataµg/L µg/L Limit Qualifier
7783-06-4 Hydrogen Sulfide ND ND - - 28
ND = Compound was analyzed for, but not detected above the laboratory reporting limit.
113 of 113
ATTACHMENT 5 COWLITZ RIVER SAMPLE
LABORATORY ANALYSIS RESULTS

These results may be invalid.
Ordered By:
Collector Wells Intl.6360 Huntley RdColumbus, OH 43229ATTN: James Bell
Client:
Longview, WA
This informational water quality report compares the actual test result to national standards as defined in the EPA's Primary and
Secondary Drinking Water Regulations.
Informational Water Quality Report
Sample Number:
Collection Date and Time:
Received Date and Time:
Date Completed:
859997
1/12/2016 15:20
1/14/2016 10:40
1/28/2016
Other
Definition and Legend
The contaminant was not detected in the sample above the minimum detection level.
The contaminant was detected at or above the minimum detection level, but not above the referenced standard.
The contaminant was detected above the standard, which is not an EPA enforceable MCL.
The contaminant was detected above the EPA enforceable MCL.
mg/L (ppm):
The lowest level that the laboratory can detect a contaminant.
ND: The contaminant was not detected above the minimum detection level.
Minimum DetectionLevel (MDL):
Unless otherwise indicated, results and standards are expressed as an amount in milligrams per liter orparts per million.
Cowlitz RiverLocation:
Type of Water:
Watercheck w/PO
Primary Standards: Are expressed as the maximum contaminant level (MCL) which is the highest level of contaminant that
is allowed in drinking water. MCLs are enforceable standards.
Secondary standards: Are non-enforceable guidelines regulating contaminants that may cause cosmetic effects (such as skin
or tooth discoloration) or aesthetic effects (such as taste, odor,or color) in drinking water. Individual
states may choose to adopt them as enforceable standards.
Action levels: Are defined in treatment techniques which are required processes intended to reduce the level of acontaminant in drinking water.
6571 Wilson Mills RdCleveland, Ohio 44143
1-800-458-3330
NA: The contaminant was not analyzed.

Microbiologicals
No bacteria sample was required.Total Coliform by P/A
Inorganic Analytes - Metals
0.3Aluminum mg/L 0.2 EPA Secondary 0.1
NDArsenic mg/L 0.010 EPA Primary 0.005
NDBarium mg/L 2 EPA Primary 0.30
NDCadmium mg/L 0.005 EPA Primary 0.002
7.1Calcium mg/L -- 2.0
NDChromium mg/L 0.1 EPA Primary 0.010
NDCopper mg/L 1.3 EPA Action Level 0.004
0.434Iron mg/L 0.3 EPA Secondary 0.020
NDLead mg/L 0.015 EPA Action Level 0.002
0.001Lithium mg/L -- 0.001
1.65Magnesium mg/L -- 0.10
0.051Manganese mg/L 0.05 EPA Secondary 0.004
NDMercury mg/L 0.002 EPA Primary 0.001
NDNickel mg/L -- 0.020
NDPotassium mg/L -- 1.0
NDSelenium mg/L 0.05 EPA Primary 0.020
18.0Silica mg/L -- 0.1
NDSilver mg/L 0.100 EPA Secondary 0.002
4Sodium mg/L -- 1
0.029Strontium mg/L -- 0.001
NDUranium mg/L 0.030 EPA Primary 0.001
NDZinc mg/L 5 EPA Secondary 0.004
Physical Factors
28Alkalinity (Total as CaCO3) mg/L -- 20
24Hardness mg/L 100 NTL Internal 10
Status Contaminant Results Units National Standards Min. Detection Level
Page 2 of 6 Sample: 859997Product: Watercheck w/PO1/28/2016 1:59:17 PM

7.4pH pH Units 6.5 to 8.5 EPA Secondary
53Total Dissolved Solids mg/L 500 EPA Secondary 20
6.4Turbidity NTU 1.0 EPA Action Level 0.1
Inorganic Analytes - Other
NDBromide mg/L -- 0.5
NDChloride mg/L 250 EPA Secondary 5.0
NDFluoride mg/L 4.0 EPA Primary 0.5
NDNitrate as N mg/L 10 EPA Primary 0.5
NDNitrite as N mg/L 1 EPA Primary 0.5
NDOrtho Phosphate mg/L -- 2.0
5.1Sulfate mg/L 250 EPA Secondary 5.0
Organic Analytes - Trihalomethanes
NDBromodichloromethane mg/L -- 0.002
NDBromoform mg/L -- 0.004
NDChloroform mg/L -- 0.002
NDDibromochloromethane mg/L -- 0.004
NDTotal THMs mg/L 0.080 EPA Primary 0.002
Organic Analytes - Volatiles
ND1,1,1,2-Tetrachloroethane mg/L -- 0.002
ND1,1,1-Trichloroethane mg/L 0.2 EPA Primary 0.001
ND1,1,2,2-Tetrachloroethane mg/L -- 0.002
ND1,1,2-Trichloroethane mg/L 0.005 EPA Primary 0.002
ND1,1-Dichloroethane mg/L -- 0.002
ND1,1-Dichloroethene mg/L 0.007 EPA Primary 0.001
ND1,1-Dichloropropene mg/L -- 0.002
ND1,2,3-Trichlorobenzene mg/L -- 0.002
ND1,2,3-Trichloropropane mg/L -- 0.002
ND1,2,4-Trichlorobenzene mg/L 0.07 EPA Primary 0.002
Status Contaminant Results Units National Standards Min. Detection Level
Page 3 of 6 Sample: 859997Product: Watercheck w/PO1/28/2016 1:59:17 PM

ND1,2-Dichlorobenzene mg/L 0.6 EPA Primary 0.001
ND1,2-Dichloroethane mg/L 0.005 EPA Primary 0.001
ND1,2-Dichloropropane mg/L 0.005 EPA Primary 0.002
ND1,3-Dichlorobenzene mg/L -- 0.001
ND1,3-Dichloropropane mg/L -- 0.002
ND1,4-Dichlorobenzene mg/L 0.075 EPA Primary 0.001
ND2,2-Dichloropropane mg/L -- 0.002
ND2-Chlorotoluene mg/L -- 0.001
ND4-Chlorotoluene mg/L -- 0.001
NDAcetone mg/L -- 0.01
NDBenzene mg/L 0.005 EPA Primary 0.001
NDBromobenzene mg/L -- 0.002
NDBromomethane mg/L -- 0.002
NDCarbon Tetrachloride mg/L 0.005 EPA Primary 0.001
NDChlorobenzene mg/L 0.1 EPA Primary 0.001
NDChloroethane mg/L -- 0.002
NDChloromethane mg/L -- 0.002
NDcis-1,2-Dichloroethene mg/L 0.07 EPA Primary 0.002
NDcis-1,3-Dichloropropene mg/L -- 0.002
NDDBCP mg/L -- 0.001
NDDibromomethane mg/L -- 0.002
NDDichlorodifluoromethane mg/L -- 0.002
NDDichloromethane mg/L 0.005 EPA Primary 0.002
NDEDB mg/L -- 0.001
NDEthylbenzene mg/L 0.7 EPA Primary 0.001
NDMethyl Tert Butyl Ether mg/L -- 0.004
NDMethyl-Ethyl Ketone mg/L -- 0.01
NDStyrene mg/L 0.1 EPA Primary 0.001
Status Contaminant Results Units National Standards Min. Detection Level
Page 4 of 6 Sample: 859997Product: Watercheck w/PO1/28/2016 1:59:17 PM

NDTetrachloroethene mg/L 0.005 EPA Primary 0.002
NDTetrahydrofuran mg/L -- 0.01
NDToluene mg/L 1 EPA Primary 0.001
NDtrans-1,2-Dichloroethene mg/L 0.1 EPA Primary 0.002
NDtrans-1,3-Dichloropropene mg/L -- 0.002
NDTrichloroethene mg/L 0.005 EPA Primary 0.001
NDTrichlorofluoromethane mg/L -- 0.002
NDVinyl Chloride mg/L 0.002 EPA Primary 0.001
NDXylenes (Total) mg/L 10 EPA Primary 0.001
Organic Analytes - Others
ND2,4-D mg/L 0.07 EPA Primary 0.010
NDAlachlor mg/L 0.002 EPA Primary 0.001
NDAldrin mg/L -- 0.002
NDAtrazine mg/L 0.003 EPA Primary 0.002
NDChlordane mg/L 0.002 EPA Primary 0.001
NDDichloran mg/L -- 0.002
NDDieldrin mg/L -- 0.001
NDEndrin mg/L 0.002 EPA Primary 0.0001
NDHeptachlor mg/L 0.0004 EPA Primary 0.0004
NDHeptachlor Epoxide mg/L 0.0002 EPA Primary 0.0001
NDHexachlorobenzene mg/L 0.001 EPA Primary 0.0005
NDHexachlorocyclopentadiene mg/L 0.05 EPA Primary 0.001
NDLindane mg/L 0.0002 EPA Primary 0.0002
NDMethoxychlor mg/L 0.04 EPA Primary 0.002
NDPentachloronitrobenzene mg/L -- 0.002
NDSilvex 2,4,5-TP mg/L 0.05 EPA Primary 0.005
NDSimazine mg/L 0.004 EPA Primary 0.002
NDTotal PCBs mg/L 0.0005 EPA Primary 0.0005
Status Contaminant Results Units National Standards Min. Detection Level
Page 5 of 6 Sample: 859997Product: Watercheck w/PO1/28/2016 1:59:17 PM

NDToxaphene mg/L 0.003 EPA Primary 0.001
NDTrifluralin mg/L -- 0.002
We certify that the analyses performed for this report are accurate, and that the laboratory tests were conducted by methodsapproved by the U.S. Environmental Protection Agency or variations of these EPA methods.
These test results are intended to be used for informational purposes only and may not be used for regulatory compliance.
National Testing Laboratories, Ltd.NATIONAL TESTING LABORATORIES, LTD
Status Contaminant Results Units National Standards Min. Detection Level
Page 6 of 6 Sample: 859997Product: Watercheck w/PO1/28/2016 1:59:17 PM