memphis police departmentmemphispolice.org/pdf/2013_mpd_boundaries.pdf · memphis police department...
TRANSCRIPT
Memphis Police Department
2013 Station and Ward Reconfiguration
Call and Offense Counts
Toney Armstrong, Director

The 2011 draft of the Police Executive Research Forum Report (PERF) suggested that officers should be re-allocated to even the call load among precincts. The MPD Crime Analysis Unit, the University of Memphis and the MPD Command Staff reviewed 2010, 2011 and 2012 calls for service citywide and by precinct. MPD staff identified a huge disparity in the number of calls for service among precincts. For example, in 2011 Old Allen Officers answered 116,996 calls for service while South Main Station answered a mere 54,828 calls for service. This has become an "Officer Safety issue". There are times when the call load at the Old Allen Station is so heavy, that officers cannot get on the air to call for assistance. Dispatchers routinely express concern about working Old Allen Station's Radio frequency. Taking this into consideration, the decision was made to reconfigure the precinct and ward boundaries to create a more even distribution of the call load and to allow for a more efficient allocation of personnel and resources. Precinct Boundaries were adjusted to level the number of calls for service while also observing the effects of natural and man-made geographical boundaries which may influence response times. These boundaries include interstates, waterways, railroads, and jurisdictional boundaries. Patrol Districts in each precinct were created using the same criteria. In achieving this, some precincts and some patrol districts have become larger while others have become smaller.
Introduction
Continued on next page
For example, Tillman Station has been redistricted to a smaller geographical area with a lower number of annual calls. Tillman Station received a total of 91,752 calls in the current boundaries, but using the new boundaries they would only have answered 80,389 calls. The new geographical boundaries correct what we believe to be grossly underserved areas of the City of Memphis and allow precincts to be more competitive in their crime fighting efforts. MPD and the University of Memphis have Geocoded all incident reports in the Vision RMS system. Records in the RMS are being updated to reflect the new ward boundaries. This will allow us to provide accurate data on all of our statistics. Manpower is being redeployed based upon statistical history of crime. This is in keeping with everything that MPD has done since 2006. Months of planning and decision making have gone into this project to make sure that this transition flows as smoothly as possible. These changes are being made in order to equalize the number of calls in each district. These changes will allow the MPD to become a proactive police department rather than a reactive department. Flare ups of crime are closely monitored by precinct commanders and are addressed by adding more manpower to an affected area by reallocation of Precinct Taskforces and Special Operations Units. The Memphis Police Department remains committed to providing the best possible service to the citizens of our city, and we believe that this reconfiguration of our stations and wards will improve our capability to provide that service.

5

6
7

8

9

10

11
TotalAverage #
per WardTotal
Average #
per WardTotal
Average #
per WardTotal
Average #
per Ward
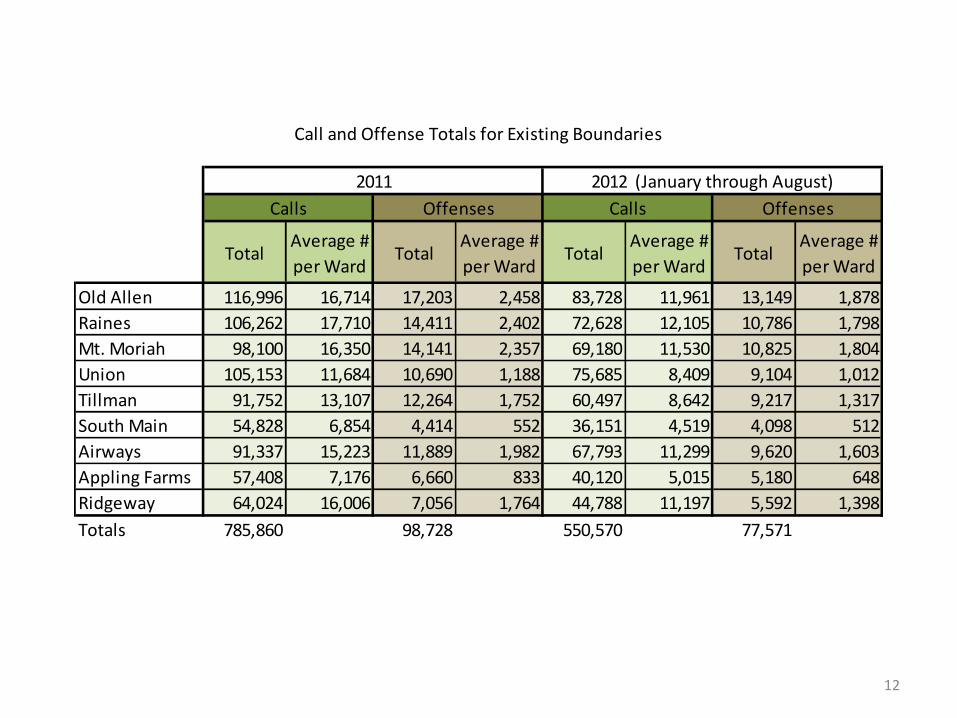
Old Allen 116,996 16,714 17,203 2,458 83,728 11,961 13,149 1,878
Raines 106,262 17,710 14,411 2,402 72,628 12,105 10,786 1,798
Mt. Moriah 98,100 16,350 14,141 2,357 69,180 11,530 10,825 1,804
Union 105,153 11,684 10,690 1,188 75,685 8,409 9,104 1,012
Tillman 91,752 13,107 12,264 1,752 60,497 8,642 9,217 1,317
South Main 54,828 6,854 4,414 552 36,151 4,519 4,098 512
Airways 91,337 15,223 11,889 1,982 67,793 11,299 9,620 1,603
Appling Farms 57,408 7,176 6,660 833 40,120 5,015 5,180 648
Ridgeway 64,024 16,006 7,056 1,764 44,788 11,197 5,592 1,398
Totals 785,860 98,728 550,570 77,571
2011 2012 (January through August)
Calls Offenses Calls Offenses
Call and Offense Totals for Existing Boundaries
12
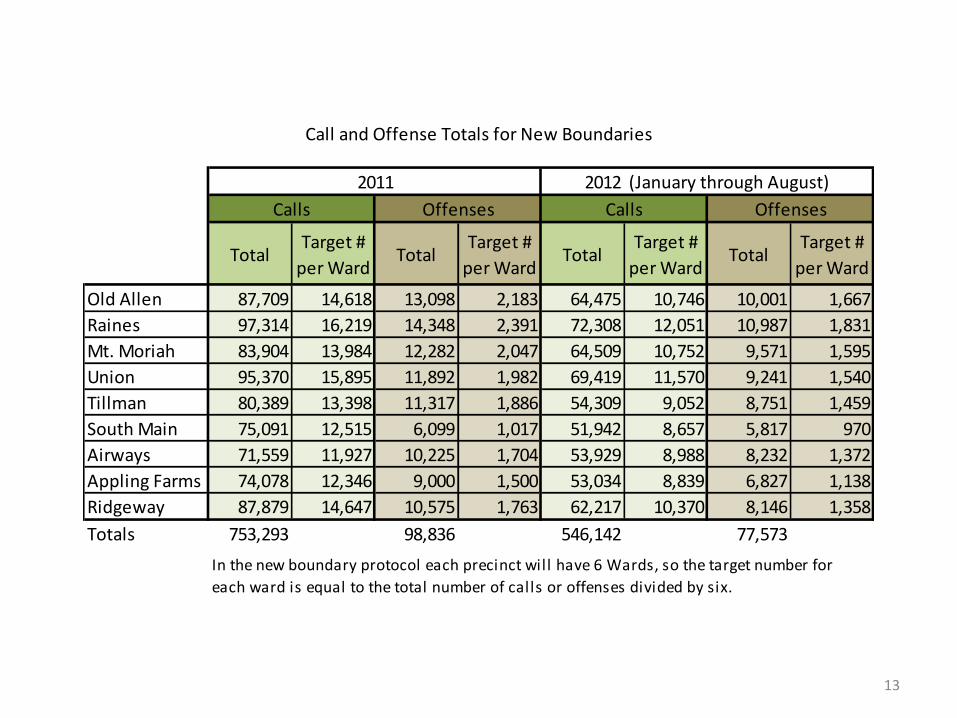
TotalTarget #
per WardTotal
Target #
per WardTotal
Target #
per WardTotal
Target #
per Ward
Old Allen 87,709 14,618 13,098 2,183 64,475 10,746 10,001 1,667
Raines 97,314 16,219 14,348 2,391 72,308 12,051 10,987 1,831
Mt. Moriah 83,904 13,984 12,282 2,047 64,509 10,752 9,571 1,595
Union 95,370 15,895 11,892 1,982 69,419 11,570 9,241 1,540
Tillman 80,389 13,398 11,317 1,886 54,309 9,052 8,751 1,459
South Main 75,091 12,515 6,099 1,017 51,942 8,657 5,817 970
Airways 71,559 11,927 10,225 1,704 53,929 8,988 8,232 1,372
Appling Farms 74,078 12,346 9,000 1,500 53,034 8,839 6,827 1,138
Ridgeway 87,879 14,647 10,575 1,763 62,217 10,370 8,146 1,358
Totals 753,293 98,836 546,142 77,573
Call and Offense Totals for New Boundaries
In the new boundary protocol each precinct will have 6 Wards, so the target number for
each ward is equal to the total number of calls or offenses divided by six.
Offenses
2011 2012 (January through August)
Calls Offenses Calls
13

Current Calls
per Officer
New Calls
per Officer
Old Allen 616 605
Raines 764 671
Mt. Moriah 706 579
Union 683 658
Tillman 584 554
South Main* 419 429
Airways 703 494
Appling Farms 413 511
Ridgeway 653 606
*Includes EDU Officers
14
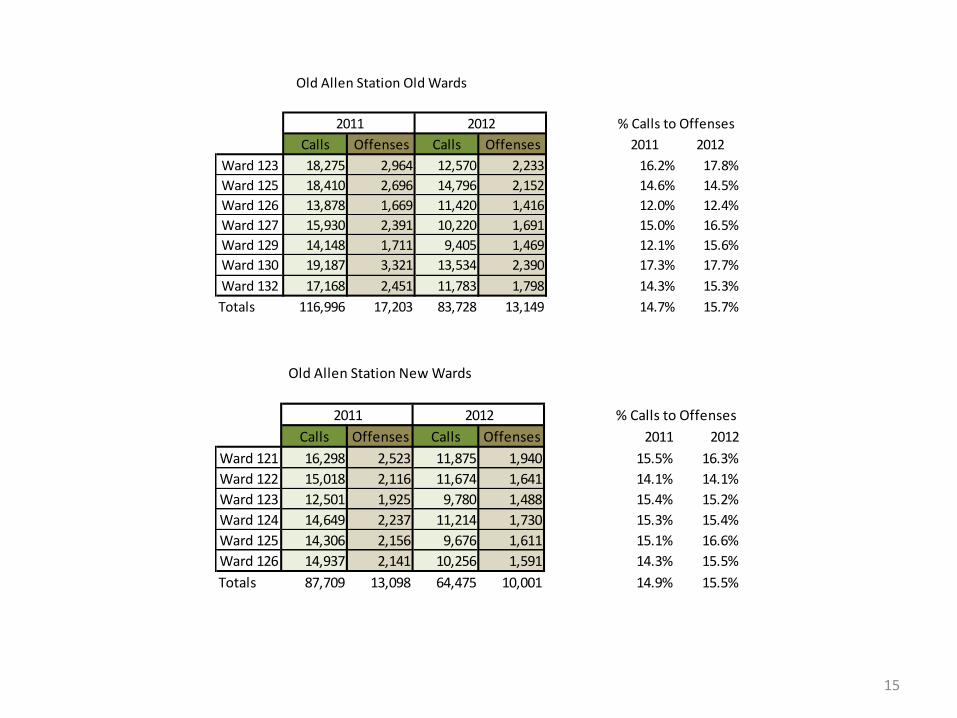
Calls Offenses Calls Offenses 2011 2012
Ward 123 18,275 2,964 12,570 2,233 16.2% 17.8%
Ward 125 18,410 2,696 14,796 2,152 14.6% 14.5%
Ward 126 13,878 1,669 11,420 1,416 12.0% 12.4%
Ward 127 15,930 2,391 10,220 1,691 15.0% 16.5%
Ward 129 14,148 1,711 9,405 1,469 12.1% 15.6%
Ward 130 19,187 3,321 13,534 2,390 17.3% 17.7%
Ward 132 17,168 2,451 11,783 1,798 14.3% 15.3%
Totals 116,996 17,203 83,728 13,149 14.7% 15.7%
% Calls to Offenses
Old Allen Station Old Wards
2011 2012
Calls Offenses Calls Offenses 2011 2012
Ward 121 16,298 2,523 11,875 1,940 15.5% 16.3%
Ward 122 15,018 2,116 11,674 1,641 14.1% 14.1%
Ward 123 12,501 1,925 9,780 1,488 15.4% 15.2%
Ward 124 14,649 2,237 11,214 1,730 15.3% 15.4%
Ward 125 14,306 2,156 9,676 1,611 15.1% 16.6%
Ward 126 14,937 2,141 10,256 1,591 14.3% 15.5%
Totals 87,709 13,098 64,475 10,001 14.9% 15.5%
% Calls to Offenses
Old Allen Station New Wards
2011 2012
15

Calls Offenses Calls Offenses 2011 2012
Ward 221 7,823 892 5,077 707 11.4% 13.9%
Ward 222 13,751 1,881 9,345 1,263 13.7% 13.5%
Ward 227 14,395 1,349 10,303 1,175 9.4% 11.4%
Ward 228 15,280 2,119 10,596 1,609 13.9% 15.2%
Ward 230 24,896 3,306 16,350 2,371 13.3% 14.5%
Ward 232 30,117 4,864 20,957 3,661 16.2% 17.5%
Totals 106,262 14,411 72,628 10,786 13.6% 14.9%
% Calls to Offenses
Raines Station Old Wards
2011 2012
Calls Offenses Calls Offenses 2011 2012
Ward 221 16,855 2,297 10,950 1,843 13.6% 16.8%
Ward 222 15,562 2,371 11,900 1,567 15.2% 13.2%
Ward 223 14,969 1,857 12,334 1,848 12.4% 15.0%
Ward 224 15,994 2,309 10,669 1,505 14.4% 14.1%
Ward 225 17,542 2,607 14,031 2,102 14.9% 15.0%
Ward 226 16,392 2,908 12,424 2,122 17.7% 17.1%
Totals 97,314 14,348 72,308 10,987 14.7% 15.2%
% Calls to Offenses20122011
Raines Station New Wards
16

Calls Offenses Calls Offenses 2011 2012
Ward 321 12,937 1,808 8,795 1,390 14.0% 15.8%
Ward 322 15,023 1,879 10,323 1,567 12.5% 15.2%
Ward 326 15,622 2,012 11,683 1,663 12.9% 14.2%
Ward 327 14,648 2,007 10,320 1,573 13.7% 15.2%
Ward 328 22,212 3,390 14,886 2,426 15.3% 16.3%Ward 329 17,658 3,045 13,173 2,206 17.2% 16.7%
Totals 98,100 14,141 69,180 10,825 14.4% 15.6%
% Calls to Offenses
Mt. Moriah Station Old Wards
2011 2012
Calls Offenses Calls Offenses 2011 2012
Ward 321 15,372 2,301 12,354 1,924 15.0% 15.6%
Ward 322 12,975 1,899 9,256 1,481 14.6% 16.0%
Ward 323 12,692 1,735 9,672 1,456 13.7% 15.1%
Ward 324 14,099 2,004 10,038 1,566 14.2% 15.6%
Ward 325 13,335 2,179 11,553 1,596 16.3% 13.8%
Ward 326 15,431 2,164 11,636 1,548 14.0% 13.3%
Totals 83,904 12,282 64,509 9,571 14.6% 14.8%
% Calls to Offenses20122011
Mt. Moriah Station New Wards
17

Calls Offenses Calls Offenses 2011 2012
Ward 421 5,084 462 4,380 378 9.1% 8.6%
Ward 422 10,254 885 7,199 804 8.6% 11.2%
Ward 423 11,561 906 8,952 917 7.8% 10.2%
Ward 424 7,365 647 5,468 698 8.8% 12.8%
Ward 425 10,463 1,368 6,641 995 13.1% 15.0%
Ward 426 22,731 2,497 14,542 2,010 11.0% 13.8%
Ward 429 11,019 1,111 8,258 904 10.1% 10.9%
Ward 430 9,138 930 7,420 776 10.2% 10.5%
Ward 432 17,538 1,884 12,825 1,622 10.7% 12.6%
Totals 105,153 10,690 75,685 9,104 10.2% 12.0%
% Calls to Offenses
Union Station Old Wards
2011 2012
Calls Offenses Calls Offenses 2011 2012
Ward 421 15,240 1,761 13,427 1,419 11.6% 10.6%
Ward 422 16,503 1,709 13,260 1,502 10.4% 11.3%
Ward 423 17,575 2,240 11,416 1,736 12.7% 15.2%
Ward 424 16,825 2,045 12,147 1,582 12.2% 13.0%
Ward 425 13,737 1,751 8,516 1,298 12.7% 15.2%
Ward 426 15,490 2,386 10,653 1,704 15.4% 16.0%
Totals 95,370 11,892 69,419 9,241 12.5% 13.3%
% Calls to Offenses
Union Station New Wards
20122011
18

Calls Offenses Calls Offenses 2011 2012
Ward 521 13,798 1,460 8,691 1,262 10.6% 14.5%
Ward 522 18,845 2,555 12,646 2,064 13.6% 16.3%
Ward 524 15,793 2,258 9,983 1,556 14.3% 15.6%
Ward 525 12,550 1,642 7,735 1,269 13.1% 16.4%
Ward 526 6,826 1,003 4,711 757 14.7% 16.1%
Ward 527 15,134 2,421 10,365 1,648 16.0% 15.9%
Ward 528 8,806 925 6,366 661 10.5% 10.4%
Totals 91,752 12,264 60,497 9,217 13.4% 15.2%
% Calls to Offenses
Tillman Station Old Wards
2011 2012
Calls Offenses Calls Offenses 2011 2012
Ward 521 11,867 1,812 8,852 1,478 15.3% 16.7%
Ward 522 10,356 1,362 7,561 1,118 13.2% 14.8%
Ward 523 14,028 1,919 9,018 1,484 13.7% 16.5%
Ward 524 17,339 2,385 11,531 1,849 13.8% 16.0%
Ward 525 12,519 2,000 8,467 1,372 16.0% 16.2%
Ward 526 14,280 1,839 8,880 1,450 12.9% 16.3%
Totals 80,389 11,317 54,309 8,751 14.1% 16.1%
% Calls to Offenses
Tillman Station New Wards
20122011
19
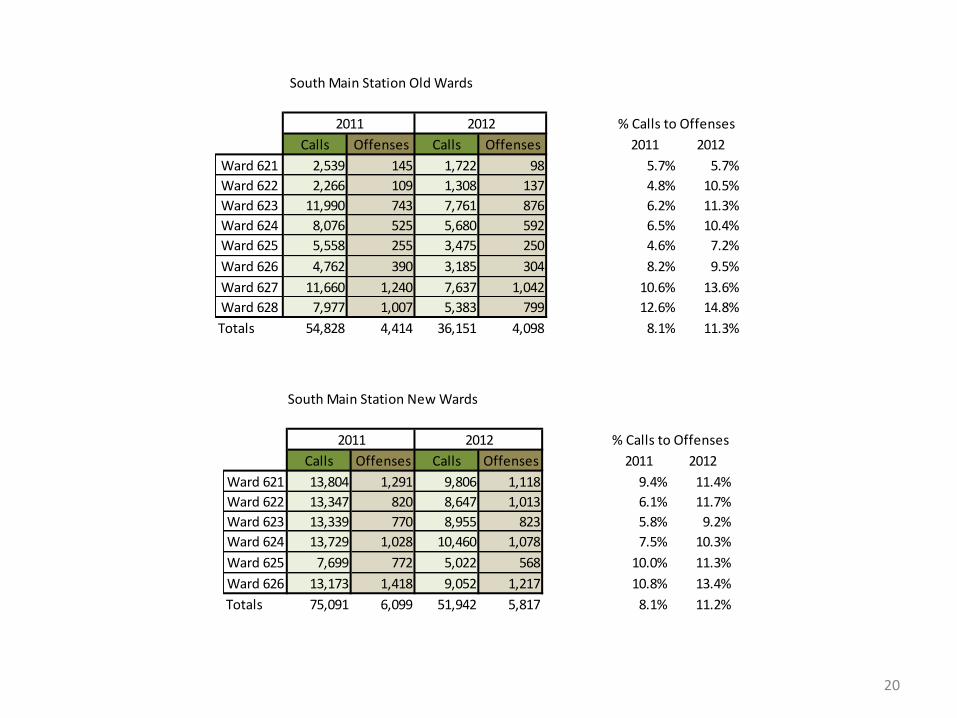
Calls Offenses Calls Offenses 2011 2012
Ward 621 2,539 145 1,722 98 5.7% 5.7%
Ward 622 2,266 109 1,308 137 4.8% 10.5%
Ward 623 11,990 743 7,761 876 6.2% 11.3%
Ward 624 8,076 525 5,680 592 6.5% 10.4%
Ward 625 5,558 255 3,475 250 4.6% 7.2%
Ward 626 4,762 390 3,185 304 8.2% 9.5%
Ward 627 11,660 1,240 7,637 1,042 10.6% 13.6%
Ward 628 7,977 1,007 5,383 799 12.6% 14.8%
Totals 54,828 4,414 36,151 4,098 8.1% 11.3%
% Calls to Offenses
South Main Station Old Wards
2011 2012
Calls Offenses Calls Offenses 2011 2012
Ward 621 13,804 1,291 9,806 1,118 9.4% 11.4%
Ward 622 13,347 820 8,647 1,013 6.1% 11.7%
Ward 623 13,339 770 8,955 823 5.8% 9.2%
Ward 624 13,729 1,028 10,460 1,078 7.5% 10.3%
Ward 625 7,699 772 5,022 568 10.0% 11.3%
Ward 626 13,173 1,418 9,052 1,217 10.8% 13.4%
Totals 75,091 6,099 51,942 5,817 8.1% 11.2%
% Calls to Offenses
South Main Station New Wards
20122011
20

Calls Offenses Calls Offenses 2011 2012
Ward 721 11,934 1,610 9,099 1,225 13.5% 13.5%
Ward 722 13,742 1,684 10,825 1,273 12.3% 11.8%
Ward 723 24,034 3,260 18,141 2,680 13.6% 14.8%
Ward 724 11,875 1,387 9,316 1,298 11.7% 13.9%
Ward 725 12,840 1,757 8,442 1,417 13.7% 16.8%
Ward 726 16,912 2,191 11,970 1,727 13.0% 14.4%
Totals 91,337 11,889 67,793 9,620 13.0% 14.2%
% Calls to Offenses
Airways Station Old Wards
2011 2012
Calls Offenses Calls Offenses 2011 2012
Ward 721 11,267 1,609 8,877 1,225 14.3% 13.8%
Ward 722 12,223 1,682 9,851 1,263 13.8% 12.8%
Ward 723 11,512 1,671 8,123 1,406 14.5% 17.3%
Ward 724 10,228 1,578 7,848 1,218 15.4% 15.5%
Ward 725 12,772 1,615 9,497 1,534 12.6% 16.2%
Ward 726 13,557 2,070 9,733 1,586 15.3% 16.3%
Totals 71,559 10,225 53,929 8,232 14.3% 15.3%
% Calls to Offenses
Airways Station New Wards
20122011
21
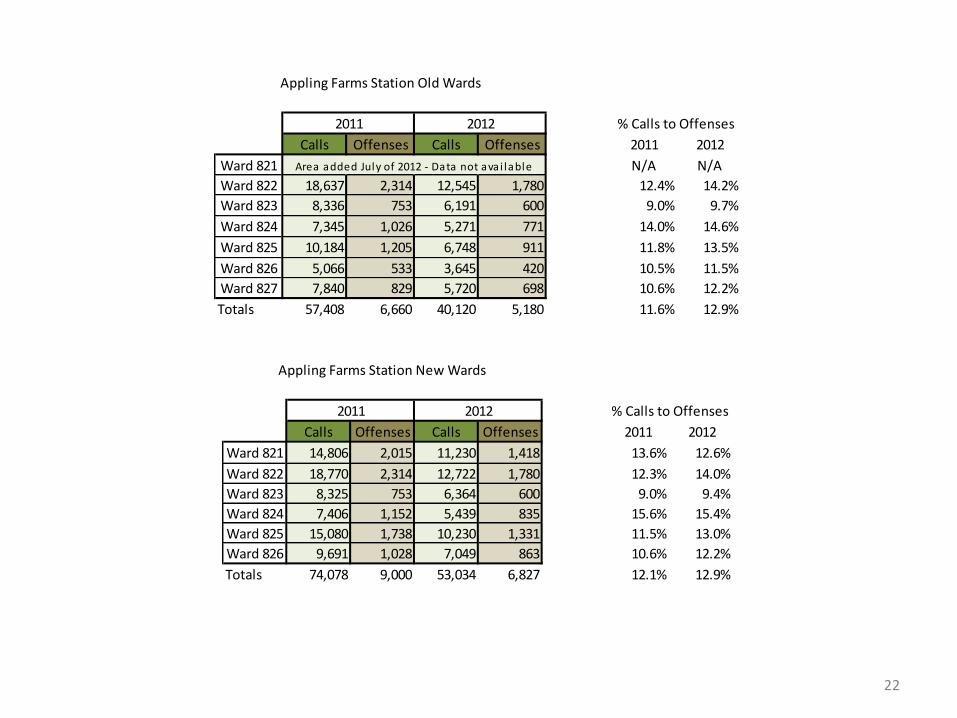
Calls Offenses Calls Offenses 2011 2012
Ward 821 N/A N/A
Ward 822 18,637 2,314 12,545 1,780 12.4% 14.2%
Ward 823 8,336 753 6,191 600 9.0% 9.7%
Ward 824 7,345 1,026 5,271 771 14.0% 14.6%
Ward 825 10,184 1,205 6,748 911 11.8% 13.5%
Ward 826 5,066 533 3,645 420 10.5% 11.5%
Ward 827 7,840 829 5,720 698 10.6% 12.2%
Totals 57,408 6,660 40,120 5,180 11.6% 12.9%
% Calls to Offenses
Area added July of 2012 - Data not avai lable
2011 2012
Appling Farms Station Old Wards
Calls Offenses Calls Offenses 2011 2012
Ward 821 14,806 2,015 11,230 1,418 13.6% 12.6%
Ward 822 18,770 2,314 12,722 1,780 12.3% 14.0%
Ward 823 8,325 753 6,364 600 9.0% 9.4%
Ward 824 7,406 1,152 5,439 835 15.6% 15.4%
Ward 825 15,080 1,738 10,230 1,331 11.5% 13.0%
Ward 826 9,691 1,028 7,049 863 10.6% 12.2%
Totals 74,078 9,000 53,034 6,827 12.1% 12.9%
% Calls to Offenses20122011
Appling Farms Station New Wards
22

Calls Offenses Calls Offenses 2011 2012
Ward 921 2,501 386 1,692 263 15.4% 15.5%
Ward 922 9,722 837 6,799 727 8.6% 10.7%
Ward 923 33,662 4,111 23,385 3,239 12.2% 13.9%
Ward 924 18,139 1,722 12,912 1,363 9.5% 10.6%
Totals 64,024 7,056 44,788 5,592 11.0% 12.5%
% Calls to Offenses
Ridgeway Station Old Wards
2011 2012
Calls Offenses Calls Offenses 2011 2012
Ward 921 10,223 1,536 7,122 1,180 15.0% 16.6%
Ward 922 13,701 1,592 8,803 1,116 11.6% 12.7%
Ward 923 13,435 1,346 9,323 1,162 10.0% 12.5%
Ward 924 23,039 2,559 15,777 2,082 11.1% 13.2%
Ward 925 20,789 2,476 15,580 1,869 11.9% 12.0%
Ward 926 6,692 1,066 5,612 737 15.9% 13.1%
Totals 87,879 10,575 62,217 8,146 12.0% 13.1%
% Calls to Offenses20122011
Ridgeway Station New Wards
23