menu labeling as a potential strategy for combating tbe...
TRANSCRIPT
RESEARCH AND PRACTICE
Menu Labeling as a Potential Strategy for Combatingtbe Obesity Epidemic: A Healtb Impact Assessment
Tony Kuo. MD, MSHS. Christopher J, Jarosz. PhD, MSCS, Paul Simon, MD, MPH, and Jonathan £. Fielding, MD, MPH
During the past several decades, ina'easeticonsumption of calorie-dense foods outside thebome,'^' "suporsizinji" of Í'O(KÍ and bcvert^poitions at large chain restaurants, ' ' and anunderestimation of caloric content by restaurantpations'" have œntiibuted to tbe intiease iji theprevalence of ohcsity in tlic United States. Notsuiprisingly, during tliLs same time period, obe-sity-relatcd bealth conditions,'"" indudingdiabetes, hyperti nsion. fatty liver, sleep apnea,ailhntis, iinci depression, and restaurant expen-ditures ($400 billion annually by consumers")bave paralleled tbe trajectoiy of tbe obesityepidemic, lliest' tactors and othere have madethe faflure to disclose nutrition content at thepoint of purdiase a growing and significantpublic healtb concern. Whereas tlie NutiitionLabeling and FxJucation Act of 1990 increasetlthe availability of nutiition infomiation on pack-agixl foods, prejïaietl foods at the [Mint of pur-diase are exempt from such disdosures. Atpresent most last-food and sit-dowi chain res-tauiTints typically disclose nuüitiori infomiationonly upon request via the Internet or in amanner not readily visible to individuals pladngIhcir food orders on siu- (e.g., small-print tableinserts, table tents, or brochures)"
Laws mandating the provision of calorieinformation at tlie point of purchase ¡n largediain restaurants have garnered giowing pub-lic and legislative support as a pi>tential sU-ategyfor addressing the obesify epidemic.'" ' Tliisinterest is reflected in the i-ecent pas.sagt! ofmenu-labeling ordinanas in some jurisdictions,indudii^ New York Cify. New York; San Fran-dsco. California; Multiiomah Counfy, Oregon:and King County. Washington, In California,Senate Bill (SB) 1420," introduced and passed in2008. has received considerable national atten-tion as it awaits implementation. When imple-mented, SB 1420 would requii-e all restaiu-aiitdiaitis across tlie state with 20 or more fadlitiesto post calorie inlonnation nrxt to eadi itemon their menus and menu boaixls, /\n eailicrversion of tbe bill induded restaurant chains witb
Objectives. We conducted a health impact assessment to quantify the poten-tial impact of a state menu-labeling law on population weight gain in LosAngeles County, California.
Methods. We utilized published and unpublished data to model consumerresponse to point-of-purchase calorie postings at large chain restaurants in LosAngeles County. We conducted sensitivity analyses to account for uncertainty inconsumer response and in the total annual revenue, market share, and averagemeal price of large chain restaurants in the county.
Results. Assuming that 10% of the restaurant patrons would order reduced-calorie meals in response to calorie postings, resulting in an average reductionof 100 calories per meal, we estimated that menu labeling would avert 40.6% ofthe 6.75 million pound average annual weight gain in the county populationaged 5 years and older. Substantially larger impacts would be realized if higherpercentages of patrons ordered reduced-calorie meals or if average per-mealcalorie reductions increased.
Conclusions. Our findings suggest that mandated menu labeling could have asizable salutary impact on the obesity epidemic, even witb only modest changesin consumer behavior. {Am J Pubiic Health. 2009:99:1680-1686. doi:10,2105/AJPH,2008.153023}
15 or more fadlities in the state, and required.in addition to tlie calorie information, tbe provi-sion of infonnation on satui-ated fat, sugaj-, andsodium content on menus (but not on menuboards).
Despite this increased interest and legislativeaction, no published studies have sought toquantify tlic potential impact of menu labelingon the obesity epidemic. To address tliis gap.we conducted a liealth impad assessment ofmenu labeling, as specified in (lie original ver-sion of SB 1420, on population weight gain inLos Angeles County. Los Angeles County is thelai'gest county in the United States, home tomore than 10 million residents.
METHODS
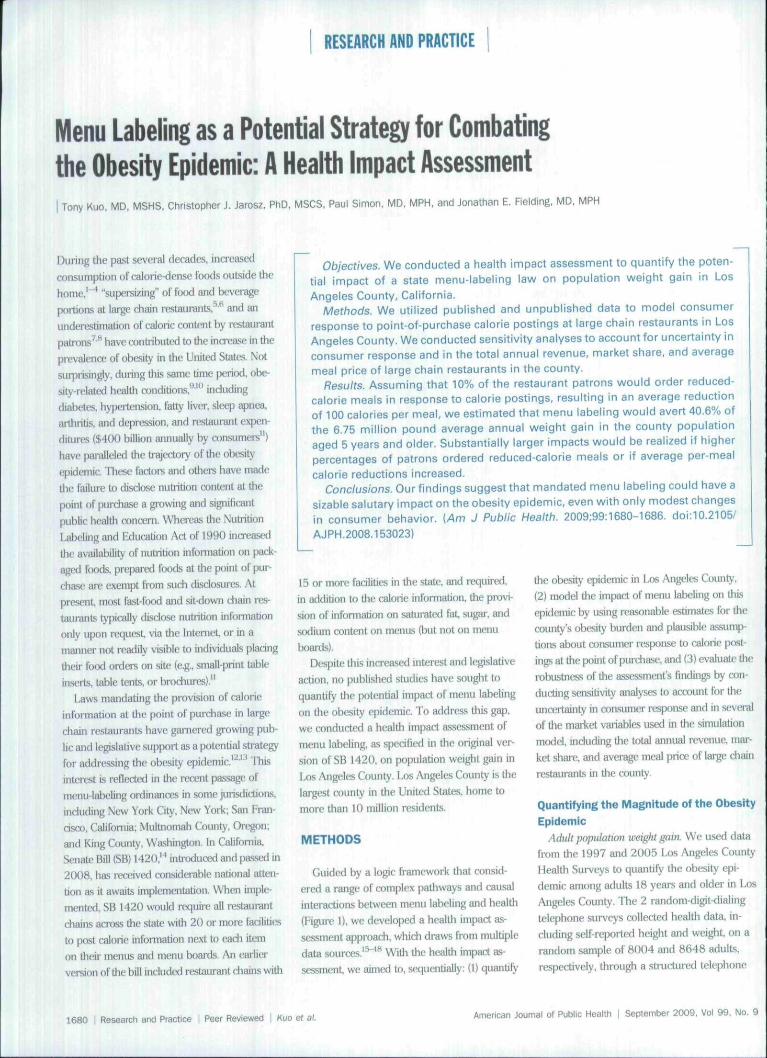
Guided by a logic framework that consid-erixi H range of complex pathways and causalinteractions between menu labeling and health(Fi^ire 1), we developed a bealth impact as-sessment approach, which draws from multipledata sources.' ""* Wilh the healtb impact as-sessment, we aimed to, sequentially; (1) quantiiy
the obesify epidemic in l-os Angeles Counfy,(2) model the impatl of menu labeling on thisepidemic by using reasonable estimates for thecounfy's obt-sity burden and plausible assump-tions about a)nsumer response to calorie post-ings at (he point of purchase, and (3) evaluate Unrobustness of the assessment's findings by œn-ducting sensitivify analyses to account for tbeuncertainty in consumer rtsponse and in severalof the market variables used in the simulationmoilcl, induding tbe total annual revenue, maj-ket share, and average meal priœ of large chainrestaurants in the counfy.
Quantifying the Magnitude of the Obesity
Epidemic
.Adult population weight gain. We used datafrom tbe 1997 and 2005 Los Angeles CounfyHealtb Surveys to quantiiy tbe obesity epi-demic among adults 18 years and older in LONAngeles Counfy. Tbe 2 random-digit-dialingtelephone surveys collected health data, in-cluding self-reported height and weiglil. on arandom sample of 8004 and 8648 adults,respectively, through a structured telqihone
1680 1 Researcti and Practice | Peer Reviewed | Kuo et al. American Joumai of Public Health | September 2009. Vol 99, No. 9
RESEARCH AND PRACTICE
Policy. Government Regulationand Ini t t tut l iMul CompKanca
Enacting lav« rcguinng calonepoîting on msnus and menu
boards at the point ot purchase
Labeling nf othei nulrilioniilconlent on menus
Food prlctng (e,g.. priclngiocentlvei of price reduction
!•( healthful foods)
Health Promotion
Pulí He fduc.ition aboiJl inler-n'eting menu labels
Predisposing Factors
Consuriier perception ofmenu labeling
Beliels about well-beingle.g., food cQSti, food
choices, physical activity,emotions)
Baseline eatmg pattemand physical activity level
Pood taste ard freshnüss
Current weight
Sociodemogrephic andeconomic fact orí
Sotia! Environment
Family and friends oideilow-cdiorie meals at
restaurants
Family and friends enerclseor are physically active
Presence of direct foodadvertising to children
Physical Environment
Placement oí nutritional informationin restaurants [e.g., upon request.
brochur^s,orviathe Intejriet versuscalorie infotmation at the point of
purchaw)
Ares of residence and neighborhoodcharactei'isties le.g., safely)
Density and proximity of fast food andsit-ttown restaurants to horres,
Mhools, and work places
Access la grocery stores or lo healthfulfoods such as fresh fruits j n d vegetables
Access to partis and other resourres forphysical activity
Availability ol work place welinessprograms
Behaviors and individua iRcipcinte
Read menu labels
Older low-caioriefoods
Changes in frequencyof «hits to fast food
and 1 it-downrestaurants
Compensatory caioricintake iater during
the day
Metabolic rate
Targeted HealthCondhioni
Child obesity
Aduit obesity
Marliet Conditions
Percent market share
Tota i restaurant revenue
Aveiage meal price
Public H M l t h Out<ome
Popuiatlon weight gamsvei ten
Other HesHh Benefits
Reversal of tfie obesityrate
fleduced risk (or chronicdiseases. Including
diabetes, hypertension.high chotesterol,
fatty liver, sleep apnsa,orthopedic problems,
and depression
FIGURE 1-Logic framework for the health impact assessment of menu labeling.
interview. The response rates were 52'Vb and47"/ti, respectively. The survey team weightedthe data to reflect the demographic chaiacter-istics of the œunty's adult population by usingcensus-based population estimates. Methodsof data coUection for the Los Angeles County1 lealth Surveys have been described else-where.''-*
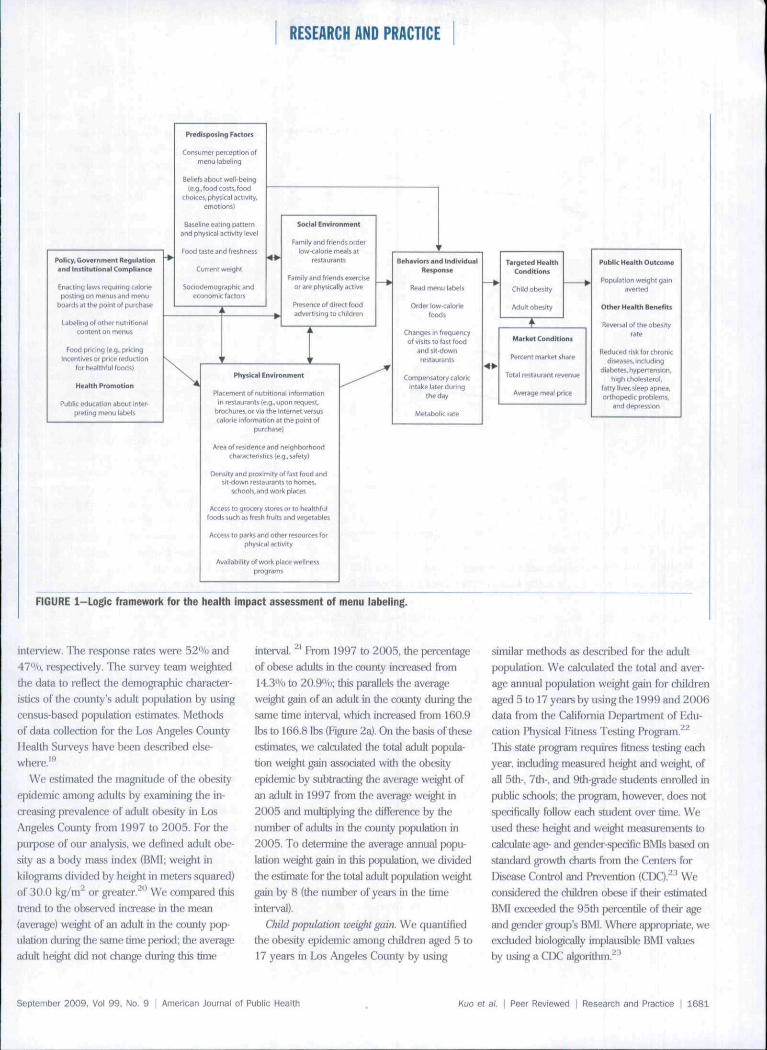
We estimated the magnitude of the obesityepidemic among adults hy examining the in-creasing prevalence of adult obesity in Los.•\ngeles County fi-om 1997 to 2005. For thepurpose of our anaJysis. we defined adult obe-sity as a body mass index (BMl; weight inkilograms divided by height in iTietei"s squared)of 30.U kg/ni~ or greater. '* We companid thisti"end to the olïicrved intxease in the moaji(average) weight of an adiili in the county pop-ulation (luring the siune Lime ptíHtxi; the averageadult height did not change during this time
interval. ^ From 1997 to 2005, the percentageof olxise adults in the county increased from14.3'yi) to 20.9"/t); this pai-allels the averageweight gain of an adult in the county during thesame time interval. wliicJi increased from 160.9lbs to 166.8 lhs (Figure 2a). On the hasis of theseestimates, we calailated the totiü adult popula-tion weight gain as.s(xdated with the obesityepidemic by subtracting the average weight ofan adult in 1997 from the average weight in2005 and multiplying the diiîerence hy thenumber of adults in the county population in2005. To determine (he avenge annual ¡x)pu-iadon weight gain in this population, we dividedtlie e stimatt: for the total adult population wei^tgain by 8 (the number of years in the timeinterval).
Child population weight gain. We quantifiedthe obesity epidemic among children aged 5 to17 years in Los Angeles County by using
similar methods as described for the adultpopulation. We calculated the total and aver-age annual population weight gain lor childrenaged 5 to 17 years by using the 1999 and 200ÍÍdata from the California Department of Edu-cation Physical Fitness Testing Program.* ^This .state program requires Htncss testing eachyear, indutling measured heigiit and weight, ofall 5th% 7th . and 9th-gi'ade students enrolled inpublic schools; tlie prognun. howevei-, does notspedficaJly follow each student over lime. Weused these height and weight measuœments tocalailate age- and gt ndcr-spedfic BMIs basai onstandai d gi'owth diarls from tJie Centers forDisease Conti'ol and Pnîvention (CIX),"'' Weconsidered the children obese if tlieii" estimatedBMl exceedtid the 95Üi peirentile of their ageand gender group's BMl. Wiiei-e apprijpnate, weexcluded biologically implausible BMI valuesby using a CDC ^'
September 2009, Vol 99. No. 9 | American Journal of Public Health et a/. 1 Peer Reviewed I Research and Practice I 1681
RESEARCH AND PRACTICE
15 -
Ptevslence of obeHty (*)
ighl lit»)
T 1 I I I ( I i 11997 1998 1999 2000 2O01 2002 2003 2004 ÏO0S
150
Year
I 15.O
Average Weight (ibsl
- 130
- 125
- 115
1999 2O00 2001 2002 2003 2004 2OÛ5 2006
Year
note. Data on sludents' weights vete not collected by the California Department of Education Physical Fitness TestingProgram in 2000; data on students' weights were rol available for 2001 and 2002.
FIGURE 2-Prevatence of obesity and average weight among (a) aduits (1997-2005) and (b)
5th-, 7th-, and 9th-graders In public schools (1999-2006): Los Angeles County, CA.
Oiu' analysis was limited to data collected onstudents who were t-nrolled in I os AngelesCounty publicschools who had complete data ibrheight, wei^t, age, an<] gender anf! wlio haiibiologically plausible BMl values. On tlie basis ofthese indusion criteria, we used data on 173 315smdenLs from the 1999 datiibase and 333649snjdent5 from tlic 2006 database to compute theestimates. We adjusted the estimates by gradelevel betrause tlie 1999 database included ahigher percentage of 5th graders (41"/o) and alower percent^e of 9tli graders (26%) com-pared with the 2(K)6 database Ofi'Voand 3VVt),respectively). This diiîcrencc reflected the tacttliat h i ^ sdiools were slower in starting thepiT>gram than were elementar ' and middlesdiools. The program wtis initiated in 1999,^^
In calculating the total population wei^t gainfor childi-en, we assumed tliat the weight gainwas similar for all school-aged children aged 5 to17 years. This assumption is supported bycounty trends in child obesity and average
student weight gain; they were similar from1999 to 2006 (Figure 2h). Likewise, tí endsacross the 3 grade levels were similar. Childrenyounger than 5 years were exckided from theanalysis because reliable population data onrecent weight gain for this age group were notavailabli!. For students enrolled in privateschools, BMI data were also not available (11- 5"' oof all school enrollments in Los Angeles Countyin 2005 were in private schools) and for stu-dents who dropped out of school (average 1-year dropout rate was 4.0% from 1999 to2006'"*"'). Collectively, these 2 groups represent arelatively small proportion of all school-eligiblechildren in Los Angeles County—i.e., less than220000 out of more than 1.7 million students.
Modeiing the impact of Menu Labeiing
on Popuiation Weight Gain
The health impact assessment utilized asimulation model* ^ to examine the potentialimpact of menu labeiing on population
gain. We induded estimates of total annualrevenue, market shai'e. and aveit^e meal pîiceof laige diain restaurants in the model to aj)-pi-oxiniatc the total number of meals servedannually in Los Angeles County. We usedpublished and unpublished data to extriqiolatethe percentage of restaui"ant patrons who wouldorder rcduced-caltirie misais, and the averageper-meal calorie reduction as a result of menulabelitig. * ' ' We ased tlitise enmate« to calcu-late the annual populationwide reduction incaloric ijitake attributable to menu labeling. Toœnvcri the reduced caloric intake to poitndsof wci^it gain averted, we used a conveiîionfactor of 3500 calories per pound,^^ We calcu-lated the key outconit' mf!asui-e—the percentagi>of ¡.xipulation weight gain aveiied because ofmenu labeling—by dividing the pounds of wei^lgain averted by the average annual populationweigjit gain.
Tlie simulation model considered the fol-lowing consumer response scénario (base case) :that I O"/o of the restaurant patrons would orderreduced-calorie meals anil tliat these pad'onswould reduce their order by an average of 100calories iii response to the caloiie postings onmenus and menu boards at large chain res-taurants with 15 or more facilities in the state,lilis scenario was based on data from 2 rc-œnuy published studies examining tlie inllu-ence of point-of-pui'chase nutritional informa-tion on consumer food choices.' ''•^^ In the firetstudy, a statewide mailed survey and interven-tion. Burton et al. ' found that consumers weretyi îically unawai'e of tlie high levels of calories,iat, and sodium commonly found in restaurantfoods and that wiien they were provided nutii-tional information at Üie fwint of purchase,approximately 10% deci eased theii" selection ofhi^ier-calorie food items. In the second study.Bassctt cl ai.~' found that at Subway restaurantsin whidi aUorie information was ¡xisted at thepoint of purchase, 11,8% of the patrons reportedtliat they saw tliis infonnation and that it hadan eft'ect on their purchases; tliese intLvidualspurchased 99 fewer calories than did those whosaw the infonîiation but reported that caloricinformation bad no clfect on theii' purdiiistchoices.
We assumed in the mtxlcl tbat restaurantpati'ons who ordei-ed reduced-calorie mealswould not increase their food or beverageintake at other times during the day. This
1682 I Research and Practice I Peer Reviewed I Kuo et al. American Journal of Public Heaftfi I September 2009, Vol 99, No. 9
RESEARCH AND PRACTICE
assumption is supported by recent r ^suggesting that small decrements in caloricintake of the m^nitude used in this healthimpact assessment are not associated with acompensatory increase in caloric intake later inÜ1C day or over a period of severtJ days.^^ Wealso assumed that persons who ordered reduced-calorie meals would not alter their physicalactivity level and that the resting metabolic rateof these individuals woul(i not change signiii-cantly as a result of tlio small caloric ledudionanticipated from consumer access to calorieinfonnation on menus and menu boards at thepoint of purchase.
Sensitivity AnalysesBecause of the imcertainty in consumer
rt'sponse to calorie postings, and in several ofthe market variables used in the simulationmodel, we conducted several sensitivity analy-ses by using a range of plausible consumer-rasponse scenarios and estimates for the totalannual revenue, market share, and averagemeal price of iai ge cliain restíiurants in thecounty,"*" We examined the efFects of varyingthese scenarios and estimates on the key out-come ("population wci^it gain averted") used inihe model.
RESULTS
/\mong those 5 years and older, the averseannual population weight gain assotáatedvv ith tli(! recent obesity epidemic in the coun^was (i.TS million pounds (Table I). This esti-mate was based on an average annual popula-tion weight g ^ of 5.5 million pounds amongadults 18 years and older from 1997 to 2005,and an average annual population weight gainof 1.25 million pounds among diildren aged 5to 17 years from 1999 to 2006.
As indicated in Table 1, if menu labelingresulted in ]()'% of iarge-chain-restaurant pa-trot s ordering reduced-calorie meais with anaverage reduction oi" 100 calories per meal, atotal of 40.6% of the 6.75 million poundaverage annual weight gain in the coimty(jopulaüon 5 years and oider would be averted.
Based on varying the model assumptionsabout consumer response, substantially largerimpacts would be realized if higher percentagesof restaurant patrons ordered reduced-caloriemeals or if the magnitude of ttie average
per-meal calorie reduction was increased (Ta-ble 2). If the percentage of patrons who wouldpurchase reduced-calorie meals were ina*easedto 20"/{), for example. 81,2% of the populationweight gain would be averted over the courseof a year, even if the average per-meal caloriereduction remained unchanged at 100 calories.If the average per-meal calorie redurtion in-creased to 125 calories among the 20% ofpatrons who ordered reduced-calorie meals,tlie population wei^t gain averted would reach101.5%. indicating a:i approximate levelingand perhaps the beginning of a potential re-versal of the obesity epidemic as measured bypopulation weight gain. Further increases ineither the percentage of patrons ordering re-duced-calorie meals or in the average per-mealcalorie reduction would result in a net popu-lation weight loss (i.e., >100% populationweight gain averted}, suggesting a reversal ofthe obesity epidemic Other sensitivity ana-lyses suggest that our findings are relativelyinsensitive to such factors as variations inthe estimates for total annual revenue, mar-ket share, and average meal price of largechain restaurants in Los Angeies County(Table 3).
DISCUSSION
Findings from this health impact assessmentsuggest that mandated menu labeling at fastfowl and other iarge chain I'estaurants couldreduce population weight gain, even with onlymode.st changes in consumer behavior. In ad-dition, our simulation model suggests that theimpact on population weight gain could begreatly enhanced if communiai' education ef-forts.'' pricing incentives. *' resdicUons on ad-vertising to children,^' or other strategies""' 'were undertaken to increase tlie degree to wliichrestauimit patrons use the posted infonnationto select reduced-calorie meals. Several strategiessuch as pricing incentives or price E'eductionsfor healihlui ïooas have been shown to changeindividual purchasing patterns of targeted food.sin work site and school cafeteiia settings.' '' Otherstrategies such as community education to im-prove nutrition knowledge have also beenshown to improve diet quality in small dt^'cesand among particular age gioups, including Uieelderly,'' Collectively, these strategies could leadto a greater demand for more-healthful foods
and provide the restaui'ant industiy with asti'onger incentive.to rcibmiulate their menuswith lower-calorie foods and smaller portionsizes." Most experts agn^ed that because con-sumers make decisions about what they eat onthe basis of a number of factors, a combination oframmunity strategies and polic>' interventionswill be required to improve food choices amongdiverse population groups,' ' ^"*''
LimitationsA limitation of the present health impact
assessment is that we w(?re unable to assess theeffect of menu labeling on the obesity epidemicdirectly (i.e., its impact on the insing rate ofobesity), but ratiier, estimated the effect byusing population weight gain averted as analternative measure. Although our analysisdemonstrated that the recent trends in tlieobesity rate and the average body weight gainwere similar, we cannot be certain that tlieimpact of menu labeling would be identicalacross tbe 2 measures. For example, if obeserestaurant patrons were more likely tJian werenonobese patrons to order reduced-caloriemeals, the impact of menu labeling on theobesity rate could be greater than what wereported for the population weight gainaverted. Alternatively, if ntjnobese restaurantpatrons were more likely to order reduced-calorie meals than were obese patrons, theimpact on the obesity rate could be less thanwhat we reported.
In addition, the health impact assessmentassumed that the obesity rate will continueto increase in the lliture. Recent data releasedby the Centers for Disease Control andPrevention suggest that this may nol be thecase.'llieprevalence ofliigh IÎMI valuis amongchildren and adults showed no significantchanges betw^een 2003 to 2004 and 2005 to2006.'''* *•' Further research is needed to darifyand verily these factors and other effects ofmenu labeling on tlie obesitj' rate.
This health impact assessment was fuillierlimited by the lack of county-specific dg£a ontotal annual revenue, mai-ket share, and aver-age meal price of lai'ge chain restatii'ants; tlies<?estimates were extrapolated from national data.However, sensitivity a/ialyses conducted onthese key market variables suggest that ourfindings were relatively insensitive to variationsin these estimates. Thus, any small to modest
September 2009. Vol 99, No. 9 | American Joumal of Public Health Kuo et al. I Peer Reviewed I Research and Practice I 1683
RESEARCH AND PRACTICE
TABLE 1-Stepwises Simulation Model (Base Case) and Data Sources and Methods for Quantifying
016 Impact of Menu Labeling on Population Weight Gain: Los Angeles County, CA, 1997-2006
Variable Estimate Data Source or Method of Calculation
1. Total annual restaurant revenue, Los AngelesCounty
2. Large chain restaurant market shafe-15 or
more facilities l i California
3. tafge chain restaurant revenue. Los Angeles
County 1
4. Average price per meal in large chain
restaurants (includes fast-food and sit-down
restaurants)
5. Annual number of meals served in lai^e
cfiain restaurants, Los Angeles County
6. Annual number of meals served, ages 0-4 y
7. Annual number of meals sen/ed. ages 5 y
and older
8. Percentage of large-chain-restaurant patrons
who select reduced calorie meals as a result
ot menu labeling
9. Annual number of reduced-caloiie meals
10. Average amount of calorie reduction per
meal
U . Total annual number of reduced calories
attributable to menu labeling
12. Calories per pound of weight
13. Total annual pounds of weight loss
attributable to menu labeling
14. Average annual population weight gain,
ages 18 y and older, lbs
15. Average annual population weight gain.
ages 5-17 y, lbs
16, Average annual population weight gain,
ages 5 y and older, lbs
17, Percentage of population weight gain
averted because o( menu labeling
$W6OO0OOÜ(K
51%
$7446000000
$7,48
995454545
36500000
958954545
10%
95895455
100
9589545455
3500
2739870
5500000
1250000
6750000
40.6%
Projected restaurant sales for 2007 in California as reported by ttie National Restaurant Association.^'
County revenue estimated by multiplying the California sales estimate by 0,27. the proportion of the state's
population in Los Angeles County (data source: Caiifomia Department of Finance^^).
Extrapolated information from the NPD Group, 2005; cited in the US District Court Declaration of Thomas R.
Frieden. Commissioner ol the New York Gty Department of Health and Mental H^ene, Jjly 5. 2007.^**^"
Calculated by multiplying the estimates in variables 1 and 2.
Based on national meal price estimates in 1992.^ adjusted for inflation by using a fatíbt of 2.58% per year to
simulate compounded growth derived from the Consumer Price Index.^^
Calculated by dividing the estimate In variable 3 tjy the estimate in variable 4.
Estimate derived iwm the 2005 Los Angeles County Health Survey data.
Calculated by subtracting the estimate in variable 6 from the estimate in variable 5.
Extrapolated from data published by foirton et al.^^
Calculated by multiplying the estimates in variables 7 and 8.
Data from Bassett et a l , ' '
Calculated by multiplying the estimates in variables 9 and 10.
Calculated by dividing the estimate in variable 11 by the estimate in variable 12,
Calculated by using data from the 1997 and 2005 Los Angeles County Health Surveys.
Calculated by using data from the 1999 and 2006 Caiifomia Department of Educaron Physical Fitness Testing
Program,^^
Calculated as the sum of the estimates in variables 14 and 15.
Calculated by dividing the estimate in variable 13 by the estimate in variable 16.
error in the variable estimates are unlikely to
have led to major errors in our findings. Ad-
ditionally, reanalysis of our data suggests that
the impact of California's menu-iaheling iegis-
iadon {SB 1420) would not be diminished
significandy by changes made in the finai draft
of the bill—i.e., from requiring calorie postings
in all restaurants with 15 or more facilities to
include only restaurants with 20 or more
facilities in the state); this change in Lhe re-
quirement would only reduce the magnitude of
the impact by approximately 3%, from 40.6%
to 37.3% population weight gain averted.
Finally, there were only limited data avail-
able to us on the degree to which menu label-
ing would influence the menu item selections
or purchasing intentions of restaurant patrons.
For this reason, the health impact assessment
provided a plausible range of estimates on the
impact of menu labeling on population weight
gain, assuming varying levels of change in
consumer behavior that could be easily
achieved. For example, based on a composite oi'
calorie information from 3 fast-food restaurant
chains, changing from a double meat patty to
a single meat patty hamburger would save 244
calories, from a large to a medium order of
french fries would save 163 calories, or from a
large to medium soft drink would save 95
calories. Emerging evidence in the literature
suggests that these modest changes are feasible.
In a study of restaurant patrons, Bassett et al. '
found that among patrons of Subway restaurants.
1684 Resesrctn and Practice I Peer Reviewed I Kuo et al. American Joumai of Public Health | September 2009. Vo! 99, No. 9

RESEARCH AND PRACTICE
TABLE 2—Effects of Varying Consumer Responses to Calorie Postings at the Point of
Purchase on Population Weight Gain Averted; Los Angeles County, CA, 1997-2006
Average Amount of
Calorie ReductionPer Meai
25
50
75
100'
125
150
175
200
10%: Population
Weight GainAverted, %
10.1
20.3
30.4
40.6
50.7
60.9
71.0
81,2
Percentage of Patrons Who Would Pufchase
20%: Population
Weight GainAverted. %
20.3
40.6
60.9
81.2
101.5
121.8
142.1
162,4
30%: Population
Weight GainAverted, %
30.4
60.9
91.3
121.8
152.2
182.7
213.1
243.5
a Lower-Calorie Meal
40%: PopulationWeight Gain
Averted, %
40.6
81.2
m£mA203.3
243.5
284.1
324.7
50%: PopulationWeight Gain
Aveited, %
50.7
101.5
152.2
203.0
253.7
304.4
355.2
405.9
Note, Percentages ttiat are greater than 100% represent net population weight loss, suggesting a potential reversal of ttieobesity epidemic,^The base case in ttie simulation model.
(hose who saw calorie infomiation postedpioiniiiently were more Ukely to pinchase mealswith fewer calories (on average, 52 fewer calo-ries) than those who did not see .similar calorieinformation.
ConclusionsOur findings suggest that even with modest
clianges in consumer behavior as a response tocalorie postings at the point of purdiase. theimpact of menu labeling on population weight
TABLE 3-Effects of Varying Totai Annual Revenue, Mar1<et Share, and Average Meal Price of
Large Chain Restaurants on the Percentage of Popuiation Wel^t Gain Averted:
Los Angeles Coun^, CA, 1997-2006
Total annual restaurant revenue/ billions $
15,6
14,6"
13,6
Large chain restaurant market share,' %
56
51"
46
Average meal price at large chain restaurants,** $
8.48
7,48"
6.48
Population Weight Gain Averted. %
43.5
40.6
37,7
44.7
40.6
36,5
35.6
40.9
47.1
Note. The 3 sensitivity analyses were hased on the 10% or 100 caiories consumer response scenario (hase case) presented inthe simuiation model (Table 1)- In the analysis of each variable, the values of the other 2 variables wefe held constant t)yusing the same values from the base case."In Los Angeles County, Business volume- $14.6 billion ± $ 1 biilion."Sase case in the simulation model,^Mariiet share-51% ± 5 percentage points."Average meal price-$7.48 ±$1.00,
gain could be substantial, favoring legislativestrategies such as SB 1420 in California forcombating the obesi^ epidemic •
About the AuthorsTony Kuo Li wilh the Los Angsles County Department ofPublic Heaitli, Loa Angeles, und the David Geffen School ofMedkine, University of California, Los Angeles. Christopher
} . Jarosz is with the Los Angeles County Department ofChildren and Family Services, Lm Angeles, and the FastLos Angeles College, Montereif Park, GI. Paul Simon andJonathon E. Fielding are with lhe Las ,'{ngeles CountyDepartment of Public Health, ¿as An^le.i, and the Schoolof Public Heallh. Univttrsily of California, Los /liigefes.
Correspondence can he sent to Tony Kuo, Division ofChronic Disease and Injury Pret'cntion. Las Angeles CountyDepartment of Public Health, ,3530 mishire Blvd. 8thFloor, Los Angeles, CA 90010 (e-mail; [email protected]). Reprints can be ordered at htlp://www.afph.org byclicking the "ReprirUs/Epiints" link,
Tliis artide mas accepted December 29, 2008
ContributorsC,J. Jarosz and P, Simon conceptualized the initial dtKÍgnof the simLÜatioii model, wliich subsequcntly underwentiterative revisions. All authors contributed to Ihf linaldesign, data coiletlion. analysis, and interpretation fif thedata, and lielped <lrafl the drlide or revised il criticallyrorimportani intellertual content
AcknowledgmentsThe authors would like to thank Ü. Mike jat-kson. RachelTyrec, Amy Lightstone, and Margaret Shih for theircontributions to the artide.
Human Participant ProtectionNo protocol approval was needed for this study.
References1. Kant AK, Graubard B!. Eating out in .America,1987—2000: trends and niitritioiial correlates, Prev Med2004:38:243-249,
2. Bowman SA. Vinyard BT, Fast food ciin.sumption orUS adults: impart on energy and niitricnl Lniakcs andoverweight statu.s. J Am Qiil Nutr 2004:2:): 1 fi:i-1 fifi.
3. Nieben SJ, Siega-Riz .A.VI, P(^kin BM. Trends inenergy intake in US between 1977 and I996:similarshiftsseen across age groups, Oöe.'/fes. 2002:10:370-378.
4. St-Onge MP. Keller Kl.. Heymsfidd SB- Changes inchildhood food consumption patterns: a cause for con-cern in light of increasing body weights. AmJ C-lin Nutr.2003;78:1068-1073.
5. McCrory MA, Fuss PJ. Hays NP. Vmken ACGreenbei^ AS. Roberts SB. Overeating in AinrHca: as-sodation between restaiiranl food consumption andbody fatness in healthy adult men and women ages 19 to80. ObesRes. 1999:7:564-571.
6. Young LR, Nestie M. The contribution of exjiandingportion sizes to the US obesity epidemic. AmJ Public
2002;92:246-249
7. Backstrand J, Wootan MG. Young LR, Hurley J. FatChance. Washington, DC: Ciniter for Sdence in the PublicInterest: t997.
September 2009, Vol 99. No, 9 I American Journal of Public Heaith Kuo et al. I Peer Reviewed I Research and Practice I 1685
RESEARCH AND PRACTICE
8 Variyain JN. Gotan E New health tnformation isresliaping food choices, liœn Hes Setv loiid Hev. 2(K)2;
9, Siigamian SB. Focretcr .SB, Adkias Su. Carman ]S.HiKiker SP, Tlie Bvnomtc Cosis ofPhifsual Inathvity,Obesity, and Overweight in California .-IÍ/UÍÍ.S, Healíh Care,Workers' Compensation, and Ltxil Productivity. Sacra-mpiitoi California Dept of Hesüth Services. Cancer Pre-vention and Nutrition Setlion; 2ÜÜ5,
10 ITiorpe KE. Floreno; CS, Howartl DM. Joski P, Theimpad or obesity on rising médirai spencüng. Health Aff(Millwood). 2ÜO4;(siippl Web eKdusiv(!s),W480~VV48fi.
11. Keystone Forum on Away-From-Home Foods. Op-poTttinitiei for Preventing Wei^t Gain and Obesity.Washington, DC: Keystone Center 20()6,
12. Wootan MG. Osbom M, Availabili^ of nutritioninformation from chain restaurants in the United States,Amf Prev Med. 2(IOi>;30:266-268-
13, BejTnan M, l.avi//o-Mourey R, Obesety preventionin tlie infomiation age.. Caloric information at the point ofpurchase. 7/lAW, 2 008; 300:433-43 5-
14, CA Senate Bill 1420, Introduced by SenatorsPadilla and Migden on Februar/ 21. 2008; amended inthe Assembly on August 8 and 22.2008; amended in lheSenate on May 13. 2008, Available at; http://www,legiiifo,ca,gov. Accessed May I, 2008,
15. Health Impeui Assessment. Main ConceptsApproach. Brussels. Belgiiim: F.iiropean CentiT for HcaltliPolicy, World Health Oi^taniiation Regional Office forEurope; 1999, Gothenburg consensiÈS p^er . Availableat, bttp ; //www ,t'ii ro. wh o ,int/documffnt/PAE/
. Accessed March 25, 2008.
16, Colt; BL, Fielding JE, Heaith impact a.sses.sment: atool lo liel]) policy makers luiderslancl health beyondhealtli can: Annu Rev Public Health. 2OO7;28;393-412,
17, Evans RG. Stoddarl GL Consuming research, pro-ducing policy? Amf Public Health. 2003;93;371 -379,
1 fi. Bleich S. Cutler 0, Murray C. Adains A, Wliy is thedeveloped worid obese? Annu Rev Public Health. 2008;29:273-295,
19. Simon PA, Wold CM, Cousineau MR, Fielding JE,Meeting the data needs of a local heallii departmenl: theLos /\ngples County I lealth Survey, .^tnJ Public lleallh.2OO1;91;195O-I9S2,
20. Hill JO, Wyatt HR. Reed GW, Pelers JC, Obesity andthe environment; where do we go trom here? Science.2003;299:853-855.
21. Ccunty of Los Angeles l\iblic Health, Chronic Diseaseand Injiuv Prevention Web page. Available at; http^/
liiJaLTOinty.gov/chronic .Vcessed Januaiy 1,
22. California l>;partmenl of lùiiicstion. Physical Fit-ness Testing (PFI") program Web page. Available al;http://www,cde,ca,gov/la/tg/pf, Arresseil February I,2008,
23. Centers for Dise,asi? ConUxil and Pniventlon. Na-tional Center for Health Statistics. Growth charLs, Avail-able at; bnpy/www.cdcgov/growthcharts. AccessedI-ebniary 1,2{H)8.
24. California D(!partment of Education Web siteAvailable at; liltp;//www,al(i,co.gov. Accessed February24, 20O8,
25. Monheit AC, Canloi' JC, Banerjee P. Assessing RiticyOptinnsfar the Non-Group Heatth Insurance Market:
Simulation ofthe Impact ofMndified Community Rating inthe New Jersey Individual HealtJi Cauertigf Prtigram. NewBrunswick. NJ; Hutgent Genter for State Health I*olicy;2005,
26, Burton S. Creycr EH, Kees J, Huggins K. Attackingthe obesity epidemic; tlie potential health henetits ofproviding ntilrilion infonnation in rtstaurants, AmfPublic Health. 2006;96;1669-1675-
27, Bassett MT. Dumanovsky T, Huang C, et al. Pur-chasing behavior and calorie infonnation at fast-foodchains in New York City. 2007. Am f Public Health2008;98;I457-1459,'
28, Duyff RL, American Dietetic Association CompleteFood and Nutrition Guide. Hoboken. P<[: John Wiley andSons; 2OO2;36,
29, Levitsky DA. The non-regulation of food intake inhumans; hope for reversing the epidemic of obesity,Physid Behav. 2005;86;623-632,
JO, Jckaiiowski MD. Causes and œnsequences of fastfood sales growilv Away-From-Home Foods. 1999Jan--April:ll-16,
31. Nationa] Restaurant .\s.sodation Web site..'Available at; htt));//www,restaurant.org, Access(!dSeptember 1.2007,
32. California Department of Finance Web site. Avaü-able at; http://www,dof,ca.gav/research. AccessedJanuary !, 2008.
33. Frietien TR. Declaration to dvil complaint No, 07Civ 57 to (RJH); New York State Restairrant AssodationAgainst New York Citj' Board of Health, New York CilyDepartjnrnt of Healtli and Mental I lygiene, and ThomasR, Frieden, in His Offidal Capacity as Commissioner ofllie New York City Department of Health and MentalHygiene. July 5. 2007. .Availid)le at: http;//www,iiycgov/'html/doh/downioads/pdf/ptiblic/caioriejrRF.declanition-02-08,pdf. Accessed May 21. 2009,
34. Bureau of 1 Jibor Statistics. US Department of Labor.Consumer IVice Index, Available at; http;//www.bls,gov/cpi. Accessed June 2fi, 2009,
35. Fi-azao E, Allshoiise J, Strategies for intervention;commentai-y anddehate,//Viiir-2003;133;844S-847S,
36. Frendi SA. Pndng effects on food dioices. / Nuir.2003;133;84iS-843S,
37. Hawkes C, Repilating ktrni marketing to youngj>eople woridwidi.'; trends and policy drivers. Amj PublicHealth. 2OO7;97:I962-I97;),
38. Ogden CL. Carroll MD. Flegal l M High body massindex for age among US chitdnin and adolescents, 2003-
200B;299;240l-2405,
39, Ogden GL, Can-oil MD, McDowell MA, Hegai KM,Obesity Among Adull-i in the United States - No Staiisti-ailh/ Significant Change Since 2003-2004. Hyattsville.MD: ^fational Center for Health Statistics; 2007. NGHSditfa brief no, I,
StandardMethods for theExamination ofDairy Productsî 7th Edition
Edited by Michael Wehr. Ph.D.
and Joseph H. Frank, Ph.D.
The 17th editionofSMEDPisacompendium ofmicrobiological,chemical, andphysical method.sfor analyzing milkand dairy products.It provides vali-dated methodologyto ensure that
harmful levels of organisms and othersuhstances are absent and that tbe nutri-tive qualities, flavor, and appearance ofproducts meet established specifications.An aim of SMEDP is to provide a systemfor the uniform testing of dairy products.
ORDER TODAY!ISBN 0-87553-002-8
570 pages, hardcover, 2004$58.50 APHA Members (plus s&h)$85.00 Nonmembers (plus s&h)
American Public Heatth AssociationPUBLICATION SALES
WEB: www,aphabookstore.ûrg
E-MAIL: APHA® pi)d. com
TEL: 888-320-APHA FAX: 888-361-APHA
1686 I Research and Practice I Peer Reviewed I Muo ef al. American Joumai of Public Health | September 2009, Vol 99, No. 9

Copyright of American Journal of Public Health is the property of American Public Health Association and its
content may not be copied or emailed to multiple sites or posted to a listserv without the copyright holder's
express written permission. However, users may print, download, or email articles for individual use.