mercer capital's bank watch | january 2016 | 2015: a good year for banks
TRANSCRIPT
Bank Watch
January 2016
www.mercercapital.com
2015: A Good Year for Banks 1
Community Bank Stress Testing Webinar 4
Public Market Indicators 5
M&A Market Indicators 6
Regional Public
Bank Peer Reports 7
About Mercer Capital 8
© 2016 Mercer Capital // www.mercercapital.com 1
Bank Watch
January 2016
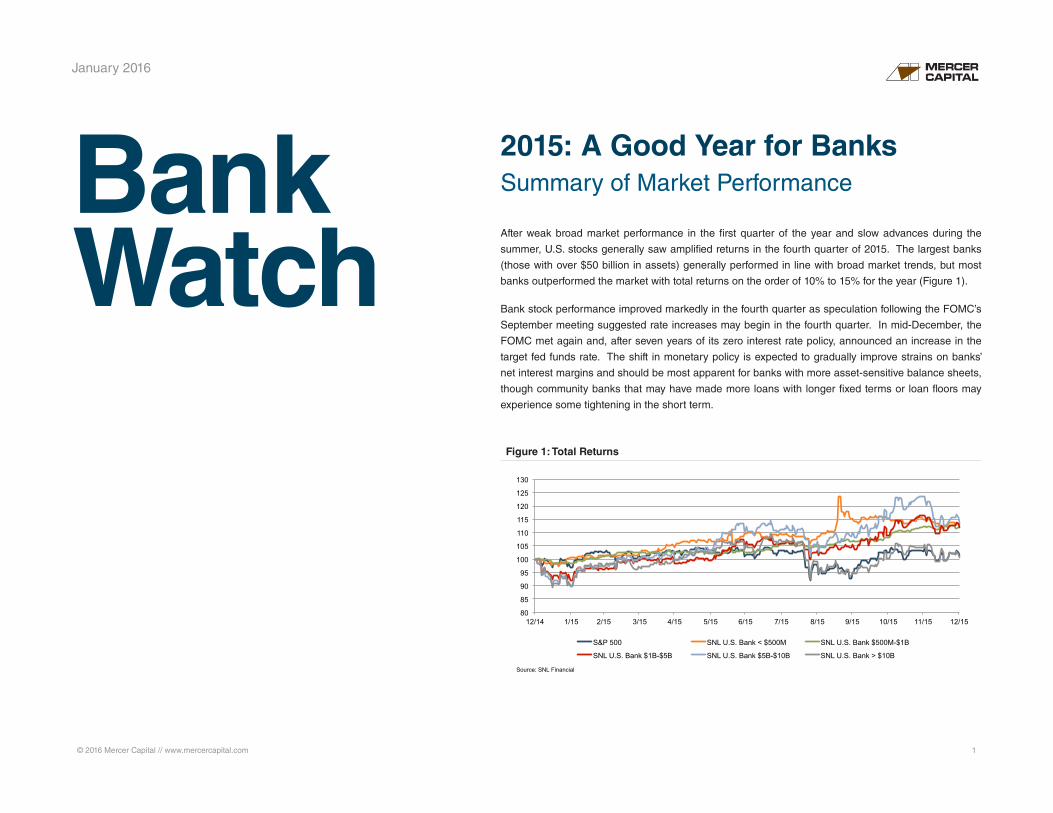
2015: A Good Year for BanksSummary of Market Performance
After weak broad market performance in the first quarter of the year and slow advances during the
summer, U.S. stocks generally saw amplified returns in the fourth quarter of 2015. The largest banks
(those with over $50 billion in assets) generally performed in line with broad market trends, but most
banks outperformed the market with total returns on the order of 10% to 15% for the year (Figure 1).
Bank stock performance improved markedly in the fourth quarter as speculation following the FOMC’s
September meeting suggested rate increases may begin in the fourth quarter. In mid-December, the
FOMC met again and, after seven years of its zero interest rate policy, announced an increase in the
target fed funds rate. The shift in monetary policy is expected to gradually improve strains on banks’
net interest margins and should be most apparent for banks with more asset-sensitive balance sheets,
though community banks that may have made more loans with longer fixed terms or loan floors may
experience some tightening in the short term.
Figure 1: Total Returns
80
85
90
95
100
105
110
115
120
125
130
12/14 1/15 2/15 3/15 4/15 5/15 6/15 7/15 8/15 9/15 10/15 11/15 12/15
S&P 500 SNL U.S. Bank < $500M SNL U.S. Bank $500M-$1B
SNL U.S. Bank $1B-$5B SNL U.S. Bank $5B-$10B SNL U.S. Bank > $10B
Source: SNL Financial

© 2016 Mercer Capital // www.mercercapital.com 2
Mercer Capital’s Bank Watch January 2016
Figure 2: Total Returns Figure 4: Total Returns & Asset Sensitivity
Figure 3: Total Returns & Loan Growth
17%
30%
22%
17%
8%
4% 2%
0%
5%
10%
15%
20%
25%
30%
35%
0
20
40
60
80
100
120
140
< 0% 0 - 10% 10 - 20% 20 - 30% 30 - 40% 40 - 50% 50% +
# of
Ban
ks
Source: SNL Financial
-
20
40
60
80
100
0%
4%
8%
12%
16%
20%
Less Than 10% 10% - 20% 20% - 30% 30% - 40% Greater Than 40%
Num
ber o
f Ban
ks
Med
ian
Tota
l Ret
urn
Loans Maturing or Repricing Within 3 Months / Total Loans
Median Total Return # of Banks Source: SNL Financial
0%
5%
10%
15%
20%
25%
Less than 0% 0% - 5% 5% - 10% 10% - 20% 20% - 30% Greater than 30%
Avg.
Tot
al R
etur
n
Loan Growth Source: SNL Financial
Bank returns generally averaged around 0% to 30% in 2015, though 17% of the U.S. banks
analyzed (traded on the NASDAQ, NYSE, or NYSE Market exchanges for the full year) realized
negative total returns. These included banks continuing to deal with high levels of NPAs; banks
that are located in oil-dependent areas such as Louisiana and Texas; and some banks that have
been active acquirers that missed Street expectations. On the other end, a few high performers
in 2015 include merger targets as well as banks that have seen more success from acquisition
activity (Figure 2).
One of the primary factors contributing to stronger returns in 2015 was loan growth. Banks with
loan growth over 10% exhibited above-average returns, while those with slower growth tended
to exhibit lower returns, with the exception of banks that shrank their portfolios during the year,
though for these banks the higher returns likely reflected prior years’ underperformance that was
priced into the stocks (Figure 3).
Asset-sensitive banks also outperformed in 2015. While asset sensitivity is difficult to evaluate
from publicly available data, we measured asset sensitivity by the proportion of loans maturing
or repricing in less than three months from September 30, 2015, relative to total loans (both
© 2016 Mercer Capital // www.mercercapital.com 3
Mercer Capital’s Bank Watch January 2016
obtained from FR Y-9C filings). Limiting the analysis to publicly traded banks with assets
between $1 billion to $5 billion reveals that the most asset sensitive banks returned about 16%
in 2015, or 400 basis points more than less asset sensitive banks (Figure 4).
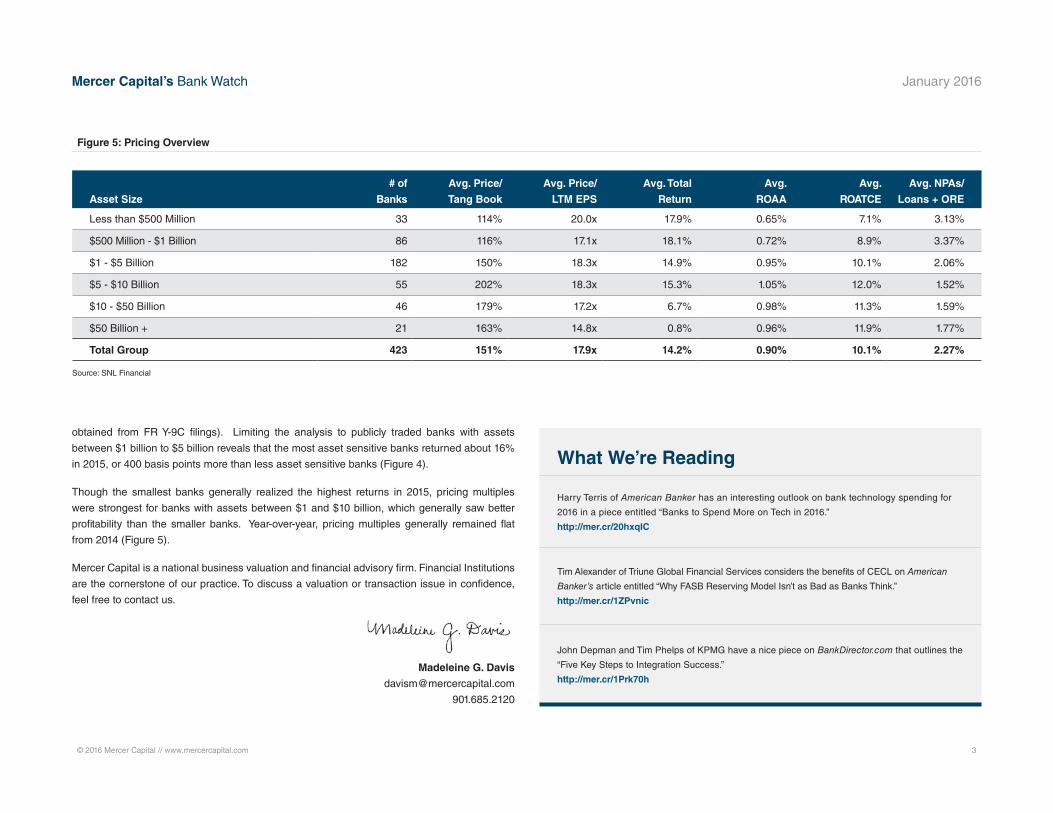
Though the smallest banks generally realized the highest returns in 2015, pricing multiples
were strongest for banks with assets between $1 and $10 billion, which generally saw better
profitability than the smaller banks. Year-over-year, pricing multiples generally remained flat
from 2014 (Figure 5).
Mercer Capital is a national business valuation and financial advisory firm. Financial Institutions
are the cornerstone of our practice. To discuss a valuation or transaction issue in confidence,
feel free to contact us.
Madeleine G. Davis
901.685.2120
Figure 5: Pricing Overview
Asset Size
# of
Banks
Avg. Price/
Tang Book
Avg. Price/
LTM EPS
Avg. Total
Return
Avg.
ROAA
Avg.
ROATCE
Avg. NPAs/
Loans + ORE
Less than $500 Million 33 114% 20.0x 17.9% 0.65% 7.1% 3.13%
$500 Million - $1 Billion 86 116% 17.1x 18.1% 0.72% 8.9% 3.37%
$1 - $5 Billion 182 150% 18.3x 14.9% 0.95% 10.1% 2.06%
$5 - $10 Billion 55 202% 18.3x 15.3% 1.05% 12.0% 1.52%
$10 - $50 Billion 46 179% 17.2x 6.7% 0.98% 11.3% 1.59%
$50 Billion + 21 163% 14.8x 0.8% 0.96% 11.9% 1.77%
Total Group 423 151% 17.9x 14.2% 0.90% 10.1% 2.27%
Source: SNL Financial
What We’re Reading
Harry Terris of American Banker has an interesting outlook on bank technology spending for
2016 in a piece entitled “Banks to Spend More on Tech in 2016.”
http://mer.cr/20hxqIC
Tim Alexander of Triune Global Financial Services considers the benefits of CECL on American
Banker’s article entitled “Why FASB Reserving Model Isn’t as Bad as Banks Think.”
http://mer.cr/1ZPvnic
John Depman and Tim Phelps of KPMG have a nice piece on BankDirector.com that outlines the
“Five Key Steps to Integration Success.”
http://mer.cr/1Prk70h

© 2016 Mercer Capital // www.mercercapital.com 4
Mercer Capital’s Bank Watch January 2016
MERCER CAPITAL Stress Testing Webinar March 1, 2016
MERCER CAPITAL ATTENDING & SPEAKING AT THE UPCOMING
Acquire or Be Acquired Conference January 31 – February 2, 2016
Mercer Capital will be attending and speaking at the upcoming 22nd annual Acquire
or Be Acquired Conference sponsored by Bank Director magazine.
The conference takes place January 31 – February 2, 2016 at the Arizona Biltmore
hotel in Phoenix, Arizona.
The Acquire or Be Acquired Conference is the financial industry’s premier bank M&A
conference for bank CEOs, senior management and board members. It brings together
key leaders from across the country to explore merger and acquisition strategies and
financial growth opportunities.
Mercer Capital is, again, one of the sponsors of the event and members of our Financial
Institutions Group, Matt Crow, Andy Gibbs, and Brooks Hamner, will be attending.
Mercer Capital will also have a booth in the exhibit hall.
On Monday, February 1st, Matt Crow and Brooks Hamner, who work with clients in
the asset management industry, will present:
Valuing a Trust & Wealth Management Franchise
For many banks, trust departments have ceased to simply be an added service
and are expected to stand on their own. Trust franchises can add value to
banks, but how much? This session will focus on what drives value in trust
franchises, and how to build trust and wealth management operations to
enhance the value of a bank.
If you will be attending the conference, let us know. Contact any of our participating
professionals. We would love to see you there!
Matt Crow | [email protected]
Andy Gibbs | [email protected]
Brooks Hamner | [email protected] Today
Complimentary Webinar
Community Bank Stress Testing:What You Need to KnowMarch 1, 2016 | 12:00pm - 1:00pm Central
Join Jay D. Wilson, CFA, ASA, CBA, on March 1, 2016, as he presents the webinar
“Community Bank Stress Testing: What You Need to Know.”
While there is no requirement for community banks to perform stress tests, recent
regulatory commentary suggests that community banks should be developing and
implementing some form of stress testing on at least an annual basis.
The benefits of stress testing include enhancing strategic decisions; improving risk
management and capital planning; and enhancing the value of the bank. However,
community bank stress testing can be a complex exercise for a bank to undertake by
itself. There are a variety of potential stress testing methods and economic scenarios
for the bank to consider when setting up their test. In addition, the qualitative, written
support for the test and its results is often as important as the quantitative results
themselves. Therefore, it is important that banks begin building their stress testing
expertise sooner rather than later.
Whether you are considering performing the test in-house or with outside assistance,
this webinar will be of interest to you. This complimentary 60-minute webinar will:
» Cover the basics of community bank stress testing
» Review the economic scenarios published by the Federal Reserve
» Provide detail on the key steps to developing a sound community bank
stress test
» Discuss how to analyze and act upon the outputs of your stress tests
1 hour of CPE Offered

© 2016 Mercer Capital // Data provided by SNL Financial 5
80 !
90 !
100 !
110 !
120 !
130 !
140 !
150 !
8/31/2
012!
9/30/2
012!
10/31
/2012!
11/30
/2012!
12/31
/2012!
1/31/2
013!
2/28/2
013!
3/31/2
013!
4/30/2
013!
5/31/2
013!
6/30/2
013!
7/31/2
013!
Augu
st 3
1, 2
012
= 10
0!
MCM Index - Community Banks! SNL Bank! S&P 500!
Median Valuation Multiples
Mercer Capital’s Bank Group Index Overview Return Stratification of U.S. Banks
by Asset Size
Assets $250 - $500
MM
Assets $500 MM -
$1 BN
Assets $1 - $5 BN
Assets $5 - $10 BN
Assets > $10 BN
Month-to-Date -1.02% -0.92% -5.00% -4.54% -5.67% Year-to-Date 24.98% 22.75% 21.26% 26.38% 21.49% Last 12 Months 32.00% 23.72% 26.18% 27.55% 36.68%
-10%
0%
10%
20%
30%
40%
As o
f Aug
ust 3
0, 2
013
Median Total Return Median Valuation Multiples as of December 31, 2015
Indices Month-to-Date Quarter-to-Date Year-to-DatePrice/
LTM EPSPrice / 2015 (E)
EPSPrice / 2016 (E)
EPSPrice /
Book ValuePrice / Tangible
Book ValueDividend
Yield
Atlantic Coast Index 0.03% 11.95% 19.08% 16.83 17.55 15.30 110.3% 121.5% 2.0%
Midwest Index -2.74% 7.41% 12.42% 15.34 14.81 12.74 120.0% 137.8% 2.1%
Northeast Index -2.64% 6.34% 8.20% 14.37 15.16 13.36 121.1% 133.8% 3.0%
Southeast Index -2.75% 5.83% 12.04% 13.80 15.30 14.94 116.7% 117.2% 2.1%
West Index -2.85% 6.70% 15.76% 16.82 17.68 14.38 115.5% 124.5% 2.5%
Community Bank Index -2.15% 7.79% 12.89% 15.45 15.63 14.15 116.7% 130.7% 2.3%
SNL Bank Index -3.43% 5.94% 1.71%
Assets $250 - $500M
Assets $500M - $1B
Assets $1 - $5B
Assets $5 - $10B Assets > $10B
Month-to-Date -0.91% 0.53% -3.82% -7.77% -3.22% Quarter-to-Date -1.01% 5.59% 6.26% 3.59% 6.03% Year-to-Date 14.41% 12.87% 11.94% 13.92% 0.83%
-10%
0%
10%
20%
As
of D
ecem
ber 3
1, 2
015
80 !
85 !
90 !
95 !
100 !
105 !
110 !
115 !
120 !
12/31
/2014!
1/31/2
015!
2/28/2
015!
3/31/2
015!
4/30/2
015!
5/31/2
015!
6/30/2
015!
7/31/2
015!
8/31/2
015!
9/30/2
015!
10/31
/2015!
11/30
/2015!
12/31
/2015!
Dec
embe
r 31,
201
4 =
100!
MCM Index - Community Banks! SNL Bank! S&P 500!
Mercer Capital’s Public Market Indicators January 2016

© 2016 Mercer Capital // Data provided by SNL Financial 6
2004 2005 2006 2007 2008 2009 2010 2011 2012 2013 2014 2015 U.S. 18.3% 19.9% 19.9% 18.7% 12.0% 6.9% 6.3% 5.4% 4.3% 5.5% 7.5% 7.5%
0%
5%
10%
15%
20%
25%
Cor
e D
epos
it P
rem
ium
s
2004 2005 2006 2007 2008 2009 2010 2011 2012 2013 2014 2015 U.S. 246% 243% 243% 228% 196% 145% 141% 132% 130% 134% 155% 148%
0%
50%
100%
150%
200%
250%
300%
350%
Pric
e / T
angi
ble
Boo
k Va
lue
2004 2005 2006 2007 2008 2009 2010 2011 2012 2013 2014 2015 U.S. 22.3 22.0 22.0 22.1 19.9 19.3 21.7 21.9 17.0 16.5 17.5 18.8
0
5
10
15
20
25
30
Pric
e / L
ast 1
2 M
onth
s E
arni
ngs
Regions
Price / LTM
Earnings
Price / Tang.
BV
Price / Core Dep Premium
No. of
Deals
Median Deal
Value
Target’s Median Assets
Target’s Median
LTM ROAE (%)
Atlantic Coast 20.16 1.56 8.6% 22 96.06 512,613 7.49%
Midwest 18.60 1.52 7.5% 67 37.01 121,420 9.07%
Northeast 22.72 1.48 9.4% 8 55.29 443,643 6.90%
Southeast 17.11 1.41 7.1% 27 33.24 162,355 8.43%
West 16.05 1.48 6.9% 14 56.25 227,002 9.68%
National Community Banks
18.75 1.48 7.5% 138 48.00 201,665 8.68%
Source: Per SNL Financial
Median Valuation Multiples for M&A Deals
Target Banks’ Assets <$5B and LTM ROE >5%, 12 months ended December 2015
Median Core Deposit Multiples
Target Banks’ Assets <$5B and LTM ROE >5%
Median Price/Tangible Book Value Multiples
Target Banks’ Assets <$5B and LTM ROE >5%
Median Price/Earnings Multiples
Target Banks’ Assets <$5B and LTM ROE >5%
Mercer Capital’s M&A Market Indicators January 2016

Updated weekly, Mercer Capital’s Regional Public Bank Peer Reports offer a closer look at the market pricing and performance of publicly traded banks in the states of five U.S. regions. Click on the map to view the reports from the representative region.
© 2016 Mercer Capital // Data provided by SNL Financial 7
Atlantic Coast Midwest Northeast
Southeast West
Mercer Capital’s Regional Public Bank Peer Reports
Mercer Capital’s Bank Watch January 2016
Mercer Capital assists banks, thrifts, and credit unions with significant corporate valuation requirements, transactional advisory services, and other strategic decisions.
Mercer Capital pairs analytical rigor with industry knowledge to deliver unique insight into issues facing banks. These insights
underpin the valuation analyses that are at the heart of Mercer Capital’s services to depository institutions.
» Bank valuation
» Financial reporting for banks
» Goodwill impairment
» Litigation support
» Stress Testing
Mercer Capital is a thought-leader among valuation firms in the banking industry. In addition to scores of articles and books, The
ESOP Handbook for Banks, Acquiring a Failed Bank, The Bank Director’s Valuation Handbook, and Valuing Financial Institutions,
Mercer Capital professionals speak at industry and educational conferences.
For more information about Mercer Capital, visit www.mercercapital.com.
Mercer CapitalFinancial Institutions Services
Jeff K. Davis, [email protected]
Andrew K. Gibbs, CFA, CPA/ABV [email protected]
Jay D. Wilson, Jr., CFA, ASA, CBA [email protected]
MERCER CAPITAL
Memphis5100 Poplar Avenue, Suite 2600Memphis, Tennessee 38137901.685.2120
Dallas12201 Merit Drive, Suite 480Dallas, Texas 75251214.468.8400
Nashville102 Woodmont Blvd., Suite 231Nashville, Tennessee 37205615.345.0350
www.mercercapital.com
Contact Us
Copyright © 2016 Mercer Capital Management, Inc. All rights reserved. It is illegal under Federal law to reproduce this publication or any portion of its contents without the publisher’s permission. Media quotations with source attribution are encouraged.
Reporters requesting additional information or editorial comment should contact Barbara Walters Price at 901.685.2120. Mercer Capital’s Industry Focus is published quarterly and does not constitute legal or financial consulting advice. It is offered as an
information service to our clients and friends. Those interested in specific guidance for legal or accounting matters should seek competent professional advice. Inquiries to discuss specific valuation matters are welcomed. To add your name to our mailing list
to receive this complimentary publication, visit our web site at www.mercercapital.com.
» Loan portfolio valuation
» Tax compliance
» Transaction advisory
» Strategic planning