mercom capital group india solar market update · location mw capacity technical bid opening date...
TRANSCRIPT

©2015 Mercom Capital Group, llc. ALL RIGHTS RESERVED. I www.mercomcapital.com I [email protected] I Page 1
Mercom Capital Group
India Solar Market Update
India Solar Quarterly Market Update – Indian Solar Market Ready for Liftoff
Aug 2015
KEY FINDINGS
� Year-to-date solar installations have reached approximately 1,400 MW
� Cumulative solar installations in India is about 4.5 GW
� Mercom is raising solar installation forecast again to 2.5 GW for 2015
� Proposed 3,000 MW of solar PV projects in Batch 2 are now being implemented by NTPC through open
competitive bidding
� Recent reverse auctions held in the states of Madhya Pradesh and Telangana resulted in record low bids
� Almost 60 percent of collected Cess funds have not been transferred to NCEF and only 43 percent of the
transferred funds have been allocated to MNRE
� In the last two years, approximately 55 percent of the NCEF fund allocation has gone to MNRE while 45
percent has been allocated to river cleaning and miscellaneous projects
� SECI is now a commercial entity and a direct competition to solar developers and manufacturers
List of Charts/Tables
India Solar Installations (MW)……………………………………………………………..……………….. 2
MNRE Year-wise Targets in MW………..…….……………………………………….………………….. 4
JNNSM Phase II Batch 2: NTPC Tenders ……………………………………………………………….. 5
JNNSM Phase II Batch 3: Phasing of Investment Estimation …………………...…………………….. 5
Solar Parks and Ultra Mega Solar Power Projects …………………………………………................... 6
State-wise and Year-wise Proposed Targets for Rooftop Solar Projects ………………..................... 8
Clean Energy Cess Fund Status……………………………………………………………….................. 9
Ministry-wise NCEF Fund Allocation in Different Years …………………………………….................. 10
Average Tariff Decline by Policy and Year (₹/kWh) …………………………………...……................. 12
Monthly Average Chinese Module Spot Prices……………………………………………..................... 12
Utility-Scale Solar Projects in India…………………………………………………………….................. 14
MPPMCL Price Bid: Winners List ……………………………………………..…………………..…..….. 15
India Solar Installations (MW) By Location …………………………………………………………..….. 16
Jharkhand State Solar Power Policy 2015 Target …………………………………………...……..….. 17
Telangana: Revised Timeline ……………………………………………………………………..…..….. 18

©2015 Mercom Capital Group, llc. ALL RIGHTS RESERVED. I www.mercomcapital.com I [email protected] I Page 2
Mercom Capital Group
India Solar Market Update
After a long wait, the solar market in India is finally taking off. Solar installations have been stuck around the gigawatt
level for the last three years. We are now seeing solar installations year-to-date (as of print date Aug 10th) reaching
approximately 1,400 MW which is already the best year for India. Mercom is forecasting installations to reach
approximately 2,500 GW in calendar year 2015.
Since our previous update, the Government of India has officially raised the National Solar Mission’s solar installation
target from 22 GW to 100 GW by 2022. The target was approved by the Cabinet and is split between large-scale
projects (60 GW) and rooftop projects (40 GW). The total investment required for achieving this target is expected to
be about ₹6,00,000 crore (~$95 billion).
Estimating cumulative installations at 5 GW by the end of 2015, 95 GW at a compound annual growth rate of 63
percent is required to reach the 100 GW goal by 2022. While 60 GW may be achievable with the right policies in
place, 40 GW of rooftop in six years is very aggressive considering cumulative rooftop installations in India are just
under 250 MW. China, which has a similar installation goal, has faced a host of issues such as grid constraints,
payment issues and delays, rigid distributed energy deployment goals have hindered growth. Even though there will
be many hiccups along the way, Mercom believes that the Indian solar market has turned the page and will be one of
the Top 5 markets in the world over the next five years.
As government steps up its solar installation goals we are also seeing government-owned entities starting to enter the
solar business, directly competing with private businesses. Solar Energy Corporation of India (SECI) was recently
converted into a commercial entity, which means SECI can now directly engage in owning solar power projects,
generating and selling power and also manufacturing solar products and materials. National Thermal Power
Corporation (NTPC) announced that it is evaluating a plan to setup solar manufacturing. The government entering
6 12
172
986 1,004
883
2,500
0
1,000
2,000
3,000
4,000
5,000
6,000
0
500
1,000
1,500
2,000
2,500
3,000
2009 2010 2011 2012 2013 2014 2015F
Cu
mu
lati
ve
In
sta
llati
on
s (M
W)
An
nu
al I
nst
alla
tio
ns
(MW
)
Source: Mercom Capital Group, llc
India Solar Installations (MW)
Annual Solar Installations
Cumulative Solar Installations
Aug 2015
Data derived from MNRE, Mercom Project Tracker & Public Sources

©2015 Mercom Capital Group, llc. ALL RIGHTS RESERVED. I www.mercomcapital.com I [email protected] I Page 3
Mercom Capital Group
India Solar Market Update
into business directly goes against Mr.Modi’s statement - “It's not the government's business to run a business.” Solar
developers, manufacturers and investors we spoke with view this as a negative development for the industry.
Another bottleneck we are seeing is in the release and allocation of funds from The National Clean Energy Fund
(NCEF) towards the solar industry. With almost $3 billion (~$18,900 crore) sitting in the NCEF fund unused. These
funds can be used to create a ‘reserve backstop fund’ against non-payments that will stimulate much needed lending
for projects.

©2015 Mercom Capital Group, llc. ALL RIGHTS RESERVED. I www.mercomcapital.com I [email protected] I Page 4
Mercom Capital Group
India Solar Market Update
MNRE: Year-wise Targets in MW to Achieve 100,000 MW by 2022
Category 2015-16 2016-17 2017-18 2018-19 2019-20 2020-21 2021-22 Total
Rooftop Solar 200 4,800 5,000 6,000 7,000 8,000 9,000 40,000
Ground Mounted
Solar Power Projects 1,800 7,200 10,000 10,000 10,000 9,500 8,500 57,000
Total 2,000 12,000 15,000 16,000 17,000 17,500 17,500 97,000*
* 3,743 MW commissioned up to 2014-15
Source: MNRE Mercom Capital Group, llc
Policy Developments:
Recent reverse auctions held in the states of Madhya Pradesh and Telangana resulted in record low bids. SkyPower
Southeast Asia’s bid of ₹5.05 (~$0.08)/kWh in Madhya Pradesh was the lowest bid. SkyPower was also the lowest
bid in an auction held in Telangana with ₹5.17 (~$0.082)/kWh. The rationale for low bids in India has been the drop in
system prices due to the time lag between the auction and project commissioning date which can be anywhere
between a year-and-a-half to over two years. Most banks we spoke with said they were not comfortable financing
projects at these tariff levels.
In terms of projects in the last quarter, which fall under Jawaharlal Nehru National Solar Mission (JNNSM) - Phase II
Batch 2, 3,000 MW of projects are now being auctioned by National Thermal Power Corporation (NTPC) through
competitive bidding, while SECI last week issued final guidelines for 2,000 MW in viability gap funding (VGF), also
under Phase II Batch 2 projects. Telangana auctioned off 2,000 MW of PV projects with winners to be announced
shortly, and Madhya Pradesh auctioned off 300 MW of projects.
JNNSM - Phase II Batch 1
Under this Batch, a total of 700 MW were scheduled to be completed by May 2015. We have confirmation that 580
MW have been commissioned so far. The remaining 120 MW [60 MW – Domestic Content Requirement (DCR) and
60 MW – Open Category] are expected to be commissioned by the end of August 2015.
JNNSM - Phase II Batch 2 State Specific Bundling Scheme (NTPC)
MNRE released the guidelines for Batch 2 in March 2015.
Now, the proposed 3,000 MW of solar PV projects in Batch 2 are being implemented by NTPC through open
competitive bidding. These projects will be developed in solar parks (large areas designated for solar projects), and
will be developed by central and state agencies on land provided by state governments or land identified and
arranged by developers in their respective states.

©2015 Mercom Capital Group, llc. ALL RIGHTS RESERVED. I www.mercomcapital.com I [email protected] I Page 5
Mercom Capital Group
India Solar Market Update
NTPC has been issuing tenders in tranches:
JNNSM Phase II Batch 2: NTPC Tenders
Location MW Capacity Technical Bid Opening Date Reverse Auction
Bhadla Phase II Solar Park, Jodhpur, Rajasthan 420 6 X 70 MW August 20, 2015 TBD
Gani-Sakunala Phase II Solar Park, Kurnool, Andhra Pradesh 500 3 X 50 MW and 1 X 350 MW August 12, 2015 TBD
Ghani Solar Park, Andhra Pradesh 500 10 X 50 MW July 31, 2015 TBD
Rajasthan 100 10 X 10 MW September 7, 2015 TBD
130 13 X 10 MW September 9, 2015 TBD
Uttar Pradesh 100 10 X 10 MW - TBD
Source: NTPC Mercom Capital Group, llc
JNNSM - Phase II Batch 3 (SECI)
SECI will be the implementing agency to set up 2,000 MW of grid-connected solar PV power projects under JNNSM
Phase II Batch 3, “State Specific VGF Scheme.” These projects will be set up in solar parks in various states. The
estimated funds required to provide VGF under this scheme is ₹2,100 crore (~$333 million) (₹1 crore/~$0.16
million/MW for the open category and ₹1.31 crore/~$0.2 million/MW for the DCR category). Out of 2,000 MW, 250
MW will be reserved under the DCR category and the remaining 1,750 MW will be in an open category. The VGF
scheme will be implemented through competitive bidding at a pre-defined tariff of ₹5.43 (~$0.086)/kWh for the first
year escalated by five paisa (~$0.0008)/kWh each year until it reaches ₹6.43 (~$0.1)/kWh, which would take 21
years, after which the tariff will remain at ₹6.43 (~$0.1)/kWh. The commissioning period is expected to be 13 months
from the date of signing Power Purchase Agreements (PPA).
JNNSM Phase II Batch 3
The Phasing of Investment Estimation
Year Amount
₹ in Crores US$ in Million
2016-17 1,000 158.7
2017-18 260 41.3
2018-19 210 33.3
2019-20 210 33.3
2020-21 210 33.3
2021-22 210 33.3
Total 2,100 333.3
Note: Dollar-rupee conversions were calculated at $1 = ₹63
Source: MNRE Mercom Capital Group,llc

©2015 Mercom Capital Group, llc. ALL RIGHTS RESERVED. I www.mercomcapital.com I [email protected] I Page 6
Mercom Capital Group
India Solar Market Update
Other announced Solar Programs -
Ultra Mega Projects in Solar Parks
The Ministry of New and Renewable Energy’s (MNRE) plan to set up 25 Solar Parks, each with a capacity of 500 MW
and above, targeting 20,000 MW of installed capacity over a span of five years beginning in FY 2014-15, is under
way. Fifteen states have so far agreed to setup 20 solar parks with a combined capacity of 12,999 MW.
Solar Parks and Ultra Mega Solar Power Projects
No. State Capacity
(MW) Name of the Solar Power Park/Developer Area of Land Identified at
1 Gujarat 700 GPCL 1407 hectares at Vav, Distt. Banaskantha
2 Andhra Pradesh
1,500 AP Solar Power Corporation, JVC of SECI, APGENCO and
NREDCAP
4517 hectares at Anantpuramu, Kadapa
Districts
3 1,000 2,068 hectares at Kurnool District
4 Uttar Pradesh 600 JV between UPNEDA and SECI formed 1,038 hectares at Jalaun, Sonbhadra,
Allahabad & Mirzapur districts
5 Meghalaya 20 Meghalaya Power Generation Corporation (MePGCL) 27 hectares at West Jaintia Hills & East
Jaintia Hills districts
6
Rajasthan
680 Rajasthan Solar Park Development Company Ltd.
(RSDCL), a subsidiary of RRECL
1,797.45 hectares at Bhadla
Phase II
7 1,000 Surya Urja Company of Rajasthan; a JVC between State Govt.
and IL & FS Energy Development Company
2,000 hectares at Bhadla
Phase III
8 1,000 Surya Urja Company of Rajasthan; a JVC between State Govt.
and IL & FS Energy Development Company
2,000 hectares at Jaisalmer
Phase I
9
Madhya Pradesh
750
JV of SECI and MPUVN
1,400 hectares at Rewa
10 750 800 & 600 hectares at Neemuch & Agar
respectively
11 Karnataka 2,000 Karnataka Solar Power Development Corporation (KSPDCL),
JVC of SECI and KREDL
Pavagada taluk Tumkur dist.
(2,429 hectares)
12 Tamil Nadu 500 To be finalized 568 hectare at Ramanathapuram district
13
Punjab
500
PEDA
6,167 acres at Patiala, 1,786 acres at
Fatehgarh Sahib, (5285 hectares)
14 500 2,311 acres at Ludhiana and
2,790 acres at Gurdaspur
15 Telangana 1000 SECI, Telangana GENCO and Telangana New & Renewable
Energy Development Corporation (TNREDC)
2,189 hectare at Gattu, Mehboob Nagar
District
16 Kerala 200 SECI
4,858 hectares at Paivalike, Meenja,
Kinanoor, Kraindalam and Ambalathara
villages of Kasargode district
17 Uttarakhand 39 To be finalized 77.853 hectares at Almora district
18 Arunachal
Pradesh 100 Arunachal Pradesh Energy Development Agency (APEDA)
2,700 acres of waste land Digaru Paya
region in Sonpura circle of Lohit district
19 Nagaland 60 Directorate of New & Renewable Energy, Nagaland Dimapur, Kohima and New Peren
districts
20 A&N Islands 100 To be finalized South Andaman
TOTAL 12,999 20 Solar Parks in 15 States
Source: MNRE Mercom Capital Group, llc

©2015 Mercom Capital Group, llc. ALL RIGHTS RESERVED. I www.mercomcapital.com I [email protected] I Page 7
Mercom Capital Group
India Solar Market Update
JNNSM - Phase II Batch 5 (CPSUs)
Batch 5 (there is no Batch 4) calls for the establishment of grid-connected solar PV power projects by the Central
Public Sector Undertakings (CPSUs) and Government of India organizations’ self-use or third-party sale or merchant
sale, with VGF over a span of three years from FY 2014-15 to 2016-17. DCR will be mandatory for Batch 5 projects.
NTPC alone has a target of developing 10,000 MW of solar projects. NTPC is already developing 250 MW of solar
projects under this scheme in Andhra Pradesh and has invited tenders for 260 MW of solar projects in Rajasthan with
bid pricing to be announced in August 2015. NTPC also invited tenders for 250 MW of solar projects in Madhya
Pradesh. The National Hydro Electric Power Corporation (NHPC) has invited tenders to develop 50 MW; the last date
for submission of techno-commercial bids was August 10, 2015. Our sources confirm that tenders have been
announced for 683 MW of solar projects by various CPSUs including NTPC, NHPC and shipyards.
Solar Projects by Defence Sector
Under this plan, more than 300 MW of grid-connected and off-grid solar PV power projects are proposed to be set up
by defense establishments under the Ministry of Defence with VGF over the next five years, 2014-2019. It will be
mandatory that all PV cells and modules used in solar projects set up under this program be made in India. According
to our sources, the Ordinance Factory Board under the Ministry of Defence has proposed tenders for 150 MW of
solar projects and the office of the Engineer-in-Chief for another 281 MW. The Defence Research and Development
Organization (DRDO) and Bharat Electronics Limited (BEL) are also expected to develop projects.
Grid Connected Solar PV Power Plants on Canal Banks and Canal Tops
MNRE launched a program for the development of 100 MW of grid-connected solar PV power projects on canal
banks and canal tops at an estimated cost of ₹975 crore (~$155 million) with Central Financial Assistance (CFA) of
₹228 crore (~$36 million). About 69 MW of projects under this program are under development in eight different
states.

©2015 Mercom Capital Group, llc. ALL RIGHTS RESERVED. I www.mercomcapital.com I [email protected] I Page 8
Mercom Capital Group
India Solar Market Update
State-wise and Year-wise Proposed Targets for 40 GW Grid Connected Rooftop Solar Projects
States 2015-16 2016-17 2017-18 2018-19 2019-20 2020-21 2021-22 Total (MW)
Andhra Pradesh 10 240 250 300 350 400 450 2,000
Bihar 5 120 125 150 175 200 225 1,000
Chhattisgarh 4 84 88 104 120 140 160 700
Delhi 5 132 138 165 190 220 250 1,100
Gujarat 15 385 400 480 560 640 720 3,200
Haryana 5 200 200 235 280 320 360 1,600
Himachal Pradesh 2 38 40 48 56 64 72 320
Jammu & Kashmir 2 54 55 74 80 90 95 450
Jharkhand 4 96 100 120 140 160 180 800
Karnataka 10 275 290 344 403 460 518 2,300
Kerala 4 96 100 120 140 160 180 800
Madhya Pradesh 10 265 275 330 385 440 495 2,200
Maharashtra 20 565 588 704 823 940 1,060 4,700
Orissa 5 120 125 150 175 200 225 1,000
Punjab 10 240 250 300 350 400 450 2,000
Rajasthan 10 275 288 344 403 460 520 2,300
Tamil Nadu 15 420 438 524 613 700 790 3,500
Telangana 10 240 250 300 350 400 450 2,000
Uttarakhand 2 42 44 52 60 70 80 350
Uttar Pradesh 20 510 538 650 752 860 970 4,300
West Bengal 10 252 263 315 370 420 470 2,100
Arunachal Pradesh 2 5 5 8 10 10 10 50
Assam 4 30 30 38 42 50 56 250
Manipur 4 3 6 8 9 10 10 50
Meghalaya 1 6 6 8 9 10 10 50
Mizoram 1 6 6 8 9 10 10 50
Nagaland 1 6 6 8 9 10 10 50
Sikkim 1 6 6 8 9 10 10 50
Tripura 1 6 6 8 9 10 10 50
Chandigarh 1 12 12 14 18 20 23 100
Goa 1 20 20 22 23 30 34 150
Dadra & Nagar Haveli 1 24 25 30 35 40 45 200
Daman & Diu 1 12 12 14 18 20 23 100
Puducherry 1 12 12 14 18 20 23 100
Andaman & Nicobar 1 2 2 2 5 4 4 20
Lakshadweep 1 1 1 1 2 2 2 10
Total (MW) 200 4,800 5,000 6,000 7,000 8,000 9,000 40,000
Source: MNRE Mercom Capital Group, llc

©2015 Mercom Capital Group, llc. ALL RIGHTS RESERVED. I www.mercomcapital.com I [email protected] I Page 9
Mercom Capital Group
India Solar Market Update
Other Updates:
National Clean Energy Fund (NCEF): Most of the funds are not allocated to clean energy projects
The National Clean Energy Fund was created in 2010, after JNNSM, to fund up to 40 percent of the cost for research
and innovative projects in clean energy technologies by public or private sector entities. The funding is in the form of
a loan or as viability gap funding, as seen fit by the Inter-Ministerial Group (IMG). Clean Energy Cess (a form of
carbon tax) is being levied on coal produced in India, as well as on imported coal. The Cess, which was ₹50 (~$0.8)
per ton when it was introduced in 2010, was raised to ₹100 (~$1.6) per ton in 2014 and to ₹200 (~$3.2) in the 2015-
16 budget. The Cess collected is then required to be transferred to NCEF and to appropriate government agencies.
Starting with the 2014-15 budget, the new administration has expanded the scope of NCEF to fund its clean river
‘Namami Gange’ project. While this type of budget maneuvering is common when governments have to find funds to
finance their pet projects, in this case it is taking away from very important clean energy allocation. In the last two
years, approximately 55 percent of the NCEF fund allocation has gone to MNRE while 45 percent has been allocated
to river cleaning and miscellaneous projects.
Clean Energy Cess Fund Status
Year Clean Energy Cess
Collected
Amount
Transferred to NCEF
% of Cess
Collected
NCEF Fund
Allocation to MNRE
% Diff - Funds
Collected vs. Spent
₹ in Crore US$ in
Million ₹ in Crore
US$ in
Million % ₹ in Crore
US$ in
Million %
2010-11 1,066.46 169.28 0.00 0.00 - 0.00 0.00 -
2011-12 2,579.55 409.45 1,066.46 169.28 41% 160.80 25.52 6%
2012-13 3,053.19 484.63 1,500.00 238.10 49% 125.78 19.97 4%
2013-14 3,471.98 551.11 1,650.00 261.90 48% 1,218.78 193.46 35%
2014-15 8,916.46 1415.31 4,700.00 746.03 53% 1978.00 (RE) 313.97 22%
2015-16 (BE) 13,118.04 2082.23 4,700.00 746.03 36% 2,500.00 396.83 19%
Total 32,205.68 5112.01 13,616.46 2161.34 42% 5,983.36 949.74 19%
Note: Dollar-Rupee conversions were calculated at $1 = ₹63
Source: PIB, MNRE, Ministry of Finance Mercom Capital Group, llc
Looking at the latest available data, it is clear that the majority of the funds collected through the Cess is not reaching
MNRE and consequently clean energy projects. Almost 60 percent of collected Cess funds have not been transferred
to NCEF and only 43 percent of the transferred funds have been allocated to MNRE. Total funds allocated to MNRE
to date is just 19 percent of funds collected. One of the challenges to achieve the government’s new 100 GW solar
installation goal is funding, and if the government is serious about reaching that goal, it has to work to remove
bureaucratic hurdles and bottlenecks to provide confidence to the markets. Offtaker credibility and payments to
developers on time is one of the most common and primary risks quoted by banks. With almost $3 billion (~$18,900
crore)) sitting in the NCEF funds, the government can use these funds to create a ‘reserve backstop fund’ against
non-payments that will stimulate much needed capital for projects. Collecting taxes towards clean energy projects
and not using it is detrimental to the industry.

©2015 Mercom Capital Group, llc. ALL RIGHTS RESERVED. I www.mercomcapital.com I [email protected] I Page 10
Mercom Capital Group
India Solar Market Update
Ministry-wise NCEF Fund Allocation in Different Years
Ministry/
Year MNRE
Ministry of Water
Resources, River
Development &
Ganga Rejuvenation
Ministry of Drinking
Water & Sanitation
Ministry of Environment
& Forests Total
₹ in Crore US$ in
Million ₹ in Crore
US$ in
Million ₹ in Crore
US$ in
Million ₹ in Crore
US$ in
Million ₹ in Crore
US$ in
Million
2010-11 0.00 0.00 0.00 0.00 0.00 0.00 0.00 0.00 0.00 0.00
2011-12 160.80 25.52 0.00 0.00 0.00 0.00 59.95 9.52 220.75 35.04
2012-13 125.78 19.97 0.00 0.00 110.65 17.56 10.00 1.59 246.43 39.12
2013-14 1,218.78 193.46 0.00 0.00 0.00 0.00 0.00 0.00 1,218.78 193.46
2014-15 (RE) 1,978.00 313.97 1,500.00 238.10 110.65 17.56 0.00 0.00 3,588.65 569.63
2015-16 (BE) 2,500.00 396.83 2,100.00 333.33 0.00 0.00 110.00 17.46 4,710.00 747.62
Total 5,983.36 949.74 3,600.00 571.43 221.30 35.13 179.95 28.56 9,984.61 1584.86
Note: Dollar-Rupee conversions were calculated at $1 = ₹63
Source: PIB, MNRE, Ministry of Finance Mercom Capital Group, llc

©2015 Mercom Capital Group, llc. ALL RIGHTS RESERVED. I www.mercomcapital.com I [email protected] I Page 11
Mercom Capital Group
India Solar Market Update
Decline in Solar Tariffs:
There has been a lot of noise recently about the record low tariff bids in the Madhya Pradesh reverse auction
followed by the auction in Telangana. Looking at the tariff chart below (we have excluded VGF projects for
consistency), starting with 2010 JNNSM migration projects which started at ₹17.91 (~$0.28)/kWh all the way to 2015
projects, we see a significant drop in bids over the last five years. The JNNSM Migration Batch was not an auction,
therefore if we calculate the drop in average bids from the first auction (JNNSM Phase I, Batch 1) which had an
average tariff of ₹12.16 (~$0.19)/kWh, to the latest auction results (Telangana Phase II Group 2), we see a 53
percent drop in the average tariff through reverse auctions across various state and central policies. From 2012 to
2015 we see a lot of peaks and valleys with bid prices going up and down in an inconsistent manner due to difference
in insolation levels in various states. The drop in tariffs from the 2012 Odisha Batch 2 auction to the 2015 Telangana
Phase II Group 2 auction is 35 percent.
Though costs of PV project include more than just panels, we have inserted an average Chinese module spot price
chart as a reference point since panels makeup a significant portion of a solar project.
We should also note that most projects in India have anywhere between 12-18 months or more to commission which
gives developers 6-12 months to procure panels at a lower price (assuming prices are always dropping which has its
own risks). Looking at the spot price chart, there is a steep fall in module prices between 2011 and the end of 2012
(46 percent), but module price decline between January 2013 to July 2015 is only about 10 percent.

©2015 Mercom Capital Group, llc. ALL RIGHTS RESERVED. I www.mercomcapital.com I [email protected] I Page 12
Mercom Capital Group
India Solar Market Update
17
.91
12
.16
8.7
7
12
.54
15
.61
8.3
6 10
.37
8.3
7
8.0
1
8.7
3
6.4
9
6.8
2
7.0
7
6.7
6 8.2
2
8.4
1
7.1
4
6.4
8
8.6
7
6.1
7
8.4
5
7.3
4
6.9
5
7.0
1
6.7
3 7.7
4 9.1
8
8.4
0
5.4
1
7.5
2
7.1
7
7.1
7
7.6
3
5.7
3
5.6
9
8.0
4
0
500
1,000
1,500
2,000
2,500
0
2
4
6
8
10
12
14
16
18
20
JNN
SM
- M
igra
tio
n
JNN
SM
- P
I B
1
JNN
SM
- P
I B
2
Gu
jara
t
Ma
ha
rash
tra
Od
ish
a B
1
Gu
jara
t
Ka
rna
taka
- P
I
MP
PI
Od
ish
a B
2
AP
PI
Ch
ha
ttis
ga
rh
Ka
rna
taka
- P
II
MP
PII
Pu
nja
b P
I (C
1)
Pu
nja
b P
I (C
2)
Ra
jast
ha
n
Ta
mil
Na
du
UP
B1
AP
PII
Bih
ar
Ka
rna
taka
- P
III
Ka
rna
taka
- P
IV
Ta
mil
Na
du
Te
lan
ga
na
PI
Utt
ark
ha
nd
UP
B2
Ka
rna
taka
(Fa
rme
rs)
MP
PII
I
Pu
nja
b P
II (
C1
)
Pu
nja
b P
II (
C2
)
Pu
nja
b P
II (
C3
)
Pu
nja
b P
II (
Ro
oft
op
)
Te
lan
ga
na
PII
G1
Te
lan
ga
na
PII
G2
UP
B3
2010-
11
2011-12 2012-13 2013-14 2014-15 2015-16
Ph
ase
/Ba
tch
Siz
e (
MW
)
Ave
rag
e T
ari
ff (
₹/k
Wh
)
Average Tariff Decline by Policy and Year (₹/kWh)
PV Projects Capacity (MW) Average Tariff (₹/kWh)
Source: Mercom Capital Group, llc
Notes:
1. Gujarat - FY 2011-12 - levelized tariff is Rs.12.54/kWh for 25 yrs (Rs.15.00 for 12 yrs & Rs 5.00 for next 13 yrs)
2. Gujarat - FY 2012-13 - levelized tariff is Rs.10.37/kWh for 25 yrs (Rs.11.25 for 12 yrs & Rs 7.50 for next 13 yrs)
3. AP Phase II - The range of first-year tariff offered by the successful bidders was Rs.5.25-5.99/kWh with a 3% per annum escalation for the first 10 years, then
flat thereafter. The levelised tariff works out to Rs. 6.17/kWh.
Aug 2015
1.2
1
0.9
1
0.6
4 0.6
8
0.5
9
0.5
4
0.50
0.60
0.70
0.80
0.90
1.00
1.10
1.20
1.30
Au
g
Se
p
Oct
No
v
De
c
Jan
Fe
b
Ma
r
Ap
r
Ma
y
Jun
Jul
Au
g
Se
p
Oct
No
v
De
c
Jan
Fe
b
Ma
r
Ap
r
Ma
y
Jun
Jul
Au
g
Se
p
Oct
No
v
De
c
Jan
Fe
b
Ma
r
Ap
r
Ma
y
Jun
Jul
Au
g
Se
p
Oct
No
v
De
c
Jan
Fe
b
Ma
r
Ap
r
Ma
y
Jun
Jul
2011 2012 2013 2014 2015
Monthly Avg Chinese Module Spot Prices
Module Prices ($/W)
*Data derived from PVinsights, Energy Trend, Digitimes and other public and private sources Mercom Capital Group, llc

©2015 Mercom Capital Group, llc. ALL RIGHTS RESERVED. I www.mercomcapital.com I [email protected] I Page 13
Mercom Capital Group
India Solar Market Update
Industry Feedback
These are takeaways from our recent conversation with major developers, manufacturers and investors
Developers
• Among states, Punjab, Karnataka, Andhra Pradesh, Telangana, Madhya Pradesh and Maharashtra look
attractive.
• Longer timelines to commission, difference in solar insolation levels, and land costs all play a factor in
project development costs and associated bids; however, recent low bids in MP has bureaucrats wrongly
questioning why other state tariffs are higher which is not a good thing for the sector.
• Module pricing has stabilized.
• Borrowing rates are in the range of 12-12.5 percent.
• The best offtakers in terms of timely payments – NVVN, Gujarat, Punjab, MP and Rajasthan.
• Payments delays of 60-90 days are being experienced in UP.
• There are too many government agencies. There is no reason for government to get into the business; SECI
is trying to be a power generator and NTPC is trying to get into manufacturing.
Domestic Manufacturers
• Demand is slowly picking up but there is a lot of price pressure.
• The lowest average selling prices are currently $0.50-0.55 (~₹32-35)/W. For DCR projects it is $0.63-0.71
(~₹40-45)/W.
• Domestic manufacturers are finding it difficult to compete with Chinese manufacturers. A lot of
manufacturers are dependent on DCR projects.
• Most manufacturers are planning to expand capacity in anticipation of increased demand.
Investors
• The new low bids are too aggressive for a lot of banks.
• Most Indian banks are unwilling to lend below ₹6/kWh (~$0.095) tariff.
• Lending rates are in the range of 11-13 percent.
• Most financed projects are performing well in terms of capacity factor.
• NVVN, Gujarat, Rajasthan and MP are paying on time.
• Banks are seeing payments delays of 30 days and above in Tamil Nadu.

©2015 Mercom Capital Group, llc. ALL RIGHTS RESERVED. I www.mercomcapital.com I [email protected] I Page 14
Mercom Capital Group
India Solar Market Update
• Banks are perplexed as to why government owned entities are trying to compete with businesses and see a
conflict of interest.
State Policy Updates:
Uttar Pradesh
Uttar Pradesh signed PPAs for 110 MW of solar PV projects in Dec 2013. About 40 MW have been commissioned to
date and another 50 MW is expected to be commissioned by the end of 2015, while the remaining 20 MW is
expected to be complete in the first half of 2016.
A Request for Proposal (RfP) to set up 300 MW of solar PV projects through a reverse auction was announced in
August 2014. PPAs were signed for 105 MW of projects and we are expecting the official list of successful bidders to
be announced soon.
Another RfP to set up 215 MW of solar PV projects was announced in June this year. The letter of intent (LoI) is
expected to be announced by the end of August 2015.
Utility-Scale Solar Projects in India
Operational and Under Development
Aug 2015
Capacity (MW)
In-Operation
Solar PV 4,349
Solar Thermal 209
Total 4,558
Under Development
Solar PV 7,505
Solar Thermal 280
Total 7,785
Source: Mercom Capital Group, llc
Andhra Pradesh
Andhra Pradesh had allowed any company to establish a solar project in the state at a fixed tariff of ₹6.49
(~$0.1)/kWh at the end of 2013. There are 140 MW of projects being developed under this scheme. Of these, about
45 MW have been commissioned and the rest are expected to be commissioned by the end of this year.
Andhra Pradesh DISCOMs have signed PPAs for developing 619 MW of solar projects with first year tariffs of ₹5.25
(~$0.08)/kWh with a three percent annual escalation for 10 years. These projects are expected to be commissioned
by April 2016.
©2015 Mercom Capital Group, llc. ALL RIGHTS RESERVED. I www.mercomcapital.com I [email protected] I Page 15
Mercom Capital Group
India Solar Market Update
Punjab
Phase I - Punjab signed PPAs for 251 MW of solar PV projects in December 2013 with average tariffs
ranging between ₹8.20-8.40 (~$0.130-0.133)/kWh. Of these, about 195 MW are commissioned to date and
the remaining projects are expected to be commissioned by the end of 2015.
Phase II - LoIs for 282 MW of solar projects were signed this year in three categories; 1-4 MW sizes (29
MW), 5-24 MW sizes (100 MW) and 25-50 MW sizes (100 MW). Another 53 MW of rooftop projects are
estimated to be under this Phase and are expected to be commissioned by the end of 2016.
Kerala
The Agency for Non-Conventional Energy and Rural Technology (ANERT), the renewable energy agency of Kerala,
has announced a tender for 12 MW of grid-connected rooftop solar projects this year, of which 2 MW will be on
government buildings.
Madhya Pradesh
To date, there are 235 MW of solar projects installed under Madhya Pradesh’s state policy (175 MW – RPO and 60
MW – Phase II). There are another 25 MW under RPO and 60 MW under Phase II, which are expected to be
commissioned by the end of 2015.
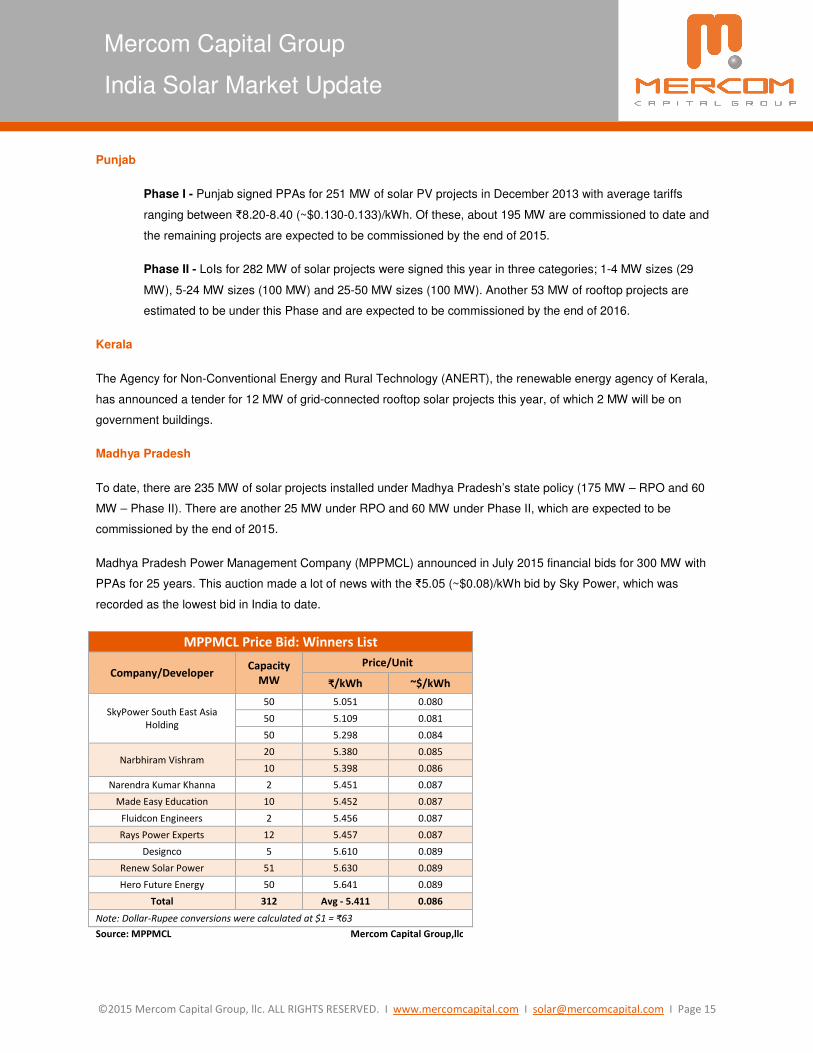
Madhya Pradesh Power Management Company (MPPMCL) announced in July 2015 financial bids for 300 MW with
PPAs for 25 years. This auction made a lot of news with the ₹5.05 (~$0.08)/kWh bid by Sky Power, which was
recorded as the lowest bid in India to date.
MPPMCL Price Bid: Winners List
Company/Developer Capacity
MW
Price/Unit
₹/kWh ~$/kWh
SkyPower South East Asia
Holding
50 5.051 0.080
50 5.109 0.081
50 5.298 0.084
Narbhiram Vishram 20 5.380 0.085
10 5.398 0.086
Narendra Kumar Khanna 2 5.451 0.087
Made Easy Education 10 5.452 0.087
Fluidcon Engineers 2 5.456 0.087
Rays Power Experts 12 5.457 0.087
Designco 5 5.610 0.089
Renew Solar Power 51 5.630 0.089
Hero Future Energy 50 5.641 0.089
Total 312 Avg - 5.411 0.086
Note: Dollar-Rupee conversions were calculated at $1 = ₹63
Source: MPPMCL Mercom Capital Group,llc

©2015 Mercom Capital Group, llc. ALL RIGHTS RESERVED. I www.mercomcapital.com I [email protected] I Page 16
Mercom Capital Group
India Solar Market Update
Haryana
A tender inviting bids for 50 MW of solar PV projects was issued by the utility Uttar Haryana Bijli Vitran Nigam
(UHBVN) in May of 2014 but only 25 MW are expected to be developed.
Haryana Power Purchase Centre, on behalf of UHBVN and Dakshin Haryana Bijli Vitran Nigam (DHBVN), invited
tenders for 150 MW of solar projects in June 2015, and the list of selected bidders is expected to be announced by
the end of August 2015.
Maharashtra
The State recently announced a renewable energy policy to develop 7,500 MW of solar power by 2020.
Chhattisgarh
Chhattisgarh State Power Distribution Company Limited (CSPDCL) announced bid results for 100 MW of solar
projects. Mercom has confirmation that only 76 MW of the 100 MW of projects will be developed. A 10 MW project
has already been commissioned and the remaining projects are expected to be commissioned by the end of 2015.
0 100 200 300 400 500 600 700 800 900 1,000 1,100 1,200 1,300
Kerala
Arunachal Pradesh
Tripura
Chandigarh
Uttarakhand
Goa & UT
West Bengal
New Delhi
Jharkhand
Chhattisgarh
Haryana
Odisha
Telangana
Uttar Pradesh
Karnataka
Tamil Nadu
Punjab
Andhra Pradesh
Maharashtra
Madhya Pradesh
Gujarat
Rajasthan
India Solar Installations (MW) By Location (Aug 2015)
Source: Mercom Capital Group, llc
Total Solar Installations
4,558 MW

©2015 Mercom Capital Group, llc. ALL RIGHTS RESERVED. I www.mercomcapital.com I [email protected] I Page 17
Mercom Capital Group
India Solar Market Update
Karnataka
The State has 93 MW of solar projects installed to date, including 40 MW commissioned under Batch 1 (Batch 1
called for 60 MW). A 10 MW CSP project under Batch I is expected to be commissioned by the end of 2016.
Of the 130 MW of solar projects announced in February 2014 under Batch 2, 33 MW have already been
commissioned and 10 MW have been cancelled. The remaining projects are expected to be commissioned by the
end of 2015.
The State also announced solar projects totaling 50 MW under Batch 3 in September 2014, of which 10 MW are
commissioned and the remainder are expected to be complete in 2016.
Karnataka Renewable Energy Development Limited (KREDL) also signed PPAs in February 2015 for 500 MW under
Batch 4, which are expected to be commissioned by the end of 2016.
The MNRE allotted 600 MW of solar energy projects to Karnataka for farmers and unemployed youth. Under this
scheme, farmers and unemployed youth would get a central subsidy of ₹50,00,000 (~$79,365)/MW. The State
recently allotted solar energy projects of 258 MW to farmers under this scheme. PPAs for the 258 MW were signed in
June-July 2015 for a tariff of ₹8.40 (~$0.13)/kWh. Another 300 MW are expected to be announced soon for allotment
to unemployed youth.
Jharkhand
Jharkhand Renewable Energy Development Agency has announced the final ‘Jharkhand State Solar Power Policy
2015’ on August 12, 2015. The objective of the policy is to encourage participation of private sector to set up solar
power based projects in the state and increase solar power generation to 2,650 MW by the year 2020 in a phased
manner. The state shall strive to achieve the objective of the policy and aim to implement the following target within a
5 year period.
Jharkhand State Solar Power Policy 2015 Target
Description Unit FY 2015-16 FY 2016-17 FY 2017-18 FY 2018-19 FY 2019-20 Total
Solar PV Projects* MW 100 250 500 500 750 2,100
Rooftop Solar Projects** MW 25 50 100 125 200 500
Solar Thermal Projects MW 5 10 10 10 15 50
Total MW 130 310 610 635 965 2,650
*The minimum size of the solar PV power project at a single location shall be 1 MW
**The minimum size of the rooftop solar PV power project at a single location shall be 1kW
Source: JREDA Mercom Capital Group, llc

©2015 Mercom Capital Group, llc. ALL RIGHTS RESERVED. I www.mercomcapital.com I [email protected] I Page 18
Mercom Capital Group
India Solar Market Update
Telangana
Telangana signed PPAs for 515 MW in February 2015 through reverse bidding. Of this, a 20 MW project has been
commissioned and the remaining projects are expected to be commissioned in the first half of 2016.
The Southern Power Distribution Company of Telangana (TSSPDCL) invited bids for 2,000 MW of solar projects on a
'Build, Own, Operate' basis in April 2015. The financial bids were opened on August 3, 2015. The bids are divided
into two groups: Group 1 (for projects injecting solar at 33/11 kv substation level) with a commissioning deadline of 12
months from PPA signing with a ceiling tariff of ₹6.45 (~$0.1)/kWh, and Group 2 (for projects injecting solar at 133/33
kv substation level) with a commissioning deadline of 15 months from PPA signing with a tariff upper limit of ₹6.32
(~$0.1)/kWh. A LoI is expected to be issued by August 13, 2015 and PPAs are expected to be signed by September
13, 2015.
Telangana: Revised Timeline
Event Schedule
Date of issue of RFS and PPA 01 April 2015
Bid Document Download Start Date 01 April 2015
Pre-bid Meeting 10 April 2015
Revision of RFS and PPA if any 09 June 2015
Bid Document download end date 10 July 2015, 15:00 Hours
Bid Deadline 10 July 2015, 17:00 Hours
Submission of hard copies of EMD and Bid Processing Fee 11 July 2015, 17:00 Hours
Opening of Prequalification Bid 14 July 2015
Opening of Technical Bids 20 July 2015
Opening of Financial Bids 03 Aug 2015
Issue of LoI to Successful Bidders 13 Aug 2015
Signing of PPA On or before 13 Sep 2015
Financial Closure (180 days from signing of PPA) 14 Mar 2016
Commissioning Schedule:
12 months from signing of PPA for Group 1 Bidders 14 Sep 2016
15 months from signing of PPA for Group 2 Bidders 14 Dec 2016
Source: TSSPDCL
Bihar
Bihar State Electricity Board (BSEB) signed PPAs in February 2015 to establish 100 MW of solar projects. The
projects have a deadline for commissioning by the second half of 2016. There is a 40 MW project that is expected to
be commissioned by the end of 2015.

©2015 Mercom Capital Group, llc. ALL RIGHTS RESERVED. I www.mercomcapital.com I [email protected] I Page 19
Mercom Capital Group
India Solar Market Update
Tamil Nadu
According to our sources, Tamil Nadu Generation and Distribution Corporation (Tangedco), the state utility, has
signed PPAs for over 2,000 MW of solar power at a tariff of ₹7.01 (~$0.11)/kWh and these projects are expected to
be commissioned by March 2016. We expect 150 MW to be commissioned by the end of 2015 and the remaining by
March 2016.
Note: Dollar-Rupee conversions were calculated at $1 = ₹63

©2015 Mercom Capital Group, llc. ALL RIGHTS RESERVED. I www.mercomcapital.com I [email protected] I Page 20
Mercom Capital Group
India Solar Market Update
About Mercom Capital Group
Mercom Capital Group, llc, is a global communications and consulting firm focused on Cleantech, Healthcare IT and
financial communications. Mercom’s consulting division advises companies on new market entry, overall strategic
decision-making, and provides custom market research. Mercom delivers highly respected industry market
intelligence reports covering Solar Energy, Wind Energy, Smart Grid and Healthcare IT. Our reports provide timely
industry happenings and ahead-of-the-curve analysis specifically for C-level decision making. Mercom’s
communications division helps companies and financial institutions build powerful relationships with media, analysts,
local communities and strategic partners. To receive Mercom’s popular market intelligence reports,
visit: http://www.mercomcapital.com.

©2015 Mercom Capital Group, llc. ALL RIGHTS RESERVED. I www.mercomcapital.com I [email protected] I Page 21
Mercom Capital Group
India Solar Market Update
Mercom Capital Group, llc
4611 Bee Caves Road, Suite 303
Austin, Texas 78746
t | +1.512.215.4452
w | www.mercomcapital.com
Mercom Communications India, Pvt. Ltd.
A subsidiary of Mercom Capital Group, llc
S-3, Harshita Arcade
No.138, First Main Road
Sheshadripuram
Bangalore-560020
t | +91.80.2356.0436
DISCLAIMER © 2015 by Mercom Capital Group, llc. All rights reserved. Strictly no redistribution allowed without prior written
permission of Mercom Capital Group. When quoting, please cite “Mercom Capital Group, llc”. Although information in
this report has been obtained from sources that we believe to be reliable, Mercom Capital Group does not guarantee
its accuracy. Published by Mercom Capital Group, llc, 4611 Bee Cave Rd, Suite 303, Austin, TX 78746 USA.
A copy of the full Terms and Conditions that you agreed to can be found at:
http://mercomcapital.com/termsandconditions.php. For information about this document, please contact us at: