mercury release from cinnabar in water and aqueous solutions … · 2017-10-24 · mercury release...
TRANSCRIPT
Mercury Release from Cinnabar in Water and Aqueous Solutions of Hydroquinone or
Ascorbic Acid
BY
KIMBERLY BOYD STALLINGS B.S., Roosevelt University, 2009
M.S., University of Illinois at Chicago, Chicago, 2013
THESIS
Submitted as partial fulfillment of the requirements for the degree of Master of Science in Earth and Environmental Sciences
in the Graduate College of the University of Illinois at Chicago, 2013
Chicago, Illinois
Defense Committee:
Kathryn L. Nagy, Chair and Advisor D’Arcy R. Meyer-Dombard, Earth and Environmental Sciences Jean E. Bogner, Earth and Environmental Sciences

ii
This thesis is dedicated to Reza, my family and friends without whose support it would never
have been accomplished.
iii
AKNOWLEDGEMENTS
The work for this thesis was supported by the Geobiology and Low-Temperature Geochemistry
Program of the U.S. National Science Foundation under grant EAR- 0952311 and the Subsurface
Biogeochemical Research Program of the Office of Biological and Environmental Research, Office of
Science, U.S. Department of Energy under grant DE-SC0001730. I would like to thank my advisor
Kathryn Nagy for professional guidance and patience during the research. Also, I would like to thank my
committee members D’Arcy Meyer-Dombard and Jean Bogner for encouraging words and thoughtful
suggestions; my lab mates Ken Kearney, Thomas Heller and Genevieve Nano for their support; and to
Gene Harris, Linnea Heraty and Abe Beloso Jr. for their technical assistance. Sulfur XANES data were
obtained at the Advanced Light Source, Lawrence Berkeley National Laboratory courtesy of Alain
Manceau. The ALS is supported by the Director, Office of Science, Office of Basic Energy Sciences,
Materials Sciences Division of the U.S. Department of Energy under Contract DE-AC02-05CH11231 at
the Lawrence Berkeley National Laboratory.
iv
TABLE OF CONTENTS
CHAPTER PAGE
I. INTRODUCTION AND BACKGROUND 1 1.1 The Mercury Problem 1 1.2 Physical and Chemical Characteristics of Mercuric Sulfides 2 1.3 Fluctuations of Redox Conditions in Natural Systems 3 1.4 Composition of Dissolved Organic Matter 3 1.5 Dissolution of Metal Oxides by Reducing Compounds 7 1.6 Dissolution of Cinnabar in the Presence of Hydroquinone 7 1.7 Natural Occurrence of Quinones and Ascorbic Acid 8 1.8 Statement of Purpose 8
II. MATERIALS AND METHODS 10 2.1 Introduction 10 2.2 Materials 10 2.3 Experimental Apparatus 12 2.4 Analytical Methods 15 2.4.1 Mercury 15 2.4.2 Sulfate 16 2.4.3 Changes in pH 17 2.5 Experiments 17 2.5.1 Cinnabar Reactivity in Water and Solutions of
Hydroquinone or Ascorbic Acid 17 2.5.2 Reactivity of Recycled Cinnabar 19 2.6 Reactivity of Cinnabar in the Presence
of Excess Sulfate or Mercury 20 2.6.1 Sulfate Spike Experiments 20 2.6.2 Mercury Spike Experiments 21
III. RESULTS 23 3.1 Introduction 23 3.2 Mercury Released from Cinnabar in Water 23 3.3 Mercury Released from Cinnabar in Hydroquinone Solutions 33 3.4 Mercury Released from Cinnabar in Ascorbic Acid Solutions 35 3.5 Sulfate Concentrations in Reactor Solutions 39 3.6 The Addition of Mercury to Water Containing Cinnabar 40
IV. DISCUSSION 48 4.1 Introduction 48 4.2 Reduction of Mercury 48 4.2.1 Anoxic Conditions 48 4.2.2 Oxic Conditions 55 4.3 Surface Reaction Mechanisms 58 4.3.1 Surface Area 58 4.3.2 Recycled Cinnabar 60
v
V. CONCLUSIONS AND FUTURE WORK 63
REFERENCES 66 APPENDIX A 70 APPENDIX B 73
VITA 76
vi
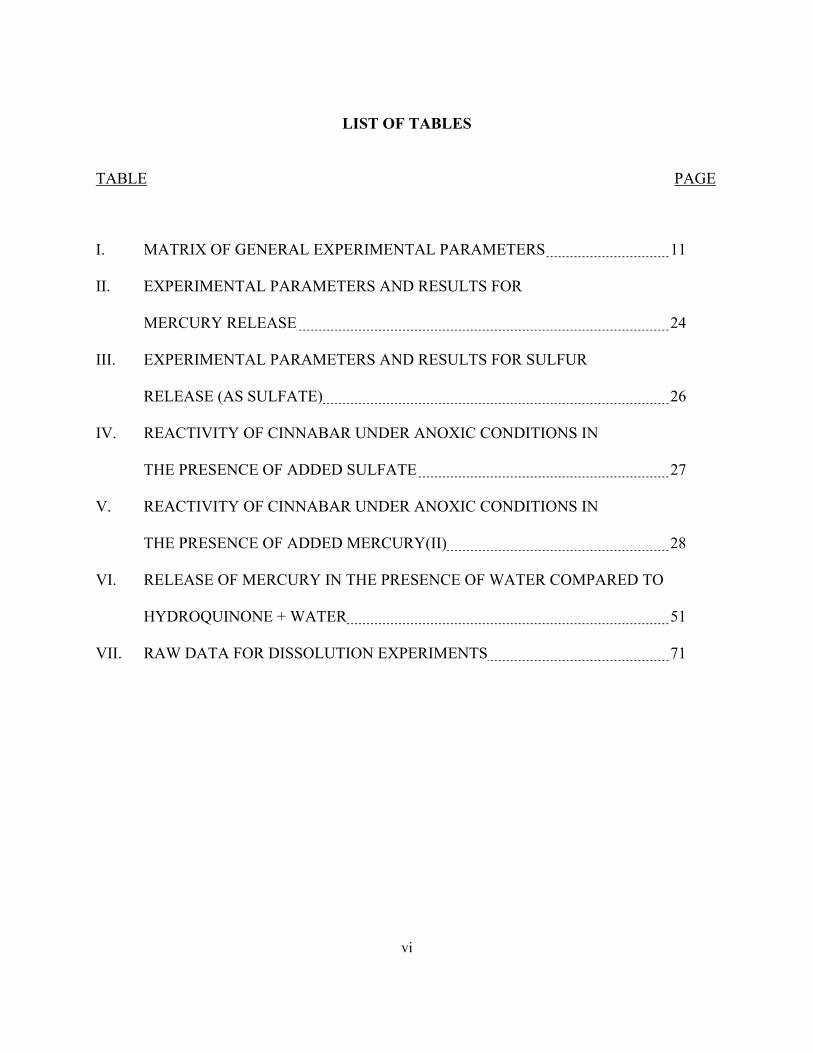
LIST OF TABLES
TABLE PAGE
I. MATRIX OF GENERAL EXPERIMENTAL PARAMETERS 11
II. EXPERIMENTAL PARAMETERS AND RESULTS FOR
MERCURY RELEASE 24
III. EXPERIMENTAL PARAMETERS AND RESULTS FOR SULFUR
RELEASE (AS SULFATE) 26
IV. REACTIVITY OF CINNABAR UNDER ANOXIC CONDITIONS IN
THE PRESENCE OF ADDED SULFATE 27
V. REACTIVITY OF CINNABAR UNDER ANOXIC CONDITIONS IN
THE PRESENCE OF ADDED MERCURY(II) 28
VI. RELEASE OF MERCURY IN THE PRESENCE OF WATER COMPARED TO
HYDROQUINONE + WATER 51
VII. RAW DATA FOR DISSOLUTION EXPERIMENTS 71
vii
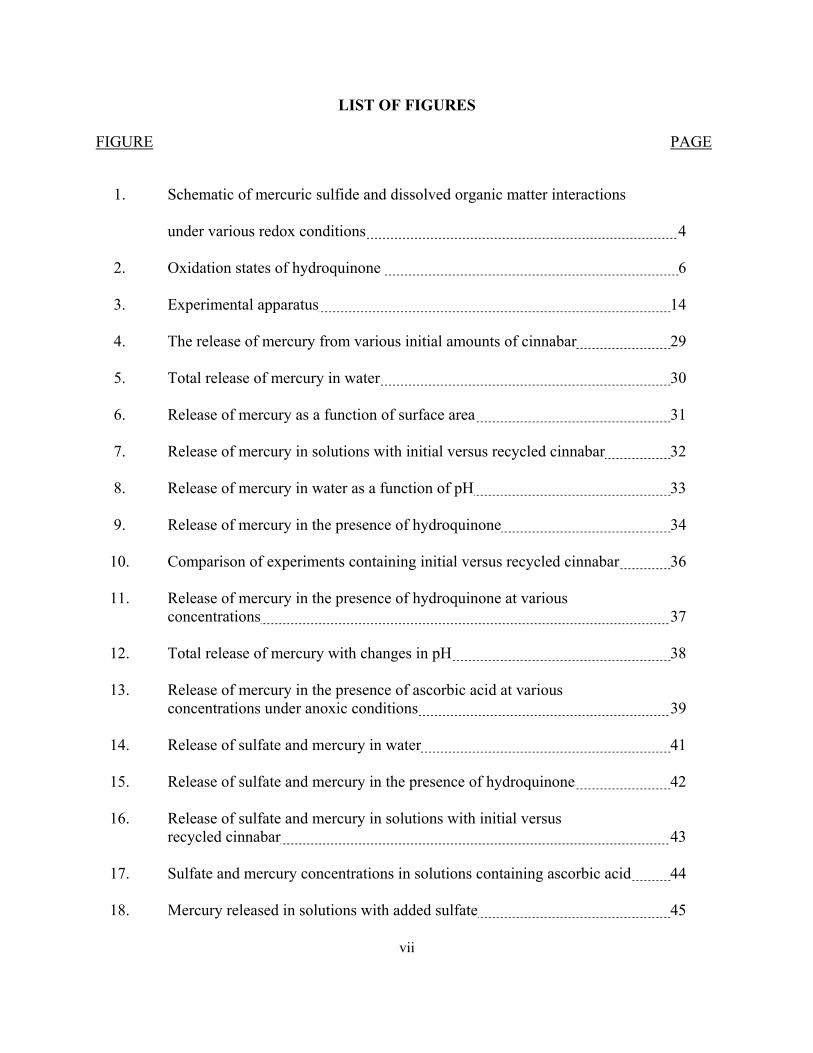
LIST OF FIGURES
FIGURE PAGE
1. Schematic of mercuric sulfide and dissolved organic matter interactions
under various redox conditions 4
2. Oxidation states of hydroquinone 6
3. Experimental apparatus 14
4. The release of mercury from various initial amounts of cinnabar 29
5. Total release of mercury in water 30
6. Release of mercury as a function of surface area 31
7. Release of mercury in solutions with initial versus recycled cinnabar 32
8. Release of mercury in water as a function of pH 33
9. Release of mercury in the presence of hydroquinone 34
10. Comparison of experiments containing initial versus recycled cinnabar 36
11. Release of mercury in the presence of hydroquinone at various concentrations 37
12. Total release of mercury with changes in pH 38
13. Release of mercury in the presence of ascorbic acid at various concentrations under anoxic conditions 39
14. Release of sulfate and mercury in water 41
15. Release of sulfate and mercury in the presence of hydroquinone 42
16. Release of sulfate and mercury in solutions with initial versus recycled cinnabar 43
17. Sulfate and mercury concentrations in solutions containing ascorbic acid 44
18. Mercury released in solutions with added sulfate 45
viii
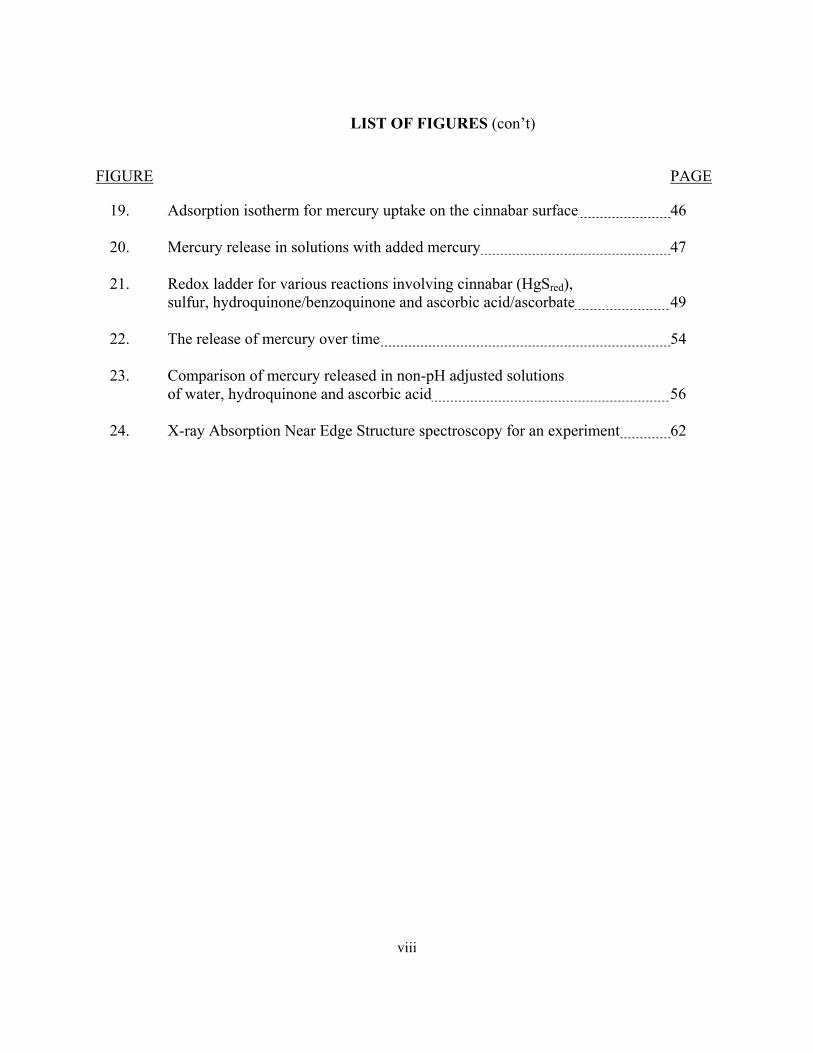
LIST OF FIGURES (con’t)
FIGURE PAGE
19. Adsorption isotherm for mercury uptake on the cinnabar surface 46
20. Mercury release in solutions with added mercury 47
21. Redox ladder for various reactions involving cinnabar (HgSred), sulfur, hydroquinone/benzoquinone and ascorbic acid/ascorbate 49
22. The release of mercury over time 54
23. Comparison of mercury released in non-pH adjusted solutions of water, hydroquinone and ascorbic acid 56
24. X-ray Absorption Near Edge Structure spectroscopy for an experiment 62
ix
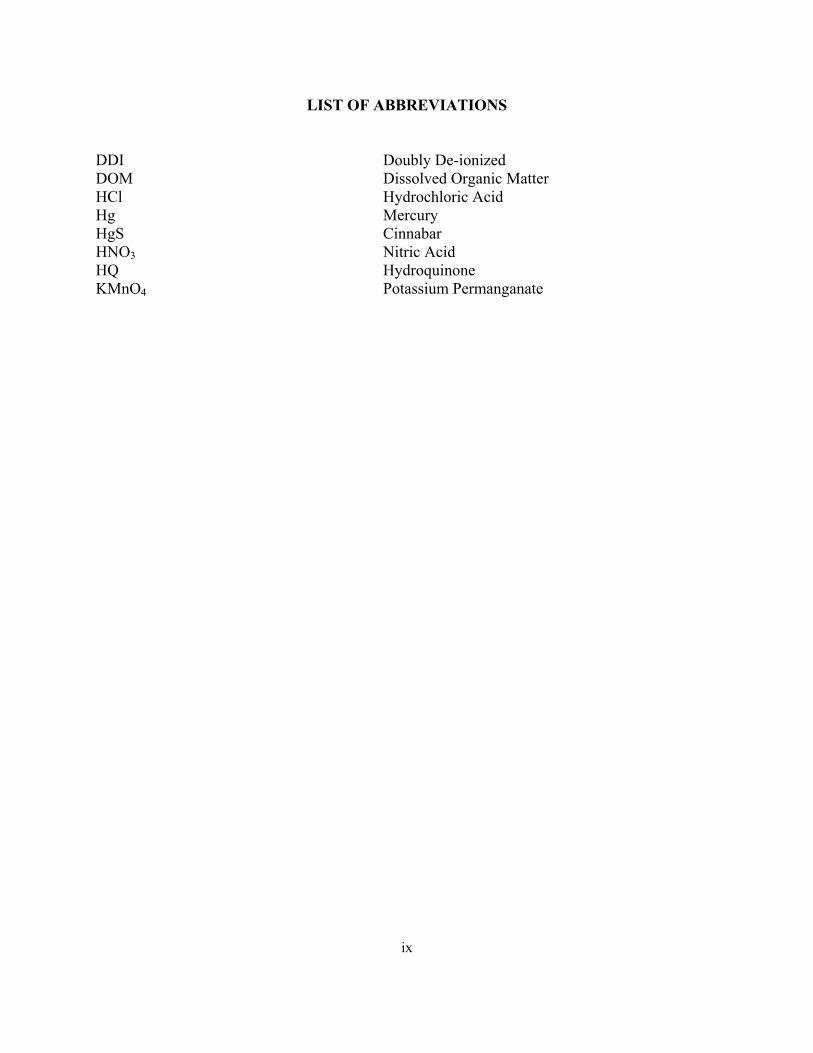
LIST OF ABBREVIATIONS
DDI Doubly De-ionized DOM Dissolved Organic Matter HCl Hydrochloric Acid Hg Mercury HgS Cinnabar HNO3 Nitric Acid HQ Hydroquinone KMnO4 Potassium Permanganate
x
SUMMARY
The release of mercury from cinnabar in water and aqueous solutions of hydroquinone
and ascorbic acid was investigated in batch experiments under various conditions. Experiments
were conducted in a nominally anoxic or oxic state using solutions that contained different ratios
of reactant to cinnabar and recycled cinnabar; variable mass of cinnabar; and variable pH.
Mercury concentrations were obtained using Cold Vapor Atomic Fluorescence Spectroscopy.
The amount of mercury released in the presence of hydroquinone was about the same as
that released in solutions of water under both anoxic and oxic conditions. In the presence of each
of these reactants, more mercury was released than in the presence of ascorbic acid. Decreased
release of mercury with increased cinnabar concentration was observed in experiments
containing water or water and hydroquinone, which is likely an effect of particle aggregation and
the effective decrease of the number of exposed reactive surface sites. Recycled cinnabar
surfaces released less mercury than the initial surfaces. The amount of sulfate measured in
selected solutions is two to three orders of magnitude greater than the amount of mercury
released. Furthermore, pH over the range of ~ 3 to 8 did not measurably affect the release of
mercury from cinnabar.
Altogether the results indicate a strong dependence of the release of mercury from
cinnabar on the presence of oxygen. The oxidation of sulfur species at the surface of cinnabar
likely weakens mercury-sulfur bonds releasing mercury to solution; or, oxidized sulfur species
may remain at the surface, increase in concentration and eventually slow the reaction. Any
available reductants may be able to remove the oxidized layer and promote dissolution.
1
I. INTRODUCTION AND BACKGROUND
1.1 The Mercury Problem
The significant introduction of mercury to the global budget by processes such as oceanic
evasion, volcanic emissions, and natural terrestrial fluxes is dwarfed by the mercury released as
air pollutants during combustion processes such as oil, gas, and coal burning (Mason et al.,
1999). Moreover, the loading of mercury to the atmosphere, soils, and aquatic environment is
compounded by anthropogenic contributions via products containing mercury, such as compact
fluorescent lamps/light bulbs (CFLs), ballasts, and thermostats.
In aquatic systems, the pathway for magnification of mercury into higher trophic level
species is direct. Mercury is methylated by microbes (Compeau and Bartha, 1987; Gilmour et al.,
1998), likely adsorbed onto or into the cells of simple organisms; passed up the food chain
through the consumption of contaminated species; and concentrated at toxic levels in seafood
consumed by humans. For example, Hardhead catfish, Southern kingfish and Reddrum meats
were determined to contain as much as 1.25 ppm Hg (Hall et al., 1978). The EPA recommends a
reference dosage level of 1 x 10⁻⁴ mg kg-1 d-1 stating that one can safely consume two 8 oz fish
steaks per month at concentrations of 0.37 – 0.47 ppm, and no more than one per month at
concentrations ranging from 0.47 to 0.94 ppm (EPA 2000). The toxic levels of mercury in
aquatic species have led to fish consumption advisories in many states (Fish Consumption
Advisories, 2012).
The biomagnification of mercury can be minimized by preventing mercury release to the
environment or, by sequestering the mercury(II) after it has been released. Immobilizing mercury
2
can be accomplished by precipitating the highly insoluble mineral, cinnabar. However, whereas
mercury bound in an insoluble mineral state decreases the pool readily available for methylation,
research has demonstrated that dissolved organic matter (DOM) present in aquatic environments
acts to re-solubilize this mercury (Ravichandran et al., 1998; Waples et al., 2005; Kerr, 2007).
1.2 Physical and Chemical Characteristics of Mercuric Sulfides
In the environment mercuric sulfides exist as cinnabar (α-HgS) and metacinnabar (β-
HgS) (Dryssen et al., 1991; Schuster, 1991). Under standard surface conditions, the formation of
the more stable phase, cinnabar, is favored under anoxic conditions (Morel et al., 1998; Svensson
et al., 2006; Wang et al., 1995), at low pH, and at relatively low sulfide concentrations (Morel et
al., 1998; Dryssen et al., 1991). In addition, metacinnabar formation is kinetically controlled and
metacinnabar will, over time, convert to the cinnabar structure (Paquette et al., 1997). Cinnabar
is highly insoluble with Ksp = 10-36.8 (Schwarzenbach and Widmer, 1963; Sillen, 1964) for the
reaction,
HgS + H+ → Hg2+ + HS- Reaction 1
at (I = 1.0 M, T = 20 °C).
The stability and low solubility of cinnabar make it a good sink for inorganic mercury(II) in
anoxic environments.
The dissolution of cinnabar occurs under oxic conditions (Holley et al., 2005; Kerr 2007)
and is enhanced substantially in the presence of DOM (Ravichandran et al., 1998; Waples et al.,
2005). Amounts and rates of mercury released from cinnabar over 10 h in the presence of DOM
samples from a wide range of natural environments were correlated with the aromaticity of the
3
DOM (Waples et al., 2005). These authors therefore hypothesized that redox sensitive aromatic
moieties within the DOM played a role in the mechanism of mercury release from HgS.
Dissolution of cinnabar may depend not only upon the redox reactivity of the DOM, but also on
the type of redox environment in which both the DOM and cinnabar reside.
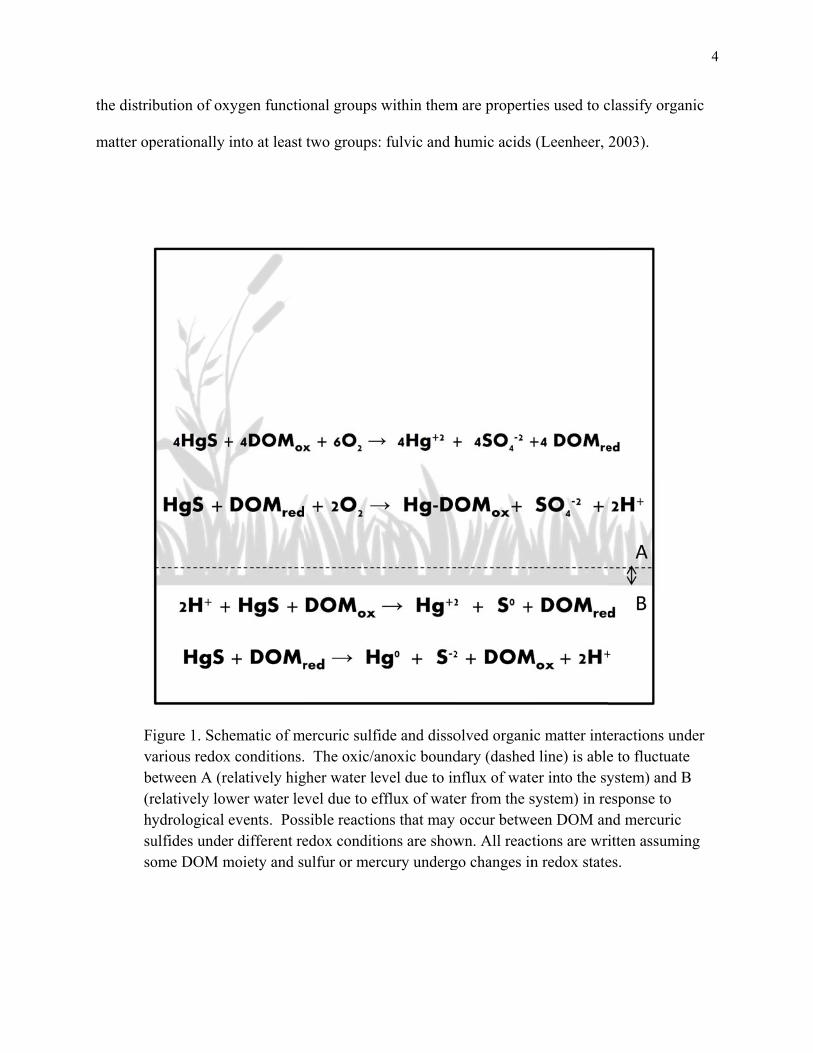
1.3 Fluctuations of Redox Conditions in Natural Systems
There is the potential for many redox reactions to occur between cinnabar and DOM
during water table fluctuations (Fig. 1). During periods of rain or flooding, a rise in the water
table can move the anoxic/oxic boundary toward the surface (Fig. 1: B to A), subjecting the
sediments to a more reducing environment. Alternatively, during sunny periods or periods of
drought, a drop in the water table moves the boundary down (Fig. 1: A to B) and the sediments
experience a more oxygenated environment. Further, shifts in the anoxic/oxic boundary can
result in a relatively sudden introduction of DOM into waters of different Eh where the redox
state of DOM moieties may change. When the water table falls, oxidized moieties of DOM may
potentially react with mercuric sulfide minerals releasing soluble mercury(II) that can be
consumed by organisms. Likewise, a higher water table may result in a reaction between reduced
moieties of DOM and these minerals.
1.4 Composition of Dissolved Organic Matter
DOM is an infinitely heterogeneous (Leenheer, 2003) macromolecular material formed
early in the decay of biomatter (MacCarthy et al., 2001). The size of the organic molecules and
the distri
matter op
Fvb(rhysuso
bution of ox
perationally
igure 1. Scharious redoxetween A (rerelatively lowydrological ulfides undeome DOM m
xygen functio
into at least
hematic of mx conditions.elatively higwer water leevents. Posr different re
moiety and su
onal groups
two groups:
mercuric sulfi The oxic/a
gher water level due to efsible reactioedox conditiulfur or mer
within them
: fulvic and h
ide and dissoanoxic boundevel due to infflux of wate
ons that may ions are showrcury underg
m are properti
humic acids
olved organidary (dashednflux of wateer from the soccur betwe
wn. All reactgo changes in
ies used to c
(Leenheer,
ic matter inted line) is ableer into the sysystem) in reeen DOM antions are wrin redox state
classify orga
2003).
eractions une to fluctuateystem) and Besponse to nd mercuric itten assumines.
4
anic
der e B
ng
5
Fulvic acids have a large percentage of oxygen functional groups, a high solubility over a
wide range of pH values, and a relatively lower molecular weight. Larger molecules, referred to
as humic acids, have relatively fewer oxygen functional groups than the fulvic acids and are
insoluble at low pH. Further investigation into the structure of DOM fractions indicates that
they contain varying proportions of redox sensitive moieties, such as quinones, ketones and
aldehydes (Thorn et al., 1992) that have the potential to be aromatic.
Aromatic moieties, such as benzene, are generally comprised of carbons with parallel pi-
orbitals; and the delocalization of electrons among the carbons allows the ring to accept and
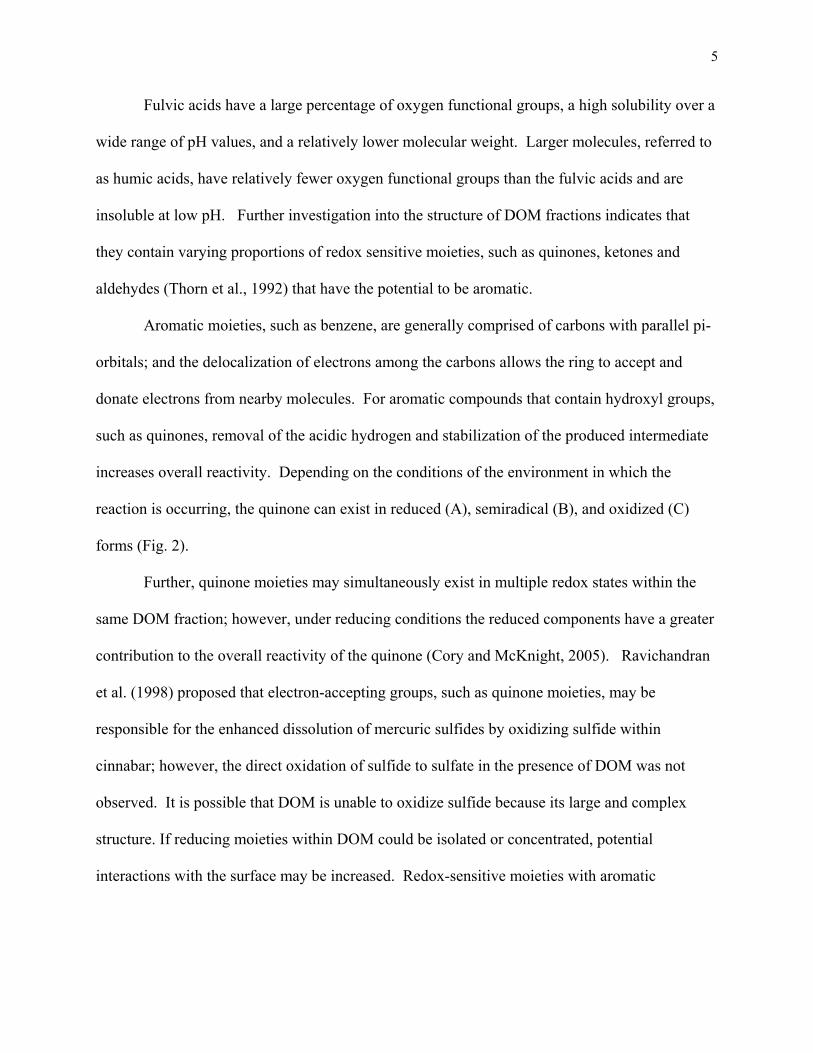
donate electrons from nearby molecules. For aromatic compounds that contain hydroxyl groups,
such as quinones, removal of the acidic hydrogen and stabilization of the produced intermediate
increases overall reactivity. Depending on the conditions of the environment in which the
reaction is occurring, the quinone can exist in reduced (A), semiradical (B), and oxidized (C)
forms (Fig. 2).
Further, quinone moieties may simultaneously exist in multiple redox states within the
same DOM fraction; however, under reducing conditions the reduced components have a greater
contribution to the overall reactivity of the quinone (Cory and McKnight, 2005). Ravichandran
et al. (1998) proposed that electron-accepting groups, such as quinone moieties, may be
responsible for the enhanced dissolution of mercuric sulfides by oxidizing sulfide within
cinnabar; however, the direct oxidation of sulfide to sulfate in the presence of DOM was not
observed. It is possible that DOM is unable to oxidize sulfide because its large and complex
structure. If reducing moieties within DOM could be isolated or concentrated, potential
interactions with the surface may be increased. Redox-sensitive moieties with aromatic
structure
in oxic sy
Hg(II)-su
F
s in DOM m
ystems, as pr
ulfide bond b
igure 2. Oxi B.)
may act as ele
roposed by W
breaks via th
idation statesSemiquinon
ectron shuttl
Waples et al
he reduction
s of hydroqune state, and
les in the me
. (2005); how
of Hg(II) or
uinone. A.) FC.) Fully ox
echanism tha
wever, it rem
r the oxidatio
Fully reducedxidized comp
at causes cin
mains to be d
on of S(II).
d compoundmpound.
nnabar to diss
determined i
d,
6
solve
if
7
1.5 Dissolution of Metal Oxides by Reducing Compounds
Under anoxic conditions and at near neutral pH, various metal oxides have been shown to
dissolve more rapidly in the presence of redox compounds such as hydroquinones, resorcinols,
methoxy aromatics, mono-substituted benzoic acids and non-aromatics (Stone and Morgan,
1984). In particular, the dissolution of manganese (III & IV) oxides was enhanced in the
presence of hydroquinone and ascorbate, although the rate was affected to a lesser extent in the
presence of the latter (Stone and Morgan, 1984). Additionally, Stack et al. (2004) observed
active iron reduction in hematite in the presence of hydroquinone in a solution under anoxic
conditions at low pH.
In the case of the Fe-oxides, the full reduction mechanism consists of adsorption of
hydroquinone to the iron-surface site, an electron transfer forming a semiquinone radical and a
reduced iron, and finally desorption of the semiquinone and dissolution of the reduced iron. The
initial adsorption is hypothesized to occur through an inner-sphere complex between a reduced
oxygen and oxidized surface species (Stack et al., 2004). It is possible that the same type of
dissolution mechanism is occurring between hydroquinone or ascorbic acid and mercury on the
surface of cinnabar.
1.6 Dissolution of Cinnabar in the Presence of Hydroquinone
Kerr (2007) investigated the dissolution rate of cinnabar (HgS) in the presence and
absence of hydroquinone (HQ); and observed an increase in rate from 3.5 x 10⁻¹⁰ mole Hg m-2 s-1
in the absence of quinone, to 5.5 x 10⁻⁹ mole Hg m-2 s-1 at a 2:1 mole ratio of HQ to HgS over a
two- hour period. The increased release of mercury was interpreted to mean that the quinone
8
actively reduced mercury under anoxic conditions. Moreover, Kerr (2007) observed that an
increase in the ratio of hydroquinone to cinnabar did not result in a proportional increase in the
dissolution rate and hypothesized that the rate may be a function of reactive surface area. In
combination with the results from Stack et al. (2004) the results indicate a series of mechanistic
steps at the surface between mercury bound in cinnabar and the redox compound which may or
may not include a direct bonding mechanism between the reductant and mercury on the surface.
1.7 Natural Occurrence of Quinones and Ascorbic Acid
Particular attention has been paid to quinones because of their predominance in natural
organic matter (Thorn et al., 1992) and their ready participation in redox reactions. Quinones are
actively generated by microbes during processes such as respiration (Lovely et al., 2000; Lovely
et al., 2002) and are prominent in plant allelopathy (Uchimiya and Stone, 2009; Vyvyan 2002;
Weston and Duke, 2003). In addition, ascorbic acid (AA), a known reducing agent, is produced
by plants under oxidative stress (Bowler, 1992), during periods of drought and flood (Bowler,
1992), and in the presence of heavy metals (Singh and Sinha, 2005; Sinha et al., 1996). The two
molecules used in this work were selected because of their similarity to natural components
within DOM thought to be responsible for the release of Hg from cinnabar and their natural
production and activity in the environment.
1.8 Statement of Purpose
In an attempt to continue characterizing the effects of the redox sensitive moieties
commonly found in DOM on the dissolution of cinnabar, the research described in this thesis
9
was focused on experimental measurements in the presence of hydroquinone and ascorbic acid.
Previous work by Kerr (2007) showed increased dissolution of cinnabar when in the presence of
redox sensitive moieties; however, little research has been carried out to examine how
parameters, such as surface area and pH, alter the release of mercury from the mineral surface.
More importantly from the perspective of naturally fluctuating redox conditions, how might the
subsequent release of mercury from cinnabar change after an initial reaction with hydroquinone
or ascorbic acid? The results of this study are important for understanding mercury mobility in
the environment and will be vital to the successful management of this toxic metal.
10
II. MATERIALS AND METHODS
2.1 Introduction
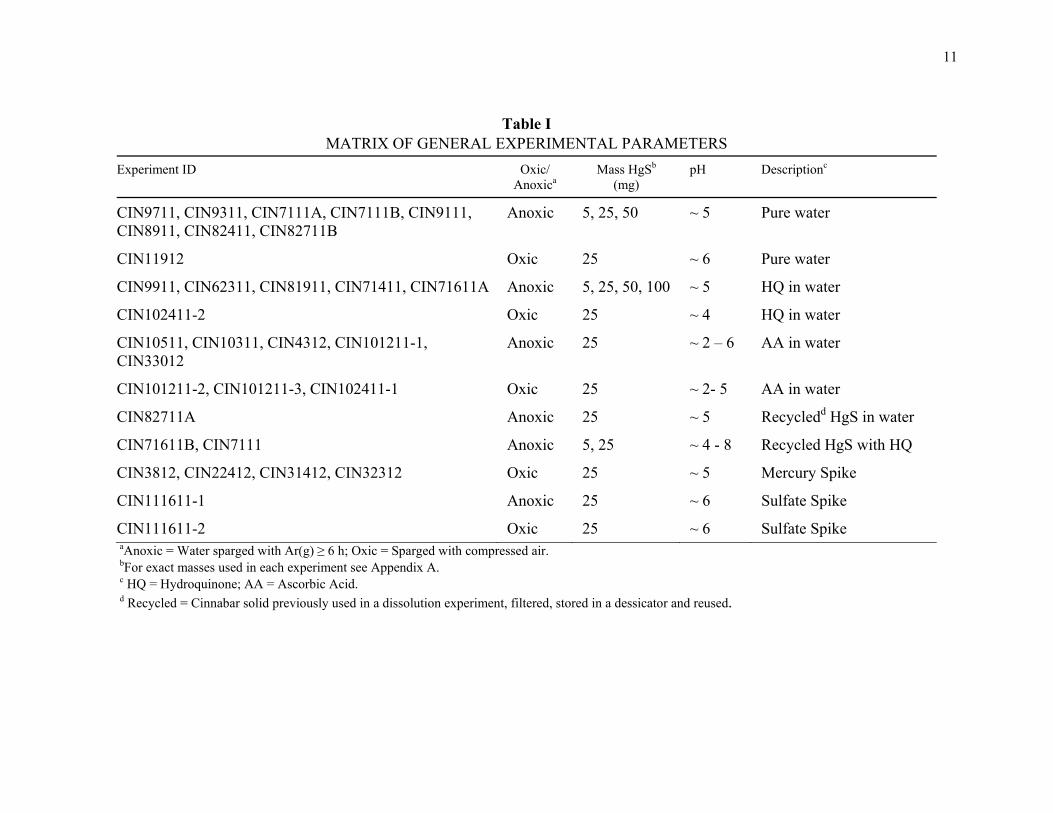
Thirty-two dissolution experiments were performed to quantify how the release of
mercury from cinnabar changed under various redox conditions (Table I). The experiments were
designed to observe effects of variations in total surface area, pH, concentration of the redox-
sensitive reactants hydroquinone and ascorbic acid, and recycling of the reactant cinnabar. This
chapter starts with descriptions of all materials, the preparation of experimental solutions, the
experimental apparatus, and the analytical methods. Next, the procedure for the addition of
reagents and sampling methods for the experiments with water, hydroquinone, and ascorbic acid
are presented, followed by the procedure for experiments with recycled cinnabar. Lastly, the
procedure for performing experiments in which the initial solutions were spiked with mercury or
sulfate is described.
2.2 Materials
Certified A.C.S. or trace-metal grade reagents and doubly-deionized (DDI) water (> 18.0
Ω; DOC < 0.2 mg C L-1) (Barnsted NANOPURE Infinity Model D8991) were used in all
experiments. Glassware and Teflon™ containers were cleaned in an acid bath (10 % v/v
(volume/volume) nitric acid (HNO3); and 10 % v/v hydrochloric acid (HCl)) for ≥ 6 h, and
rinsed at least 10 times with DDI water. The glassware was heated in a muffle furnace at 450°C
for 1 h to remove any adsorbed organics.
11
Table I
MATRIX OF GENERAL EXPERIMENTAL PARAMETERS
Experiment ID Oxic/ Anoxica
Mass HgSb (mg)
pH Descriptionc
CIN9711, CIN9311, CIN7111A, CIN7111B, CIN9111, CIN8911, CIN82411, CIN82711B
Anoxic 5, 25, 50 ~ 5 Pure water
CIN11912 Oxic 25 ~ 6 Pure water
CIN9911, CIN62311, CIN81911, CIN71411, CIN71611A Anoxic 5, 25, 50, 100 ~ 5 HQ in water
CIN102411-2 Oxic 25 ~ 4 HQ in water
CIN10511, CIN10311, CIN4312, CIN101211-1, CIN33012
Anoxic 25 ~ 2 – 6 AA in water
CIN101211-2, CIN101211-3, CIN102411-1 Oxic 25 ~ 2- 5 AA in water
CIN82711A Anoxic 25 ~ 5 Recycledd HgS in water
CIN71611B, CIN7111 Anoxic 5, 25 ~ 4 - 8 Recycled HgS with HQ
CIN3812, CIN22412, CIN31412, CIN32312 Oxic 25 ~ 5 Mercury Spike
CIN111611-1 Anoxic 25 ~ 6 Sulfate Spike
CIN111611-2 Oxic 25 ~ 6 Sulfate Spike aAnoxic = Water sparged with Ar(g) ≥ 6 h; Oxic = Sparged with compressed air. bFor exact masses used in each experiment see Appendix A. c HQ = Hydroquinone; AA = Ascorbic Acid. d Recycled = Cinnabar solid previously used in a dissolution experiment, filtered, stored in a dessicator and reused.
12
The powdered cinnabar (HgSred) (99.5 +% Acros Organics) had been washed and
characterized previously by Kerr (2007). Briefly; the cinnabar was cleaned by soaking the
mineral in 10% HNO3 for 4 d and then dried at 60°C for 4 d. After the cinnabar was dry, it was
sieved to obtain the 20-53 μm size fraction. The specific surface area, as measured by the BET
method (Brunauer, Emmett and Teller, 1938), was equal to 0.23 m2 g-1. The cinnabar was stored
in contact with air in a closed amber glass bottle covered with aluminum foil. Hydroquinone and
ascorbic acid (99 +% Acros Organics) were obtained from Sigma Aldrich and used without
further purification.
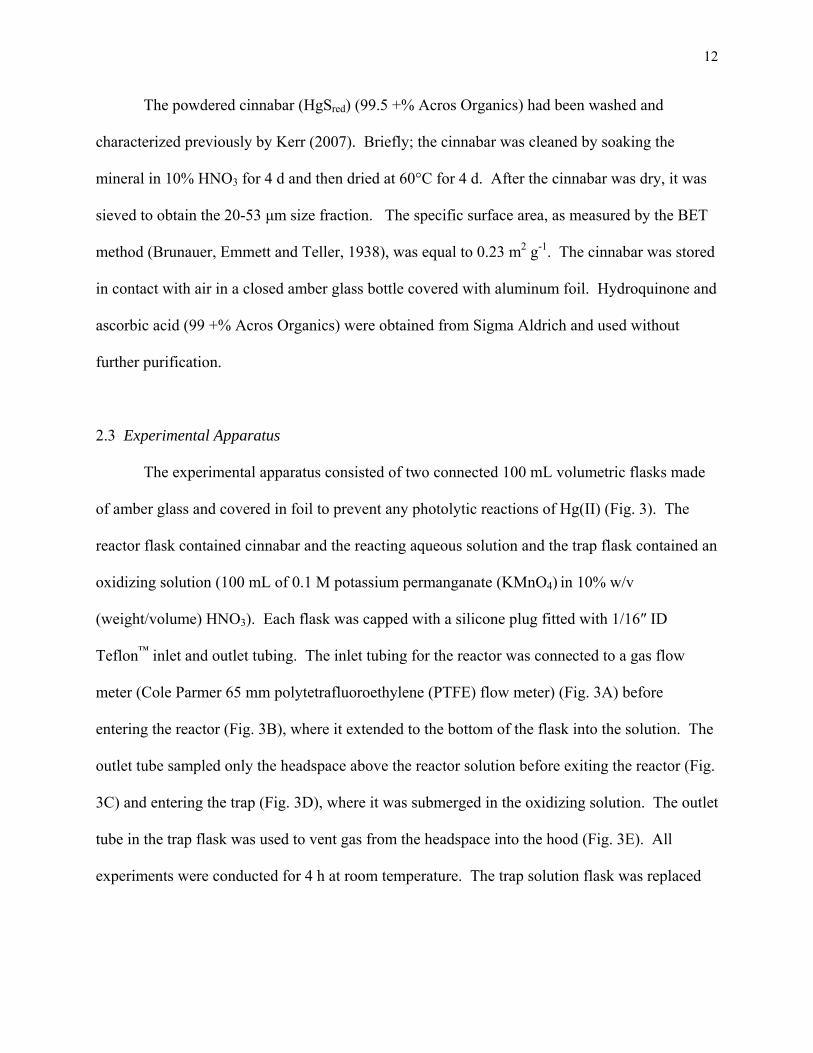
2.3 Experimental Apparatus
The experimental apparatus consisted of two connected 100 mL volumetric flasks made
of amber glass and covered in foil to prevent any photolytic reactions of Hg(II) (Fig. 3). The
reactor flask contained cinnabar and the reacting aqueous solution and the trap flask contained an
oxidizing solution (100 mL of 0.1 M potassium permanganate (KMnO4) in 10% w/v
(weight/volume) HNO3). Each flask was capped with a silicone plug fitted with 1/16″ ID
Teflon™ inlet and outlet tubing. The inlet tubing for the reactor was connected to a gas flow
meter (Cole Parmer 65 mm polytetrafluoroethylene (PTFE) flow meter) (Fig. 3A) before
entering the reactor (Fig. 3B), where it extended to the bottom of the flask into the solution. The
outlet tube sampled only the headspace above the reactor solution before exiting the reactor (Fig.
3C) and entering the trap (Fig. 3D), where it was submerged in the oxidizing solution. The outlet
tube in the trap flask was used to vent gas from the headspace into the hood (Fig. 3E). All
experiments were conducted for 4 h at room temperature. The trap solution flask was replaced
13
every hour, i.e., at the beginning of hours 2, 3, and 4, with fresh oxidizing solution in a fresh
flask.
For experiments under anoxic conditions, fresh DDI water was sparged with high purity
Ar(g) for ≥ 6 h in a clean 1.0 L Teflon™ bottle. After sparging, the headspace was filled with
Ar(g) and then the container was capped until the water was needed for an experiment (< 24 h
from sparging to use). Sparged water older than 24 h was not used. For oxic conditions the
DDI water was not pre-treated, but taken fresh from the NANOPURE Infinity unit as needed.
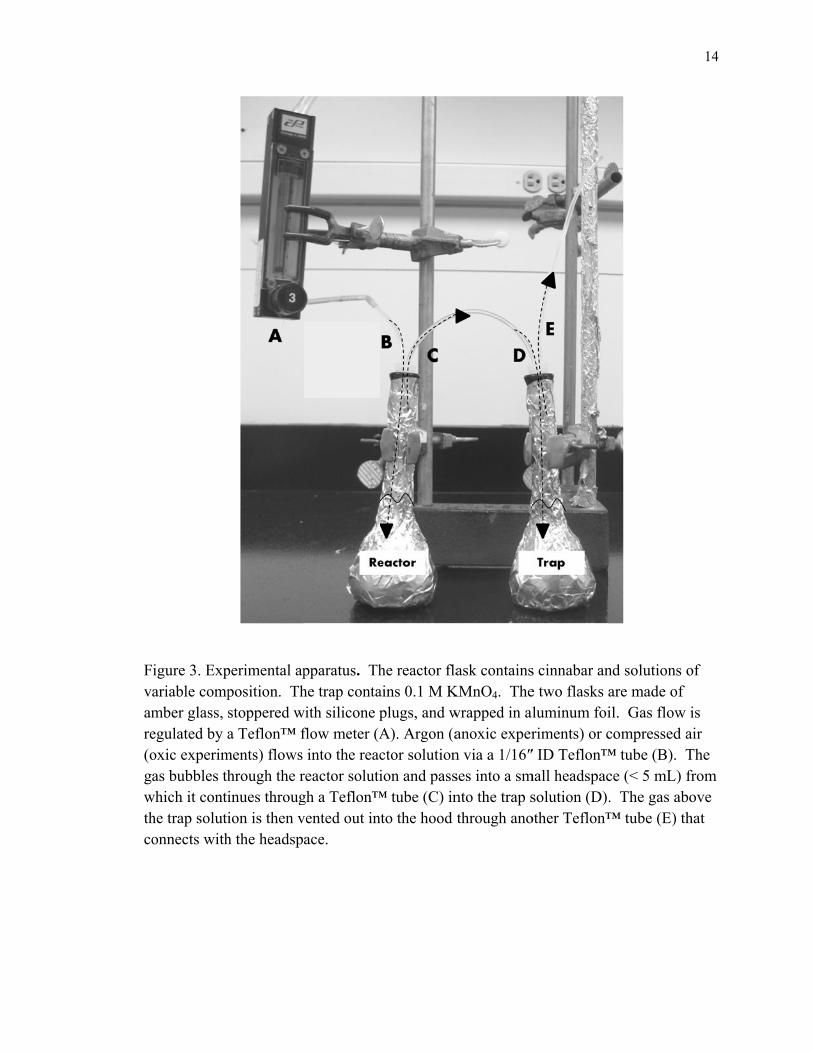
Fvamre(ogwthco
igure 3. Expariable compmber glass, egulated by aoxic experimas bubbles th
which it contihe trap solutionnects with
perimental apposition. Thstoppered wa Teflon™ f
ments) flows hrough the rinues througion is then vh the headspa
pparatus. Thhe trap conta
with silicone pflow meter (Ainto the reac
reactor solutigh a Teflon™vented out inace.
he reactor flaains 0.1 M Kplugs, and wA). Argon (actor solutionion and pass
™ tube (C) innto the hood
ask containsKMnO4. Thewrapped in alanoxic expern via a 1/16″ses into a smnto the trap sthrough ano
s cinnabar ane two flasks aluminum foiriments) or c″ ID Teflon™
mall headspacsolution (D)
other Teflon™
nd solutions are made of il. Gas flowcompressed
™ tube (B). ce (< 5 mL) . The gas ab™ tube (E) t
14
of fw is
air The from
bove that
15
2.4 Analytical Methods
2.4.1 Mercury
Mercury in all experimental solutions was analyzed by Cold Vapor Atomic Fluorescence
Spectrophotometry (CVAFS; Hydra AF Gold+, Teledyne-Leeman) using the Environmental
Protection Agency (EPA) method 245.7 as a template (EPA, 2005). Upon completion of an
experiment, 10 mL of sample was immediately transferred to a glass test tube containing 250 μL
concentrated HCl (Optima Grade) and 100 μL 0.1 M bromide/ bromated (Br- /BrO3-; Teledyne
Leeman Labs) to form bromine (Br2). Mercury (Hg0) is oxidized by Br2 according to (Rxn. 2),
which maintains the mercury in a stable form in solution:
Br2 + Hg0 → Hg2+ + 2Br- Reaction 2
The sample was allowed to oxidize (confirmed by a persistent yellow color) for at least
30 min (maximum digestion time of 4 h), after which 400 μL of 10% (w/v) hydroxylamine
(NH2OH) was added to expel any un-reacted bromine. Some solutions, particularly those with
KMnO4, required excess NH2OH (400 – 1600 μL). The concentration for these solutions was
adjusted for the dilution. The test tube containing a 10 mL sample and ~ 0.75 – 1.55 mL of
digestion reagents was placed in an autosampler rack. The instrument extracted an aliquot from
the sample tube into a Teflon™ tube and subsequently mixed in tin(II) chloride (SnCl2) solution,
which reduces aqueous Hg(II) to Hg(0) gas according to (Rxn. 3):
Hg2+ + Sn2+ → Hg0 + Sn4+ Reaction 3
The vapor, a mixture of water and mercury, was carried by high purity argon (Ar) gas
flow through a soda lime drier where excess water vapor was removed. The dried gas was then
passed into an optical cell, where a mercury lamp delivered an emission beam at 254 nm. After
16
the absorption of energy from the emission beam the fluorescence of the mercury gas was
measured using a solid state detector.
Calibration standards were prepared daily according to EPA 245.7 protocols. A mercury
reference standard solution of known concentration (10 ppm ± 1% in 1.8% HNO3) was diluted
by mass to produce a secondary standard (~ 0.5 ppm). A set of working standards was prepared
from the secondary standard in the concentration range of 0.5 to 500 ppb. Check standards, also
prepared from the secondary standard, were analyzed at the beginning of, and periodically
during, the analyses to confirm the validity of the calibration line. Typically, any check standard
solution with a > 20% deviation from the calibration line was rejected and the calibration line
was reassessed for accuracy. The method detection limit was 1.0 μg L-1. The error associated
with dissolved Hg concentrations, as measured by CVAFS, was determined by least squares
analysis of the individual calibration output on a given day.
For solutions that received excess mercury, the spike solution was prepared by dissolving
HgCl2 (99.999 +% Acros Organics) in oxic or anoxic DDI water. Spike solutions were prepared
in 100 mL amber glass volumetric flasks and used in experiments within 1 h of preparation.
2.4.2 Sulfate
Nine reactor solutions (CIN9711, CIN7111A, CIN7111B, CIN9111, CIN8911,
CIN82711B, CIN9911, CIN71611B, CIN10311) were selected for sulfate analysis using Ion
Chromatography (IC) (Dionex IC 2500). Prior to IC analysis the solutions were mixed with an
Ambersep GT74 weak acid cation exchange resin (1.30 eq/L Ion Exchange Capacity) to remove
any free mercury(II). The solution was mixed by placing 10 mL of the reactor solution into a
clean 50 mL beaker containing a magnetic stir bar and 2 mL of resin. The mixture was stirred
17
for at least 2 h. The solution was decanted into a 10 mL amber glass vial and stored for < 48 h
prior to analysis. Instrument calibration was performed prior to each run with 5 to 450 ppb
sulfate standards mixed by serial dilutions from a stock DIONEX standard.
For experiments where excess sulfate was to be added, sulfate reactant solutions were
prepared by dissolving Na2SO4 (99 +% Acros Organics) in oxic or anoxic DDI water. At the end
of the experiment, the reactor sample was filtered and a portion of the filtrate set aside for
complexometric titration with BaCl2 (99 +%, Acros Organics).
2.4.3 Changes in pH
Adjustments of pH were carried out using (1:1) HCl (Optima grade) and (1:1) sodium
hydroxide (NaOH) in DDI water. When adjustments were made, the solutions typically received
both HCl and NaOH. The final pH of the reactor solution was measured at the end of the
experiment after the solid cinnabar had been filtered from the solution. Measurements were
made using standard pH buffers (4.0 and 7.0), an Orion pH meter (model 720A), and a PerpHecT
ROSS Combination electrode.
2.5 Experiments
2.5.1 Cinnabar Reactivity in Water and Solutions of Hydroquinone or Ascorbic Acid
The release of mercury from cinnabar was measured in solutions of pure water,
hydroquinone, or ascorbic acid. In all cases solid cinnabar was added to the reactor flask prior to
the addition of a solution. After the addition of the solution, the reactor was sealed, connected in
sequence with the trap flask, and the experiment was allowed to proceed.
18
For experiments in pure water, a reactor flask containing either no or a fixed initial mass
of cinnabar (5, 25 or 50 mg) was connected to a trap flask. Water (100 mL) was added to the
reactor, after which the flask was stoppered, and the gas (argon or compressed air) pressure
adjusted to 10 - 20 psi. For solutions containing hydroquinone or ascorbic acid, 50 mL of pre-
treated DDI water was added to a reactor flask containing cinnabar before the addition of
reducing solutions. Prior to the beginning of an experiment, the solution of water and cinnabar
in the reactor flask was purged for 5 min: experiments under anoxic conditions were purged with
high purity argon (99.998 %), and experiments under oxic conditions were purged using
compressed air from the laboratory’s house line. After 5 min, the gas was turned off and 50 mL
of the solution containing the designated reagents (at twice the desired concentration) was added
to the reactor flask using a 50 mL volumetric pipette. After the stopper was removed to add the
reagent, the flask was re-stoppered in less than 5 s. Once the reactor was re-stoppered it was not
opened again until the end of the 4 h experiment.
In each experiment the trap solution was changed every 1 h according to the following
procedure: the gas was turned off; the used trap flask was removed and replaced with a 100 mL
volumetric flask containing a fresh solution of 0.1 KMnO4; the silicone stopper was replaced;
and, the gas flow was restarted. The duration of time during which there was no gas flow was
less than 5 s. The flasks containing the first three used trap solutions were capped with glass
stoppers and were stored under the hood until the end of the experiment. The reactor and all trap
solutions were analyzed immediately after the end of the experiment.
The gas was turned off after 4 h and the reactor flask was removed from the experimental
apparatus. For some reactor solutions, the reacted cinnabar was saved for subsequent dissolution
experiments. The filtration method for recycled cinnabar will be discussed in the following
19
section. However, when the cinnabar solid was not going to be reused, the reactor solution was
drawn into a polypropylene syringe fitted with a Teflon™ tube extension and extruded directly
through a Whatman Puradisc 0.45 μm filter into a glass test tube containing the digestion
reagents. A portion of the reactor filtrate was set aside for pH testing, while another portion of
the filtrate solution was transferred to a 10 mL amber glass vial with a PTFE cap and placed in a
plastic bin for storage.
In all experiments, released mercury concentrations were normalized to the specific
surface area (0.23 m2 g-1) using the total mass of cinnabar and total volume of solution contained
in each flask according to (Eq. 1):
HgT (μmol Hg m-2) = HgReactor (μmol Hg) + HgTraps (μmol Hg) Equation 1 Cinnabar (g) * 0.23 (m2 g-1)
In addition, the moles of reactant (i.e., HQ and/or AA) were compared to the number of moles
exposed at the surface of mercury for each experiment (see Appendix B for conversion factors).
The error in HgT was calculated by combining the standard error of a surface area measurement
(± 10%), and uncertainty in the detection of Hg as determined by quality control checks during
CVAFS measurements. In general, the uncertainty within the calibration curve was less than
10%; and typically, the deviation of the calibration curve from the reference standard was less
than 20%.
2.5.2 Reactivity of Recycled Cinnabar
Cinnabar undergoing an experiment under the conditions described in the previous
section will furthermore be referred to as initial cinnabar when compared to experiments
20
involving recycled cinnabar. Reacted cinnabar from six experiments (CIN7111A, CIN7111B,
CIN81911, CIN71411, CIN6711, and CIN62311) was collected to reuse in subsequent
dissolution experiments. Three experiments were performed to measure mercury release from
recycled cinnabar in anoxic water: one experiment combined cinnabar from experiments
CIN7111A- anoxic water, CIN7111B- anoxic water, and CIN81911- anoxic HQ; one used
cinnabar from CIN71411-anoxic HQ; and one combined cinnabar from CIN6711-anoxic HQ and
CIN62311-anoxic HQ.
When the cinnabar solid was to be saved and stored for later use in a recycled
experiment, the reactor solution was poured through a Nalgene filter funnel fitted with a 0.45 μm
Millipore Durapore® HVLP membrane into a clean Erlenmeyer flask connected to a vacuum
pump. The cinnabar collected on the filter was immediately rinsed three times with DDI water
by squirting water from a wash bottle directly onto the filter. The filter with cinnabar was
transferred into a clean glass 100 mL beaker. The beaker was covered in Parafilm® and placed in
a vacuum sealed desiccator covered in foil. Dried cinnabar was scraped off of the filter and
transferred directly into a clean and tared amber glass volumetric flask. The mass of the
cinnabar was recorded and the experiment proceeded as previously described.
2.6 Reactivity of Cinnabar in the Presence of Excess Sulfate or Mercury
2.6.1 Sulfate Spike Experiments
Two spike experiments (CIN111611_1 under anoxic conditions and CIN111611_2 under
oxic conditions) were performed to test the effect of high sulfate concentrations on the amount of
mercury released from cinnabar. Sulfate solutions (193 and 184 moles sulfate (SO4) L-1) were
added to the reactor flask after 5 min of sparging. After the completion of the experiment the
21
reactor solution was filtered through a Nalgene filter funnel fitted with a 0.45 μm Millipore
Durapore HVLP membrane. Ten (10) mL of the filtrate were collected and set aside for
determination of sulfate concentration by titration with barium (II) chloride BaCl2.
The titrant was prepared by dissolving BaCl2 in DDI water (0.576 and 0.703 M). During
the titration barium sulfate (BaSO4) precipitated according to (Rxn 5):
Ba+2 + SO42- → BaSO4 Reaction 5
The precipitated BaSO4 was collected on a 0.7 μm Whatman glass microfiber filter by
vacuum filtration and the filter with precipitate was placed on a watch glass covered in Parafilm®
and stored in a dessicator. A qualitative method (Brush and Penfield, 1898) was used to confirm
the presence of barium and sulfate. A platinum wire loop was coated with precipitate and held
over an open flame from a Bunsen burner. The production of a green flame verified the presence
of barium. Sulfate was confirmed in the precipitate by wiping a heated slurry of charcoal,
sodium bicarbonate, and the precipitate onto a solid silver plate and observing the presence of a
dark black precipitate.
2.6.2 Mercury Spike Experiments
Four experiments (CIN22412, CIN3812, CIN31412, CIN32312) with mercury(II)-spiked
reactor solutions were performed to test for possible adsorption of mercury(II) to the surface of
cinnabar during dissolution. The spike solution concentration was analyzed separately.
The experimental apparatus, analytical procedure, and reagent addition were the same as
previously described. Fifty mL of the spike solution was added to the reactor flask after the
initial 5 min of sparging. After completion of the experiment, the reactor solution was filtered
22
through a 0.45 μm Millipore Durapore® HVLP membrane on a Nalgene filter funnel. Ten mL of
the filtrate was collected and set aside for mercury analysis.
The minimum amount of adsorbed mercury, if any, was determined by subtracting the
sum of the moles of mercury in the reactor and trap flasks from the moles of mercury added to
the reactor solution. This estimate of the minimum amount assumes there was no release of
mercury from cinnabar and that any mercury moved to the traps was from the initial spike.
A positive value represents the net minimum adsorbed mercury. A negative value represents net
mercury release from cinnabar. An adsorption isotherm was generated by plotting the minimum
number of moles adsorbed vs. the concentration of mercury remaining in the reactor for each
experiment.
23
III. RESULTS
3.1 Introduction
Results from this work for the reactivity of cinnabar under various experimental
conditions are reported in Tables II-V. The data for mercury release are presented in detail
below by type of experiment: cinnabar in pure water, cinnabar in hydroquinone solutions, and
cinnabar in ascorbic acid solutions. These results include effects of variable pH, cinnabar mass,
and concentration of hydroquinone and ascorbic acid where relevant. Next, sulfate
concentrations in reactor solutions for selected experiments are reported and compared to the
amount of mercury released. Lastly, the results from the experiments with added mercury are
presented.
3.2 Mercury Released from Cinnabar in Water
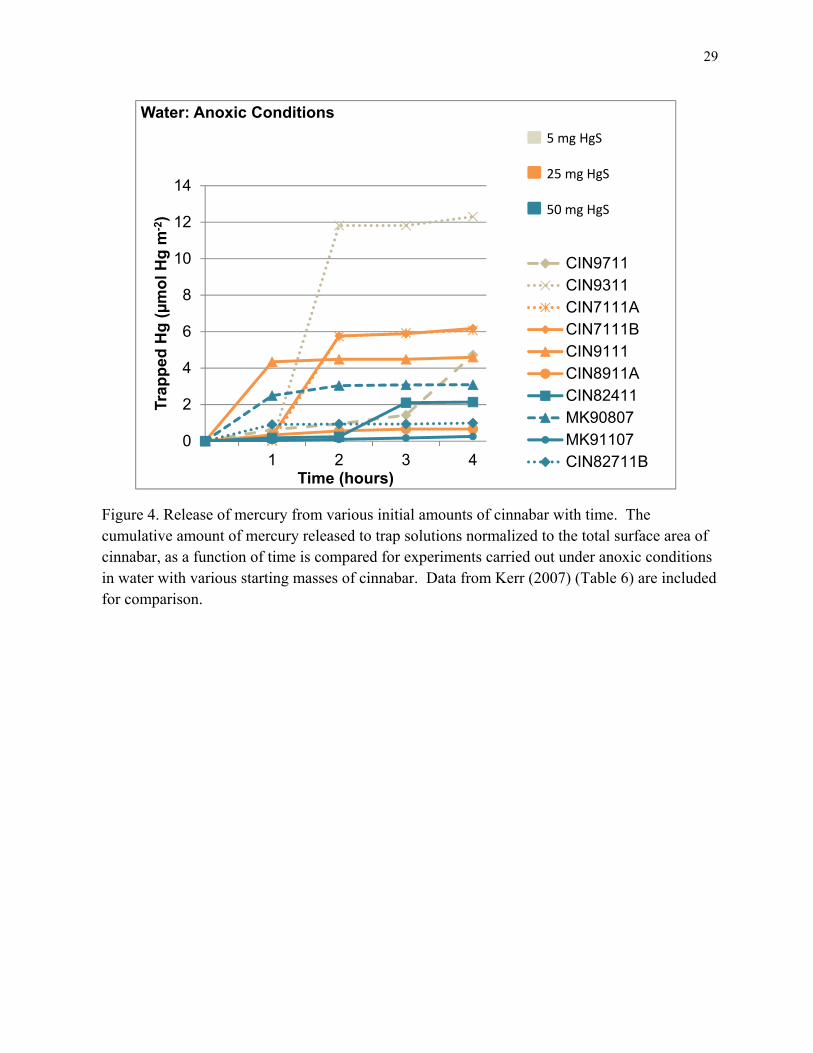
In anoxic experiments, the concentration of mercury in trap solutions increased initially
and then assumed a constant value after ~ 2-3 h with the exception of experiment CIN9711 in
which the mercury concentration continued to rise over the 4 h reaction period (Fig. 4). Data
from Kerr (2007) are included in Figure 4 for comparison. The cumulative concentration of
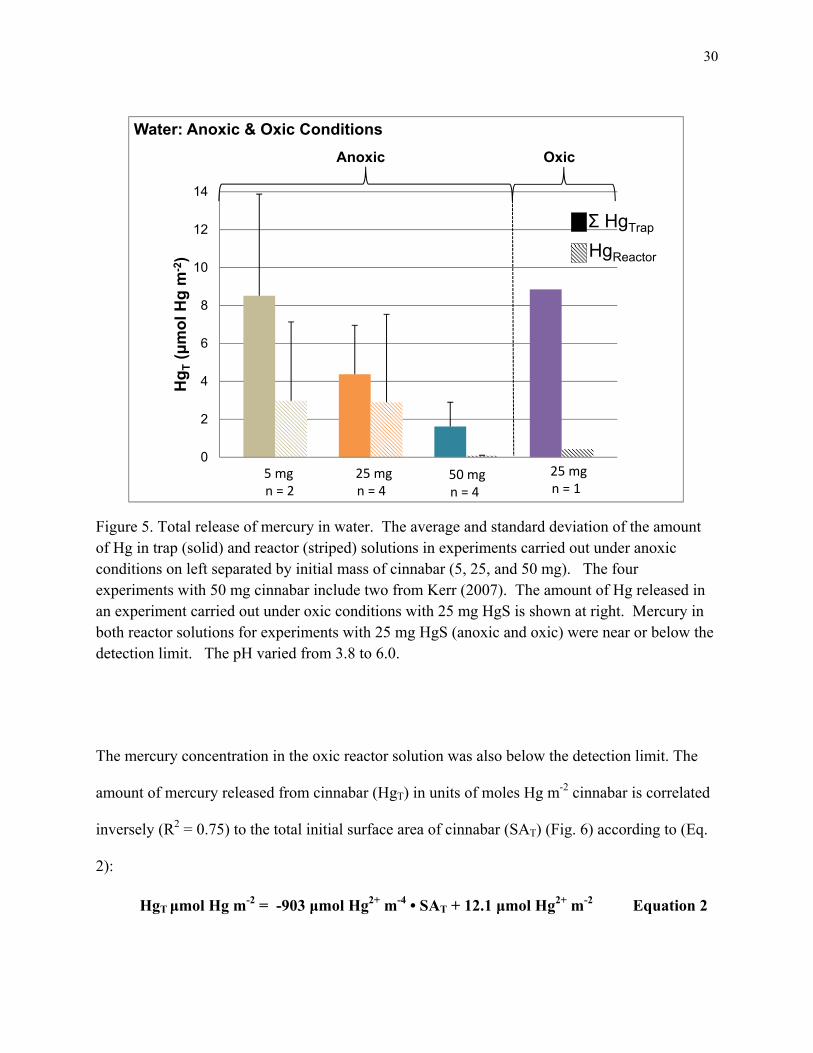
mercury in the trap solutions was greater than that in the reactor solution and on average
decreased with increasing mass of cinnabar (Fig. 5). In the reactor solutions, there was little
difference in mercury concentration in experiments with 5 or 25 mg HgS (2.98 ± 4.15 and 2.91 ±
4.64 μmol Hg m-2, respectively), and these values were near the detection limit (1 ppb). The
concentration of mercury in the reactor solution from the experiment with 50 mg HgS was below
the detection limit. Under oxic conditions with 25 mg HgS, the trap solutions contained more
mercury than in the corresponding anoxic trap solutions (Fig. 5).
24
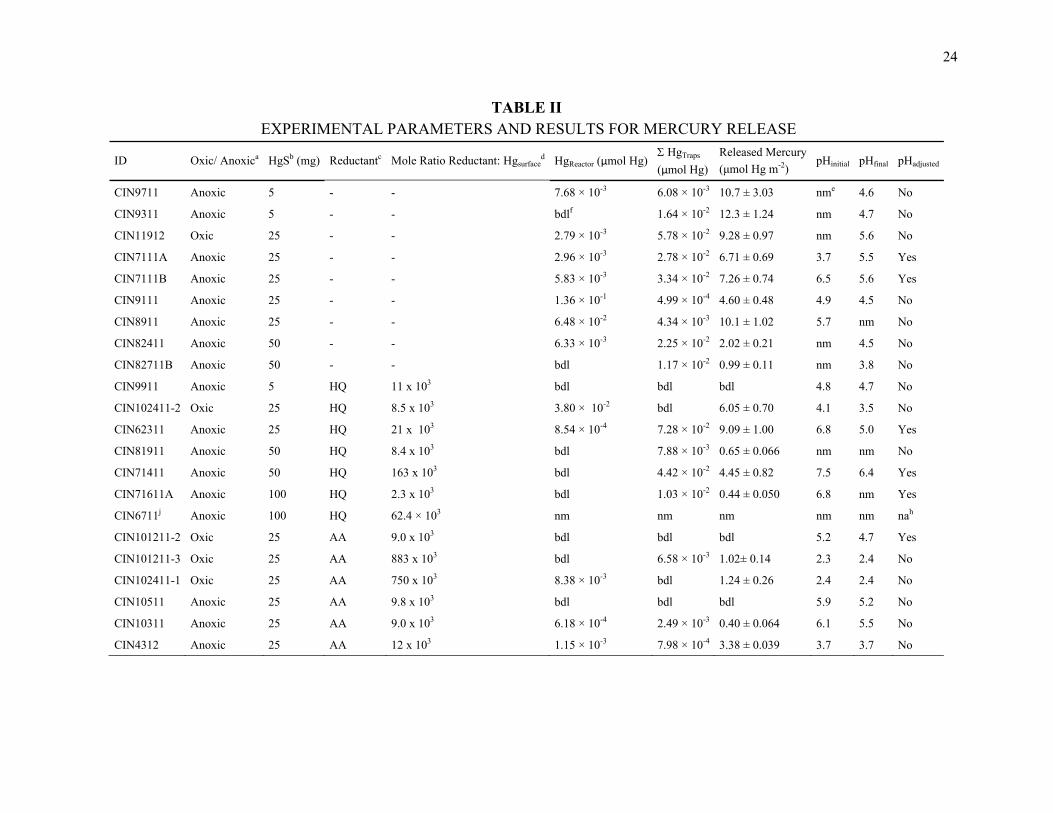
TABLE II EXPERIMENTAL PARAMETERS AND RESULTS FOR MERCURY RELEASE
ID Oxic/ Anoxica HgSb (mg) Reductantc Mole Ratio Reductant: Hgsurfaced HgReactor (μmol Hg)
HgTraps
(μmol Hg)
Released Mercury
(μmol Hg m-2) pHinitial pHfinal pHadjusted
CIN9711 Anoxic 5 - - 7.68 × 10⁻³ 6.08 × 10⁻³ 10.7 ± 3.03 nme 4.6 No
CIN9311 Anoxic 5 - - bdlf 1.64 × 10⁻² 12.3 ± 1.24 nm 4.7 No
CIN11912 Oxic 25 - - 2.79 × 10⁻³ 5.78 × 10⁻² 9.28 ± 0.97 nm 5.6 No
CIN7111A Anoxic 25 - - 2.96 × 10⁻³ 2.78 × 10⁻² 6.71 ± 0.69 3.7 5.5 Yes
CIN7111B Anoxic 25 - - 5.83 × 10⁻³ 3.34 × 10⁻² 7.26 ± 0.74 6.5 5.6 Yes
CIN9111 Anoxic 25 - - 1.36 × 10⁻¹ 4.99 × 10⁻⁴ 4.60 ± 0.48 4.9 4.5 No
CIN8911 Anoxic 25 - - 6.48 × 10⁻² 4.34 × 10⁻³ 10.1 ± 1.02 5.7 nm No
CIN82411 Anoxic 50 - - 6.33 × 10⁻³ 2.25 × 10⁻² 2.02 ± 0.21 nm 4.5 No
CIN82711B Anoxic 50 - - bdl 1.17 × 10⁻² 0.99 ± 0.11 nm 3.8 No
CIN9911 Anoxic 5 HQ 11 x 103 bdl bdl bdl 4.8 4.7 No
CIN102411-2 Oxic 25 HQ 8.5 x 10³ 3.80 × 10⁻² bdl 6.05 ± 0.70 4.1 3.5 No
CIN62311 Anoxic 25 HQ 21 x 103 8.54 × 10⁻⁴ 7.28 × 10⁻² 9.09 ± 1.00 6.8 5.0 Yes
CIN81911 Anoxic 50 HQ 8.4 x 10³ bdl 7.88 × 10⁻³ 0.65 ± 0.066 nm nm No
CIN71411 Anoxic 50 HQ 163 x 103 bdl 4.42 × 10⁻² 4.45 ± 0.82 7.5 6.4 Yes
CIN71611A Anoxic 100 HQ 2.3 x 10³ bdl 1.03 × 10⁻² 0.44 ± 0.050 6.8 nm Yes
CIN6711j Anoxic 100 HQ 62.4 × 10³ nm nm nm nm nm nah
CIN101211-2 Oxic 25 AA 9.0 x 10³ bdl bdl bdl 5.2 4.7 Yes
CIN101211-3 Oxic 25 AA 883 x 103 bdl 6.58 × 10⁻³ 1.02± 0.14 2.3 2.4 No
CIN102411-1 Oxic 25 AA 750 x 103 8.38 × 10⁻³ bdl 1.24 ± 0.26 2.4 2.4 No
CIN10511 Anoxic 25 AA 9.8 x 10³ bdl bdl bdl 5.9 5.2 No
CIN10311 Anoxic 25 AA 9.0 x 10³ 6.18 × 10⁻⁴ 2.49 × 10⁻³ 0.40 ± 0.064 6.1 5.5 No
CIN4312 Anoxic 25 AA 12 x 103 1.15 × 10⁻³ 7.98 × 10⁻⁴ 3.38 ± 0.039 3.7 3.7 No
25
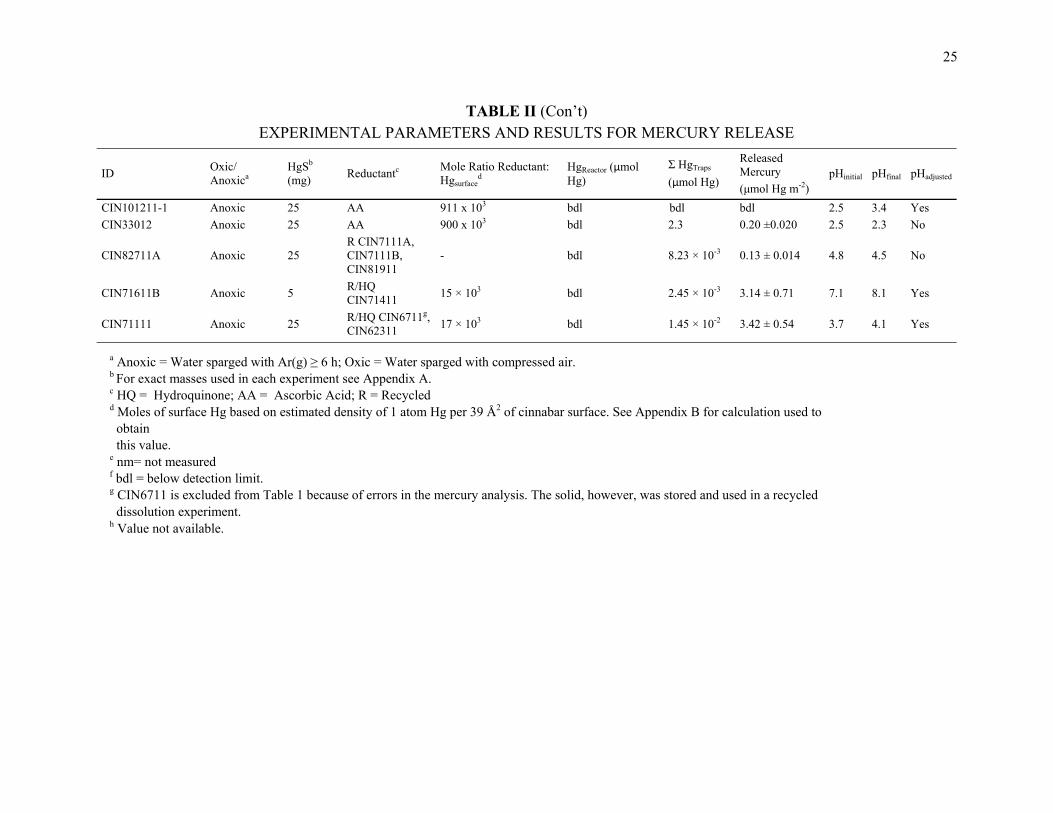
TABLE II (Con’t) EXPERIMENTAL PARAMETERS AND RESULTS FOR MERCURY RELEASE
ID Oxic/ Anoxica
HgSb (mg)
Reductantc Mole Ratio Reductant: Hgsurface
d HgReactor (μmol Hg)
Ʃ HgTraps
(μmol Hg)
Released Mercury
(μmol Hg m-2) pHinitial pHfinal pHadjusted
CIN101211-1 Anoxic 25 AA 911 x 103 bdl bdl bdl 2.5 3.4 Yes
CIN33012 Anoxic 25 AA 900 x 103 bdl 2.3 0.20 ±0.020 2.5 2.3 No
CIN82711A Anoxic 25 R CIN7111A, CIN7111B, CIN81911
- bdl 8.23 × 10⁻³ 0.13 ± 0.014 4.8 4.5 No
CIN71611B Anoxic 5 R/HQ CIN71411
15 × 103 bdl 2.45 × 10⁻³ 3.14 ± 0.71 7.1 8.1 Yes
CIN71111 Anoxic 25 R/HQ CIN6711g, CIN62311
17 × 103 bdl 1.45 × 10⁻² 3.42 ± 0.54 3.7 4.1 Yes
a Anoxic = Water sparged with Ar(g) ≥ 6 h; Oxic = Water sparged with compressed air. b For exact masses used in each experiment see Appendix A. c HQ = Hydroquinone; AA = Ascorbic Acid; R = Recycled d Moles of surface Hg based on estimated density of 1 atom Hg per 39 Å2 of cinnabar surface. See Appendix B for calculation used to obtain this value. e nm= not measured f bdl = below detection limit. g CIN6711 is excluded from Table 1 because of errors in the mercury analysis. The solid, however, was stored and used in a recycled dissolution experiment. h Value not available.
26
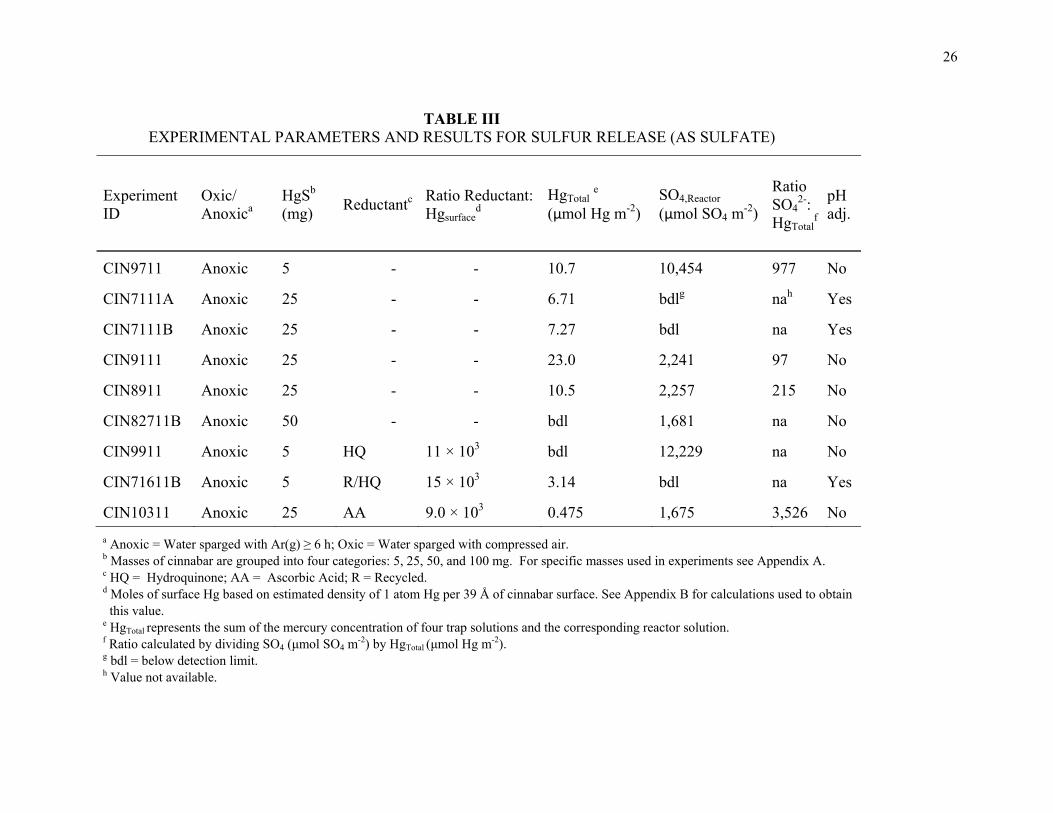
TABLE III EXPERIMENTAL PARAMETERS AND RESULTS FOR SULFUR RELEASE (AS SULFATE)
Experiment ID
Oxic/ Anoxica
HgSb (mg)
Reductantc Ratio Reductant: Hgsurface
d HgTotal
e (μmol Hg m-2)
SO4,Reactor (μmol SO4 m
-2)
Ratio SO4
2-: HgTotal
f
pH adj.
CIN9711 Anoxic 5 - - 10.7 10,454 977 No
CIN7111A Anoxic 25 - - 6.71 bdlg nah Yes
CIN7111B Anoxic 25 - - 7.27 bdl na Yes
CIN9111 Anoxic 25 - - 23.0 2,241 97 No
CIN8911 Anoxic 25 - - 10.5 2,257 215 No
CIN82711B Anoxic 50 - - bdl 1,681 na No
CIN9911 Anoxic 5 HQ 11 × 103 bdl 12,229 na No
CIN71611B Anoxic 5 R/HQ 15 × 103 3.14 bdl na Yes
CIN10311 Anoxic 25 AA 9.0 × 10³ 0.475 1,675 3,526 No
a Anoxic = Water sparged with Ar(g) ≥ 6 h; Oxic = Water sparged with compressed air. b Masses of cinnabar are grouped into four categories: 5, 25, 50, and 100 mg. For specific masses used in experiments see Appendix A. c HQ = Hydroquinone; AA = Ascorbic Acid; R = Recycled. d Moles of surface Hg based on estimated density of 1 atom Hg per 39 Å of cinnabar surface. See Appendix B for calculations used to obtain this value. e HgTotal represents the sum of the mercury concentration of four trap solutions and the corresponding reactor solution. f Ratio calculated by dividing SO4 (μmol SO4 m
-2) by HgTotal (μmol Hg m-2). g bdl = below detection limit. h Value not available.
27
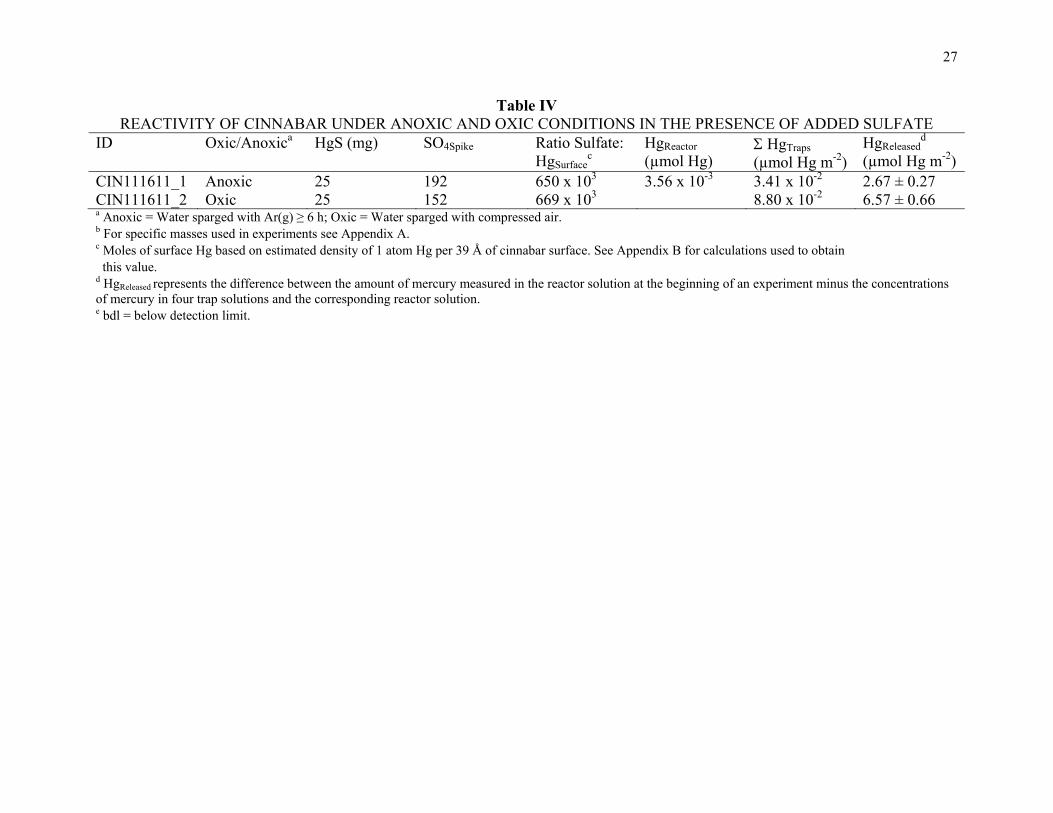
Table IV REACTIVITY OF CINNABAR UNDER ANOXIC AND OXIC CONDITIONS IN THE PRESENCE OF ADDED SULFATE
ID Oxic/Anoxica HgS (mg) SO4Spike Ratio Sulfate: HgSurface
c HgReactor
(µmol Hg) HgTraps (µmol Hg m-2)
HgReleasedd
(µmol Hg m-2) CIN111611_1 Anoxic 25 192 650 x 103 3.56 x 10⁻³ 3.41 x 10⁻² 2.67 ± 0.27 CIN111611_2 Oxic 25 152 669 x 103 8.80 x 10⁻² 6.57 ± 0.66 a Anoxic = Water sparged with Ar(g) ≥ 6 h; Oxic = Water sparged with compressed air. b For specific masses used in experiments see Appendix A. c Moles of surface Hg based on estimated density of 1 atom Hg per 39 Å of cinnabar surface. See Appendix B for calculations used to obtain this value. d HgReleased represents the difference between the amount of mercury measured in the reactor solution at the beginning of an experiment minus the concentrations of mercury in four trap solutions and the corresponding reactor solution. e bdl = below detection limit.
28
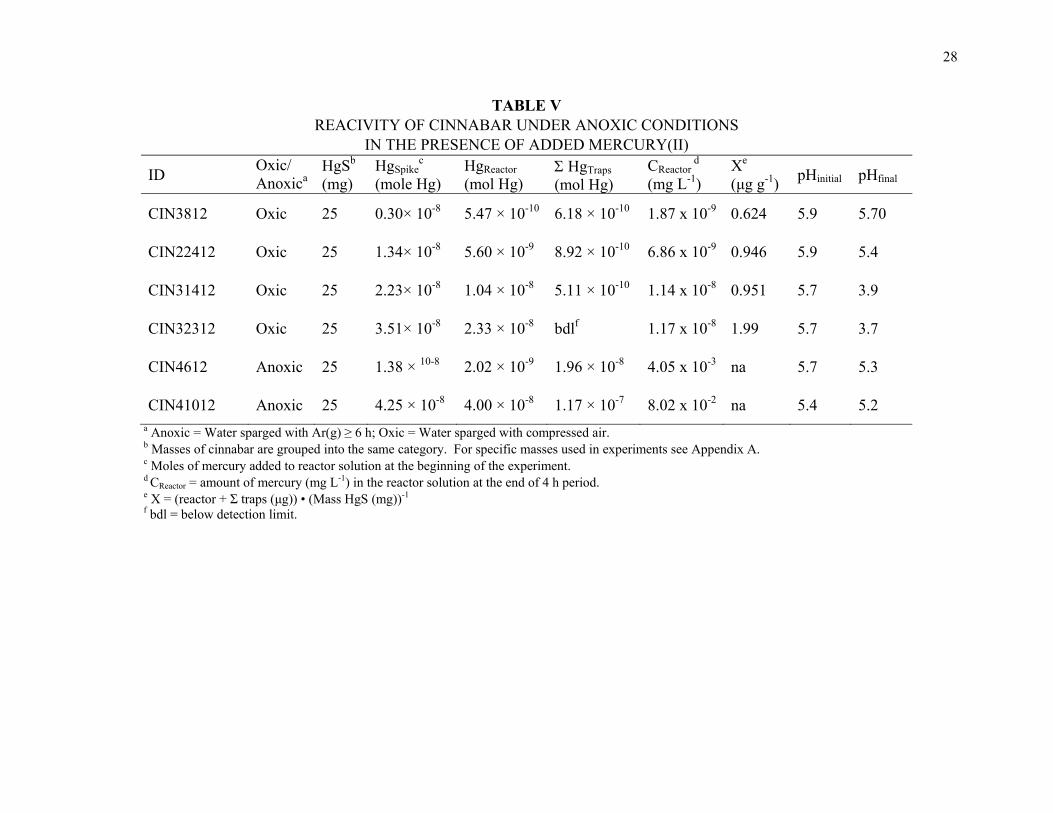
TABLE V REACIVITY OF CINNABAR UNDER ANOXIC CONDITIONS
IN THE PRESENCE OF ADDED MERCURY(II)
ID Oxic/ Anoxica
HgSb (mg)
HgSpikec
(mole Hg) HgReactor (mol Hg)
HgTraps (mol Hg)
CReactor d
(mg L-1)
Xe (μg g-1)
pHinitial pHfinal
CIN3812 Oxic 25 0.30× 10⁻⁸ 5.47 × 10⁻¹⁰ 6.18 × 10⁻¹⁰ 1.87 x 10⁻⁹ 0.624 5.9 5.70
CIN22412 Oxic 25 1.34× 10⁻⁸ 5.60 × 10⁻⁹ 8.92 × 10⁻¹⁰ 6.86 x 10⁻⁹ 0.946 5.9 5.4
CIN31412 Oxic 25 2.23× 10⁻⁸ 1.04 × 10⁻⁸ 5.11 × 10⁻¹⁰ 1.14 x 10⁻⁸ 0.951 5.7 3.9
CIN32312 Oxic 25 3.51× 10⁻⁸ 2.33 × 10⁻⁸ bdlf 1.17 x 10⁻⁸ 1.99 5.7 3.7
CIN4612 Anoxic 25 1.38 × 10⁻⁸ 2.02 × 10⁻⁹ 1.96 × 10⁻⁸ 4.05 x 10⁻³ na 5.7 5.3
CIN41012 Anoxic 25 4.25 × 10⁻⁸ 4.00 × 10⁻⁸ 1.17 × 10⁻⁷ 8.02 x 10⁻² na 5.4 5.2 a Anoxic = Water sparged with Ar(g) ≥ 6 h; Oxic = Water sparged with compressed air. b Masses of cinnabar are grouped into the same category. For specific masses used in experiments see Appendix A. c Moles of mercury added to reactor solution at the beginning of the experiment. d CReactor = amount of mercury (mg L-1) in the reactor solution at the end of 4 h period. e X = (reactor + Σ traps (μg)) • (Mass HgS (mg))-1 f bdl = below detection limit.
29
Figure 4. Release of mercury from various initial amounts of cinnabar with time. The cumulative amount of mercury released to trap solutions normalized to the total surface area of cinnabar, as a function of time is compared for experiments carried out under anoxic conditions in water with various starting masses of cinnabar. Data from Kerr (2007) (Table 6) are included for comparison.
0
2
4
6
8
10
12
14
1 2 3 4
Trap
ped
Hg
(µ
mo
l H
g m
-2)
Time (hours)
Water: Anoxic Conditions
CIN9711CIN9311CIN7111ACIN7111BCIN9111CIN8911ACIN82411MK90807MK91107CIN82711B
5 mg HgS
25 mg HgS
50 mg HgS
30
Figure 5. Total release of mercury in water. The average and standard deviation of the amount of Hg in trap (solid) and reactor (striped) solutions in experiments carried out under anoxic conditions on left separated by initial mass of cinnabar (5, 25, and 50 mg). The four experiments with 50 mg cinnabar include two from Kerr (2007). The amount of Hg released in an experiment carried out under oxic conditions with 25 mg HgS is shown at right. Mercury in both reactor solutions for experiments with 25 mg HgS (anoxic and oxic) were near or below the detection limit. The pH varied from 3.8 to 6.0.
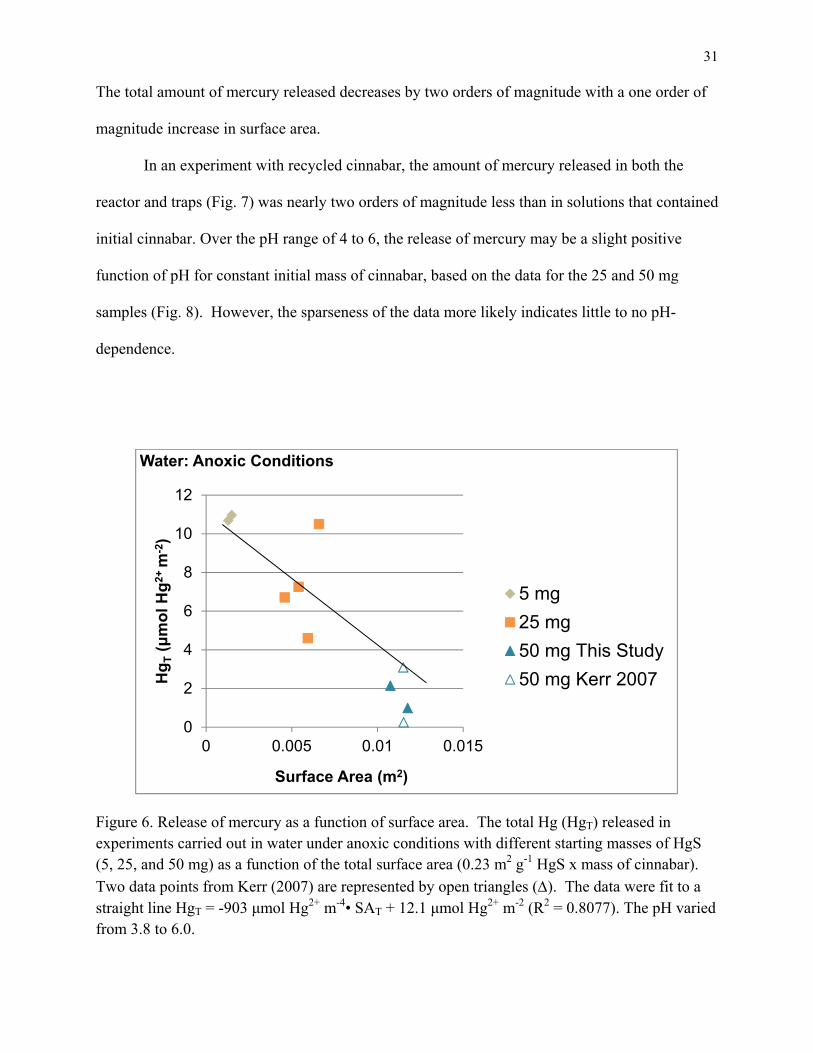
The mercury concentration in the oxic reactor solution was also below the detection limit. The
amount of mercury released from cinnabar (HgT) in units of moles Hg m-2 cinnabar is correlated
inversely (R2 = 0.75) to the total initial surface area of cinnabar (SAT) (Fig. 6) according to (Eq.
2):
HgT μmol Hg m-2 = -903 μmol Hg2+ m-4 • SAT + 12.1 μmol Hg2+ m-2 Equation 2
0
2
4
6
8
10
12
14
1
Hg
T(μ
mo
l Hg
m-2
)
Water: Anoxic & Oxic Conditions
OxicAnoxic
5 mg 25 mg 50 mg 25 mg
n = 2 n = 1n = 4n = 4
HgReactor
Ʃ HgTrap
31
The total amount of mercury released decreases by two orders of magnitude with a one order of
magnitude increase in surface area.
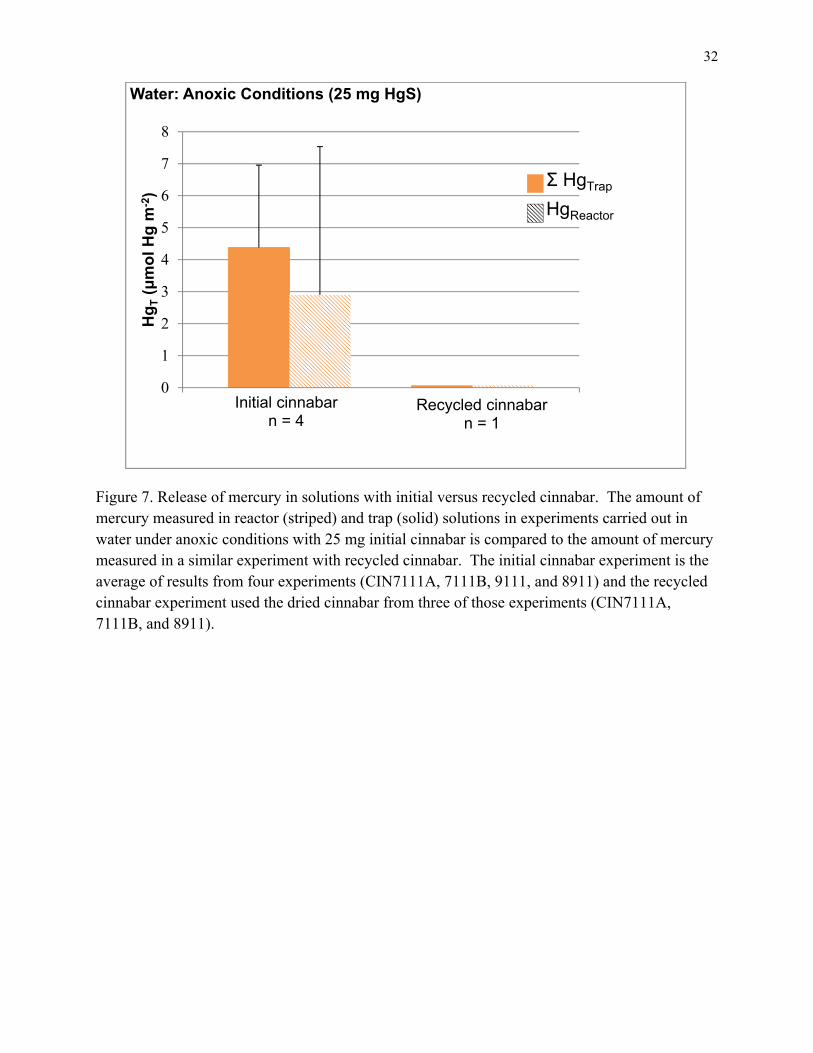
In an experiment with recycled cinnabar, the amount of mercury released in both the
reactor and traps (Fig. 7) was nearly two orders of magnitude less than in solutions that contained
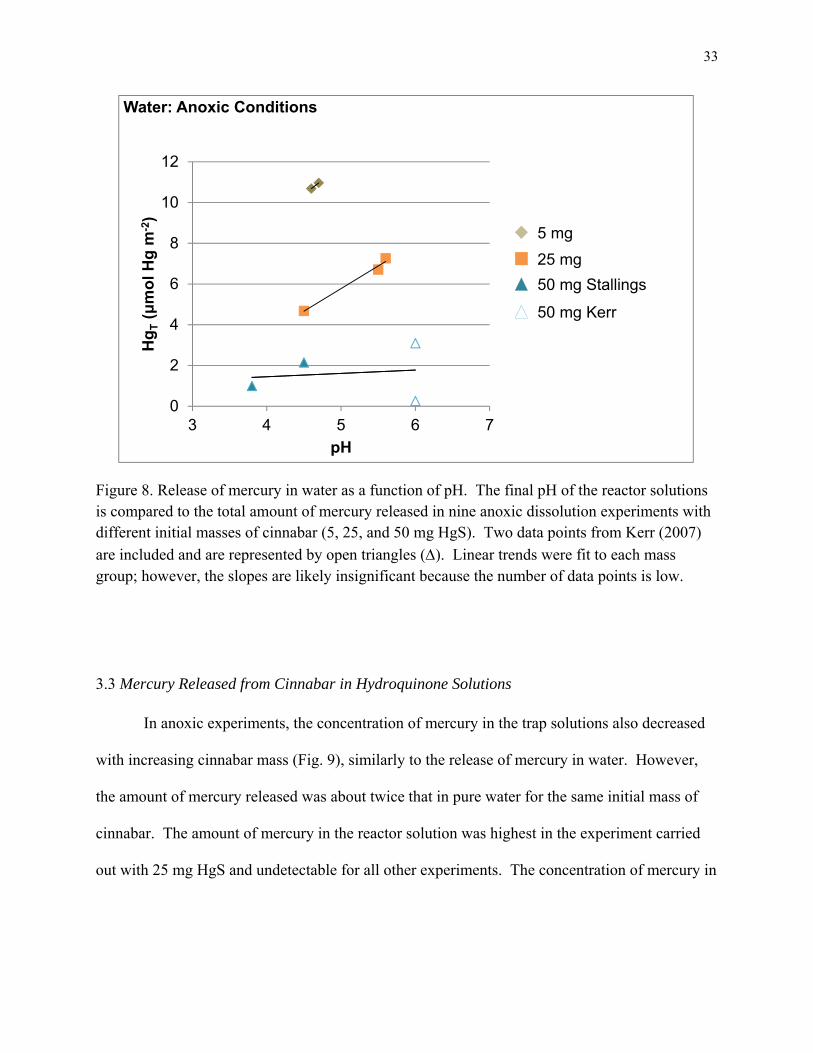
initial cinnabar. Over the pH range of 4 to 6, the release of mercury may be a slight positive
function of pH for constant initial mass of cinnabar, based on the data for the 25 and 50 mg
samples (Fig. 8). However, the sparseness of the data more likely indicates little to no pH-
dependence.
Figure 6. Release of mercury as a function of surface area. The total Hg (HgT) released in experiments carried out in water under anoxic conditions with different starting masses of HgS (5, 25, and 50 mg) as a function of the total surface area (0.23 m2 g-1 HgS x mass of cinnabar).
Two data points from Kerr (2007) are represented by open triangles (). The data were fit to a straight line HgT = -903 μmol Hg2+ m-4• SAT + 12.1 μmol Hg2+ m-2 (R2 = 0.8077). The pH varied from 3.8 to 6.0.
0
2
4
6
8
10
12
0 0.005 0.01 0.015
Hg
T(μ
mo
l Hg
2+ m
-2)
Surface Area (m2)
Water: Anoxic Conditions
5 mg
25 mg
50 mg This Study
50 mg Kerr 2007
32
Figure 7. Release of mercury in solutions with initial versus recycled cinnabar. The amount of mercury measured in reactor (striped) and trap (solid) solutions in experiments carried out in water under anoxic conditions with 25 mg initial cinnabar is compared to the amount of mercury measured in a similar experiment with recycled cinnabar. The initial cinnabar experiment is the average of results from four experiments (CIN7111A, 7111B, 9111, and 8911) and the recycled cinnabar experiment used the dried cinnabar from three of those experiments (CIN7111A, 7111B, and 8911).
0
1
2
3
4
5
6
7
8
1
Hg
T(μ
mo
l Hg
m-2
)
Water: Anoxic Conditions (25 mg HgS)
Initial cinnabarn = 4
Recycled cinnabarn = 1
HgReactor
Ʃ HgTrap
33
Figure 8. Release of mercury in water as a function of pH. The final pH of the reactor solutions is compared to the total amount of mercury released in nine anoxic dissolution experiments with different initial masses of cinnabar (5, 25, and 50 mg HgS). Two data points from Kerr (2007)
are included and are represented by open triangles (). Linear trends were fit to each mass group; however, the slopes are likely insignificant because the number of data points is low.
3.3 Mercury Released from Cinnabar in Hydroquinone Solutions
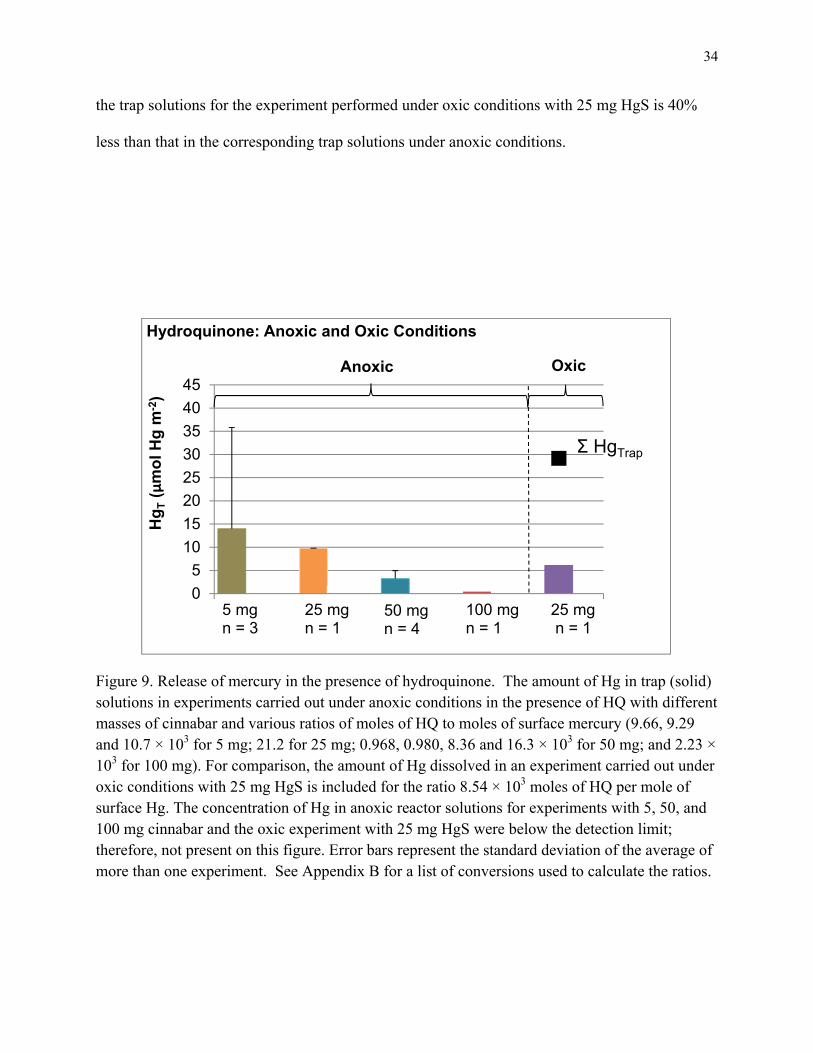
In anoxic experiments, the concentration of mercury in the trap solutions also decreased
with increasing cinnabar mass (Fig. 9), similarly to the release of mercury in water. However,
the amount of mercury released was about twice that in pure water for the same initial mass of
cinnabar. The amount of mercury in the reactor solution was highest in the experiment carried
out with 25 mg HgS and undetectable for all other experiments. The concentration of mercury in
0
2
4
6
8
10
12
3 4 5 6 7
Hg
T(μ
mo
l Hg
m-2
)
pH
Water: Anoxic Conditions
5 mg
25 mg
50 mg Stallings
50 mg Kerr
34
the trap solutions for the experiment performed under oxic conditions with 25 mg HgS is 40%
less than that in the corresponding trap solutions under anoxic conditions.
Figure 9. Release of mercury in the presence of hydroquinone. The amount of Hg in trap (solid) solutions in experiments carried out under anoxic conditions in the presence of HQ with different masses of cinnabar and various ratios of moles of HQ to moles of surface mercury (9.66, 9.29 and 10.7 × 10³ for 5 mg; 21.2 for 25 mg; 0.968, 0.980, 8.36 and 16.3 × 10³ for 50 mg; and 2.23 × 10³ for 100 mg). For comparison, the amount of Hg dissolved in an experiment carried out under oxic conditions with 25 mg HgS is included for the ratio 8.54 × 10³ moles of HQ per mole of surface Hg. The concentration of Hg in anoxic reactor solutions for experiments with 5, 50, and 100 mg cinnabar and the oxic experiment with 25 mg HgS were below the detection limit; therefore, not present on this figure. Error bars represent the standard deviation of the average of more than one experiment. See Appendix B for a list of conversions used to calculate the ratios.
0
5
10
15
20
25
30
35
40
45
1
Hg
T(μ
mo
l Hg
m-2
)
Hydroquinone: Anoxic and Oxic Conditions
5 mgn = 3
25 mgn = 1
50 mgn = 4
25 mgn = 1
100 mgn = 1
Anoxic Oxic
Ʃ HgTrap
35
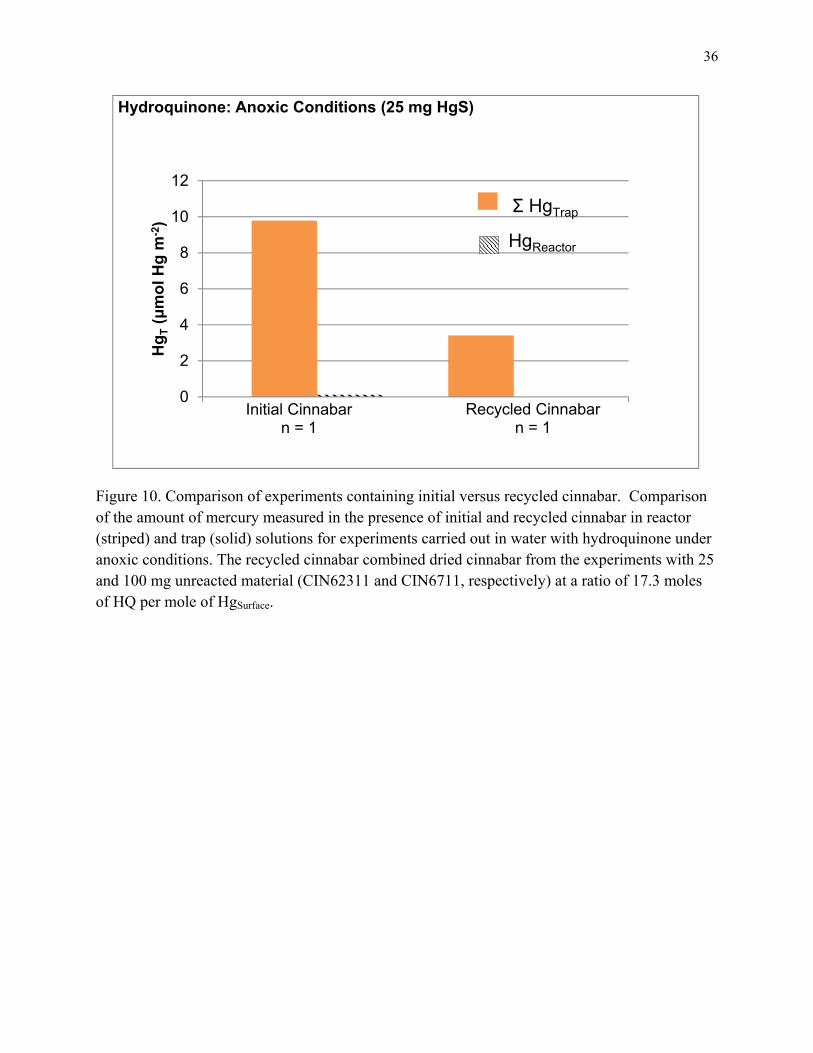
The amount of mercury released from 25 mg of recycled cinnabar in the presence of a ratio of
17.3 moles HQ per mole of HgSurface is 68% less than the amount of mercury released from fresh
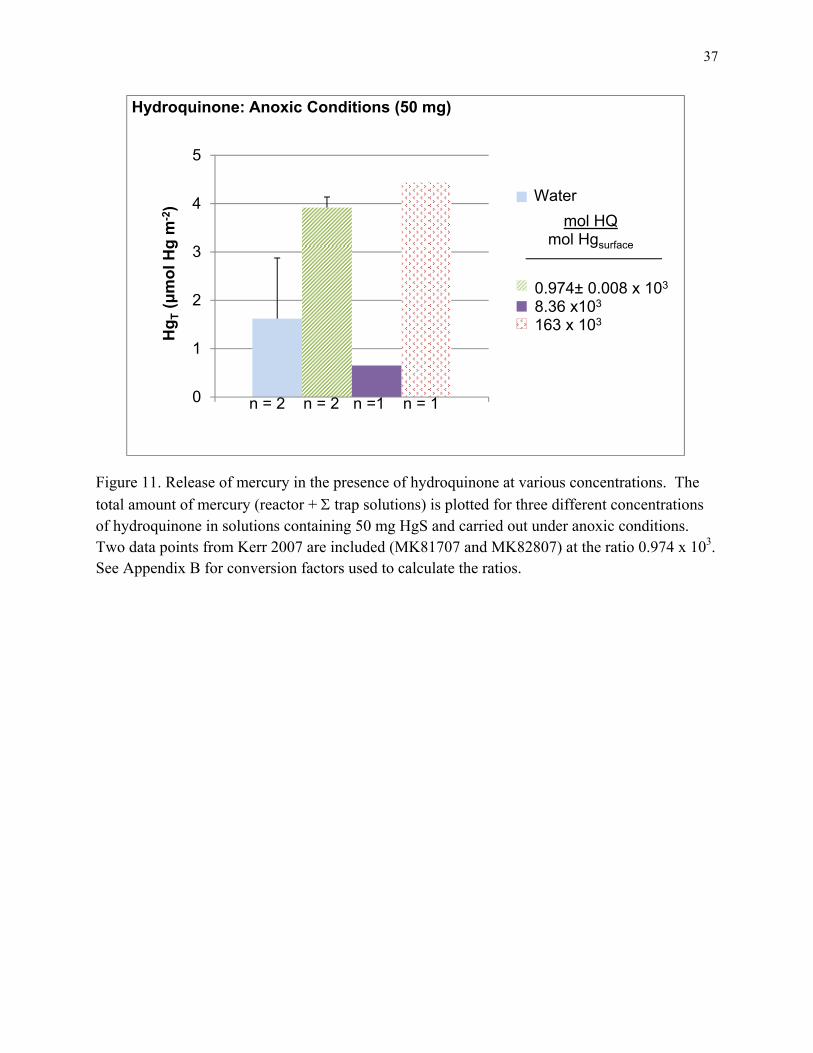
cinnabar (Fig. 10). At a constant mass of cinnabar of 50 mg, including one data set from Kerr
(2007) (MK81707 and MK82807) for the ratio 0.974 x 10³ HQ to HgSurface, there was no obvious
trend in the total amount of mercury released as a function of the concentration of hydroquinone
(Fig. 11). All of the released mercury was transferred to the trap solutions in both experiments;
neither reactor solution had detectable concentrations of mercury. The data from experiments
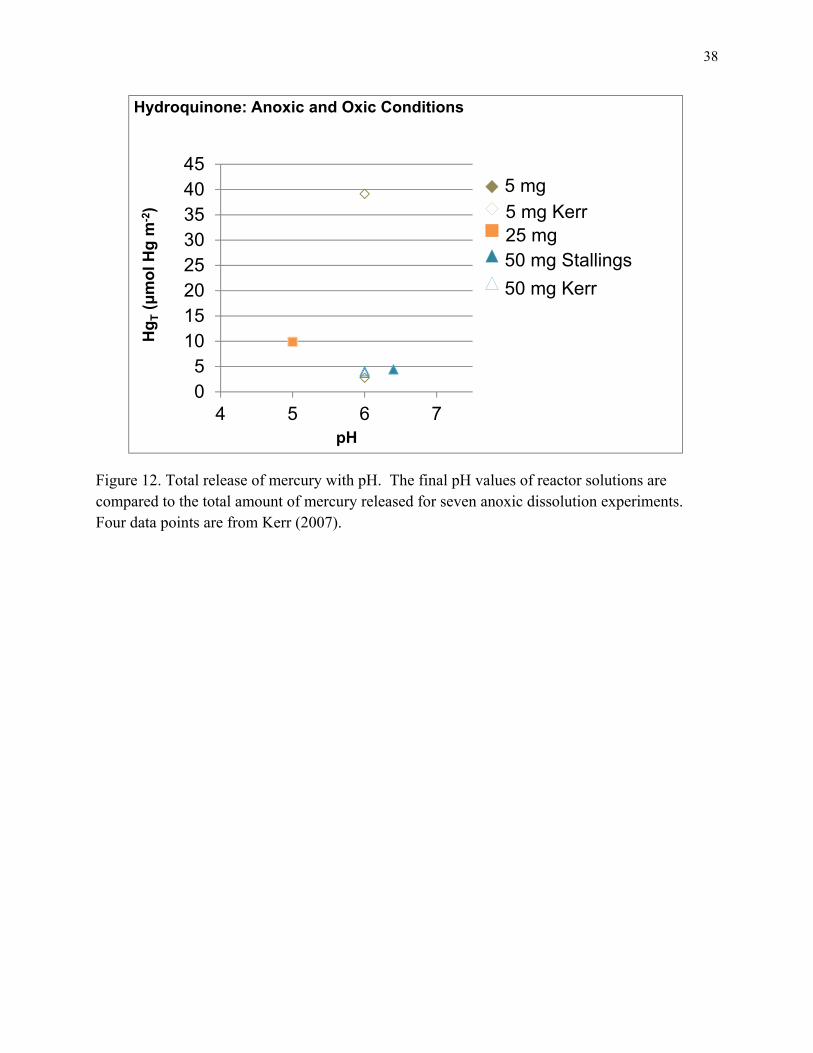
performed with 50 mg HgS suggest there is no pH-dependence to the amount of mercury
released (Fig. 12).
Compared to the experiment in pure water under anoxic conditions, the amount of
released mercury increased by approximately a factor of 2.5 to 2.7 with hydroquinone
concentrations of 0.974 x 10³ and 163 x 103. However, a hydroquinone concentration of 8.36 x
103 resulted in the same amount of released mercury within experimental uncertainty as that in
pure water.
3.4 Mercury Released from Cinnabar in Ascorbic Acid Solutions
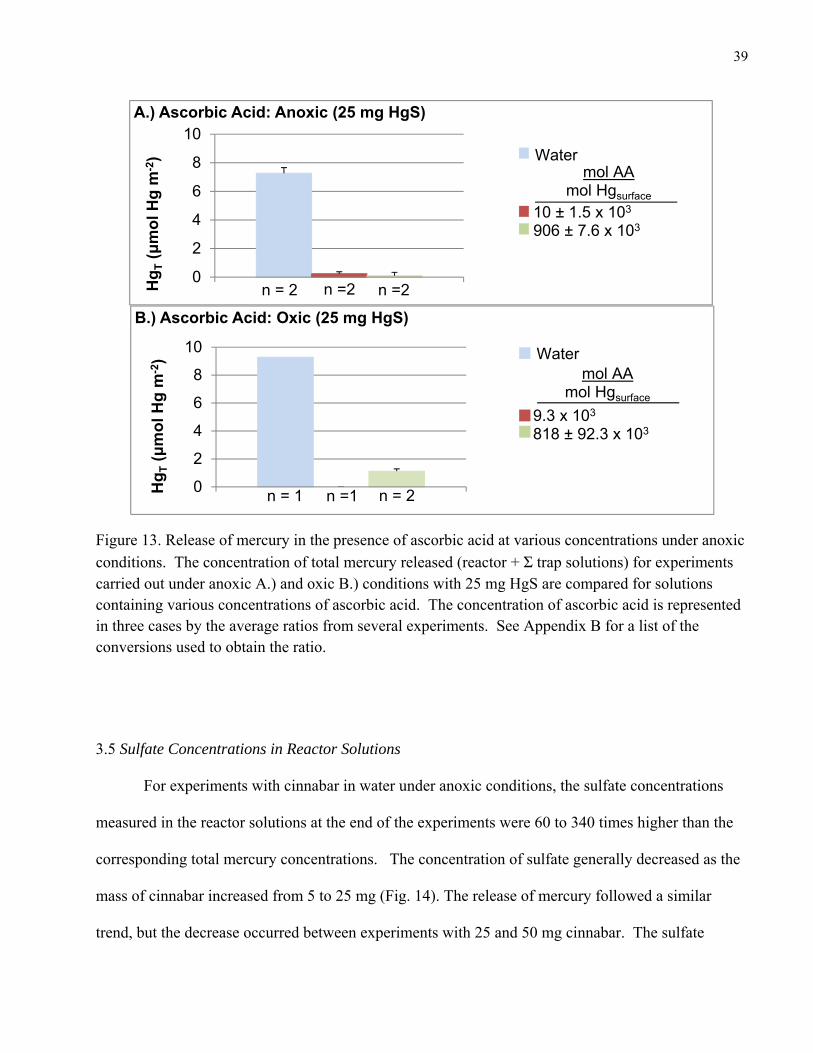
The release of mercury from cinnabar decreased by as much as two orders of magnitude
with the addition of ascorbic acid to water in anoxic experiments (Fig. 13 A). Increasing the
amount of ascorbic acid by almost two orders of magnitude from 10 x 103 to 906 x 103 decreased
the release of mercury by approximately 75%. Under oxic conditions the amount of mercury
released in solution also decreased with added ascorbic acid (Fig. 13 B).
36
Figure 10. Comparison of experiments containing initial versus recycled cinnabar. Comparison of the amount of mercury measured in the presence of initial and recycled cinnabar in reactor (striped) and trap (solid) solutions for experiments carried out in water with hydroquinone under anoxic conditions. The recycled cinnabar combined dried cinnabar from the experiments with 25 and 100 mg unreacted material (CIN62311 and CIN6711, respectively) at a ratio of 17.3 moles of HQ per mole of HgSurface.
0
2
4
6
8
10
12
1
Hg
T(μ
mo
l Hg
m-2
)
Hydroquinone: Anoxic Conditions (25 mg HgS)
Initial Cinnabarn = 1
Recycled Cinnabarn = 1
HgReactor
Ʃ HgTrap
37
Figure 11. Release of mercury in the presence of hydroquinone at various concentrations. The
total amount of mercury (reactor + trap solutions) is plotted for three different concentrations of hydroquinone in solutions containing 50 mg HgS and carried out under anoxic conditions. Two data points from Kerr 2007 are included (MK81707 and MK82807) at the ratio 0.974 x 10³. See Appendix B for conversion factors used to calculate the ratios.
0
1
2
3
4
5
1
Hg
T(μ
mo
l Hg
m-2
)
Hydroquinone: Anoxic Conditions (50 mg)
n = 2 n = 2
mol HQmol Hgsurface
Water
0.974± 0.008 x 10³
8.36 x10³
163 x 103
n = 1n =1
38
Figure 12. Total release of mercury with pH. The final pH values of reactor solutions are compared to the total amount of mercury released for seven anoxic dissolution experiments. Four data points are from Kerr (2007).
05
1015202530354045
4 5 6 7
Hg
T(μ
mo
l Hg
m-2
)
pH
Hydroquinone: Anoxic and Oxic Conditions
5 mg
25 mg 50 mg Stallings
50 mg Kerr
5 mg Kerr
39
Figure 13. Release of mercury in the presence of ascorbic acid at various concentrations under anoxic
conditions. The concentration of total mercury released (reactor + Σtrap solutions) for experiments carried out under anoxic A.) and oxic B.) conditions with 25 mg HgS are compared for solutions containing various concentrations of ascorbic acid. The concentration of ascorbic acid is represented in three cases by the average ratios from several experiments. See Appendix B for a list of the conversions used to obtain the ratio.
3.5 Sulfate Concentrations in Reactor Solutions
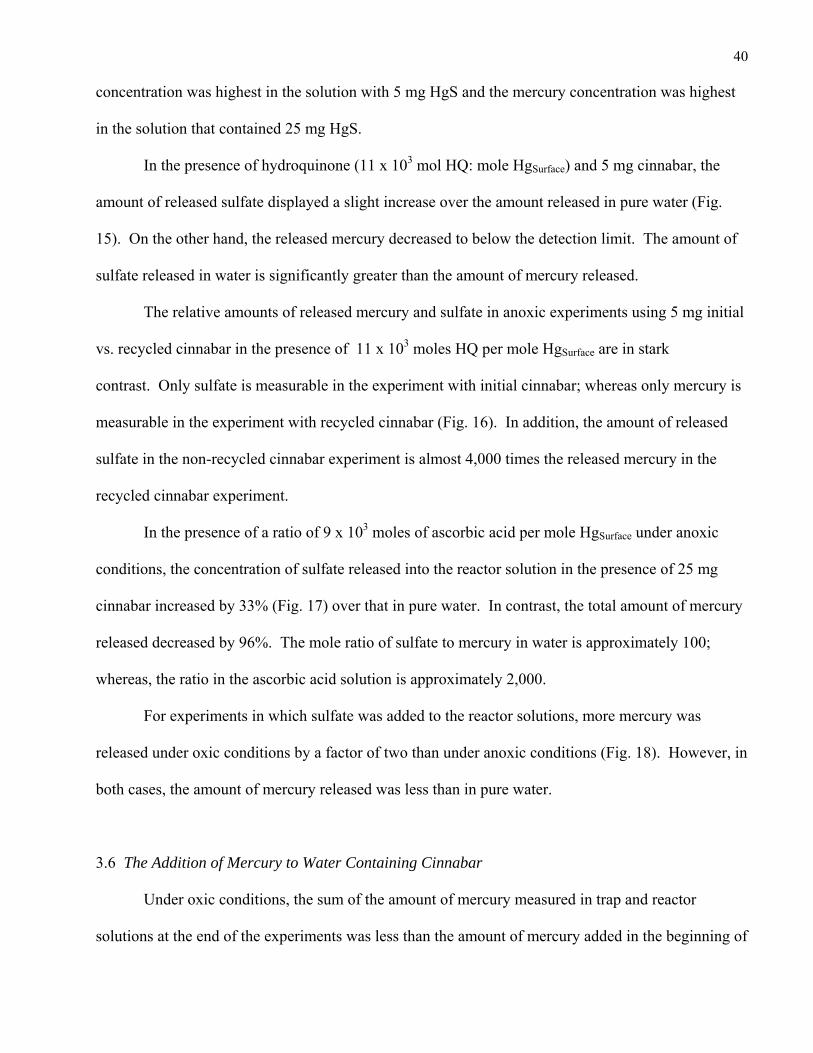
For experiments with cinnabar in water under anoxic conditions, the sulfate concentrations
measured in the reactor solutions at the end of the experiments were 60 to 340 times higher than the
corresponding total mercury concentrations. The concentration of sulfate generally decreased as the
mass of cinnabar increased from 5 to 25 mg (Fig. 14). The release of mercury followed a similar
trend, but the decrease occurred between experiments with 25 and 50 mg cinnabar. The sulfate
0
2
4
6
8
10
1
Hg
T(μ
mo
l Hg
m-2
)
A.) Ascorbic Acid: Anoxic (25 mg HgS)
n = 2 n =2
mol AAmol Hgsurface
Water
10 ± 1.5 x 10³
906 ± 7.6 x 10³
n =2
0
2
4
6
8
10
1
Hg
T(μ
mo
l Hg
m-2
)
B.) Ascorbic Acid: Oxic (25 mg HgS)
n = 1 n = 2n =1
mol AAmol Hgsurface
Water
9.3 x 10³
818 ± 92.3 x 10³
40
concentration was highest in the solution with 5 mg HgS and the mercury concentration was highest
in the solution that contained 25 mg HgS.
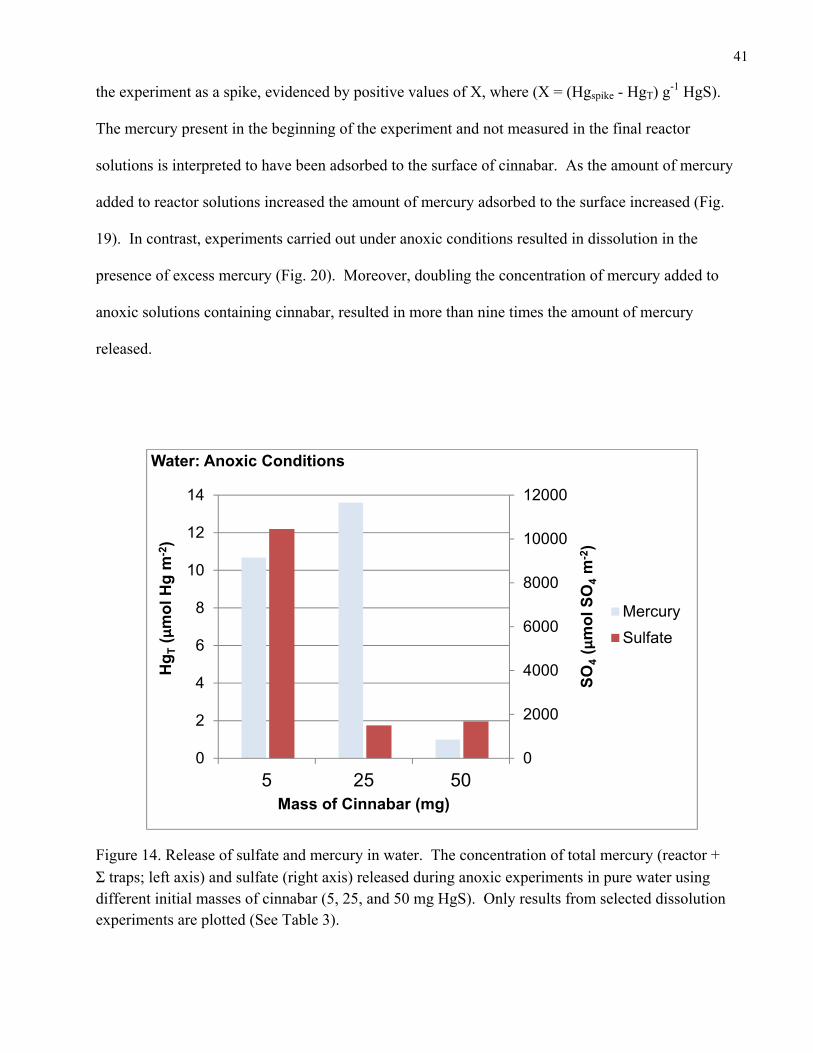
In the presence of hydroquinone (11 x 103 mol HQ: mole HgSurface) and 5 mg cinnabar, the
amount of released sulfate displayed a slight increase over the amount released in pure water (Fig.
15). On the other hand, the released mercury decreased to below the detection limit. The amount of
sulfate released in water is significantly greater than the amount of mercury released.
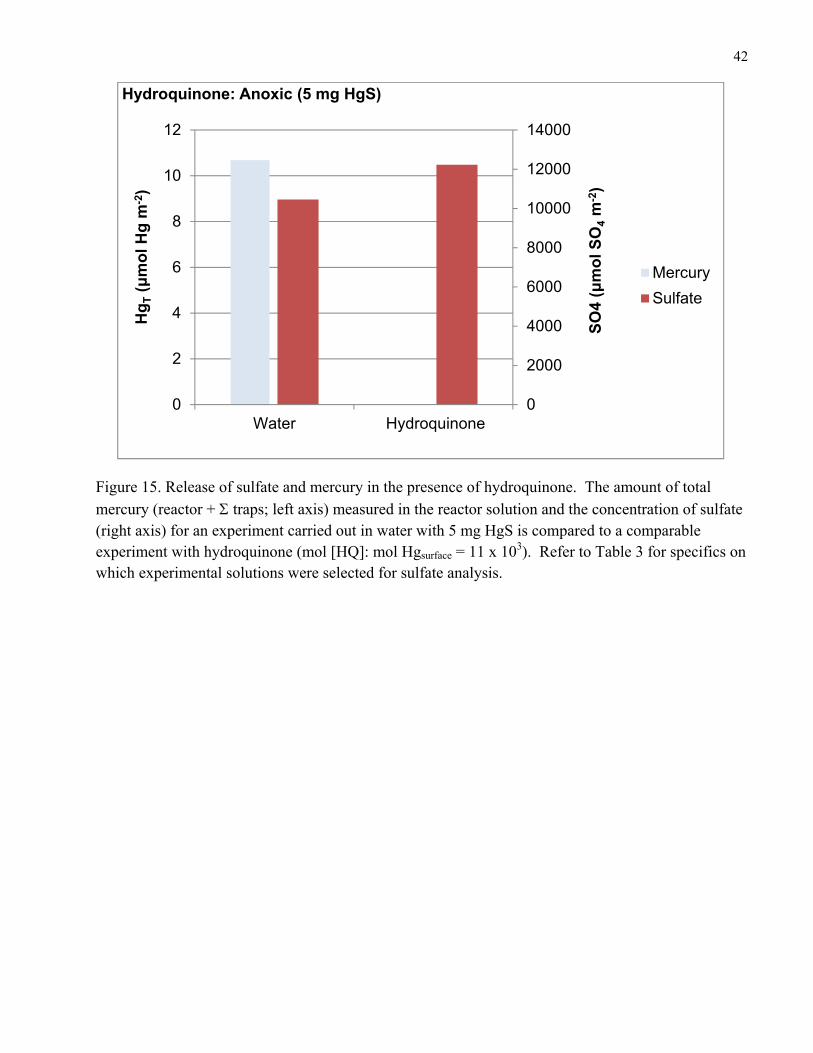
The relative amounts of released mercury and sulfate in anoxic experiments using 5 mg initial
vs. recycled cinnabar in the presence of 11 x 103 moles HQ per mole HgSurface are in stark
contrast. Only sulfate is measurable in the experiment with initial cinnabar; whereas only mercury is
measurable in the experiment with recycled cinnabar (Fig. 16). In addition, the amount of released
sulfate in the non-recycled cinnabar experiment is almost 4,000 times the released mercury in the
recycled cinnabar experiment.
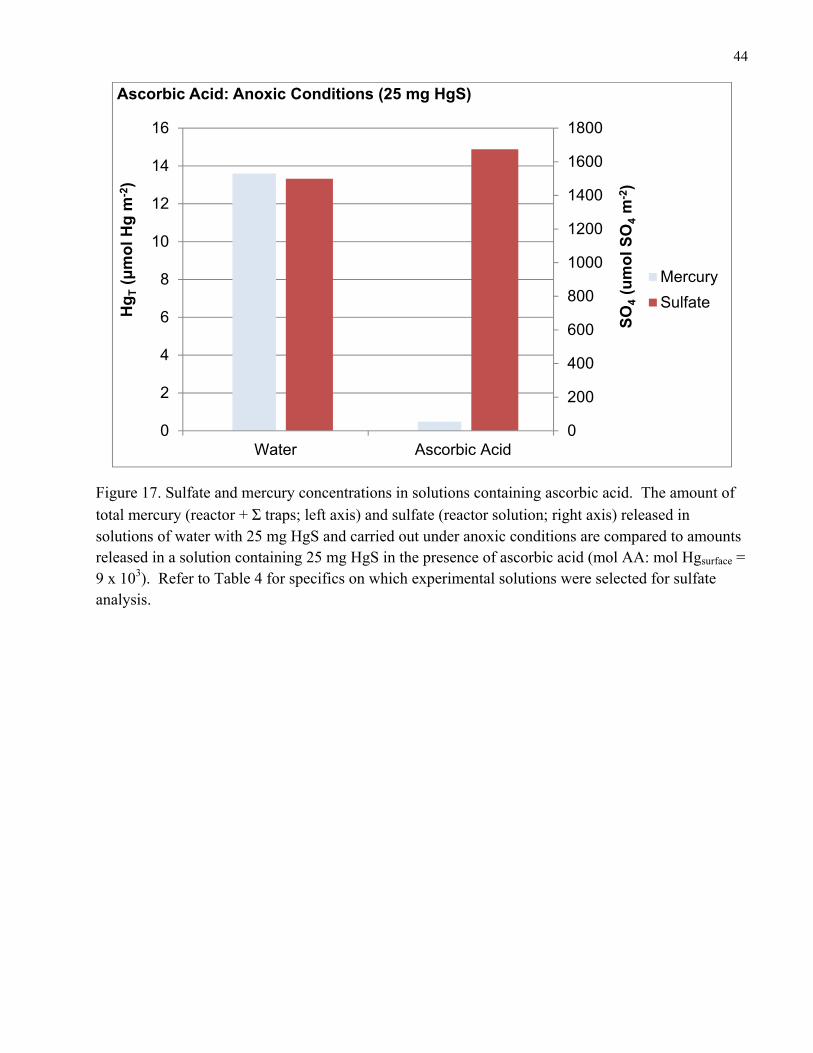
In the presence of a ratio of 9 x 10³ moles of ascorbic acid per mole HgSurface under anoxic
conditions, the concentration of sulfate released into the reactor solution in the presence of 25 mg
cinnabar increased by 33% (Fig. 17) over that in pure water. In contrast, the total amount of mercury
released decreased by 96%. The mole ratio of sulfate to mercury in water is approximately 100;
whereas, the ratio in the ascorbic acid solution is approximately 2,000.
For experiments in which sulfate was added to the reactor solutions, more mercury was
released under oxic conditions by a factor of two than under anoxic conditions (Fig. 18). However, in
both cases, the amount of mercury released was less than in pure water.
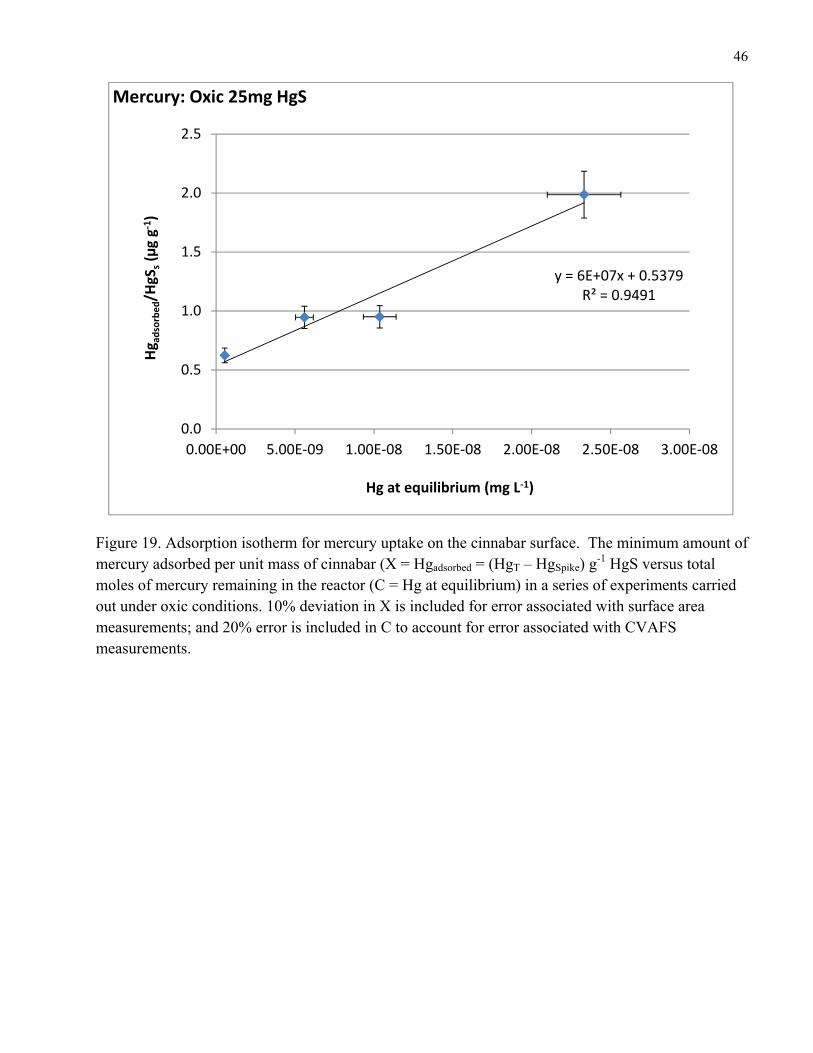
3.6 The Addition of Mercury to Water Containing Cinnabar
Under oxic conditions, the sum of the amount of mercury measured in trap and reactor
solutions at the end of the experiments was less than the amount of mercury added in the beginning of
41
the experiment as a spike, evidenced by positive values of X, where (X = (Hgspike - HgT) g-1 HgS).
The mercury present in the beginning of the experiment and not measured in the final reactor
solutions is interpreted to have been adsorbed to the surface of cinnabar. As the amount of mercury
added to reactor solutions increased the amount of mercury adsorbed to the surface increased (Fig.
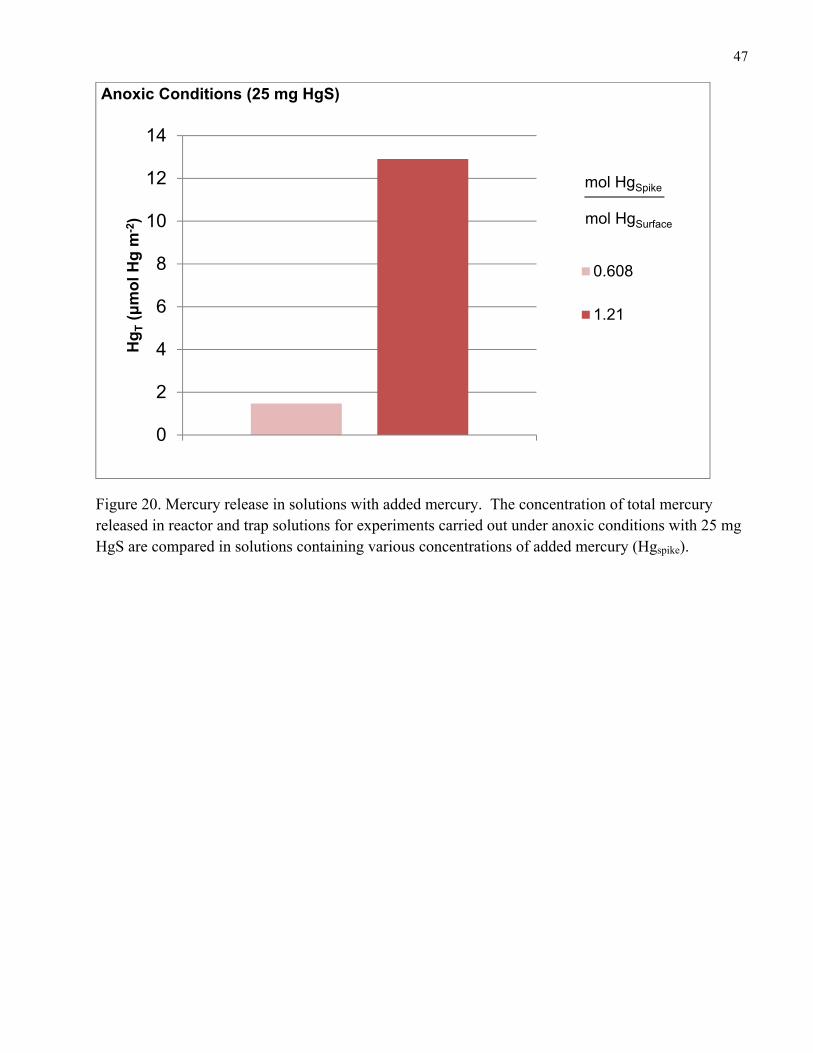
19). In contrast, experiments carried out under anoxic conditions resulted in dissolution in the
presence of excess mercury (Fig. 20). Moreover, doubling the concentration of mercury added to
anoxic solutions containing cinnabar, resulted in more than nine times the amount of mercury
released.
Figure 14. Release of sulfate and mercury in water. The concentration of total mercury (reactor +
Σtraps; left axis) and sulfate (right axis) released during anoxic experiments in pure water using different initial masses of cinnabar (5, 25, and 50 mg HgS). Only results from selected dissolution experiments are plotted (See Table 3).
0
2000
4000
6000
8000
10000
12000
0
2
4
6
8
10
12
14
5 25 50
SO
4(μ
mo
l SO
4m
-2)
Hg
T(μ
mo
l Hg
m-2
)
Mass of Cinnabar (mg)
Water: Anoxic Conditions
Mercury
Sulfate
42
Figure 15. Release of sulfate and mercury in the presence of hydroquinone. The amount of total
mercury (reactor + traps; left axis) measured in the reactor solution and the concentration of sulfate (right axis) for an experiment carried out in water with 5 mg HgS is compared to a comparable experiment with hydroquinone (mol [HQ]: mol Hgsurface = 11 x 103). Refer to Table 3 for specifics on which experimental solutions were selected for sulfate analysis.
0
2000
4000
6000
8000
10000
12000
14000
0
2
4
6
8
10
12
Water Hydroquinone
SO
4 (μ
mo
l SO
4m
-2)
Hg
T(μ
mo
l Hg
m-2
)
Hydroquinone: Anoxic (5 mg HgS)
Mercury
Sulfate
43
Figure 16. Release of sulfate and mercury in solutions with initial versus recycled cinnabar. The amount of total mercury (reactor +Σ traps; left axis) and sulfate (right axis) measured in the reactor solution and for an experiment carried out under anoxic conditions with 5 mg initial cinnabar and containing hydroquinone (mol HQ: mol Hgsurface = 11 x 103) is compared to an experiment under similar conditions with 5 mg recycled HgS (mol HQ: mol Hgsurface = 15 x 103). Refer to Table 3 for specifics on which experimental solutions were selected for sulfate analysis.
0
2000
4000
6000
8000
10000
12000
14000
0.0
0.5
1.0
1.5
2.0
2.5
3.0
3.5
Fresh Cinnabar Recycled Cinnabar
SO
4(μ
mo
l SO
4m
-2)
Hg
T(μ
mo
l Hg
m-2
)
Hydroquinone: Anoxic (5 mg HgS)
Mercury
Sulfate
Initial Cinnabar
44
Figure 17. Sulfate and mercury concentrations in solutions containing ascorbic acid. The amount of
total mercury (reactor + Σtraps; left axis) and sulfate (reactor solution; right axis) released in solutions of water with 25 mg HgS and carried out under anoxic conditions are compared to amounts released in a solution containing 25 mg HgS in the presence of ascorbic acid (mol AA: mol Hgsurface = 9 x 10³). Refer to Table 4 for specifics on which experimental solutions were selected for sulfate analysis.
0
200
400
600
800
1000
1200
1400
1600
1800
0
2
4
6
8
10
12
14
16
Water Ascorbic Acid
SO
4(u
mo
l SO
4m
-2)
Hg
T(μ
mo
l Hg
m-2
)
Ascorbic Acid: Anoxic Conditions (25 mg HgS)
Mercury
Sulfate
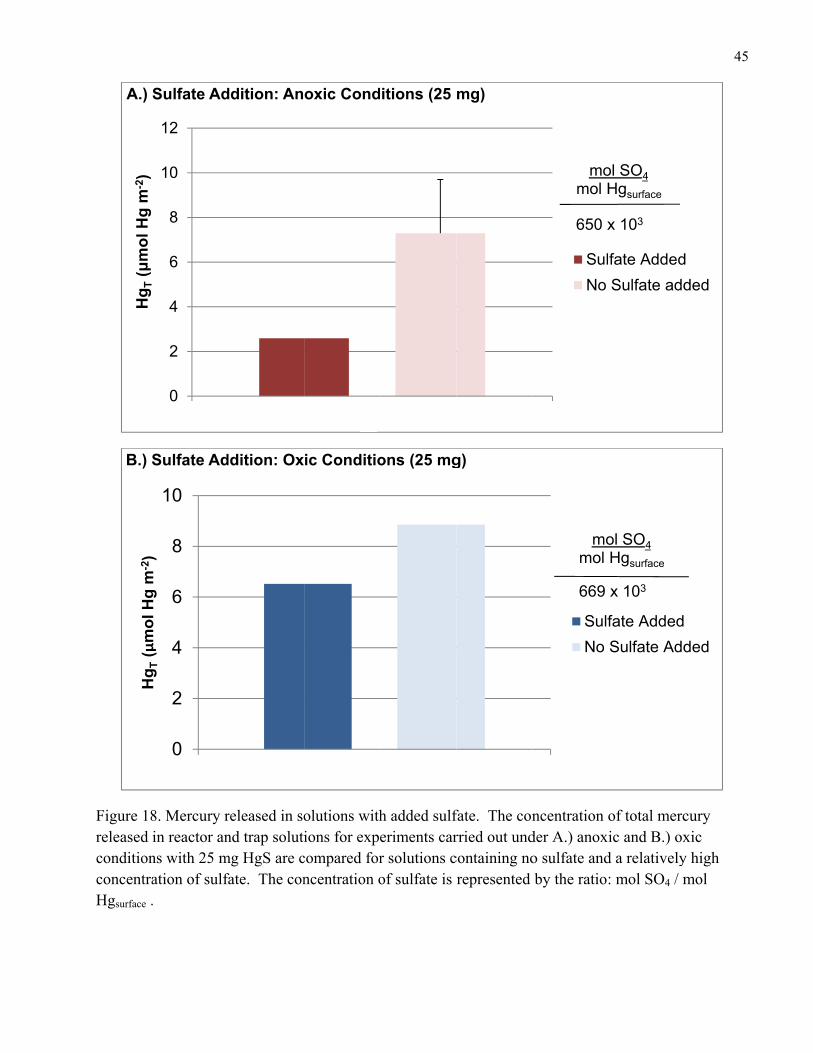
Figure 18released conditionconcentraHgsurface .
Hg
T(μ
mo
l Hg
m-2
)
A.)
Hg
T(μ
mo
lHg
m-2
)
B.)
8. Mercury rin reactor an
ns with 25 mation of sulf.
0
2
4
6
8
10
12
Sulfate Ad
0
2
4
6
8
10
Hg
T(μ
mo
l Hg
m)
Sulfate Ad
released in sond trap soluti
mg HgS are cfate. The con
ddition: An
ddition: Ox
olutions withions for expe
compared forncentration o
1
oxic Cond
1
ic Conditio
h added sulferiments carr solutions cof sulfate is
itions (25
ons (25 mg
fate. The conrried out undcontaining norepresented
mg)
g)
ncentration oder A.) anoxo sulfate andby the ratio
Sul
No
momol H
650 x
Sulf
No
669
momol
of total mercic and B.) ox
d a relatively: mol SO4 / m
fate Added
Sulfate add
ol SO4Hgsurface
x 103
fate Added
Sulfate Add
x 103
ol SO4Hgsurface
45
cury xic y high mol
d
ded
ded
46
Figure 19. Adsorption isotherm for mercury uptake on the cinnabar surface. The minimum amount of mercury adsorbed per unit mass of cinnabar (X = Hgadsorbed = (HgT – HgSpike) g
-1 HgS versus total moles of mercury remaining in the reactor (C = Hg at equilibrium) in a series of experiments carried out under oxic conditions. 10% deviation in X is included for error associated with surface area measurements; and 20% error is included in C to account for error associated with CVAFS measurements.
y = 6E+07x + 0.5379R² = 0.9491
0.0
0.5
1.0
1.5
2.0
2.5
0.00E+00 5.00E‐09 1.00E‐08 1.50E‐08 2.00E‐08 2.50E‐08 3.00E‐08
Hg a
dsorbed/H
gSs(µg g‐
1)
Hg at equilibrium (mg L‐1)
Mercury: Oxic 25mg HgS
47
Figure 20. Mercury release in solutions with added mercury. The concentration of total mercury released in reactor and trap solutions for experiments carried out under anoxic conditions with 25 mg HgS are compared in solutions containing various concentrations of added mercury (Hgspike).
0
2
4
6
8
10
12
14
1
Hg
T(μ
mo
l Hg
m-2
)
Anoxic Conditions (25 mg HgS)
0.608
1.21
mol HgSpike
mol HgSurface
48
IV. DISCUSSION
4.1 Introduction
The scope of this thesis was limited to quantifying the release of mercury from cinnabar
under selected experimental conditions relevant to oxic/anoxic interfaces in the environment.
The data were used to characterize the types of surface reaction mechanisms that likely
controlled the release. These include mechanisms that are sensitive to redox conditions, the
extent of cinnabar particle aggregation, the presence of hydroquinone or ascorbic acid, and
whether or not the cinnabar was used in initial form or recycled after reacting for a 4 h period.
The discussion topics will begin with the release of mercury from cinnabar under anoxic and
oxic conditions; followed by surface reaction mechanisms, including, how changes in surface
area affect mercury and sulfur release; and, lastly, the implications of recycling the cinnabar
surface.
4.2 Reduction of Mercury
4.2.1 Anoxic Conditions
It was expected that cinnabar in the presence of hydroquinone (HQ) and ascorbic acid
(AA) would release a significant amount of mercury into solution (Kerr 2007; Waples et al.,
2005). The dissolution of mercury from the surface may occur through one of two possible
mechanisms: the reduction of mercury or the oxidation of sulfide and subsequent
weakening of the Hg-S bond. According to one set of redox reactions pertinent to certain
environmental conditions (Fig. 21), the dissolution of cinnabar should not be possible through
the reduction of mercury by hydroquinone or ascorbic acid. However, the presence of similar
aromatic and conjugated moieties in DOM, and the correlation of the aromaticity of DOM with
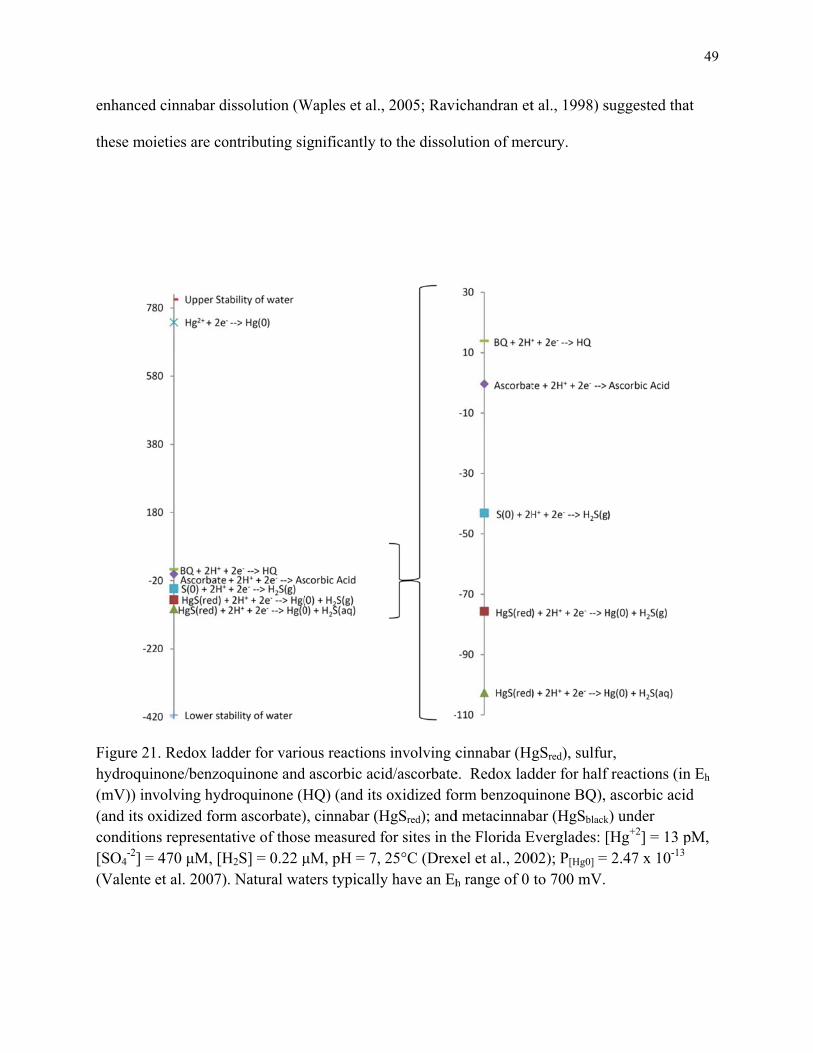
enhanced
these mo
Figure 21hydroqui(mV)) in(and its ocondition[SO4
-2] =(Valente
Eh (mV)
d cinnabar di
oieties are co
1. Redox ladinone/benzoqvolving hyd
oxidized formns representa= 470 μM, [H
et al. 2007)
issolution (W
ontributing si
dder for varioquinone and
droquinone (Hm ascorbate)ative of thoseH2S] = 0.22 μ. Natural wa
Waples et al.
ignificantly t
ous reactiond ascorbic acHQ) (and its), cinnabar (He measured μM, pH = 7,aters typically
, 2005; Ravi
to the dissol
s involving cid/ascorbate
s oxidized foHgSred); andfor sites in th 25°C (Drexy have an Eh
ichandran et
lution of mer
cinnabar (Hge. Redox ladorm benzoqud metacinnabhe Florida E
xel et al., 200
h range of 0
t al., 1998) s
rcury.
gSred), sulfurdder for half uinone BQ), bar (HgSblack
Everglades: [02); P[Hg0] = to 700 mV.
suggested tha
r, f reactions (in
ascorbic aci
k) under [Hg+2] = 13 p2.47 x 10-13
49
at
n Eh id
pM,
50
Hydroquinone and ascorbic acid, the two model compounds for aromatic/conjugated
moieties investigated in this study, behave differently under redox conditions. Hydroquinone is
resistant to oxidation at the pH conditions of this experiment (pH = 2 to 8) because of the high
value of the equilibrium constant for its first acid dissociation (pKa1 = 10.1). Conversely, it is
generally accepted that ascorbic acid prevents oxidation by reducing dissolved oxygen, which
implies that AA itself is highly susceptible to being oxidized. By comparing results of cinnabar
dissolution in the presence of these two different molecules it is possible to make some
assessment of the sensitivity of the cinnabar surface to oxidation state of the solution. If the
dissolution of cinnabar occurs through the oxidation of sulfide, we should observe decreased
release of mercury in the presence of AA compared to pure water because the primary oxidant in
solution, dissolved oxygen, should be consumed by the AA and not the sulfide. There should be
no effect on the release of mercury in the presence of HQ compared to pure water, because HQ
does not react with dissolved oxygen under these conditions.
Stack et al. (2004) provided a general description of the reaction mechanism between an
oxidized iron site in hematite and HQ: adsorption of HQ to the iron surface site; electron transfer
(forming a semiquinone radical and reduced iron); desorption of the semiquinone; and
dissolution of the reduced iron. If the dissolution of cinnabar were to occur through the
reduction of mercury, we would expect to observe increased dissolution of cinnabar in the
presence of HQ and AA since they are both reductants. Moreover, as the amount of reducing
agent is increased the amount of mercury released from the surface of the mineral should also
increase. Also, because the reducing power of the reductant should be depleted over time, the
dissolution of mercury from the surface should cease.
51
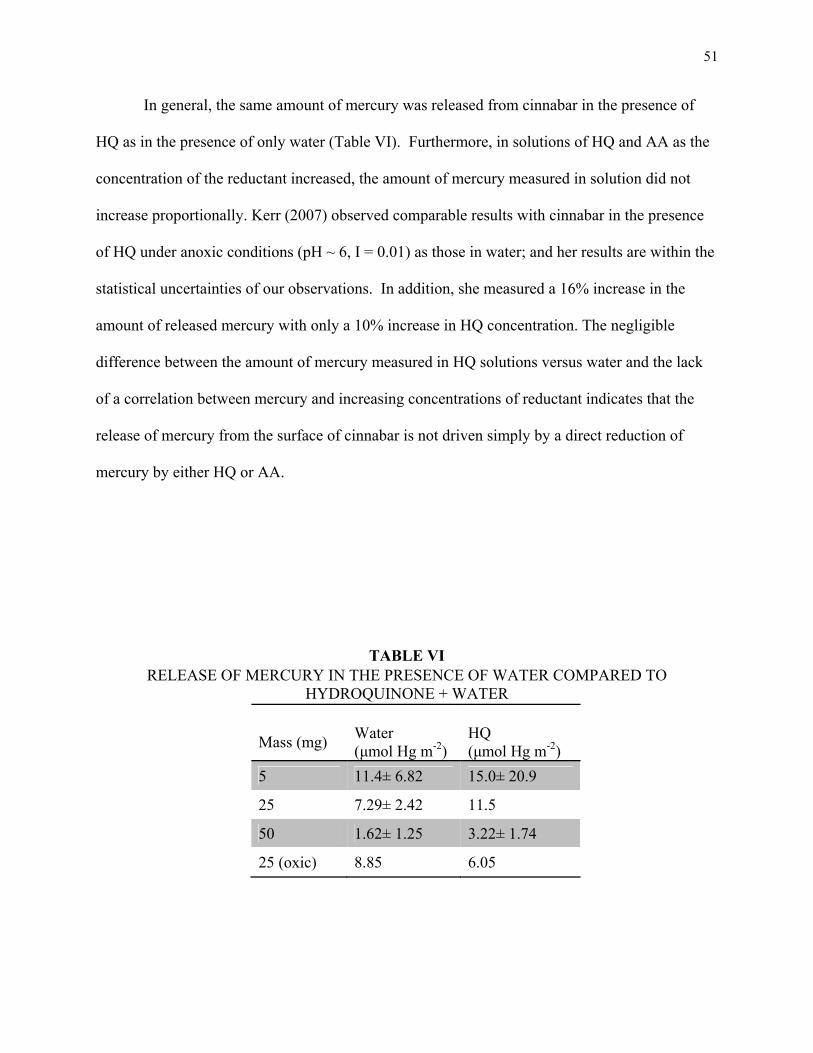
In general, the same amount of mercury was released from cinnabar in the presence of
HQ as in the presence of only water (Table VI). Furthermore, in solutions of HQ and AA as the
concentration of the reductant increased, the amount of mercury measured in solution did not
increase proportionally. Kerr (2007) observed comparable results with cinnabar in the presence
of HQ under anoxic conditions (pH ~ 6, I = 0.01) as those in water; and her results are within the
statistical uncertainties of our observations. In addition, she measured a 16% increase in the
amount of released mercury with only a 10% increase in HQ concentration. The negligible
difference between the amount of mercury measured in HQ solutions versus water and the lack
of a correlation between mercury and increasing concentrations of reductant indicates that the
release of mercury from the surface of cinnabar is not driven simply by a direct reduction of
mercury by either HQ or AA.
TABLE VI RELEASE OF MERCURY IN THE PRESENCE OF WATER COMPARED TO
HYDROQUINONE + WATER
Mass (mg)
Water (μmol Hg m-2)
HQ (μmol Hg m-2)
5 11.4± 6.82 15.0± 20.9
25 7.29± 2.42 11.5
50 1.62± 1.25 3.22± 1.74
25 (oxic) 8.85 6.05
52
Further, high concentrations of mercury in reactor solutions containing water versus an
HQ solution suggest that HQ does not reduce mercury even after it has been released from
cinnabar. It may be possible that HQ prevents mercury from being reduced and transported to
the trap solution by forming an aqueous complex; therefore, resulting in less mercury in the trap
solution and more soluble mercury measured in the reactor, while maintaining the same overall
concentrations of mercury for experiments containing water versus HQ.
The release of mercury from cinnabar significantly decreased in the presence of AA for
experiments carried out under both oxic and anoxic conditions. Significant decreases in the
amount of mercury released in the presence of increasing concentrations of AA indicate the
importance of oxygen in the dissolution mechanism and further support that the idea that the
mechanism is not controlled by a direct interaction between AA and the surface of cinnabar. If
oxygen is a major limiting factor, then the amount of mercury released during dissolution of
cinnabar may be limited by the oxidation of sulfide within the mineral structure.
Banwart et al. (1989) observed increased reductive dissolution of hematite in the
presence of increasing concentrations of ascorbate (ascorbic acid at pH 3) (I = 0.01 M NaNO3,
pH = 3, 25°C, SA = 17.5 m2 g-1). Moreover, the addition of oxalate and ascorbate together
resulted in an amount of dissolved iron that was greater than the sum of the amounts produced by
the two reactants individually. These authors hypothesized that oxalate acted as a chelating
agent and aided in the reduction and release of iron. These results indicate that HQ and AA
cannot directly bind with the surface and may only indirectly affect dissolution; or that HQ and
AA bind to the surface for an electron transfer reaction, but do not bind with the Hg once it is
released from the surface.
53
The release of mercury decreased significantly after typically two hours of reaction time
for all experiments (Fig. 22) in agreement with Kerr’s (2007) observations. Together, the results
indicate that the dissolution of cinnabar depends on the amount of reactive surface sites exposed
and how the number of reactive surface sites is altered over time. Echigo et al. (2012) observed
steady-state reaction rates of two different sized hematite nanoparticles (6.8 nm and 30.5 nm)
after 210 minutes of reaction time during batch experiments carried out under dark, anoxic
conditions (2 g L-1 hematite, I = 10 mM, pH = 3.35, T = 23.0± 0.03). They observed increased
aggregation between particles as time passed; and significant changes in particle morphology
over time, including rounding of the grains. It is possible that the reaction of HQ and AA with
mercury and/or sulfur at the cinnabar surface diminishes with time either because molecules bind
to the surface and decrease the amount of reactive surface available for subsequent
reduction/oxidation; or physical changes in the surface decrease the amount of exposed reactive
surface sites.
Altogether, the results indicate that hydroquinone and ascorbic acid are indirectly
participating in the surface mechanism that controls dissolution. It seems more likely that the
mechanism for dissolution is controlled by the oxidation of sulfur, and any species that interferes
with the oxidation of sulfur, also inhibits the dissolution of cinnabar. Protons (H+) are also able
to bind to reduced sulfur sites on the surface of cinnabar and can compete with oxidants in
solution for reduced sulfur sites. If H+ reacts with surface reduced sulfur, then this sulfur
becomes less likely to react with other species in solution, such as the oxidized like
benzoquinone and ascorbate. However, when comparing the concentration of mercury released
from cinnabar in solutions that received pH adjustments to those that did not (Fig. 23) the effect
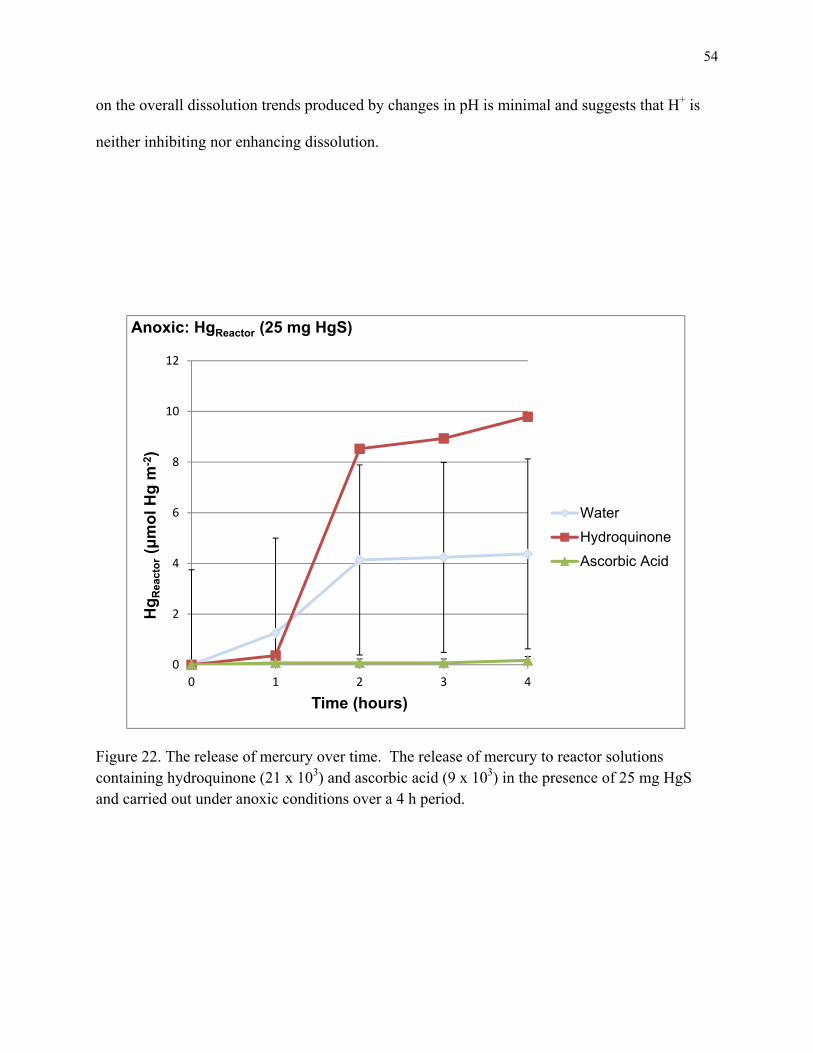
54
on the overall dissolution trends produced by changes in pH is minimal and suggests that H+ is
neither inhibiting nor enhancing dissolution.
Figure 22. The release of mercury over time. The release of mercury to reactor solutions containing hydroquinone (21 x 103) and ascorbic acid (9 x 10³) in the presence of 25 mg HgS and carried out under anoxic conditions over a 4 h period.
0
2
4
6
8
10
12
0 1 2 3 4
Hg
Rea
cto
r(μ
mo
l Hg
m-2
)
Time (hours)
Anoxic: HgReactor (25 mg HgS)
Water
Hydroquinone
Ascorbic Acid
55
4.2.2 Oxic Conditions
The results from the anoxic experiments indicated that increased amounts of mercury
would be released in oxygenated environments because sulfur is highly reactive with dissolved
oxygen. Assuming that the dominant reaction controlling dissolution is that between an oxidant
and reduced sulfur on the surface, the presence of HQ (in the most reduced state; pH < pKa1 <
10.16) should not have affected the amount of mercury released to solution, as observed. If
oxygen mediates the dissolution reaction, and ascorbic acid scavenges the oxygen in solution,
then decreased release of mercury in the presence of AA is expected and as also observed.
Overall, oxidizing species are expected to react with reduced sulfur to a greater degree than the
reductant with mercury thereby controlling the dissolution mechanism.
The same amount of mercury was released from 25 mg HgS in water under anoxic
conditions as in water under oxic conditions (7.27± 2.44 μmol Hg m-2 and 9.28 μmol Hg m-2,
respectively); and approximately the same amount of mercury was released in solutions
containing hydroquinone in anoxic compared to oxic conditions (9.90 μmol Hg m-2 at a ratio of
8.85 x 10³ moles HQ: moles HgSurface and 6.05 μmol Hg m-2 at a ratio of 21 x 103 moles HQ:
moles HgSurface respectively). However, significantly less mercury was released in ascorbic acid
solutions under anoxic conditions when compared to oxic conditions (0.098± 0.14 μmol Hg m-2
and 1.13± 0.16 μmol Hg m-2, respectively). These comparisons further support the interpretation
that ascorbic acid scavenges oxygen and prevents the oxidation of reduced sulfur on the cinnabar
surface, thereby, decreasing the amount of mercury released.
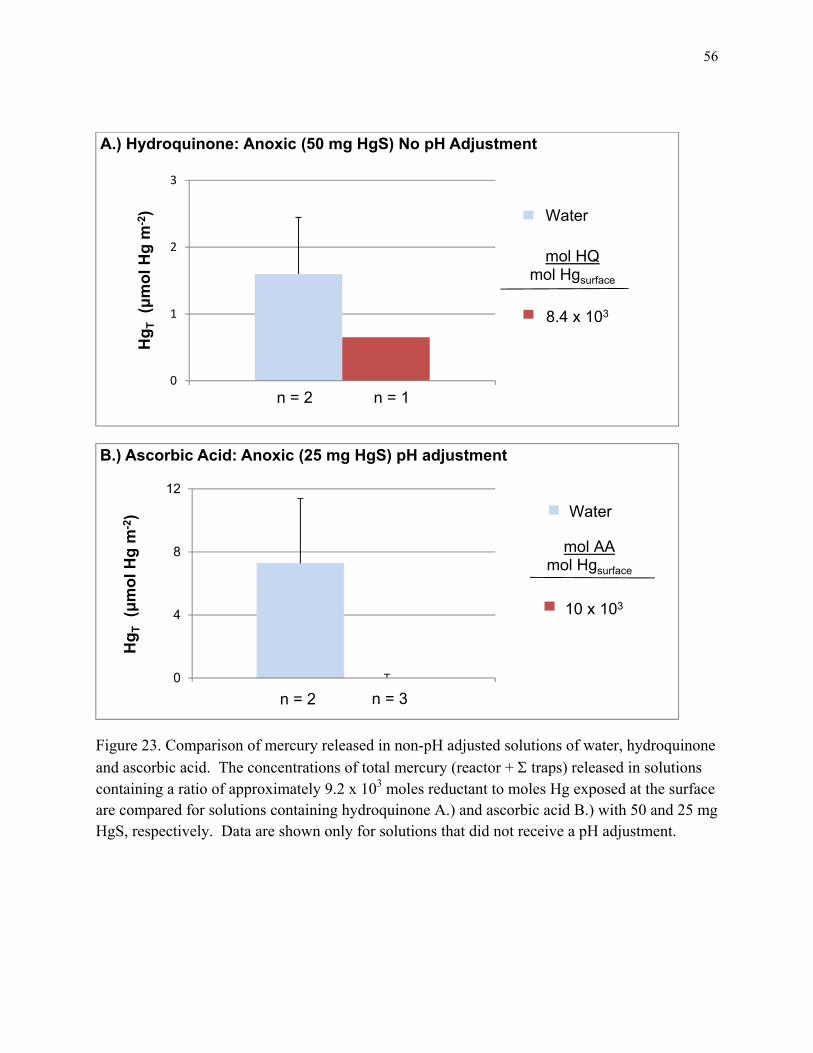
56
Figure 23. Comparison of mercury released in non-pH adjusted solutions of water, hydroquinone
and ascorbic acid. The concentrations of total mercury (reactor + traps) released in solutions containing a ratio of approximately 9.2 x 10³ moles reductant to moles Hg exposed at the surface are compared for solutions containing hydroquinone A.) and ascorbic acid B.) with 50 and 25 mg HgS, respectively. Data are shown only for solutions that did not receive a pH adjustment.
0
1
2
3
1
Hg
T(μ
mo
l Hg
m-2
)A.) Hydroquinone: Anoxic (50 mg HgS) No pH Adjustment
mol HQmol Hgsurface
Water
8.4 x 10³
n = 2 n = 1
0
4
8
12
1
Hg
T(μ
mo
l Hg
m-2
)
B.) Ascorbic Acid: Anoxic (25 mg HgS) pH adjustment
n = 2 n = 3
mol AAmol Hgsurface
Water
10 x 103
57
Dissolved organic matter contains aromatic and ketone moieties similar to hydroquinone
and ascorbic acid. If HQ and AA are representative of the DOM moieties responsible for
dissolution of cinnabar, then little mercury should be released in the presence of DOM in
contrast to previous work (Ravichandran et al., 1998; Waples et al., 2005). Aromatic structural
units within DOM molecules may stabilize negative charge by evenly distributing it throughout
the structure of the molecule. As the amount of aromatic units increase in a particular sample of
DOM, the more negative charge (e.g., electrons pulled from reductants such as sulfide) can be
efficiently distributed. In turn, the DOM more readily continues to react with reduced moieties,
such as sulfur on the surface of cinnabar. In this way, the DOM structures with more aromatic
moieties are likely more reactive with reduced species. The correlation between the amounts of
mercury released in the presence of increasingly aromatic structures indicates that the process
likely occurs through a single or double electron transfer mechanism.
It is possible that the reactivity of the model compounds HQ and AA with cinnabar do
not represent the overall reactivity of large DOM structures with cinnabar. These particular
moieties likely are not entirely representative of the more complex molecules responsible for the
enhanced dissolution as observed by Waples et al., 2005. Further, Kerr (2007) observed
increased dissolution of mercury in the presence of benzoquinone (the oxidized form of
hydroquinone) when compared to hydroquinone (1.54 x 10⁻⁹ vs. < 1.80 x 10⁻¹¹, respectively) for
experiments carried out under oxic conditions. It seems evident that oxidants promote mercury
release through reaction with reduced sulfur on the surface of cinnabar even in environments
where oxygen is limited.
58
4.3 Surface Reaction Mechanisms
4.3.1Surface Area
It was expected that as the mass of cinnabar, and therefore the total surface area,
increased, the amount of dissolved mercury measured in the experimental solution should also
have increased. However, this was not observed for cinnabar dissolution under anoxic
conditions in solutions containing water. Furthermore, decreased release of mercury with
increased cinnabar concentration was also observed in experiments containing hydroquinone.
As the amount of cinnabar particles in solution become more concentrated the probability
of particle-particle interactions becomes more probable, especially because cinnabar is
hydrophobic. Aggregation appears to decrease the amount of reactive surface sites and limits the
extent of dissolution of surface species. Turbulent hydrodynamic conditions may be necessary to
disturb aggregation and promote dissolution (Barnett et al., 2001). Mercury may be less in
solutions containing higher masses of cinnabar because the aggregates are larger in size,
effectively burying entire particles within the center of the aggregate.
Alternatively or simultaneously, mercury dissolved from the surface of cinnabar may be
removed from solution by re-adsorption to the surface (Burkstaller et al., 1975; Holley et al.,
2007). As the surface area of cinnabar increases, the amount of reactive surface sites increases,
and the opportunity for mercury to re-adsorb to the surface increases. Burkstaller et al. (1975)
observed decreased concentrations of soluble mercury as the mass of New Almaden cinnabar
mass was increased from (0.3 to 3 to 33 g L-1) at pH 1.5 in solutions containing 10 mM Fe(III)
and 3 mM Cl. Whereas the conditions for experiments conducted for this thesis were carried out
at near neutral pH and contained considerably lower cinnabar concentrations (0.05, 0.25, and
0.50 g L-1), our observations also support the possibility of the re-adsorption mechanism.
59
An additional hypothesis was proposed by Holley et al. (2007) who also observed
decreased dissolution of cinnabar in experiments performed under oxic conditions as the
concentration of cinnabar increased from 25 to 100 g L-1. They suggested that as the
concentration of cinnabar increased the solution became saturated with respect to soluble
mercury and the dissolution eventually stopped. The amount of mercury in the reactor solutions
under anoxic conditions that was needed to reach equilibrium with respect to cinnabar was
estimated using the solubility constant for Rxn. 1 (Ksp = 10-36.8). It was assumed that the
measured sulfate concentrations were simply equivalent to the concentration of HS- in the reactor
during the experiment and the pH corresponded to that measured at the end of the experiment
(Table III). In most cases, the amounts of mercury estimated, (on the order of 10-38) assuming
equilibrium was achieved, were orders of magnitude lower than measured amounts. In these
cases dissolution does not appear to have been limited by attainment of equilibrium with
dissolved mercury and hydrogen sulfide. In three cases (CIN9911, CIN71611, and CIN10311)
mercury was below detection in the reactor, and thus could have been as low as the estimated
amount. Notably, the reactor solutions with no measureable mercury, also contained HQ or AA;
and experimental solutions that were adjusted for pH had sulfate concentrations below detection
limits (CIN7111A, CIN7111B and CIN71611B). The observations indicate that aqueous
mercury and sulfate concentrations are not limiting the dissolution of mercury from the surface.
Moreover, in general, the release of mercury plateaus after ~2 h, further supporting aggregation
and re-adsorption as limiting factors involved in dissolution.
60
4.3.2 Recycled Cinnabar
If there had been no significant changes to the cinnabar surface after the end of the initial
dissolution reaction, we would have expected the recycled cinnabar surfaces to release the same
amount of mercury as the initial cinnabar surfaces. In addition, based on results described above,
the amount of released mercury is expected to be equivalent between recycled surfaces and the
initial surfaces in the presence of hydroquinone under both anoxic and oxic conditions.
However, less mercury was released from recycled compared to initial surfaces (0.061 and 7.27±
2.44 μmol Hg m-2), and significantly less mercury was released from recycled vs. initial surfaces
in solutions containing hydroquinone (3.42± 0.54 and 9.09± 1.00 μmol Hg m-2, respectively).
Interestingly, 99% more mercury was released from recycled surfaces of cinnabar in the presence
of hydroquinone than in water (3.42± 0.54 and 0.061 μmol Hg m-2). Based on these results,
hydroquinone reactivates the surface of cinnabar and promotes dissolution.
Other researchers have observed a layer of oxidized sulfur on the surface of iron-sulfide
minerals under oxic conditions (McGuire and Hamers, 2000); and exploratory X-ray Absorption
Near-Edge Structure (XANES) spectroscopy suggests that a coating of oxidized sulfur species
also exists on the surface of cinnabar exposed to water under anoxic conditions (Fig. 24). The
presence of oxidized sulfur may block the interaction of other species with the surface of
cinnabar. Further, the introduction of reduced species such as HQ could reduce the oxidized
sulfur coating and allow dissolution to proceed. If an excess amount of oxidized sulfur exists on
the surface of cinnabar after the initial dissolution experiment, it would be expected that a large
amount of sulfate would be released from recycled cinnabar surfaces, resulting in higher
concentrations of measured sulfate. It is possible that residual sulfate remained on the surface
from cleaning methods performed on the cinnabar by Kerr 2007; however, the high amounts of
61
sulfate measured by other groups suggest that sulfur in cinnabar, rather than residual sulfur from
cleaning, is the source of the sulfate.
Measured sulfate concentrations ranged from 1,500 – 12,230 ppm in experimental
solutions of water, hydroquinone and ascorbic acid. However, no sulfate was measured in
solutions in contact with recycled cinnabar. In this and other studies significantly higher sulfate
concentrations relative to mercury concentrations were observed in solutions contacting cinnabar
under anoxic conditions (3.82 μmol Hg and 26.3 μmol SO4 m-2; RatioHg/SO4 = 6.88;
Ravichandran et al. (1998)) and (10.7 μmol Hg m-2 and 10,454 μmol SO4 m-2; RatioHg/SO4 = 977;
this study). Under oxic conditions the concentrations of mercury and sulfate are lower relative to
those measured in anoxic conditions, but the ratio of sulfate released per μmol Hg is much
greater (0.004 μmol Hg m-2 and 13.1 μmol SO4 m-2; RatioHg/SO4 = 3,275; Holley et al., (2007)).
The results indicate that sulfur oxidation on the surface of cinnabar is rate-limiting even under
conditions where oxygen is limited.
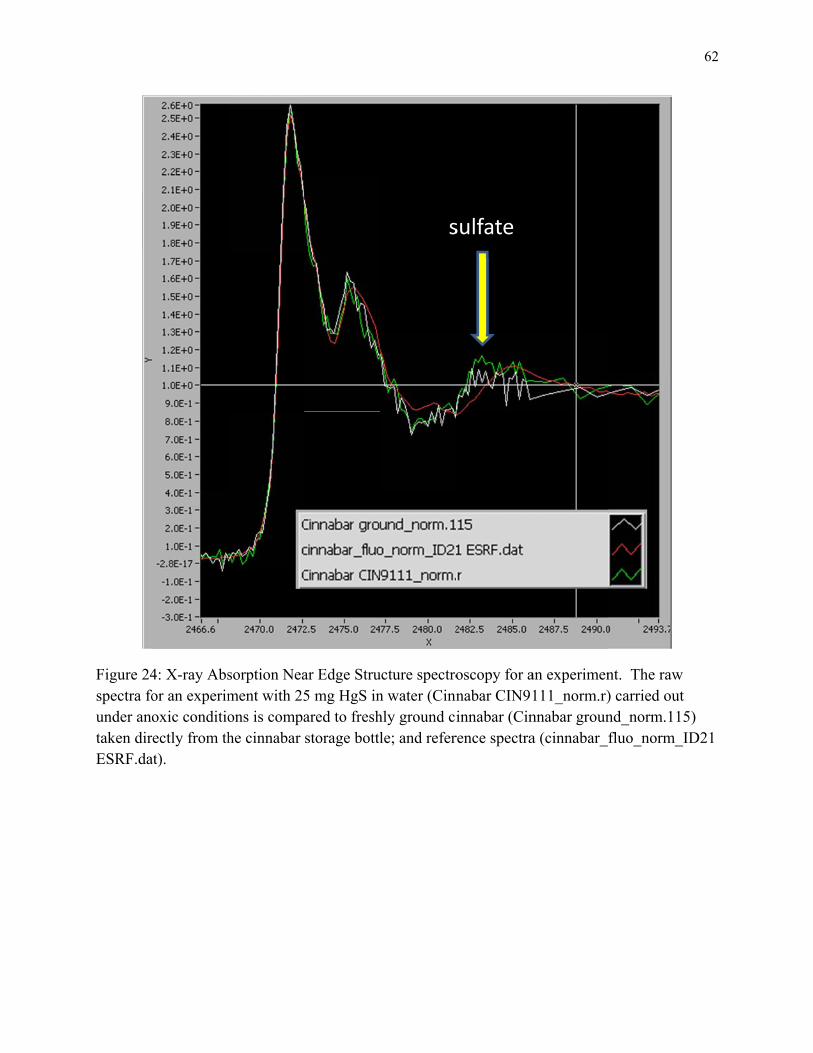
Figure 24spectra founder anotaken dirESRF.da
4: X-ray Absor an experimoxic conditio
rectly from that).
sorption Neament with 25ons is compahe cinnabar
ar Edge Stru5 mg HgS inared to freshstorage bottl
ucture spectron water (Cinnhly ground cile; and refer
s
oscopy for anabar CIN9innabar (Cin
rence spectra
sulfate
an experimen111_norm.r)nnabar grouna (cinnabar_f
nt. The raw ) carried out nd_norm.115fluo_norm_I
62
5) ID21
63
V. CONCLUSIONS AND FUTURE WORK
The release of mercury remains largely unaffected in the presence of hydroquinone; and
significantly decreases in the presence of ascorbic acid. The results from this study indicate that
hydroquinone and ascorbic acid are indirectly participating in the surface mechanism that
controls dissolution; and more likely that the mechanism for dissolution is controlled by the
oxidation of sulfur. Increasing the surface area decreases the amount of mercury released and
less mercury is released from recycled surfaces, indicating that physical surface characteristics
such as the number of exposed reactive surface sites may be important factors controlling
dissolution. Moreover, pH appears to have minimal control on the release of mercury under the
conditions specific to this study (pH = ~2-8).
As the water table fluctuates in the near-surface environment, the position of the
oxic/anoxic boundary will fluctuate as well. The constantly fluctuating exposure of cinnabar to
oxidized and reduced moieties in DOM creates an ever-changing potential for dissolution and
release of mercury to solution where it can be methylated. Reductants such as quinones
comprise a large number of moieties in DOM and they are able to easily transfer and/or lose
electrons; however, environmental oxidants are likely the limiting factor in the dissolution of
cinnabar at the oxic/anoxic boundary. Cinnabar that has formed in the sediments becomes
exposed to more oxidizing conditions during periods of drought, as the fall of the oxic/anoxic
boundary introduces more oxidized species to the sediments; resulting in the formation of
oxidized complexes on the surface of cinnabar. As the boundary moves up, such as during
64
periods of flooding, cinnabar is exposed to a more reducing environment and reductants can
remove the oxidized surface layer, leaving behind an exposed and “clean” cinnabar surface layer.
During a subsequent cyclic drop in the oxic/anoxic boundary layer the “clean” surface is exposed
to oxidizing conditions in which the sulfur is easily oxidized; the Hg-S bond weakens; and
mercury is released. Furthermore, reductants, such as hydroquinone and ascorbic acid could
enhance the release of mercury.
The mechanism of mercury release from cinnabar may occur through the adsorption of an
oxidant to a reduced sulfur site where an initial oxidizing reaction converts sulfide to higher
oxidation states; an electron transfer from the oxidant forming a semiquinone, or some other
comparable radical species; desorption of the semiquinone or radical species; and dissolution of
the oxidized surface species. The oxidation of sulfur species at the surface of cinnabar likely
weakens mercury-sulfur bonds releasing mercury to solution; or, oxidized sulfur species may
remain at the surface and build up. Available reductants may be able to remove the oxidized
layer and promote dissolution.
To better determine the direct role that oxidized species play in inhibiting dissolution,
Transmission Electron Microscopy (TEM) imaging of the cinnabar surface should be conducted
to determine the condition of the surface (i.e., shape and size of the particles); and XANES
spectroscopy could be used to monitor changes in the speciation of sulfur on the
surface. Furthermore, Fourier Transform Infrared (FT-IR) spectroscopy would be useful in
determining the change in the simple organic reactants, such as quinones; and
spectrofluorometry for measuring the change in complex organic reactants, such as DOM after
interaction with the cinnabar surface, especially for measuring the relatively low concentrations
65
required to model concentrations found in nature. In order to maintain realistic concentrations of
reagents, sensitive methods must be employed.
Limited investigation has been carried out on the aggregative properties of cinnabar
despite the fact that exposed reactive surface sites have been identified as a major limiting factor
controlling dissolution. The changes in morphology and reactivity over time evoke the need for
a detailed study on the structure and interaction of cinnabar particles. In addition, isotope
analysis may provide answers to questions regarding re-adsorption of mercury(II).
It is not clear why some reactions produced no sulfate and others produced a large
concentration of sulfate in the final solution. Finally, the possible formation of surface
complexes of hydroquinone and ascorbic acid with cinnabar needs to be explored. Their
formation coupled with subsequent transfer of released mercury to other complexants (e.g.,
sulfhydryl or carboxyl sites in DOM in the natural world) would be mechanistic steps in an
overall dissolution reaction to examine in future work. Clearly, cinnabar surface reactivity is
complicated by the oxidation-reduction reactions that both the cation and anion in the solid may
experience in an aquatic system. Results from the lines of investigation posed above should
produce a clearer picture as to the mechanisms that control cinnabar dissolution.
66
REFERENCES
Banwart, S.; Davies, S.; Stumm, W. The role of oxalate in accelerating the reductive dissolution of hematite (α-Fe2O3) by Ascorbate. Colloids Surf. 1989 39: 303-309; DOI 10.1016/0166-6622(89)80281-1.
Barnett, M.O.; Turner, R.R.; Singer, P. Oxidative dissolution of metacinnabar (β- HgS) by dissolved oxygen. Applied Geochem. 2001 16: 1499-1512; DOI S0883-297(01)00026-9
Bowler, C.; Van Montagu, M.; Inzé, D. Superoxide dimutase and stress tolerance. Annu. Rev. Plant Physiol. Plant Mol. Biol. 1992 42: 83-116; 0066-4294/920601-0083S02.00.
Brunauer. S.; Emmett, P.H.; Teller, E. Adsorption of gases in multimolecular layers. J. Am.
Chem. Soc. 1938 60: 309-313. Brush, G.J.; Penfield S.L. Manual of Determinative Mineralogy with an Introduction on
Blowpipe Analysis; New York, John Wiley & Sons, 1898. Burkstaller J.E; McCarty P.L.; Parks G.A. Oxidation of cinnabar by Fe(III) in acid
mine waters. Environ. Sci. Technol. 1975 9: 676-678; DOI 10.1021/es60105a004.
Compeau G.; Bartha R. Effect of Salinity on mercury methylating activity of sulfate- reducing bacteria in estuarine sediments. Appl. Environ. Microbiol. 1987 53: 261–265.
Cory, R.M.; McKnight D.M. Fluorescence spectroscopy reveals ubiquitous presence of oxidized
and reduced quinones in dissolved organic matter. Environ. Sci. Technol. 2005 39: 8142-8149; DOI 10.1021/es0506962.
Dyrssen, D.; Wedborg, M. The sulphur-mercury (II) system in natural waters Water, Air, Soil
Pollut. 1991 56: 507- 33; SOI 10.1007/BF00342295. Echigo, T.; Arguete, D.M.; Murayama, M.; Hochella Jr. M.F. Influence of size, morphology,
surface structure, and aggregation state on reductive dissolution of hematite nanoparticles with ascorbic acid. Geochim. Cosmochim. Acta 2012 90: 149-162; DOI 10.1016/j.gca.2012.05.008.
Mercury in water by cold vapor atomic fluorescence spectrometry, Revision 2.0. Environmental
Protection Agency (EPA) Method 245.7; Office of Water, United States Environmental Protection Agency: Washington, DC, 2005; EPA 821-R-05-001. http://www.epa.gov/waterscience/methods/method/.
Guidance for Assessing Chemical Contaminant Data for Use in Fish Advisories: Volume 2 Risk
Assessment and Fish Consumption Limits Third Edition. Office of Water, United States Environmental Protection Agency: Washington, DC, 2000; EPA 823-B-00-008.
67
Fish Consumption Advisories. Office of Water, United Stated Environmental Protection Agency: Washington, DC, 2012. http://water.epa.gov/scitech/swguidance/fishshellfish/fishadvisories. 2012.
Gilmour, C.C.; Riedel, G.S.; Ederington, M.C.; Bell, J.T.; Benoit, J.T.; Gill, G.A.; Stordal, M.C.
Methylmercury concentrations and production rates across a trophic gradient in the northern everglades. Biogeochemistry 1998 40: 327-345; DOI 10.1023/A:1005972708616.
Hall R.A.; Zook E. G.; Meaburn, G.M. National Fisheries service survey of trace
elements in the fishery resources National Oceanic and Atmospheric Administration Technical Report 1978 NMFS SSRF-721: 315.
Holley, E.A.; McQuillan J.A.; Craw, D.; Kim J. P.; Sander, S.G. Mercury mobilization by oxidative dissolution of cinnabar and metacinnabar. Chem. Geol. 2007 240: 313-325; DOI 10.1016/j.chemgeo.2007.03.001.
Kerr, M. Cinnabar (HgS) Dissolution in the Presence of Quinones. Master’s thesis, University of
Illinois at Chicago, Chicago, IL, 2007. Leenheer J.A.; Croué J.P. Characterizing dissolved aquatic organic matter Environ.
Sci. Technol. 2003 37: 18A-26A; DOI 10.1021/es032333c. Lovley, D.R.; Kashefi K.; Vargas, M.; Tor, J.M.; Blunt-Harris, E.L. Reduction of humic
substances and Fe(III) by hyperthermophilic microorganisms. Chem. Geol. 2000 169: 289-98; DOI 10.1016/S0009-2541(00)00209-6.
MacCarthy, P. The principles of humic substances. Soil Science 2001 166: 738-751; DOI 0038-
075C/16611-738-751. Mason, R.P.; Lawrence, A.L. Concentration, distribution, and bioavailability of
mercury and methylmercury in sediments of Baltimore Harbor and Chesapeake Bay, Maryland, USA. Environ. Toxicol. Chem. 1999 18: 2438-2447; DOI 0730-7268/99.
McGuire, M.M.; Hamers, Robert J. Extraction and quantitative analysis of elemental
sulfur from sulfide mineral surfaces by high-performance liquid chromatography. Environ. Sci. Technol. 2000 34: 4651-4655; DOI 10.1021/es0011663.
Morel, F. M.M.; Kraepiel, A.M.L.; Amyot, M. Chemical cycle and bioaccumulation of mercury. Annu. Rev. Ecol. Syst. 1998 29: 543-66; DOI 0066-4162/98/1120-0543.
Paquette K.E.; Helz G.R. Inorganic speciation of mercury in sulphidic waters: The
importance of zero-valent sulfur. Environ. Sci. Technol. 1997 31L 2148-2153; DOI S0013-936X(96)01001-2.
68
Ravichandran, M.; Aiken, G.R.; Reddy, M.M.; Ryan, J. Enhanced dissolution of cinnabar (mercuric sulfide) by dissolved organic matter isolated from the Florida Everglades. Environ. Sci. Technol. 1998 32: 3305-3311; DOI S0013-936X(98)00405-2.
Schuster, E. Behavior of mercury in the soil with special emphasis on complexation and
adsorption processes- A review of the literature. Water, Air, Soil Pollut. 1991 56: 667–680; DOI 10.1007/BF00342308.
Schwarzenbach, G.; Widmer, M. Metal complexes with biguanide. Helv. Chim. Acta 1963 46,
2613; ISSN 0031-6865. Sillen, L.G. Stability constants of metal-ion complexes. Sec. I: Inorganic ligands. Chem. Soc.
Rev. 1964 Special Publication 17.
Singh, S.; Sinha, S.; Accumulation of metals and its effects in Brassica juncea (L.) Czern. (cv. Rohini) grown on various amendments of tannery waste. Ecotoxicol. Environ. Saf. 2005 62: 118-127; DOI 10.1016/j.ecoenv.2004.12.026.
Sinha, S.; Gupta, M.; Chandra, P. Bioaccumulation and biochemical effects of mercury in the plant Bacopa monnieri (L). Environ. Toxicol. Water Qual. 1996 11: 105-112; DOI 1053-4725/96/02105-08.
Stack A.G.; Eggleston C.M.; Engelhard M.H. Reaction of hydroquinone with hematite I. Study of adsorption by electrochemical-scanning tunneling microscopy and X-ray photoelectron spectroscopy. J. Colloid Interface Sci. 2004a 274: 433-441; DOI 10.1016/j.jcis.2003.12.026.
Stone A.T.; Morgan, J.J. Reduction and dissolution of manganese (III) and manganese
(IV) oxides by organics 1. Reaction with hydroquinone. Environ. Sci. Technol. 1984 18: 450-456; DOI 0013-936X/84/0918-0450.
Svensson, M.; Allard, B.; Dṻker, A. Formation of HgS- mixing HgO or elemental Hg with S,
FeS or FeS2 Sci. Total Environ. 2006 368: 418-423; DOI 10.1016/j.jhazmat.2006.01.018.
Thorn, K.A.; Arterburn, J.B.; Mikita, M.A. N15 and C13 NMR investigation of hydroxylamine-derivatized humic substances. Environ. Sci. Technol. 1992 26: 107-116; DOI 0013-936X/92/0926-0107.
Uchimiya, M.; Stone, A.T.: Redox reactions between iron and quinones: Thermodynamic
constraints Geochim. Cosmochim. Acta 7 2006 0: 1388-1401; DOI 10.1016/j.gca.2005.11.020.
Uchimiya, M., Stone, A.T. Reversible redox chemistry of quinones: Impact on biogeochemical
cycles. Geochim. Cosmochim. Acta 2009 70: 1388-1401; DOI 10.1016/j.chemosphere.2009.07.025.
69
Vyvyan, J.R.: Allelochemicals as leads for new herbicides and agrochemicals Tetrahedron Lett. 2002 58: 1631-1646; DOI S0040-4020(02)00052-2.
Wang, W.; Driscoll, C.T. Patterns of total mercury concentrations in Onondaga Lake, New York.
Environ. Sci. Technol. 1995 29: 2261-2266; DOI 0013-936X/95/0929-2261. Waples, J.S.; Nagy, K.L.; Aiken, G.R.; Ryan, J.N. Dissolution of cinnabar (HgS) in the presence
of natural organic matter Geochem. Cosmochim. Acta. 2005 69: 1575-1588; DOI 10.1016/j.gca.2004.09.029.
Weston, L.A.; Duke, S.O. Weed and crop allelopathy. Crit. Rev. in Plant Sci. 2003 22: 367-389;
DOI 0735-2689/03.
70
APPENDIX A
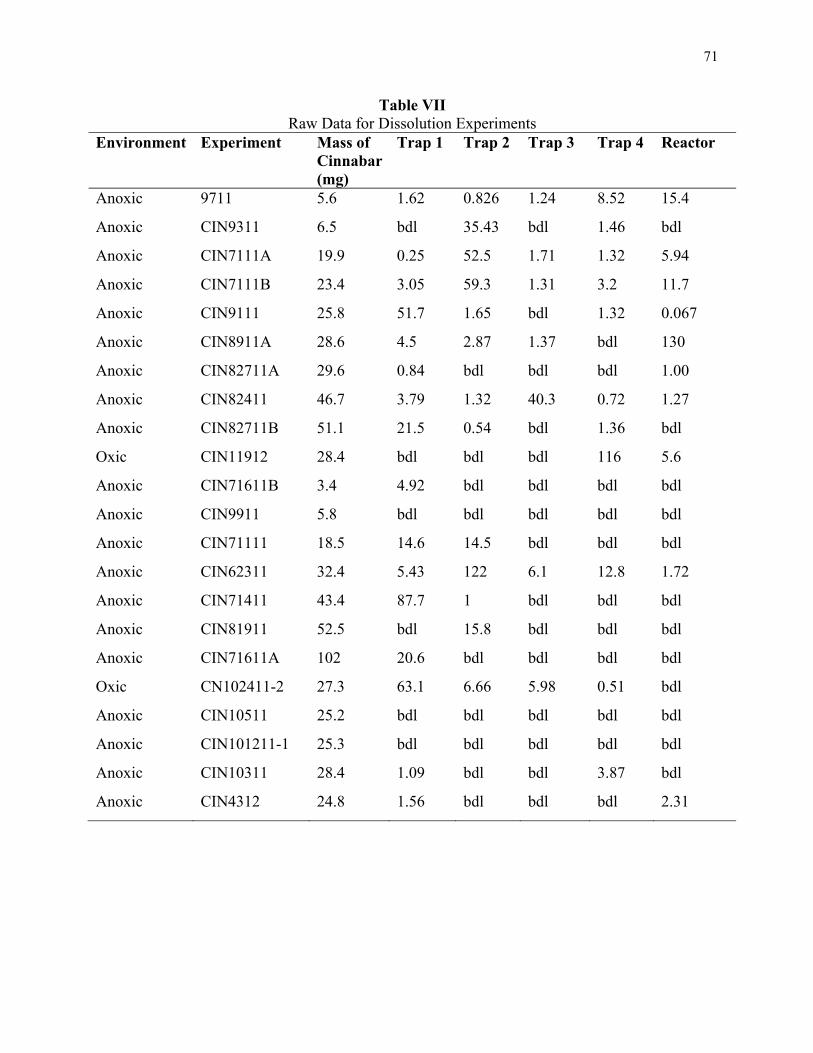
71
Table VII Raw Data for Dissolution Experiments
Environment Experiment Mass of Cinnabar(mg)
Trap 1 Trap 2 Trap 3 Trap 4 Reactor
Anoxic 9711 5.6 1.62 0.826 1.24 8.52 15.4
Anoxic CIN9311 6.5 bdl 35.43 bdl 1.46 bdl
Anoxic CIN7111A 19.9 0.25 52.5 1.71 1.32 5.94
Anoxic CIN7111B 23.4 3.05 59.3 1.31 3.2 11.7
Anoxic CIN9111 25.8 51.7 1.65 bdl 1.32 0.067
Anoxic CIN8911A 28.6 4.5 2.87 1.37 bdl 130
Anoxic CIN82711A 29.6 0.84 bdl bdl bdl 1.00
Anoxic CIN82411 46.7 3.79 1.32 40.3 0.72 1.27
Anoxic CIN82711B 51.1 21.5 0.54 bdl 1.36 bdl
Oxic CIN11912 28.4 bdl bdl bdl 116 5.6
Anoxic CIN71611B 3.4 4.92 bdl bdl bdl bdl
Anoxic CIN9911 5.8 bdl bdl bdl bdl bdl
Anoxic CIN71111 18.5 14.6 14.5 bdl bdl bdl
Anoxic CIN62311 32.4 5.43 122 6.1 12.8 1.72
Anoxic CIN71411 43.4 87.7 1 bdl bdl bdl
Anoxic CIN81911 52.5 bdl 15.8 bdl bdl bdl
Anoxic CIN71611A 102 20.6 bdl bdl bdl bdl
Oxic CN102411-2 27.3 63.1 6.66 5.98 0.51 bdl
Anoxic CIN10511 25.2 bdl bdl bdl bdl bdl
Anoxic CIN101211-1 25.3 bdl bdl bdl bdl bdl
Anoxic CIN10311 28.4 1.09 bdl bdl 3.87 bdl
Anoxic CIN4312 24.8 1.56 bdl bdl bdl 2.31
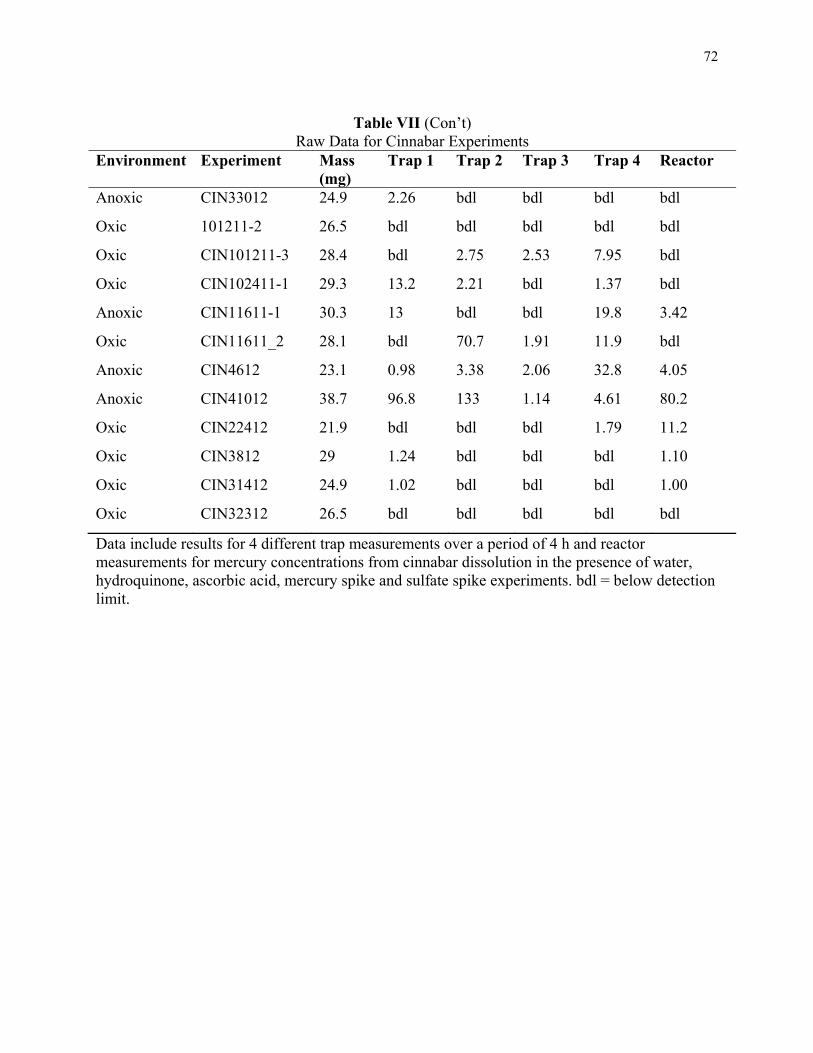
72
Table VII (Con’t) Raw Data for Cinnabar Experiments
Environment Experiment Mass (mg)
Trap 1 Trap 2 Trap 3 Trap 4 Reactor
Anoxic CIN33012 24.9 2.26 bdl bdl bdl bdl
Oxic 101211-2 26.5 bdl bdl bdl bdl bdl
Oxic CIN101211-3 28.4 bdl 2.75 2.53 7.95 bdl
Oxic CIN102411-1 29.3 13.2 2.21 bdl 1.37 bdl
Anoxic CIN11611-1 30.3 13 bdl bdl 19.8 3.42
Oxic CIN11611_2 28.1 bdl 70.7 1.91 11.9 bdl
Anoxic CIN4612 23.1 0.98 3.38 2.06 32.8 4.05
Anoxic CIN41012 38.7 96.8 133 1.14 4.61 80.2
Oxic CIN22412 21.9 bdl bdl bdl 1.79 11.2
Oxic CIN3812 29 1.24 bdl bdl bdl 1.10
Oxic CIN31412 24.9 1.02 bdl bdl bdl 1.00
Oxic CIN32312 26.5 bdl bdl bdl bdl bdl
Data include results for 4 different trap measurements over a period of 4 h and reactor measurements for mercury concentrations from cinnabar dissolution in the presence of water, hydroquinone, ascorbic acid, mercury spike and sulfate spike experiments. bdl = below detection limit.

73
APPENDIX B
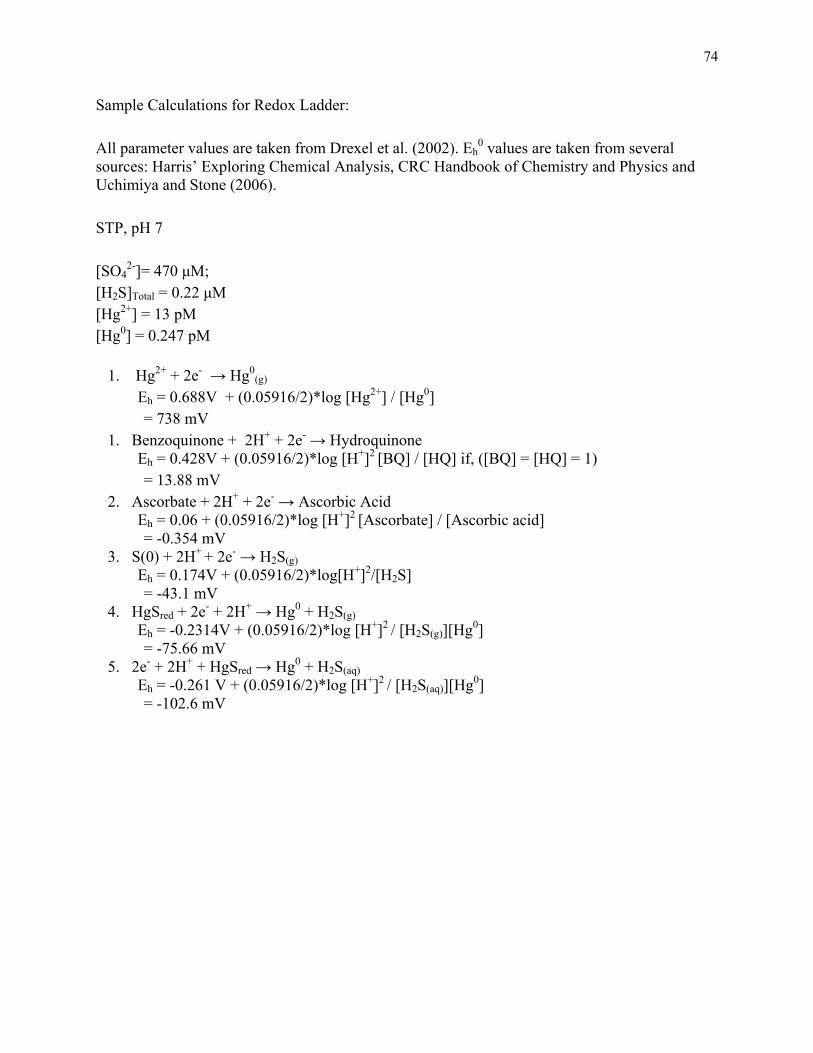
74
Sample Calculations for Redox Ladder: All parameter values are taken from Drexel et al. (2002). Eh
0 values are taken from several sources: Harris’ Exploring Chemical Analysis, CRC Handbook of Chemistry and Physics and Uchimiya and Stone (2006). STP, pH 7 [SO4
2-]= 470 μM; [H2S]Total = 0.22 μM [Hg2+] = 13 pM [Hg0] = 0.247 pM
1. Hg2+ + 2e- → Hg0
(g) Eh = 0.688V + (0.05916/2)*log [Hg2+] / [Hg0] = 738 mV
1. Benzoquinone + 2H+ + 2e- → Hydroquinone Eh = 0.428V + (0.05916/2)*log [H+]2 [BQ] / [HQ] if, ([BQ] = [HQ] = 1) = 13.88 mV
2. Ascorbate + 2H+ + 2e- → Ascorbic Acid Eh = 0.06 + (0.05916/2)*log [H+]2 [Ascorbate] / [Ascorbic acid] = -0.354 mV
3. S(0) + 2H+ + 2e- → H2S(g) Eh = 0.174V + (0.05916/2)*log[H+]2/[H2S] = -43.1 mV
4. HgSred + 2e- + 2H+ → Hg0 + H2S(g) Eh = -0.2314V + (0.05916/2)*log [H+]2 / [H2S(g)][Hg0] = -75.66 mV
5. 2e- + 2H+ + HgSred → Hg0 + H2S(aq) Eh = -0.261 V + (0.05916/2)*log [H+]2 / [H2S(aq)][Hg0] = -102.6 mV
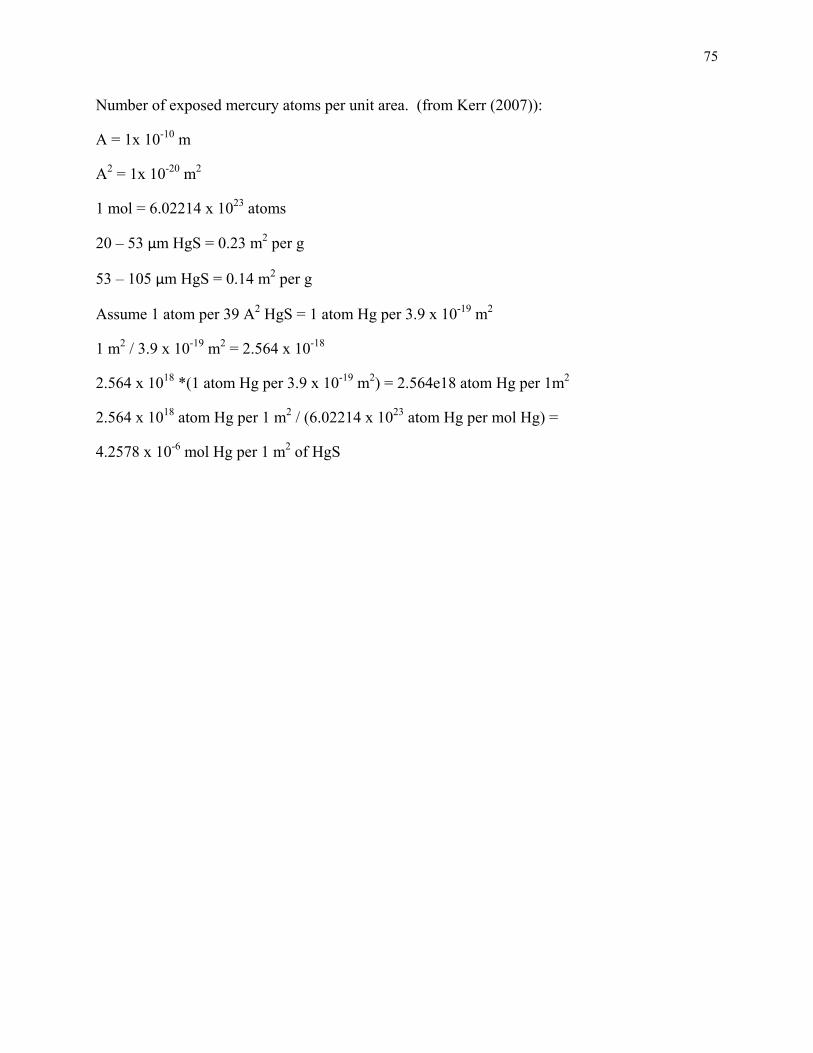
75
Number of exposed mercury atoms per unit area. (from Kerr (2007)):
A = 1x 10⁻¹⁰ m
A2 = 1x 10-20 m2
1 mol = 6.02214 x 10²³ atoms
20 – 53 μm HgS = 0.23 m2 per g
53 – 105 μm HgS = 0.14 m2 per g
Assume 1 atom per 39 A2 HgS = 1 atom Hg per 3.9 x 10⁻¹⁹ m2
1 m2 / 3.9 x 10⁻¹⁹ m2 = 2.564 x 10⁻¹⁸
2.564 x 1018 *(1 atom Hg per 3.9 x 10⁻¹⁹ m2) = 2.564e18 atom Hg per 1m2
2.564 x 10¹⁸ atom Hg per 1 m2 / (6.02214 x 10²³ atom Hg per mol Hg) =
4.2578 x 10⁻⁶ mol Hg per 1 m2 of HgS
76
VITA
NAME: Kimberly Boyd Stallings
EDUCATION: B.A., Chemistry, Roosevelt University, Chicago, Illinois, 2012
M.S., Earth and Environmental Sciences, University of Illinois at Chicago, Chicago, Illinois, 2013
TEACHING: Earth and Environmental Sciences, University of Illinois at Chicago;
Earth, Energy and the Environment 2009-2012 Chemistry, Roosevelt University; Quantitative Environmental Analysis,
General Chemistry I and General Chemistry II 2007-2009 PRESENTATIONS: Stallings, K.B., Kerr M., and Nagy K.L. Reduction of Aqueous Hg(II)
and Dissolution of Cinnabar in the Presence of Quinones under Anoxic Conditions. 10th International Conference on Mercury as a Global Pollutant. Halifax, Nova Scotia, Canada, July 25, 2011.
Stallings, K.B. Aspects of Cinnabar Dissolution under Oxic and Anoxic Conditions and Implications for Mercury Mobility in the Environment, Invited speaker, Department of Chemistry, Roosevelt University, Schaumburg, IL, February, 2012.