merger policy in a quantitative model of international trade · merger policy in a quantitative...
TRANSCRIPT

Merger Policy in a Quantitative Model of International
Trade∗
Holger Breinlich† Volker Nocke‡ Nicolas Schutz§
June 7, 2017
Abstract
In a two-country international trade model with oligopolistic competition, we studythe conditions on market structure and trade costs under which a merger policy designedto benefit domestic consumers is too tough or too lenient from the viewpoint of theforeign country. Calibrating the model to match industry-level data in the U.S. andCanada, we show that at present levels of trade costs merger policy is too tough inthe vast majority of sectors. We also quantify the resulting externalities and study theimpact of different regimes of coordinating merger policies at varying levels of tradecosts.
Keywords: Mergers and Acquisitions, Merger Policy, Trade Policy, Oligopoly, Interna-tional Trade
Journal of Economic Literature Classification: F12, F13, L13, L44
∗We thank Pol Antras, Luis Cabral, Carsten Eckel, Elhanan Helpman, Marc Melitz, John Morrow, PeterNeary, Philipp Schmidt-Dengler, Katja Seim, Yuya Takahashi, Frank Verboven, Ali Yurukoglu as well asseminar and conference participants at the AEA Annual Meeting 2013, Berlin, Bielefeld, CESifo 2013, CLEENWorkshop 2013, CORE, Dartmouth, DISSETTLE 2013, EARIE 2013 & 2015, EEA 2015, ERWIT 2015,Essex, ETSG 2012, Geneva/WTO, Harvard, Lancaster, LSE, MaCCI Annual Meeting 2013, MaCCI SummerInstitute 2014, Munich, Nagoya, Nottingham, Princeton, PSE, SFB/TR 15 2013 & 2015, Stanford, TSE,Tubingen, VfS 2013, Vienna, Wharton and Yale for helpful suggestions. We gratefully acknowledge financialsupport from the German Science Foundation (SFB/TR 15) and the European Research Council (grant no.313623).†University of Nottingham, CEP and CEPR. Email: [email protected].‡UCLA, University of Mannheim and CEPR. Email: [email protected].§University of Mannheim. Email: [email protected].
1 Introduction
Because of cross-border demand and supply linkages, merger approval decisions of national
antitrust authorities have important effects on other jurisdictions. This implies that for a
given objective function (such as domestic consumer surplus, which is by and large current
practice in the United States, the EU, and many other jurisdictions), conflicts between na-
tional authorities can arise. In particular, the efficiency gains induced by a merger might be
sufficient to outweigh its anti-competitive effect in one country but not in another country,
leading to diverging decisions of national merger authorities.
The past two decades have indeed seen a number of high-profile competition cases which
illustrate this potential for conflict. Prominent examples include the proposed merger bet-
ween the two U.S.-based firms General Electric and Honeywell in 2001, the proposed merger
of the South African platinum interests of Gencor and Lonrho in 1996, and the attempted
joint acquisition of the British-based BOC Group by the French company Air Liquide and
the U.S.-based firm Air Products in 2000. In the first two cases, the merger was cleared by
the firms’ domestic antitrust authority but blocked by the EU Commission; in the third case,
the merger was cleared by the authorities in the EU, Canada and Australia, but effectively
blocked by the U.S. Federal Trade Commission. A more recent example is the planned acqui-
sition of the Italian company Metlac by the Dutch company Akzo Nobel, which was cleared
by several European antitrust authorities but blocked by the UK Competition Commission
in 2012.
In this paper, we propose a quantitative framework which can be used to understand the
determinants of conflict between merger authorities, to analyze which types of conflicts are
likely to arise in practice, and to provide a sense of the economic importance of these conflicts.
We use these insights to derive implications for the coordination of national merger and trade
policies. As we explain in detail below, trade policy, and trade costs more generally, play an
important role in determining the type and scope of conflicts between antitrust authorities,
and are a key part of our framework and analysis.
In the first part of the paper, we develop a two-country model of international trade, where
in each country there is a population of heterogeneous firms which produce a homogeneous
good and compete in a Cournot fashion. While all firms produce in their home country, they
can sell not only at home but also export to the other country. Exports do incur standard
iceberg-type variable trade costs, however, implying that the sets of firms active in the two
countries will in general be different.
Consider a merger between two firms located in the same country and exporting to the
1
other country. In both the home and foreign country, that merger has opposing effects
on domestic consumer surplus: On the one hand, the merger gives rise to a market power
effect (which is due to the internalization of competitive externalities post merger); on the
other hand, the merger gives rise to an efficiency effect (which is due to merger-specific
synergies). The resulting net effect depends on the characteristics of the merger, market
conditions and trade costs. As the merger may raise consumer surplus in one country but
reduce it in the other, the approval incentives of the national authorities are not fully aligned.
Whether merger control based on domestic consumer surplus is too tough or too lenient from
the viewpoint of foreign consumers is shown to depend solely on an industry-level ‘conflict
statistic.’ That conflict statistic for mergers among firms in a given industry and country
is equal to the ratio of domestic to foreign pre-merger prices, adjusted for trade costs from
the home to the foreign country. If the value of the statistic is larger than one, any pair of
merger partners has more market power at home than abroad, no matter what their pre-
merger marginal costs. This implies that if the merger benefits domestic consumers it must
also benefit foreign consumers, while the reverse is not true. In this case, merger control based
on domestic consumer surplus is a too-tough-for-thy-neighbor policy as it involves blocking
some mergers that would benefit consumers in the foreign country. Conversely, if the value
of the statistic is smaller than one, merger control based on domestic consumer surplus is a
too-lenient-for-thy-neighbor policy as it involves approving some mergers that hurt consumers
in the foreign country. Generically, the value of the statistic is not equal to one, so there will
always be one of these two types of conflict. We also show that any (unilateral or multilateral)
reduction in trade costs reduces the value of the conflict statistic in both countries.
Our theoretical results are derived for general demand functions and arbitrary firm hete-
rogeneity. To say more about which types of conflict are likely to be relevant in practice, we
calibrate our model in the second part of the paper, using industry-level data for the year
2002 from 160 sectors in the United States and Canada. In order to do so, we need to make
two types of assumptions. First, we have to specify a demand function. In the baseline, we
focus on the textbook linear demand case.1 However, to investigate the robustness of our
results, we also consider CES demand in a model of price competition with differentiated pro-
ducts. Second, we have to specify a distribution from which firms’ productivities are drawn.
Here, we follow many recent papers in the trade literature by assuming that productivities
are Pareto-distributed.2 Importantly, the industry-level conflict statistics can be computed
1Neary (2007), one of the very few trade papers on mergers with oligopolistic competition, also considersa Cournot model with linear demand.
2Prominent recent trade papers assuming a Pareto distribution for firms’ productivity draws include
2

without explicitly modeling mergers. This means that we do not have to take a stance on
potential merger-specific synergies nor on the merger formation process.
Our results show that at the present levels of trade costs (i.e., the levels obtained in
the calibration), domestic merger policy is of the too-tough-for-thy-neighbor type in the vast
majority of sectors in the U.S. The picture is even more extreme for Canadian mergers – here,
too-tough-for-thy-neighbor policies are the only type of conflict. Intuitively, Canada is the
smaller and less competitive market in our calibration, in the sense of a higher equilibrium
price in a large majority of sectors. Given the presence of positive trade costs, any domestic
merger cleared in Canada will always be even less anti-competitive in the U.S. and will thus
benefit consumers there. The opposite is not necessarily true: given that the U.S. market is
more competitive in most sectors, some mergers cleared there might have anti-competitive
effects in Canada despite the presence of trade costs. Still, even in the U.S., too-lenient-
for-thy-neighbor policies appear only in a small minority of sectors. Hence, whether or not
national authorities have effective veto rights over mergers involving foreign firms matters
surprisingly little at current levels of trade costs.3
When we reduce the trade cost parameters in our calibrated model, veto rights over
foreign mergers become more valuable. Lower trade costs imply lower prices so that domestic
authorities are more likely to approve domestic mergers. At the same time, lower trade
costs mean higher market shares and market power of domestic firms in the foreign market
and greater anticompetitive effects there. As trade costs fall, we thus see a switch from
conflicts where the domestic authority wants to block a given domestic merger and the
foreign authority wants to clear it, to conflicts in which the domestic authority wants to clear
the merger and the foreign authority wants to block it. In our counterfactual simulations,
this switch occurs for trade cost reductions which do not appear large from a historical
perspective.
Our results are robust to a number of alternative modeling assumptions and data sources
used for the calibration. For example, we show that our findings are qualitatively similar if
we explicitly model a competitive fringe or, as mentioned above, if we assume differentiated
Helpman, Melitz, and Yeaple (2004), Chaney (2008), Melitz and Ottaviano (2008), Eaton, Kortum, andKramarz (2011), and Mayer, Melitz, and Ottaviano (2014).
3There is considerable disagreement over the extent to which national authorities have effective vetorights over mergers involving only foreign firms. De jure, many countries have adopted the ‘effects doctrine’in international competition law, according to which national authorities may assert jurisdiction over anyforeign firm whose activity affects the domestic market (see, e.g., Griffin 1999). In practice, however, thedegree to which the effects doctrine is implemented varies substantially across countries, with most antitrustauthorities not exercising the implied veto rights over foreign mergers. For example, we are not aware of anyU.S. merger authorized by the U.S. but blocked by Canadian antitrust authorities.
3

products and Bertrand competition. The general intuition that trade costs and initial market
structures create cross-country differences in the market power enjoyed by the merging firms
carries through in all of these settings; it is these differences that are the driving force behind
our findings.
In the paper’s third and final part, we quantify the importance of conflicts between
authorities and analyze counterfactual scenarios for the international coordination of merger
control. This requires much stronger assumptions. In particular, we have to model explicitly
an endogenous merger formation process and take a stance on the strength of merger-specific
synergies. In the absence of a consensus in the existing literature on these topics, our modeling
choices are mostly motivated by simplicity and computational feasibility.4,5 This part of the
paper is therefore more exploratory in nature.
We consider two ways of coordinating national merger policies. We first quantify the
impact of granting veto rights over foreign mergers. In line with the results from the first
set of calibrations, we find that this policy change only has minor effects. The U.S. does
not benefit at all from gaining veto rights; Canada sees small increases in domestic consumer
surplus but this comes at the cost of reducing U.S. consumer surplus. This is because Canada
now blocks U.S. mergers that increase prices in Canada but reduce them in the U.S.
In the second counterfactual, we introduce a North-American merger authority which
maximizes the sum of Canadian and U.S. consumer surplus. This authority internalizes
cross-border effects of mergers and is thus also able to eliminate consumer surplus losses
arising from domestic merger policies which are too restrictive from the point of view of
foreign consumers. As a consequence, we find much larger gains from this second policy
change. Interestingly, however, this comes at the price of hurting Canadian consumers whose
average consumer surplus change is negative. Put simply, the new merger authority gives
much more weight to the larger U.S. market and tends to ‘ignore’ Canada.
Changes in trade costs again modify the gains from national merger policy coordination in
important ways. As trade costs increase from current levels, gains from coordination rapidly
dissipate. With lower trade costs, however, more complex effects arise. Obtaining veto rights
4In general, implementation of the merger formation process involves finding the outcome of a multi-playerbargaining process with externalities. (Multiple mergers may obtain in each industry and externalities arisebecause firms compete in the same market.) Unfortunately, the literature on bargaining does not yet providea widely accepted solution to such bargaining processes, forcing us to adopt a simpler approach. Paperssuch as Jehiel and Moldovanu (1995a, 1995b), Gomes (2005), Gomes and Jehiel (2005) provide only partialcharacterization results.
5Very little is known empirically about merger-specific synergies, despite them being at the heart of theWilliamson (1968) trade-off between market power and efficiency effects of mergers. See the discussion atthe beginning of Section 5.2 for an overview of the literature.
4
becomes now much more valuable for national antitrust authorities, especially for Canada as
the smaller, less competitive market. As trade costs fall from current levels, the focus of a
North American antitrust authority also shifts from preventing domestic policies which are
too tough to preventing policies which are too lenient. Thus, the effects of introducing such
an authority increasingly comes to resemble those of introducing veto rights and Canada also
starts to benefit from this form of coordination.
Again, we carry out a number of modifications to this second calibration to examine the
robustness of our findings. For example, we experiment with different levels of cost synergies,
allow for multinational enterprises and cross-border mergers in addition to purely domestic
mergers, and carry out the baseline calibration under the assumption that merger authorities
have veto rights over foreign mergers to begin with. We show that the qualitative pattern of
our results remains intact throughout.
Our paper relates to several strands in the literature. First, we contribute to the theoreti-
cal literature on optimal horizontal merger policy (e.g., Williamson 1968; Farrell and Shapiro
1990; Nocke and Whinston 2010, 2013). While we study the conditions under which different
national merger authorities would come to different conclusions regarding the desirability of
a given merger, this literature focuses almost exclusively on closed economy settings. An
exception is Barros and Cabral (1994) who extend the analysis in Farrell and Shapiro (1990)
on the ‘external effect’ of a merger (defined as the merger’s effect on the sum of consumer
surplus and non-participant firms’ profits) by allowing some of the firms to be foreign-owned.
Second, we contribute to a relatively small literature that looks at the interaction of
merger and trade policies (e.g., Horn and Levinsohn 2001; Rysman 2001; De Stefano and
Rysman 2010). In this literature, merger policy is akin to industrial policy. For instance,
in Horn and Levinsohn (2001) and Rysman (2001), countries directly set the number of
symmetric firms; in De Stefano and Rysman (2010), each country partitions an exogenously
given set of products into a set of firms. Apart from explicitly modeling mergers, we also
consider a richer and more general framework, and provide necessary and sufficient conditions
on primitives under which different types of conflicts between national antitrust authorities
arise. Moreover, we operationalize our framework for the quantitative analysis of such issues,
provide a sense of the magnitude of cross-border externalities, and conduct counterfactual
policy experiments.
We also contribute to the international trade literature concerned with the causes and
consequences of domestic and cross-border mergers (e.g., Neary 2007; Nocke and Yeaple 2007,
2008; di Giovanni 2005; Breinlich 2008) and with strategic aspects of firm behavior and trade
5

policy in open economy settings (e.g., Brander and Spencer 1985; Brander 1995; Bagwell,
Bown, and Staiger 2015). While competition policy is not the focus of this literature, we use
comparable modeling frameworks. We also share common interests such as the consequences
of introducing mergers and strategic interactions into models of international trade, or the
interaction between trade and domestic policies. As only a few papers in this literature use
quantitative frameworks (Ossa 2014 is a recent exception), the techniques we introduce to
calibrate our model should also be helpful with a quantification of some of the insights from
this earlier literature.
The rest of this paper is organized as follows. In Section 2, we introduce a simple two-
country model of oligopolistic competition. In Section 3, we use this model to analyze the
domestic and foreign price effects of mergers and to characterize the types of conflict which
can arise between national antitrust authorities. In Section 4, we calibrate this model on
data for the year 2002 for 160 manufacturing sectors in the U.S. and Canada. We analyze
the prevalent types of conflicts for the calibrated parameter values and for counterfactual
scenarios in which we lower or raise trade costs. In Section 5, we extend the calibration by
incorporating an endogenous merger formation process, and look at counterfactual scenarios
in which we change the antitrust authorities’ objective functions at different levels of trade
costs. Finally, Section 6 concludes. All the proofs are contained in an Online Appendix, as
are the details of our extensions and robustness checks.6
2 The Baseline Model
We consider a setting with two possibly asymmetric countries (i, j = 1, 2), S manufacturing
sectors and an outside sector. Country i is endowed with Li units of labor. Labor markets
are perfectly competitive; there is perfect labor mobility across sectors and no labor mobility
across countries.
In country i, the representative consumer’s utility function is given by:
U i(Qi0,Q
i) = Qi0 +
S∑s=1
uis(Qis),
where Qi0 is the consumption of the outside good, uis is a well-behaved sub-utility function,
and Qis is the consumption of manufacturing good s. The consumer’s budget constraint
is: P i0Q
i0 +
∑Ss=1 P
isQ
is ≤ I i, where P i
0 is the price of the outside good and P is the price of
6The Online Appendix can be found at http://nocke.vwl.uni-mannheim.de/2214.0.html.
6

good s in country i. We assume that parameter values are such that consumer income I i
(which is equal to the sum of wage income wiLi and profits) is sufficiently large so that a
positive quantity of the outside good is consumed. Since we are focusing on consumer surplus,
and income effects are absent (due to quasi-linear preferences), the ownership structure of
domestic and foreign firms is irrelevant for the subsequent analysis.
The outside good is produced under perfect competition using a constant-returns-to-scale
technology with labor as the only factor of production. One unit of labor generates αi units
of output. We assume that the outside good is freely traded, which implies that its price is
the same in both countries. We also assume parameter values such that the outside sector
produces positive amounts in both countries. We further use the price of the outside good
as the numeraire (P 10 = P 2
0 = 1). This pins down the wage rate in country i at wi = αi.
Given these assumptions, the inverse demand function for good s in country i is given by
P is (Qi
s) = max {ui′s (Qis) , 0}.
In each country i, there is a set N is of firms manufacturing good s. Each firm k ∈ N i
s
produces only in its home country i, so that N 1s ∩ N 2
s = ∅, but can sell at home and also
export to the foreign country j.7 Exports are subject to iceberg-type trade costs: For one
unit of good s to arrive in country j, a firm located in country i has to ship τ ijs units of the
good, where τ ijs = 1 if i = j.
In each country and manufacturing sector, firms compete a la Cournot, being able to
segment markets perfectly. Manufacturing firms combine labor and the outside good (as an
intermediate input), using a constant-returns-to-scale technology. The production function
is specified further in Section 4.1 below. For now, we simply denote ck the firm’s marginal
(and unit) cost of producing one unit of good s. Because of trade costs, this is different from
the firm’s marginal cost of selling one unit of the good in country j, cjk ≡ τ ijs ck.
Let N is ≡ |N i
s | denote the number of (potentially active) manufacturing firms in sector s
that are located in country i. Denoting qjk firm k’s output in country j, we say that firm k
is active in country j and sector s if qjk > 0 in equilibrium.
As is well known (see, e.g., Vives 2000) the following standard assumption on demands
and thus, implicitly, on the sub-utility functions uis, implies that there exists a unique and
stable Nash equilibrium in each sector and country:
Assumption 1. For any country i and sector s, limQ→∞ Pis(Q) = 0 and P i
s(Q) > mink∈N is ck
for Q > 0 sufficiently small. Moreover, for any aggregate output Q > 0 such that P is(Q) > 0,
P i′s (Q) < 0 and P i′
s (Q) +QP i′′s (Q) < 0.
7In Section 5.4, we also allow for cross-border mergers and thus multinational enterprises.
7

Lemma 1. There exists a unique Nash equilibrium. The Cournot equilibrium price in each
country i and sector s, P i∗s , is weakly increasing in firm k’s marginal cost of selling in country
i, cik, and strictly so if the firm is active in that country.
In equilibrium, firm k ∈ N js is not active in country i if and only if τ jis ck ≥ P i∗
s . Even
though we have abstracted from fixed exports costs, the equilibrium may thus have the
feature that some firms export while others do not. In particular, firm k ∈ N js sells only in
its home country j if and only if P i∗sτ jis≤ ck < P j∗
s .
3 Domestic and Foreign Price Effects of Mergers
In this section, we study the effects of a merger between two domestic firms on domestic and
foreign prices and, thus, on domestic and foreign consumer surplus. The focus on consumer
surplus rather than total surplus is in line with antitrust laws and practice in the U.S., the
EU and many other jurisdictions.8 In the following, we characterize what types of conflicts
may arise (and when) between national authorities.
Consider merger Ms = {k, l} between firms k ∈ N js and l ∈ N j
s , both of which produce
good s in country j. Dropping the subscript s from now on for notational ease, let cM
denote the merged entity’s post-merger marginal cost. Denote the Cournot equilibrium price
in country i (which may or may not be equal to j) before the merger by P i∗, and after
the merger by Pi∗
. Since products are homogeneous, the consumer surplus (CS) effect of
the merger in country i has the same sign as P i∗ − Pi∗
. We say that merger M is CS-
neutral in country i if Pi∗
= P i∗, CS-decreasing if Pi∗> P i∗, CS-increasing if P
i∗< P i∗,
CS-nonincreasing if Pi∗ ≥ P i∗, and CS-nondecreasing if P
i∗ ≤ P i∗.
From Lemma 1 it follows that the CS-effect of a merger is the larger (i.e., the more positive
or the less negative), the lower is the merged firm’s post-merger marginal cost. The following
lemma, which is an extension of the results in Farrell and Shapiro (1990) to a two-country
world, fully characterizes the effect of merger M on consumer surplus in country i:
8For instance, Whinston (2007) summarizes the perceived wisdom on merger authorities’ objective functionas follows: “[...] enforcement practice in most countries (including the U.S. and the E.U.) is closest to aconsumer surplus standard.” Indeed, the U.S. Horizontal Merger Guidelines state: “the Agencies normallyevaluate mergers based on their impact on customers [...] the Agencies consider whether cognizable efficiencieslikely would be sufficient to reverse the mergers potential to harm customers in the relevant market, e.g.,by preventing price increases in that market.” Similarly, the EU Horizontal Merger Guidelines state: “Therelevant benchmark in assessing efficiency claims is that consumers will not be worse off as a result of themerger.”
8

Lemma 2. Consider merger M = {k, l} between firms k ∈ N j and l ∈ N j, both of which
are located in country j. Assume that both firms are active in country i pre-merger, and let
ciM ≡ ck + cl −P i∗
τ ji.
Then, the merger is CS-neutral in country i if cM = ciM , CS-decreasing if cM > ciM and
CS-increasing if cM < ciM .9
Lemma 2 shows that the threshold value of post-merger marginal cost, ciM , below which
merger M is CS-increasing in country i, is decreasing in the pre-merger equilibrium price in
country i. Intuitively, this is because a reduction in the pre-merger equilibrium price does
not affect the efficiency effect of the merger (which can be thought of as the merger-induced
reduction in the cost of producing the marginal unit of output) but reduces the market power
effect of the merger (which is due to the internalization of the competitive externality post
merger) as each merger partner’s pre-merger output is decreasing in the pre-merger price.
According to Lemma 2, both the domestic and the foreign antitrust authority would want
to block the merger if cM > max{c1M , c2M} and approve the merger if cM < min{c1M , c2M}.If min{c1M , c2M} < cM < max{c1M , c2M}, however, the interests of the two authorities conflict
with each other as the consumers in one country would be better off with the merger and
the consumers in the other country without. Generically, c1M 6= c2M , implying that there is
always the potential of such conflicts of interest.
The exact nature of the conflict between CS-focused authorities depends on whether
merger M can be blocked not only by the domestic (here, country j’s) authority but also
by the foreign (here, country i’s, i 6= j) authority. As discussed in the introduction (see
Footnote 3), two views are possible here. De jure, antitrust authorities and courts in many
countries have adopted the ‘effects doctrine’ according to which domestic competition laws
apply also to foreign firms insofar as the actions of these firms have significant effects on
the domestic market (see, e.g., Griffin 1999). De facto, however, in many countries such
extra-territorial jurisdiction seems to be applied only to a very limited extent.
In light of this discussion, we propose the following taxonomy of conflicts which accom-
modates both a ‘veto-rights’ case (foreign mergers can be blocked) and a ‘no-veto-rights’
case (foreign mergers cannot be blocked). For country-j mergers, country j’s CS-standard is
a too-tough-for-thy-neighbor policy if there exists a country-j merger that is CS-decreasing
9In addition, it follows immediately from Lemma 1 in Nocke and Whinston (2010) that if the merger isCS-nondecreasing (i.e., either CS-neutral or CS-increasing) in country i, then it raises the merger partners’joint profit from selling in that country. See Online Appendix Section A.2.
9
in country j and CS-increasing in country i, and if every country-j merger that is CS-
nondecreasing in country j is also CS-nondecreasing in country i. By contrast, if there exists
a country-j merger that is CS-nondecreasing in country j and CS-decreasing in country i, and
if every country-j merger that is CS-decreasing in country j is also CS-decreasing in country
i, then country j’s CS-standard is a too-lenient-for-thy-neighbor policy in the no-veto-rights
case, and country i’s CS-standard is a too-tough-for-thy-neighbor policy on foreign mergers
in the veto-rights case. In the following, we state our results within the ‘no-veto-rights’ fra-
mework to ease the exposition. Results in the ‘veto-rights’ framework can be obtained by
simply replacing too-lenient-for-thy-neighbor policy by too-tough-for-thy-neighbor policy on
foreign mergers.
In principle, one may expect that, for some pre-merger market conditions, there exist
country-j mergers that benefit country-j consumers and harm country-i consumers, and
country-j mergers that harm country-j consumers and benefit country-i consumers. If so,
country j’s CS-standard would be neither a too-tough-for-thy-neighbor policy nor a too-
lenient-for-thy-neighbor policy. The following proposition, which follows from Lemma 2,
shows that, generically, country j’s CS-standard is either a too-tough-for-thy-neighbor policy
or a too-lenient-for-thy-neighbor policy:
Proposition 1. Suppose that at least two country-j firms are active at home and abroad.
The domestic CS-standard for merger approval in the home country j is a too-tough-for-thy-
neighbor policy if ρj∗ > 1 and a too-lenient-for-thy-neighbor policy if ρj∗ < 1, where10
ρj∗ ≡ τ jiP j∗
P i∗ , i 6= j.
Proposition 1 shows that the potential for conflict in merger policy depends solely on a
market-level “sufficient statistic”, ρj∗, which summarizes the relative competitiveness of the
two markets, adjusting for trade costs faced by the merging firms. We call ρj∗ the “conflict
statistic” for country-j mergers. If ρj∗ > 1, then whenever consumers in the home country j
would benefit from a domestic merger, so would consumers in the foreign country, but not the
reverse. If ρj∗ < 1, then some domestic mergers that benefit consumers in the home country j
would hurt consumers in the foreign country (whereas any merger that is CS-increasing in the
10If iceberg-type trade costs are replaced by additive trade costs, then conflict statistics can be definedas follows: ρj∗ = P j
∗ − P i∗ + τ ji. In this case, country j is too tough (resp. too lenient) if ρj∗ > 0 (resp.ρj∗ < 0). Similar formulas can be derived when trade frictions are due to demand-side factors, such ashome-biased consumers.
10

foreign country is necessarily also CS-increasing in the firms’ home country).11,12 Intuitively,
if trade costs are high (τ ji > 1) or if the foreign market is more competitive than the domestic
market (P i∗ < P j∗), so that ρj∗ > 1, domestic firms tend to have lower market shares abroad
than they do at home. The market power effect of the merger is therefore more likely to
dominate the efficiency effect at home than abroad, and the nature of the potential conflict
on domestic mergers tends to be of the too-tough-for-thy-neighbor type.
These conflict statistics involve endogenous prices. This raises the question: Under what
conditions on primitives is one type more likely to arise than the other? In the simple case
where the two countries are identical, τ 12 = τ 21 ≡ τ and P 1∗ = P 2∗, both conflict statistics
are equal to τ , and the domestic CS-standard for merger approval is a too-tough-for-thy-
neighbor policy if τ > 1, and a too-lenient-for-thy-neighbor policy if τ < 1. To the extent
that one would expect the iceberg-type trade cost τ to be larger than one, this suggests that
conflict is likely to be of the too-tough-for-thy-neighbor type when countries are similar.
When countries are not identical, conflict statistics depend both on trade costs and on
the ratio of pre-merger equilibrium prices. The following proposition shows that the general
idea that conflict is more likely to be of the too-tough-for-thy-neighbor type when trade costs
are high extends to the case of asymmetric countries:13
Proposition 2. An increase in the trade cost from country j to country i 6= j, τ ji, induces
an increase in the conflict statistics for mergers in both countries, ρ1∗
and ρ2∗.
4 Model Calibration without Mergers
In this section, we calibrate the model to sector-level data from the U.S. and Canada for
2002. The goal of this first set of calibrations is to evaluate which types of conflicts are
likely to be relevant in practice, and how this changes as trade costs evolve. A calibration
11By construction, ρ1∗ρ2∗ = τ12τ21. So, while one type of conflict may prevail for mergers taking place inone country, the same or another type of conflict may prevail for mergers in the other country (in particular,ρj∗ > 1 is consistent with both ρi∗ < 1 and ρi∗ > 1).
12Following the ‘reciprocal dumping’ literature (e.g., Brander and Krugman 1983), and much of the sub-sequent literature on oligopolies in international trade, we have assumed that manufacturers can perfectlysegment domestic and foreign markets. If we were to make the polar opposite assumption that perfectlycompetitive arbitrageurs were subject to the same trade costs as manufacturers, then this would impose thefollowing constraints on relative prices: 1 ≤ ρj∗ ≤ τ12τ21. In that extreme case, only one type of conflictcan arise, namely that the home country is too tough. As at most one of the no-arbitrage inequalities cangenerically be binding, at least one of the two countries must be too tough (from the viewpoint of foreign con-sumers) on domestic mergers in each industry. Whenever there is imperfect competition among arbitrageurs,or arbitrageurs are subject to larger trade costs than manufacturers, both types of conflict can arise.
13In the Online Appendix (Section A.5), we also study the impact of demand and supply conditions onour conflict statistics.
11
approach is helpful in this context because it imposes some discipline on the parameter values
governing the prevalence of the two types of conflict. In particular, it allows us to obtain
model-consistent estimates of bilateral trade costs and permits the analysis of counterfactual
changes in these costs.14
4.1 Model Operationalization: Preferences and Technologies
We assume that the sub-utility uis(·) introduced in Section 2 is now given by uis(Qis) =
aisQis − 1
2bis (Qi
s)2, where s indexes sectors and i countries. This quadratic functional form
generates a linear inverse demand function: P is (Qi
s) = max (ais − bisQis, 0). The production
function of firm k in sector s and country i is given by
qk =1
(ηis)ηis(1− ηis)1−η
iszkl
ηisk q
1−ηis0,k ,
where lk and q0,k denote firm k’s consumption of labor and intermediate goods (i.e., the
outside good), ηis is the labor input share in sector s and country i, and zk is the productivity
of firm k. Firm k’s productivity in sector s and country i, zk, is drawn from a Pareto
distribution with scale parameter xis and shape parameter ζ is. The implied marginal and unit
cost of firm k is given by
ck =1
zk(wi)η
is(P i
0)(1−ηis) =
1
zk(αi)η
is ,
where the last step follows from our choice of the outside good as numeraire and the resulting
wage rate of wi = αi.
There are initially N is potentially active manufacturing firms in sector s and country i.
We solve the Cournot competition game with linear demand in the Online Appendix. With
the equilibrium price and number of firms at hand, we can compute the theoretical moments
of interest which will be matched to our data (see below).
14Note that our conflict statistic, ρj∗, depends on prices and trade costs only. While the former are inprinciple observable, the latter are not. This is because we require a wide definition of trade costs whichincludes any factor making selling abroad more costly than at home. Backing out trade costs as a residualfrom a theoretical model is the preferred way of doing this in the trade literature (e.g., Anderson and vanWincoop 2004). When we vary trade costs, we also need to compute counterfactual price changes which willdepend on all model parameters, requiring a full-scale calibration in the first place.
12

4.2 Calibration
Parameters to be Calibrated. We calibrate our model by matching key features of U.S.
and Canadian data at the industry level. From now on, we relabel country 1 as the U.S. and
country 2 as Canada. We calibrate our model separately for each sector. The calibration
requires, for each sector, parameter values for aUS and aCAN (the intercepts of the inverse
demand functions), bUS and bCAN (the slopes of the inverse demand functions), NUS and
NCAN (the numbers of potentially active firms), τUS,CAN and τCAN,US (the trade costs), xUS
and xCAN (the scale parameters of the productivity distributions), ζUS and ζCAN (the shape
parameters of the productivity distributions), and ηUS and ηCAN (the labor shares). We also
require parameter values for αUS and αCAN (the productivities of the outside sectors).
We choose units of the numeraire so that αUS = 1, and set αCAN equal to the ratio
of Canadian to U.S. wages in the data. Consistent with our Cobb-Douglas specification of
firms’ production functions and our assumption of perfectly competitive labor and outside
good markets, ηUS and ηCAN are set equal to the ratio of the wage bill to total costs in each
sector. In every sector, we set aUS equal to 25, which also amounts to a choice of units.
We set NUS and NCAN equal to the number of firms in each sector which we observe in the
data. Note, however, that not all of these firms will end up being active due to homogeneous-
goods Cournot competition with heterogeneous firms.15 In Section 4.4, we address this issue
in two extensions. First, we introduce a competitive fringe of price-taking firms which co-
exist with a small number of oligopolists. Second, we analyze a differentiated-goods Bertrand
model where, due to CES demand, all firms remain active.
We are left with a nine-dimensional vector of parameters to calibrate in every sector:
Γ =(aCAN , bUS, bCAN , τUS,CAN , τCAN,US, xUS, xCAN , ζUS, ζCAN
).
The value of Γ is chosen so as to match the following nine empirical moments in each sector:
the ratio of U.S. to Canadian prices, domestic sales, the value of U.S. and Canadian bilateral
exports, production-based Herfindahl-Hirschman concentration indices (HHI), and total costs
in both countries. Note that the number of elements in Γ equals the number of empirical
moments, so that the parameters are exactly identified.
15In the real world, most firms are likely to have little market power. To generate this in a homogeneous-goods Cournot model would require having little dispersion in productivity, and many firms having marginalcosts just below the equilibrium market price.
13
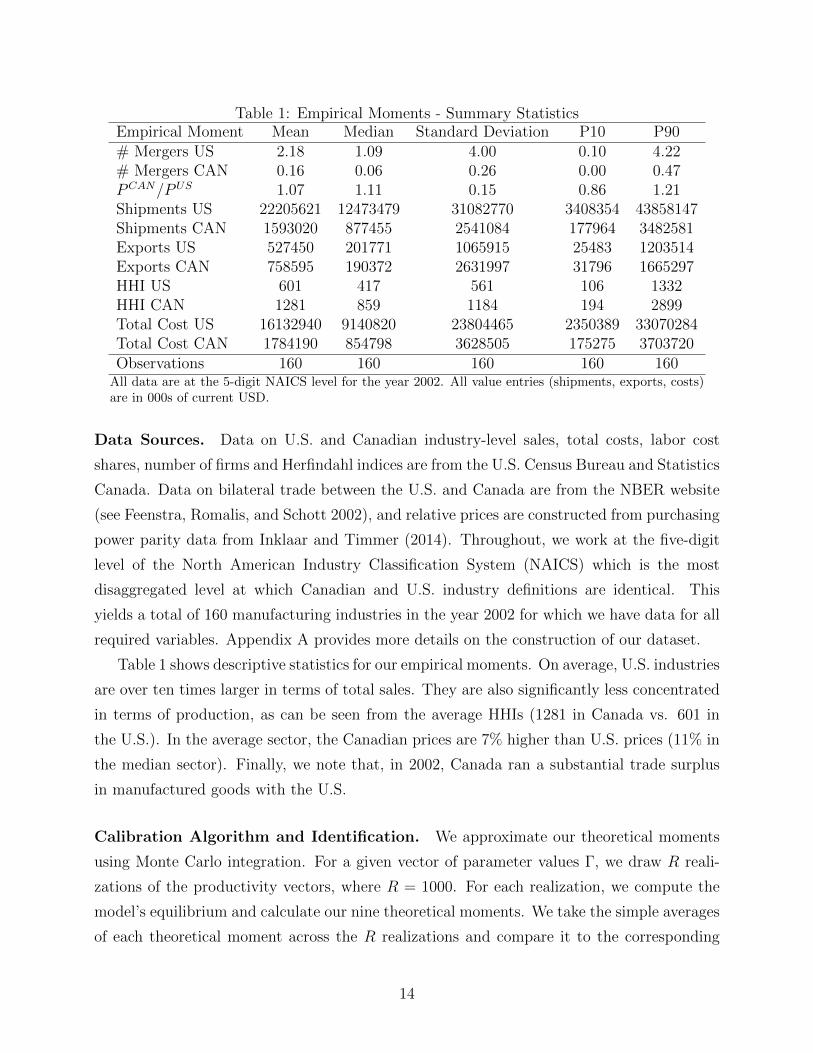
Table 1: Empirical Moments - Summary StatisticsEmpirical Moment Mean Median Standard Deviation P10 P90# Mergers US 2.18 1.09 4.00 0.10 4.22# Mergers CAN 0.16 0.06 0.26 0.00 0.47PCAN/PUS 1.07 1.11 0.15 0.86 1.21Shipments US 22205621 12473479 31082770 3408354 43858147Shipments CAN 1593020 877455 2541084 177964 3482581Exports US 527450 201771 1065915 25483 1203514Exports CAN 758595 190372 2631997 31796 1665297HHI US 601 417 561 106 1332HHI CAN 1281 859 1184 194 2899Total Cost US 16132940 9140820 23804465 2350389 33070284Total Cost CAN 1784190 854798 3628505 175275 3703720Observations 160 160 160 160 160
All data are at the 5-digit NAICS level for the year 2002. All value entries (shipments, exports, costs)are in 000s of current USD.
Data Sources. Data on U.S. and Canadian industry-level sales, total costs, labor cost
shares, number of firms and Herfindahl indices are from the U.S. Census Bureau and Statistics
Canada. Data on bilateral trade between the U.S. and Canada are from the NBER website
(see Feenstra, Romalis, and Schott 2002), and relative prices are constructed from purchasing
power parity data from Inklaar and Timmer (2014). Throughout, we work at the five-digit
level of the North American Industry Classification System (NAICS) which is the most
disaggregated level at which Canadian and U.S. industry definitions are identical. This
yields a total of 160 manufacturing industries in the year 2002 for which we have data for all
required variables. Appendix A provides more details on the construction of our dataset.
Table 1 shows descriptive statistics for our empirical moments. On average, U.S. industries
are over ten times larger in terms of total sales. They are also significantly less concentrated
in terms of production, as can be seen from the average HHIs (1281 in Canada vs. 601 in
the U.S.). In the average sector, the Canadian prices are 7% higher than U.S. prices (11% in
the median sector). Finally, we note that, in 2002, Canada ran a substantial trade surplus
in manufactured goods with the U.S.
Calibration Algorithm and Identification. We approximate our theoretical moments
using Monte Carlo integration. For a given vector of parameter values Γ, we draw R reali-
zations of the productivity vectors, where R = 1000. For each realization, we compute the
model’s equilibrium and calculate our nine theoretical moments. We take the simple averages
of each theoretical moment across the R realizations and compare it to the corresponding
14

empirical moments. We iterate over parameter values Γ using standard derivative-based
methods until we achieve a perfect fit.16
Each of our empirical moments has a natural parameter counterpart which allows a straig-
htforward illustration of how the parameters in Γ are identified. Parameter aCAN governs the
price elasticity of demand in Canada, which pins down the ratio of Canadian to U.S. prices,
PCAN/PUS. The ratio of country i’s imports (Exportji) to country i’s domestic sales (Salesi)
is monotonically decreasing in τ ji, and Exportji and Salesi are both proportional to 1/bi.
This pins down bi and τ ji. The Herfindahl-Hirschman indices we are targeting are based on
the value of production of domestic firms destined for both the domestic and foreign export
markets (rather than on the sales by domestic firms and foreign exporters in the domestic
market). Thus, ζ i has a strong and positive impact on country i’s HHI, and a much weaker
one on country j’s HHI. Total costs in country i are pinned down by xi.
Goodness-of-Fit and Parameter Values. Figure 1 plots the model fit for our nine
targeted moments in all 160 sectors. As can be seen graphically, we match our empirical
moments almost perfectly in all sectors. As a cross-validation check, Figure 2 plots the
model fit for six moments that were not directly targeted in the calibration: the 4-, 8- and
20-firm concentration ratios in both countries. Our calibrated model does a reasonably good
job at predicting these moments as well.
Panel A of Table 2 reports summary statistics on the parameters we take directly from
the data. The U.S. is about one third more productive than Canada in the outside sector,
and the average manufacturing sector in the U.S. has about six times as many firms as in
Canada.
Panel B of Table 2 reports summary statistics on the calibrated parameters. Trade costs
(τ) from the U.S. to Canada are about 5% higher than trade costs from Canada to the U.S.
in both the average and the median sector. This is driven by the fact that the U.S. was
running a trade deficit with Canada in 2002.17 In the median sector, aCAN is very close
16In practice, we minimize the sum of the squared residuals, where following Davis, Haltiwanger, and Schuh(1996) the residual is defined as the difference between the theoretical and empirical moments, divided bythe arithmetic average of the theoretical and empirical moments. This residual converges to the percentagedeviation when the theoretical moment tends to the empirical moment. Using this residual definition improvesthe convergence properties of our algorithm relative to using standard percentage deviations because residualsbehave symmetrically (equal punishment for negative and positive deviations) and always remain bounded.
17While the τ ’s are larger than one in most sectors, there are a few sectors in which they are smaller thanone, which seems to be at odds with the conventional interpretation of iceberg trade costs. One possibleexplanation is that, in a given sector, products sold in the U.S. market are not the same as those sold in theCanadian market. This could explain why it could be cheaper for a U.S. firm to serve the Canadian marketthan its own domestic market. An alternative explanation could be that, in some sectors, a significant fraction
15

Figure 1: Theoretical vs. Empirical Moments (targeted moments)
Figures plot theoretical moments (vertical axis) against empirical moments (ho-rizontal axis). Each dot represents a sector. The straight line is the 45-degreeline.
Figure 2: Theoretical vs. Empirical Moments (moments not targeted)
Figures plot theoretical moments (vertical axis) against empirical moments (ho-rizontal axis). Each dot represents a sector. The straight line is the 45-degreeline.
16
to aUS, meaning that demand elasticities in the U.S. and Canada are quite similar.18 In
the median sector, 1/bUS is about 13 times higher than 1/bCAN , which, if we interpret 1/b
as a market size parameter, is roughly consistent with the ratio of median U.S. to median
Canadian industry sales (see Table 1).19,20
4.3 Counterfactual Experiments
Using our calibrated model, we now compute our conflict statistics ρUS and ρCAN to look at
which types of conflicts are most frequent, both at current trade costs (i.e., at our calibrated
values for τUS,CAN and τCAN,US) and at higher and lower levels of trade costs. Figures 3 and 4
show how ρUS and ρCAN change as trade costs vary. We consider uniform percentage changes
in both τUS,CAN and τCAN,US by multiplying the originally calibrated τ ’s by the same factor
in all sectors. We recompute the model equilibrium with the new trade cost parameters but
keep all other calibrated parameters constant. This leads to new equilibrium prices (PUS,
PCAN) which we use to compute ρUS and ρCAN for each sector. Figure 3 plots percentiles of
the distribution of ρUS across sectors for different percentage trade cost changes, and Figure 4
does the same for ρCAN .
At the original level of trade costs (0% change), U.S. merger policy is too tough on Canada
in the majority of sectors; in only around 20% of sectors we have ρUS < 1. As Figure 4 shows,
the situation is different in Canada. There are no sectors in which Canadian policy is too
lenient according to our potential conflict statistic (ρ). Instead, Canada is always too tough
on its own domestic mergers from the point of view of U.S. consumers. The intuition behind
this difference is straightforward. The U.S. market is more competitive than the Canadian
of the U.S. industry is located close to the Canadian border. When this is the case, it can be more costly fora U.S. firm to supply the average American consumer than it is to supply the average Canadian consumer.
18Things appear to be different in the average sector, where aCAN is almost three times as high as in theU.S. We interpret these findings as follows. As we discuss in Appendix A, Canadian prices are higher thanU.S. prices in the average and median sectors. Part of the reason for this is that Canada has fewer firmsthan the U.S., which suffices to rationalize the U.S.-Canada price ratio in the median sector. However, ina significant number of sectors, this price ratio is so high that differences in numbers of firms alone do notsuffice, and the model needs to make Canadian consumers much less price-elastic than U.S. ones. This seemsto be driving the average aCAN .
19Again, things look different in the average sector, where the gap between 1/bUS and 1/bCAN shrinkssignificantly, but one should keep in mind that it is more difficult to think of 1/b as a market size parameterwhen the a’s are allowed to vary (recall that aCAN ' aUS in the median sector but aCAN >> aUS in theaverage sector).
20We obtain that xUS < xCAN in the average and median sectors. At the same time, there is moredispersion in productivity in the U.S. than in Canada (ζUS < ζCAN ). This result is driven by the fact thatthe U.S. has many more firms, which, for a given level of productivity dispersion, should imply much lowerU.S. HHIs. While U.S. HHIs are indeed lower than Canadian ones in our data, the model still requires moreproductivity dispersion in the U.S. in order not to underpredict U.S. HHIs.
17

Figure 3: Potential Conflicts Arising from U.S. Mergers
Figure shows percentiles of the distribution of ρUS across sectors for different tradecost changes.
Figure 4: Potential Conflicts Arising from Canadian Mergers
Figure shows percentiles of the distribution of ρCAN across sectors for differenttrade cost changes.
18

Table 2: Parameter Values - Summary Statistics (Calibration without Mergers)A) Parametersfrom Data
Mean Median Standard Deviation P10 P90
αUS 1 1 0 1 1αCAN 0.750 0.750 0 0.750 0.750NUS 1605.825 705 3147.181 134 3783.5NCAN 269.788 131.5 423.494 27.5 637.5ηUS 0.288 0.277 0.099 0.165 0.417ηCAN 0.26 0.259 0.096 0.118 0.378B) CalibratedParameters
Mean Median Standard Deviation P10 P90
aUS 25 25 0 25 25aCAN 69.279 23.699 122.487 7.077 180.6661/bUS 18490.707 6343.944 46070.990 1155.054 40278.8481/bCAN 4992.182 475.525 28828.759 32.401 6383.334τCAN,US 1.758 1.453 1.149 1.164 2.456τUS,CAN 1.854 1.506 1.341 0.810 3.103ζUS 5.414 4.987 2.958 2.568 8.251ζCAN 11.585 8.328 9.545 4.611 24.179xUS 0.376 0.183 0.635 0.051 0.690xCAN 0.488 0.270 0.699 0.086 1.114Observations 160 160 160 160 160We compute all parameters reported in the Table separately for each 5-digit NAICS industry. TheTable reports summary statistics calculated across all industries.
market, which is reflected in a lower relative price PUS/PCAN . Even though iceberg trade
costs are larger than one on average and in the vast majority of sectors, this sometimes leads
to ρUS < 1. By contrast, both τCAN,US and PCAN/PUS are usually larger than unity, leading
to ρCAN > 1 in all sectors in our data.
As implied by Proposition 2, the quantiles of ρUS and ρCAN are increasing in trade costs.
In addition, we find that for trade cost reductions of 25%-30%, ρUS and ρCAN decrease
below one in the median sector, meaning that conflict of the too-lenient-for-thy-neighbor
type becomes the most prevalent form of conflict.
These results suggest that even if countries do have veto rights over foreign mergers, they
may only use them infrequently at present levels of trade costs. This is particularly true for
large, competitive economies such as the U.S. Hence, high-profile cases such as GE/Honeywell
and Gencor/Lonrho, where the merger was approved by the domestic authority but blocked
by a foreign authority, are likely to be the exception rather than the rule, even if national
authorities do claim jurisdiction over foreign mergers. However, veto rights become much
more important as trade costs fall. Indeed, in our numerical simulations, too-lenient-for-thy-
19

neighbor policies emerge as the dominant source of conflict for trade cost reductions that do
not appear large from a historical perspective.21 In Section 5, we impose more structure to
put a monetary value on the costs and benefits of veto rights at different levels of trade costs.
4.4 Robustness Checks
We now present a number of robustness checks which investigate how sensitive our findings
are to changes in the data and modeling frameworks used. For conciseness, we only provide
a brief discussion in this section and refer the reader to the Online Appendix for additional
details.
Unit-Value-Based Relative Price Data. As a first robustness check, we compute rela-
tive prices using unit values constructed from our sector-level trade data. While unit values
tend to be imprecisely measured and sometimes result in implausibly large price differences
between the U.S. and Canada, they have the advantage of allowing the computation of re-
lative prices at a finer level of aggregation than the PPP data (see Appendix A for details).
Using unit-value-based relative price data leads to more dispersion in relative prices and slig-
htly changes parameter values. However, the calibrated levels of trade costs are very similar
to before and the U.S. continues to be the more competitive market in the sense of having
a lower price. Our conflict statistics, ρUS and ρCAN , are also very similar to before, both at
the current level and at lower and higher values of trade costs.22
Competitive Fringe. For our second robustness check, we explicitly model a competitive
fringe. We assume that out of the total N domestic firms in each sector, No behave oligo-
polistically whereas the remaining N − No firms belong to a competitive fringe that takes
the market price as given. In the absence of detailed information about the likely number of
oligopolists in each sector, we set No to the number of the largest firms which jointly account
for 80% of total sectoral sales in the data. The parameter values for this competitive fringe
extension are broadly similar to the baseline calibration and the evolution of our conflict
statistics is almost identical to the one reported in Figures 3 and 4.23
CES-Differentiated Bertrand Competition. Our last robustness check undertakes a
more substantial modification of our baseline model. We now work with a CES demand
21See Jacks, Meissner, and Novy (2008) for estimates of trade cost changes over the period 1870 to 2000.22See Online Appendix Tables G.1.1 and G.1.2, and Figures G.1.1–G.1.4.23See Online Appendix Section C.
20
system and assume that firms produce differentiated products and compete a la Bertrand.
We first show that Proposition 1 extends word for word to the case of price competition with
CES demands if we replace P i∗ and P j∗ by the equilibrium CES price indices in countries
i and j in the definition of conflict statistic ρj∗. Next, we calibrate the model and show
that, at current trade costs levels, ρUS and ρCAN are larger than one in all sectors, which is
consistent with the results obtained in the baseline. As trade costs decrease, some of the ρ’s
decrease below one, which indicates that domestic merger policies are likely to become too
lenient for foreign consumers in a number of sectors.24
5 Model Calibration with Mergers
Thus far, we have identified the dominant form of conflict between national authorities at
different levels of trade costs. In this section, we go one step further and try to put a
monetary value on the costs and benefits of alternative ways of coordinating national merger
policies. This requires much stronger assumptions. In particular, we have to model explicitly
an endogenous merger formation process and take a stance on the strength of merger-specific
synergies, on merger authorities’ objective functions, and on whether the U.S. and Canada
can veto each others’ mergers.
We proceed in the following way. We again start out with N is potentially active manu-
facturing firms in sector s and country i. Firms are then allowed to merge, leading to a
new market structure in each country. We compute our theoretical moments at the end of
the merger process and compare them to the same empirical moments described above. In
addition, we also keep track of the number of mergers taking place during the merger process
and match them to the actual number of mergers observed in the data in a given sector.
5.1 Merger Formation Process
We take a simple and tractable dynamic random matching approach to operationalize the
merger formation process. In sector s, firms play a dynamic game with T 1s + T 2
s + 1 periods,
where T 1s ≥ 0 and T 2
s ≥ 0 are parameters. Nature randomly and uniformly draws T 1s periods
in {1, . . . , T 1s +T 2
s } in which country 1 will receive merger opportunities, and the complemen-
tary T 2s periods in {1, . . . , T 1
s + T 2s } in which country 2 will receive merger opportunities.25
24See Online Appendix Section D.25We view T 1 and T 2 as parameters capturing frictions in the market for firm ownership. A low T i means
that these frictions are strong, so that few mergers are feasible. Conversely, a high T i means that almostevery merger is feasible, albeit not necessarily profitable or approvable. To improve the model’s fit to the
21

From now on, we drop sector subscripts for ease of notation.
Whenever two firms merge, the productivity of the merged entity becomes:
zM =(zδ1 + zδ2
) 1δ , (1)
where parameter δ governs the strength of synergies. Note that zM > max(z1, z2) for any
δ ∈ (0,∞), and that zM is decreasing in δ. In the limit as δ →∞, we have zM = max(z1, z2),
which corresponds to the case of no synergies in the sense of Farrell and Shapiro (1990).26 In
the following, we assume that synergies are random and merger-specific, i.e., the δ associated
with a merger between firms k and l is drawn from a log-normal distribution with mean
parameter ln(βis)− 12
and variance parameter 1, where βis is a parameter of the model.
Now consider period t ∈ {1, . . . , T 1 + T 2}, and suppose country i receives a merger
opportunity in this period. The timing within period t is as follows. 1) Nature randomly and
uniformly draws two merger partners in country i: the acquirer and the target. Nature also
draws a synergy parameter δ for this merger. 2) The acquirer can make a take-it-or-leave-it
offer to the target. 3) If an offer has been made, then the target accepts or rejects it. 4) If
a merger proposal has been made and accepted, then the antitrust authority in the country
where the merger is proposed decides whether to approve it. 5) Firms decide whether to stay
in the industry. If a firm exits, then it receives a positive but arbitrarily small scrap value.
6) Firms compete in quantities in both manufacturing markets.
Period t = 0 is special in that no country receives a merger opportunity in that period.
This allows us to accommodate sectors in which there are no mergers. The timing within
period 0 is the same as within period t > 0, except that sub-stages 1 through 4 are dropped.
We assume that all players have discount factors equal to zero. This means that firms
evaluate the profitability of mergers and make their exit decisions given the current market
structure. This assumption is necessary to make our approach tractable, given the potentially
large numbers of firms and periods we have to deal with. In conjunction with our earlier
assumptions, it implies that only those mergers will be proposed to the antitrust authority
where the profit of the merged entity at the current post-merger market structure is strictly
data, it is useful to allow T 1 and T 2 to take non-integer values. This is done as follows: the number of mergeropportunities received by country i is equal to the integer part of T i plus a Bernoulli random variable, whichtakes value 1 with a probability equal to the fractional part of T i. These random variables are realized inperiod 0, before the game starts.
26Also note the following two properties of zM . For a merger between two symmetric firms with pre-mergerproductivity z, equation (1) implies that the merger-induced fractional change in productivity is independentof z. Moreover, a mean-preserving spread of the merger partners’ pre-merger productivities induces a largerpost-merger productivity: for ∆ > 0, ((z + ∆)δ + (z −∆)δ)1/δ is increasing in ∆.
22

larger than the sum of the pre-merger profits of the merger partners. Similarly, due to the
strictly positive scrap value, firms that do not produce in the current period will exit the
market, ensuring that mergers will take place only between active firms (which is what we
observe in our data).
As mentioned above, we also need to take a stance on the merger authorities’ objective
functions. While the U.S., the EU and most other important jurisdictions have adopted
something close to a consumer surplus standard in merger control, Canada has long been
thought of as having adopted a total surplus standard. However, in the last twenty years
or so, the Canadian merger authority has been pushed towards putting a greater weight on
consumer surplus: “As a result of [...] extensive litigation, it appears that the total surplus
standard no longer serves as the basis for merger evaluation in Canada” (Gifford and Kudrle
2005). For simplicity, we assume here that both the U.S. and Canadian authorities have
a consumer surplus standard. In conjunction with the impatience assumption, this implies
that antitrust authorities follow a simple rule, whereby they block a merger if and only if
this merger lowers domestic consumer surplus given the current market structure.27 Under
these assumptions, it is straightforward to show that our merger game has a unique subgame-
perfect equilibrium. Given equilibrium strategies, we compute our theoretical moments at
the end of stage T 1 + T 2 + 1.
5.2 Calibration Procedure and Results
Introducing a merger formation process into our calibration necessitates a number of changes.
First, we now also have to calibrate T 1 and T 2. We choose T 1 and T 2 such that the number of
mergers taking place during the merger formation process equals the actual average annual
number of mergers in each sector over the period 1993-2002.28 Second, we now calculate
the theoretical moments at the end of the merger game, which means that the calibrated
values of our other parameters will also change. Finally, we need to take a stance on the
strength of synergies as captured by the β-parameters. Unfortunately, the existing literature
does not provide reliable estimates for a broad range of industries. Most papers in the
merger simulation literature use arbitrary levels of synergies to simulate the price effect of a
merger (Hausman, Leonard, and Zona 1994; Werden and Froeb 1994; Nevo 2000).29 A large
27Given the current legal frameworks in most countries, it would be difficult for an antitrust authority toclear (or block) a merger on the grounds that this merger is likely to lead to more (or fewer) mergers in thefuture.
28The source of our merger data is Thomson SDC Platinum. See Appendix A for details.29A few papers use post-merger data to assess the accuracy of merger simulations and investigate the dis-
crepancy between simulated and realized price effects (Peters 2006; Weinberg and Hosken 2013; Bjornerstedt
23
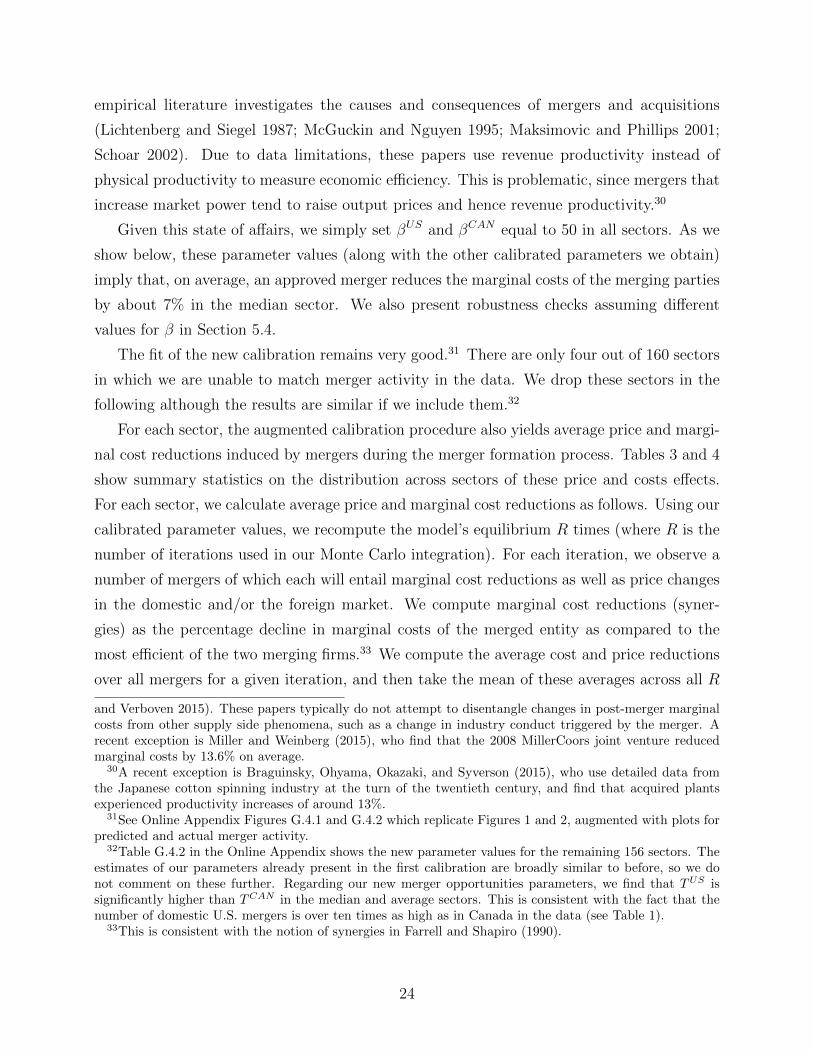
empirical literature investigates the causes and consequences of mergers and acquisitions
(Lichtenberg and Siegel 1987; McGuckin and Nguyen 1995; Maksimovic and Phillips 2001;
Schoar 2002). Due to data limitations, these papers use revenue productivity instead of
physical productivity to measure economic efficiency. This is problematic, since mergers that
increase market power tend to raise output prices and hence revenue productivity.30
Given this state of affairs, we simply set βUS and βCAN equal to 50 in all sectors. As we
show below, these parameter values (along with the other calibrated parameters we obtain)
imply that, on average, an approved merger reduces the marginal costs of the merging parties
by about 7% in the median sector. We also present robustness checks assuming different
values for β in Section 5.4.
The fit of the new calibration remains very good.31 There are only four out of 160 sectors
in which we are unable to match merger activity in the data. We drop these sectors in the
following although the results are similar if we include them.32
For each sector, the augmented calibration procedure also yields average price and margi-
nal cost reductions induced by mergers during the merger formation process. Tables 3 and 4
show summary statistics on the distribution across sectors of these price and costs effects.
For each sector, we calculate average price and marginal cost reductions as follows. Using our
calibrated parameter values, we recompute the model’s equilibrium R times (where R is the
number of iterations used in our Monte Carlo integration). For each iteration, we observe a
number of mergers of which each will entail marginal cost reductions as well as price changes
in the domestic and/or the foreign market. We compute marginal cost reductions (syner-
gies) as the percentage decline in marginal costs of the merged entity as compared to the
most efficient of the two merging firms.33 We compute the average cost and price reductions
over all mergers for a given iteration, and then take the mean of these averages across all R
and Verboven 2015). These papers typically do not attempt to disentangle changes in post-merger marginalcosts from other supply side phenomena, such as a change in industry conduct triggered by the merger. Arecent exception is Miller and Weinberg (2015), who find that the 2008 MillerCoors joint venture reducedmarginal costs by 13.6% on average.
30A recent exception is Braguinsky, Ohyama, Okazaki, and Syverson (2015), who use detailed data fromthe Japanese cotton spinning industry at the turn of the twentieth century, and find that acquired plantsexperienced productivity increases of around 13%.
31See Online Appendix Figures G.4.1 and G.4.2 which replicate Figures 1 and 2, augmented with plots forpredicted and actual merger activity.
32Table G.4.2 in the Online Appendix shows the new parameter values for the remaining 156 sectors. Theestimates of our parameters already present in the first calibration are broadly similar to before, so we donot comment on these further. Regarding our new merger opportunities parameters, we find that TUS issignificantly higher than TCAN in the median and average sectors. This is consistent with the fact that thenumber of domestic U.S. mergers is over ten times as high as in Canada in the data (see Table 1).
33This is consistent with the notion of synergies in Farrell and Shapiro (1990).
24

iterations.
As seen in Table 3, mergers have larger effects on domestic prices than on foreign prices
in both the mean and the median sector. There is also a large degree of heterogeneity in
terms of the magnitude of effects, with price reductions reaching from 0% to close to -2% in
a few sectors. Because each country has a veto right over domestic mergers, domestic price
effects are all non-positive by construction. While cross-border price effects are also negative
on average, U.S. mergers lead to price increases in a few Canadian sectors. Table 4 shows
that the average cost reductions implied by mergers is around 7% in the median sectors in
both countries (9% in the average sector). These numbers do not appear unreasonably large
compared to the estimates we found in the existing literature (see Footnotes 29 and 30).
Table 3: Simulated Domestic and Cross-Border Price Effects of Mergers
Price Effect Mean MedianStandardDeviation
P10 P90
US merger, US price -0.11% -0.06% 0.12% -0.26% -0.01%US merger, CAN price -0.03% -0.01% 0.09% -0.09% 0.01%CAN merger, CAN price -0.14% -0.07% 0.18% -0.32% -0.01%CAN merger, US price -0.08% -0.01% 0.22% -0.30% 0.00%
We compute the domestic and cross-border price effects of mergers separately for each5-digit industry. The Table reports summary statistics calculated across all industries.Industries without merger opportunities are dropped.
5.3 Counterfactual Policy Regimes
Trade Costs and the Scope for Conflicts. The evolution of our conflict statistics with
changes in trade cost is nearly identical to that shown earlier in Figures 3 and 4.34 As before,
these results inform us only about the potential for conflicts. For a given realization of
synergies, no merger might fall in the zone between cUSM and cCANM , so that no actual conflict
may arise. The new calibration now also allows us to look at actual conflicts, i.e., the fraction
34See Online Appendix Figures G.4.3 and G.4.4.
Table 4: Synergy Effects
MC Reduction Mean MedianStandardDeviation
P10 P90
US mergers -7.1% -6.8% 2.8% -10.0% -3.2%Canadian mergers -11.1% -7.2% 9.6% -24.5% -5.6%
We compute the synergy effects of mergers separately for each 5-digit industry.The Table reports summary statistics calculated across all industries. Industrieswithout merger opportunities are dropped.
25

of profitable mergers for which the two antitrust authorities reach conflicting decisions, as
shown in Figures 5 and 6.
These figures show that actual conflicts track potential conflicts closely. Again, the do-
minant conflict is that merger authorities block too many domestic mergers from the point
of view of foreign consumers.35 At the present level of trade cost, there are no merger oppor-
tunities for which the Canadian authorities are too lenient and only a minority of cases (14%
of all profitable merger opportunities) where the U.S. authorities approve mergers leading to
consumer surplus losses in Canada. As trade costs fall, changes in actual conflict patterns
again closely resemble changes in potential conflict patterns, with anti-competitive effects
of foreign mergers becoming the most important source of conflict at trade cost declines of
about 30%.
Introducing Veto Rights. One possible way of eliminating too-lenient-for-thy-neighbor
policies involves granting veto rights over foreign mergers. Each country can only benefit
from having such veto rights. However, the effects from the introduction of bilateral veto
rights are, in general, ambiguous. On the one hand, country i benefits from its antitrust
authority being able to block CS-decreasing mergers taking place among country-j firms. On
the other hand, however, country i suffers from the antitrust authority in country j being
able to block CS-increasing mergers among country-i firms.
We use our augmented calibration to quantify the costs and benefits for consumers of
granting such bilateral veto rights. To do this, we modify stage 4 in the merger game by
assuming that a proposed merger must receive approval from both the U.S. and Canadian
authorities.36 As before, we compute the model’s equilibrium after the merger game, using
the parameter values from our calibration with mergers described above.37
Table 5 shows that, at the present level of trade costs, the introduction of bilateral
veto rights reduces consumer surplus in the U.S. by USD 1.6 million in the average sector,
and slightly increases Canadian consumer surplus, resulting in a reduction in total North
35Note that the fact that a merger is blocked by a merger authority in our model does not necessarilyimply that we would observe the same merger getting blocked in the real world. If the merging parties arereasonably confident that their merger will not be allowed to go through by competition authorities, thenthey will simply not propose it in the first place.
36Under veto rights, we assume that the domestic antitrust authority makes its approval decision before theforeign one. Sequentiality eliminates undesirable equilibria which rely on a coordination problem betweenantitrust authorities. Under simultaneous timing, there always exists an equilibrium in which country iblocks a CS-increasing merger because it expects country j to block it, and vice versa. It does not matterwho moves first: we could assume that the foreign antitrust authority makes its decision before the domesticone, or that the first mover is drawn randomly, and obtain the same results.
37Note that we reset the seed values of our random number generator ahead of each counterfactual, so thatwe obtain the same realizations of all random variables.
26

Figure 5: Actual Conflicts, % of all profitable merger opportunities (U.S. mergers)
Figure shows means across sectors of the fraction of profitable mergers where a conflict arose. “Too lenientfor Canada” means that the U.S. authorized a merger which lowered consumer surplus in Canada; “Tootough for Canada” means that the U.S. blocked a merger which would have increased Canadian consumersurplus. If there are no merger opportunities in a sector, the sector is dropped.
Figure 6: Actual Conflicts, % of all profitable merger opportunities (Canadian mergers)
Figure shows means across sectors of the fraction of profitable mergers where a conflict arose. “Too lenientfor the U.S.” means that Canada authorized a merger which lowered consumer surplus in the U.S.; “Tootough for the U.S.” means that Canada blocked a merger which would have increased U.S. consumer surplus.If there are no merger opportunities in a sector, the sector is dropped.
27

American consumer surplus of USD 230 million across all 156 manufacturing sectors. In
the median sector, this policy change has no effect on consumer surplus in either country.
These findings are in line with our previous results. At the present level of trade costs,
merger policy in Canada is of the too-tough-for-thy-neighbor type in all sectors, implying
that U.S. consumers can only lose from the introduction of bilateral veto rights.38 Moreover,
merger policy in the U.S. is of the too-lenient-for-thy-neighbor type in a minority of sectors,
implying that Canadian consumers in those sectors, and only in those sectors, benefit from
their authority being able to block U.S. mergers.
Table 5: Introducing Veto RightsChange in Outcome(000s USD)
Mean MedianStandardDeviation
P10 P90
Total Consumer SurplusUS+Canada
-1486.5 0 8505.5 -1056.2 0
Consumer Surplus US -1618.7 0 9221 -1302.7 0Consumer Surplus Canada 132.3 0 746.2 0 110.5
We compute the consumer surplus effects of introducing veto rights separately for each5-digit industry. The Table reports summary statistics calculated across all industries.
Next, we explore how the effects on Canadian, U.S. and total North-American consumer
surplus from the introduction of bilateral veto rights change with trade costs. As Figure 7
shows, as trade costs fall from current levels, Canadian consumers gain increasingly while the
effects on U.S. consumers are non-monotonic. To understand these findings, recall that as
trade costs fall, conflicts increasingly turn into the too-lenient-for-thy-neighbor type, implying
that countries tend to gain more from being able to block foreign mergers. This is exactly
what is happening for Canada, which remains the less competitive market and thus has more
to gain from the introduction of bilateral veto rights than the U.S. The flip side of Canada
remaining the less competitive market is, however, that it blocks many U.S. mergers that
would have benefited U.S. consumers. The interaction of these countervailing effects results
in the non-monotonic impact in the U.S.
For trade cost reductions of 50%, the total Canadian consumer surplus gain from intro-
ducing bilateral veto rights increases to over USD 3 billion, while the total U.S. consumer
surplus loss is less than USD 160 million. Overall, these results suggest that veto rights
38There are three sectors in which U.S. consumer surplus increases slightly which might seem puzzlingat first. The explanation is that the introduction of bilateral veto rights prevents some U.S. mergers fromtaking place which would have increased prices in Canada. As a consequence of the lower equilibrium price,additional mergers can now take place in Canada which increase consumer surplus in both Canada and theUnited States. The consumer surplus effects of these additional mergers overcompensate the negative effectson the U.S. of the merger initially blocked by Canada.
28

Figure 7: Consumer surplus change, No-Veto to Veto Case
Figure shows the mean USD change in consumer surplus (in 000s of USD) inducedby a move from no-veto rights to veto rights for different levels of trade costchanges.
become more important as an “insurance” against price-increasing foreign mergers as trade
costs fall, especially for smaller, less competitive countries.
Introducing a North-American Merger Authority An alternative way of coordinating
merger policies involves the creation of a supra-national merger authority that blocks a merger
if and only if it decreases the sum of U.S. and Canadian consumer surplus.39 Like bilateral
veto rights, such a supra-national authority mitigates the problem of too-lenient-for-thy-
neighbor policies. In contrast to bilateral veto rights, however, it also addresses the problem
of too-tough-for-thy-neighbor policies. We use our augmented calibration to quantify the
consumer surplus effects of such a North-American merger authority.
As can be seen in Table 6, we find a large positive impact on aggregate North American
consumer surplus of around USD one billion.40 This overall gain comes at the expense of
39However, there may be an enforcement problem if countries do not give up their own jurisdiction. SeeCabral (2005) for an analysis of how the problem may be solved in an infinitely repeated game in which eachcountry has veto power over both domestic and foreign mergers but, in equilibrium, uses this only selectively.
40There are a few sectors where total North American consumer surplus goes down. This is a consequenceof the myopic behavior of the antitrust authority. By authorizing a number of U.S. mergers which increasetotal consumer surplus but lower consumer surplus in Canada, the joint authority changes the set of futurepermissible mergers in Canada, some of which would have increased North American consumer surplus.While such dynamic effects are usually dominated by the first-order effects of maximizing joint consumer
29

Canada which sees a total drop in consumer surplus of USD 86 million. To understand
why, note that the total North American consumer surplus effects of a given merger tend to
be dominated by changes in U.S. consumer surplus because of the substantial market size
advantage of the U.S. Accordingly, the new antitrust authority bases its decision mainly on
U.S. consumer surplus effects. This is detrimental to Canadian consumer surplus because
Canadian merger policy was initially too tough on domestic mergers from the point of view of
U.S. consumers. The new authority now authorizes a number of domestic Canadian mergers
which increase North-American consumer surplus but were previously blocked by Canada
because they would have increased prices there.
Table 6: North-American Competition AuthorityChange in Outcome(000s USD)
Mean MedianStandardDeviation
P10 P90
Total Consumer SurplusUS+Canada
7043 11.6 39422.8 0 2391.5
Consumer Surplus US 7593.2 0 44433.4 -31.3 1537.4Consumer Surplus Canada -550.3 2.4 5626.6 -51.4 153.6
We compute the consumer surplus effects of creating a North-American competitionauthority separately for each 5-digit industry. The Table reports summary statisticscalculated across all industries.
Figure 8 looks at the consumer surplus changes induced by a supra-national authority at
different levels of trade costs. Recall that as trade costs fall from current levels, the dominant
type of conflict changes and domestic merger authorities tend to become too lenient on
domestic mergers. Because it maximizes total consumer surplus, a North American merger
authority needs to address this too-lenient-for-thy-neighbor conflict. As we saw previously,
it is now Canada which benefits more from its resolution. This explains why the consumer
surplus change in Canada (compared to the baseline scenario of no veto rights) becomes
increasingly positive and starts to resemble the one from the introduction of bilateral veto
rights (see Figure 7). The same effects again have more ambiguous consequences for the U.S.,
where the gains from preventing CS-decreasing Canadian mergers are balanced by a decrease
in CS-increasing domestic merger activity. However, even for large trade cost reductions
there remains a substantial fraction of Canadian mergers on which the Canadian authority
would be too tough (see Figure 6). The joint merger authority will continue to authorize
some of these mergers, so that overall U.S. gains from its introduction remain positive.
These results demonstrate a couple of additional important results about the intercon-
nection of trade and merger policy. First, the level of trade costs determines the predominant
surplus, there are a few sectors where the total consumer surplus change is negative.
30

Figure 8: Consumer surplus change, No-Veto to North-American Competition Authority
Figure shows the mean USD change in consumer surplus (in 000s of USD) inducedby a move from the no-veto-rights case to a North-American merger authority fordifferent trade cost changes.
type of conflict arising from domestic mergers and thus the distribution of gains from the
introduction of a supranational merger authority. Second, at least in our calibration, the over-
all gains for the larger country remain positive throughout but change signs for the smaller
country. This raises the possibility that the political feasibility of merger policy coordination
may depend crucially on the level of trade costs between countries and thus on trade policy.
Only if trade costs are sufficiently low does it become worthwhile for the smaller country to
agree to a merger approval standard aiming at maximizing joint consumer surplus.
5.4 Robustness Checks
In this section, we consider a number of additional robustness checks which are relevant for
the calibration procedure with mergers, but not for our earlier baseline calibration without
mergers. To preserve space, we again only briefly discuss our findings here and present more
detailed results in the Online Appendix.
Different Strength of Synergies. We start by varying the strength of merger-induced
synergies, considering both stronger (β = 30) and weaker synergies (β = 70). In both
cases, the fit of the calibration continues to be very good. Allowing for stronger synergies
31

generates more mergers which are profitable and permitted by the antitrust authorities,
resulting in lower values for the merger opportunity parameters TUS and TCAN . Conversely,
weakening the strength of synergies increases the calibrated values for TUS and TCAN as
more opportunities are needed to match the number of mergers observed in the data. This
adjustment of T to the strength of synergies explains why our counterfactual policy changes
lead to stronger quantitative consumer surplus effects as we increase β (weaker synergies).
While each individual merger now has smaller consumer surplus effects, the change in the
number of merger opportunities is now larger as we start from a higher base value for T .
The latter effect overcompensates the former, leading to slightly stronger consumer surplus
effects in the case of weaker synergies, and less pronounced consumer surplus effects in the
case of stronger synergies. Qualitatively, however, all results are similar to before and our
previous conclusions are not affected by varying the strength of synergies.41
Cross-Border Mergers. The second modification we consider is to allow for cross-border
mergers in addition to domestic mergers. Cross-border mergers are not directly relevant
for this paper’s central question as by choice our interest is in the conflicts resulting from
domestic mergers only. Moreover, recall that the international ownership structure of firms
does not matter for our analysis, given the focus on consumer surplus and the absence
of income effects. Nevertheless, given that cross-border mergers are an important feature
of overall North American merger activity, incorporating them into our calibration might
change parameter values and thus indirectly affect our results.42
We model cross-border mergers by introducing a third merger opportunity parameter
(TCross). Initially, there are only domestic firms. A share TCross/(TCross + TUS + TCAN
)of merger opportunities is now of the cross-border type, i.e., one of the merger partners
is a U.S. firm while the other is a Canadian firm. A merger thus results in a multinational
enterprise (MNE) with production facilities in both countries. This MNE chooses the location
of production for serving each market such that the costs of doing so are minimized. This
triggers changes in production and trade patterns compared to the baseline calibration with
domestic mergers only, which in turn affects other parameter values. However, the resulting
changes are relatively minor and our counterfactual experiments lead to qualitatively similar
results to before.43
41See Online Appendix Sections G.5 and G.6.42Between 1993 and 2002, we observe an annual average of approximately 0.15 U.S.-Canada cross-border
mergers per sector in our data, which is similar to the number of domestic Canadian mergers (see AppendixTable G.7.1).
43See Online Appendix Section E. We adjust TCross to match the number of cross-border mergers in the
32

Veto-Rights Baseline. In our final robustness check, we start from an initial situation in
which countries have veto rights over foreign mergers. That is, we match the same moments
using the same set of parameters as before, but now we assume from the beginning that
antitrust authorities have the power to block foreign mergers if they decrease consumer
surplus in the authority’s domestic market.
All of the results and all parameters values, except TUS, are very similar to the no-veto-
rights baseline, as discussed in more detail in the Online Appendix. The one more substantial
difference is that the overall effect of having a North-American merger authority on Canada
is negative not only at present levels of trade costs but throughout the range of trade cost we
analyze. While exactly the same forces are at work as before, Canada is now able to block all
of the CS-decreasing U.S. mergers in the baseline. In the no-veto-rights baseline, the reason
why Canada started to gain from a North-American merger authority was precisely because
the joint authority addressed some of the too-lenient-for-thy-neighbor type conflict arising at
lower trade costs. This source of gain for Canada is absent in the new veto-rights baseline.44
In conclusion, the forces at work in our model are robust to a different interpretation of
the current legal regime concerning veto rights. Having said this, we think it unlikely that
Canada has effective veto rights over U.S. mergers, casting doubt on the results driven by
this assumption.45
6 Conclusion
Because of cross-border demand and supply linkages, merger approval decisions of national
antitrust authorities have important externalities on other jurisdictions. To analyze the
resulting conflicts of interest between merger authorities, we analyze a two-country model
of international trade with oligopolistic competition. Within this model, we identify the
conditions under which merger control based on a domestic consumer surplus standard is
too tough or too soft from the viewpoint of foreign consumers. We show that the type of
conflict depends only on the value of an industry-level sufficient statistic which summarizes
the relative competitiveness of the home and foreign markets, adjusting for trade costs. A
key result is that, unless trade costs and market asymmetries happen to exactly offset each
data. Note that the overall fit of the model deteriorates slightly, as we now have to match an additionalmoment. We now have to drop seven sectors (rather than four in the baseline calibration with mergers) forwhich we are unable to match our empirical moments.
44See Online Appendix Section F.45In private correspondence with the Canadian competition authority, we were advised that no U.S. merger
had been blocked by the Canadians over the past two decades, although remedies were imposed in a fewcases.
33

other, the interests of the national authorities are never fully aligned, so conflicts can be
expected to be frequent.
To judge what type of conflict is most prevalent in practice, we calibrate our model to
match industry-level data for 160 U.S. and Canadian manufacturing sectors in the year 2002.
We find that the majority of these conflicts are ‘hidden’, in the sense that they do not show
in high-profile cases in which domestic authorities block foreign mergers. This is because, at
current levels of trade costs, the main issue for the international coordination of merger policy
is not that domestic authorities clear too many mergers from the point of view of foreign
consumers. Rather, foreign consumers would like to see more mergers taking place abroad
in the vast majority of sectors. This means that veto rights are a relatively inefficient tool
when coordinating national merger policies. They cannot address the problem that domestic
consumers mostly would like to see more, rather than fewer foreign mergers.
This situation changes dramatically as trade costs decrease, however. For trade cost
reductions which do not appear large from a historical perspective (around 25-30%), conflicts
arising from the consumer-surplus-decreasing effects of mergers taking place abroad become
the dominant type of conflict. This clearly shows that merger policy and trade policy (or
trade costs more generally) interact in an important sense. Further reductions in trade costs
will make it more important for domestic authorities to be able to veto mergers taking place
abroad.
We have explicitly shown that the above-mentioned calibration results hold across a range
of standard assumptions on market structure (Cournot with linear demand, with and wit-
hout a competitive fringe; Bertrand with CES demand). We are also confident that they
hold more generally. What is important are differences in initial market structure and the
presence of substantial trade costs, irrespective of the particular specification used. The fin-
ding that trade costs are still high despite decades of trade liberalization and reductions in
transportation costs is not specific to our calibration, but has been shown in a wide variety
of contexts and using different methodologies (e.g., Anderson and van Wincoop 2004).
To get a better understanding of the quantitative importance of conflicts between merger
authorities, we have also provided a second set of calibration results. These require stron-
ger assumptions (e.g., a specification of a merger formation process) but allow us to assign
monetary values to the costs and benefits of international coordination of merger control
at different levels of trade costs. These results confirm that veto rights are not important
at current levels of trade costs. In contrast, establishing a supra-national merger autho-
rity results in sizeable consumer surplus gains because such an authority can address the
34

conflict caused by too-tough-for-thy-neighbor policies. Perhaps surprisingly, these gains are
highly asymmetric across countries, with Canadian consumers being worse off, suggesting
that such a supra-national authority may be difficult to establish politically. However, the
picture changes as trade costs fall. Veto rights become much more valuable quantitatively,
in particular for Canada as the smaller and less competitive country. As a consequence, a
supranational merger authority increasingly addresses conflicts arising from too-lenient-for-
thy-neighbor policies. This benefits Canada, making agreement on such an authority more
likely.
In addition to providing a theoretical and quantitative analysis of international aspects
of merger policy, the paper also makes a methodological contribution. It showcases how
industry-level data can be used to put discipline on parameter values in international trade
models with heterogeneous firms and oligopolistic competition. The techniques we introduce
to calibrate our model may be helpful to quantify some of the more qualitative insights from
existing work in the area of international trade, such as those from the literature on strategic
trade policy.
An interesting avenue for future quantitative work consists in studying how merger policy
can be used strategically by countries, and to what extent it may complement or substitute
for more traditional trade policy instruments.
References
[1] Anderson, James E. and Eric van Wincoop (2004). “Trade costs.” Journal of Economic
Literature, vol. 42, 691–751.
[2] Bagwell, Kyle, Chad P. Bown, and Robert W. Staiger (2015). “Is the WTO Passe?”
CEPR Discussion Paper 10672.
[3] Barros, Pedro P. and Luis Cabral (1994). “Merger Policy in Open Economies.” European
Economic Review, vol. 38(5), 1041–1055.
[4] Bjornerstedt, Jonas and Frank Verboven (2015). “Does Merger Simulation Work? Evi-
dence from the Swedish Analgesics Market.” American Economic Journal: Applied Eco-
nomics, forthcoming.
[5] Braguinsky, Serguey, Atsushi Ohyama, Tetsuji Okazaki, and Chad Syverson (2015).
“Acquisitions, Productivity, and Profitability: Evidence from the Japanese Cotton Spin-
ning Industry.” American Economic Review, vol. 105(7), 2086–2119.
35

[6] Brander, James A. (1995). “Strategic Trade Policy.” In: Handbook of International Eco-
nomics, vol. 3, eds. Gene Grossman and Kenneth Rogoff. Amsterdam: North Holland.
[7] Brander, James A. and Paul Krugman (1983). “A ‘Reciprocal Dumping’ Model of In-
ternational Trade.” Journal of International Economics, vol. 15(3-4), 313–321.
[8] Brander, James A. and Barbara J. Spencer (1985). “Export Subsidies and International
Market Share Rivalries.” Journal of International Economics, vol. 18(1), 81–100.
[9] Breinlich, Holger (2008). “Trade Liberalization and Industrial Restructuring through
Mergers and Acquisitions.” Journal of International Economics, vol. 76(2), 254–266.
[10] Cabral, Luis M. B. (2005). “An Equilibrium Approach to International Merger Policy.”
International Journal of Industrial Organization, vol. 23(9-10), 739–751.
[11] Chaney, Thomas (2008). “Distorted Gravity: The Intensive and Extensive Margins of
International Trade.” American Economic Review, vol. 98(4), 1707–1721.
[12] Davis, Steven J., John Haltiwanger, and Scott Schuh (1996). Job Creation and De-
struction. Cambridge, MA: MIT Press.
[13] De Stefano, Martino and Marc S. Rysman (2010). “Competition Policy as Strategic
Trade with Differentiated Products.” Review of International Economics, vol. 18(4),
758–771.
[14] di Giovanni, Julian (2005). “What Drives Capital Flows? The Case of Cross-Border
M&A Activity and Financial Deepening.” Journal of International Economics, vol.
65(1), 127–149.
[15] Eaton, Jonathan, Samuel Kortum, and Francis Kramarz (2011). “An Anatomy of Inter-
national Trade: Evidence From French Firms.” Econometrica, vol. 79(5), 1453–1498.
[16] Farrell, Joseph and Carl Shapiro (1990). “Horizontal Mergers: An Equilibrium Analy-
sis.” American Economic Review, vol. 80(1), 107–126.
[17] Feenstra, Robert C., John Romalis, and Peter K. Schott (2002). “U.S. Imports, Exports,
and Tariff Data, 1989–2001.” NBER Working Paper No. 9387.
[18] Gomes, Armando (2005). “Multilateral Contracting with Externalities.” Econometrica,
vol. 73(4), 1329–1350.
36

[19] Gomes, Armando, and Philippe Jehiel (2005). “Dynamic Processes of Social and Eco-
nomic Interactions: On the Persistence of Inefficiencies.” Journal of Political Economy,
vol. 113(3), 626–667.
[20] Gifford, Daniel J. and Robert T. Kudrle (2005). “Rhetoric and Reality in the Mer-
ger Standards of the United States, Canada, and the European Union.” Antitrust Law
Journal, vol. 72(2), 423–469.
[21] Griffin, Joseph P. (1999). “Extraterritoriality in U.S. and EU Antitrust Enforcement.”
Antitrust Law Journal, vol. 67(1), 159–199.
[22] Hausman, Jerry, Gregory Leonard, and J. Douglas Zona (1994). “Competitive Analysis
with Differenciated Products.” Annales D’´Economie et de Statistique, vol. 34, 159–180.
[23] Helpman, Elhanan, Marc J. Melitz, and Stephen R. Yeaple (2004). “Export Versus FDI
with Heterogeneous Firms.” American Economic Review, vol. 94(1), 300–316.
[24] Horn, Henrik and James Levinsohn (2001). “Merger Policies and Trade Liberalisation.”
Economic Journal, vol. 111(470), 244–276.
[25] Inklaar, Robert and Marcel P. Timmer (2014), “The Relative Price of Services.” Review
of Income and Wealth, vol. 60(4), 727–746.
[26] Jacks, David S., Christopher M. Meissner, and Dennis Novy (2008). “Trade Costs, 1870–
2000.” American Economic Review: Papers & Proceedings, vol. 98(2), 529–534.
[27] Jehiel, Philippe, and Benny Moldovanu (1995a). “Negative Externalities May Cause
Delay in Negotiations.” Econometrica, vol. 63(6), 1321–1335.
[28] Jehiel, Philippe, and Benny Moldovanu (1995b). “Cyclical Delay in Bargaining with
Externalities.” Review of Economic Studies, vol. 62(4), 619–637.
[29] Lichtenberg, Frank R. and Donald Siegel (1987). “Productivity and Changes in Owners-
hip of Manufacturing Plants.” Brookings Papers on Economic Activity, vol. 3, 643–683.
[30] Maksimovic, Vojislav and Gordon Phillips (2001). “The Market for Corporate Assets:
Who Engages in Mergers and Asset Sales and Are There Efficiency Gains?” The Journal
of Finance, vol. 56(6), 2019–2065.
37

[31] Mayer, Thierry, Marc J. Melitz, and Gianmarco I. P. Ottaviano (2014). “Market Size,
Competition, and the Product Mix of Exporters.” American Economic Review, vol.
104(2), 495–536.
[32] McGuckin, Robert H. and Sang V. Nguyen (1995). “On Productivity and Plant Ow-
nership Change: New Evidence from the Longitudinal Research Database.” The RAND
Journal of Economics, vol. 26(2), 257–276.
[33] Miller, Nathan H. and Matthew C. Weinberg (2015). “Mergers Facilitate Tacit Collusion:
Empirical Evidence from the U.S. Brewing Industry.” Unpublished manuscript.
[34] Melitz, Marc J. and Gianmarco I. P. Ottaviano (2008). “Market Size, Trade, and Pro-
ductivity.” Review of Economic Studies, vol. 75(1), 295–316.
[35] Neary, J. Peter (2007). “Cross-Border Mergers as Instruments of Comparative Advan-
tage.” Review of Economic Studies, vol. 74(4), 1229–1257.
[36] Nevo, Aviv (2000). “Mergers with Differentiated Products: The Case of the Ready-to-eat
Cereal Industry.” The RAND Journal of Economics, vol. 31(3), 395–421.
[37] Nocke, Volker and Michael D. Whinston (2010). “Dynamic Merger Review.” Journal of
Political Economy, vol. 118(6), 1200–1251.
[38] Nocke, Volker and Michael D. Whinston (2013). “Merger Policy with Merger Choice.”
American Economic Review, vol. 103(2), 1006–1033.
[39] Nocke, Volker and Stephen R. Yeaple (2007). “Cross-Border Mergers and Acquisitions
vs. Greenfield Foreign Direct Investment: The Role of Firm Heterogeneity.” Journal of
International Economics, vol. 72(2), 336–365.
[40] Nocke, Volker and Stephen R. Yeaple (2008). “An Assignment Theory of Foreign Direct
Investment.” Review of Economic Studies, vol. 57(2), 529–557.
[41] Ossa, Ralph (2014). “Trade Wars and Trade Talks with Data.” American Economic
Review, vol. 104(12), 4104–4146.
[42] Peters, Craig (2006). “Evaluating the Performance of Merger Simulation: Evidence from
the U.S. Airline Industry.” The Journal of Law & Economics, vol. 49(2), 627–649.
38

[43] Pierce, Justin R. and Peter K. Schott (2012). “A Concordance Between U.S. Harmonized
System Codes and SIC/NAICS Product Classes and Industries.” Journal of Economic
and Social Measurement, vol. 37(1-2), 61–96.
[44] Rysman, Marc S. (2001). “Competition Policy as Strategic Trade.” Unpublished ma-
nuscript.
[45] Schoar, Antoinette (2002). “Effects of Corporate Diversification on Productivity.” Jour-
nal of Finance, vol. 57(6), 2379–2403.
[46] Vives, Xavier (2000). Oligopoly Pricing: Old Ideas and New Tools. Cambridge, MA:
MIT Press.
[47] Weinberg, Matthew C. and Daniel Hosken (2013). “Evidence on the Accuracy of Merger
Simulations.” The Review of Economics and Statistics, vol. 95(5), 1584–1600.
[48] Werden, Gregory J. and Luke M. Froeb (1994). “The Effects of Mergers in Differentiated
Products Industries: Logit Demand and Merger Policy.” Journal of Law, Economics, &
Organization, vol. 10(2), 407–426.
[49] Whinston, Michael D. (2007). “Antitrust Policy towards Horizontal Mergers ” in: Hand-
book of Industrial Organization, vol. 3, eds. Mark Armstrong and Robert H. Porter.
Amsterdam: North Holland.
[50] Williamson, Oliver E. (1968). “Economies as an Antitrust Defense: The Welfare Trade-
offs.” American Economic Review, vol. 58(1), 18–36.
A Data Appendix
For the calibration procedure described in Section 4, we require data on industry sales,
total costs, labor cost shares, the number of firms, bilateral trade flows, relative prices, and
production-based Herfindahl indices for each industry in Canada and the U.S. For the out-of-
sample model validation we also need Canadian and U.S. concentration ratios (sales shares
of the 4, 8, and 20 largest firms in each industry). Finally, to calibrate the model extension
with merger activity in Section 5, we require data on the number of mergers per industry.
We work at the five-digit level of the North American Industry Classification System
(NAICS). This is the most disaggregated level at which Canadian and U.S. industry defi-
nitions are identical and for which we can thus compare Herfindahl indices across the two
39
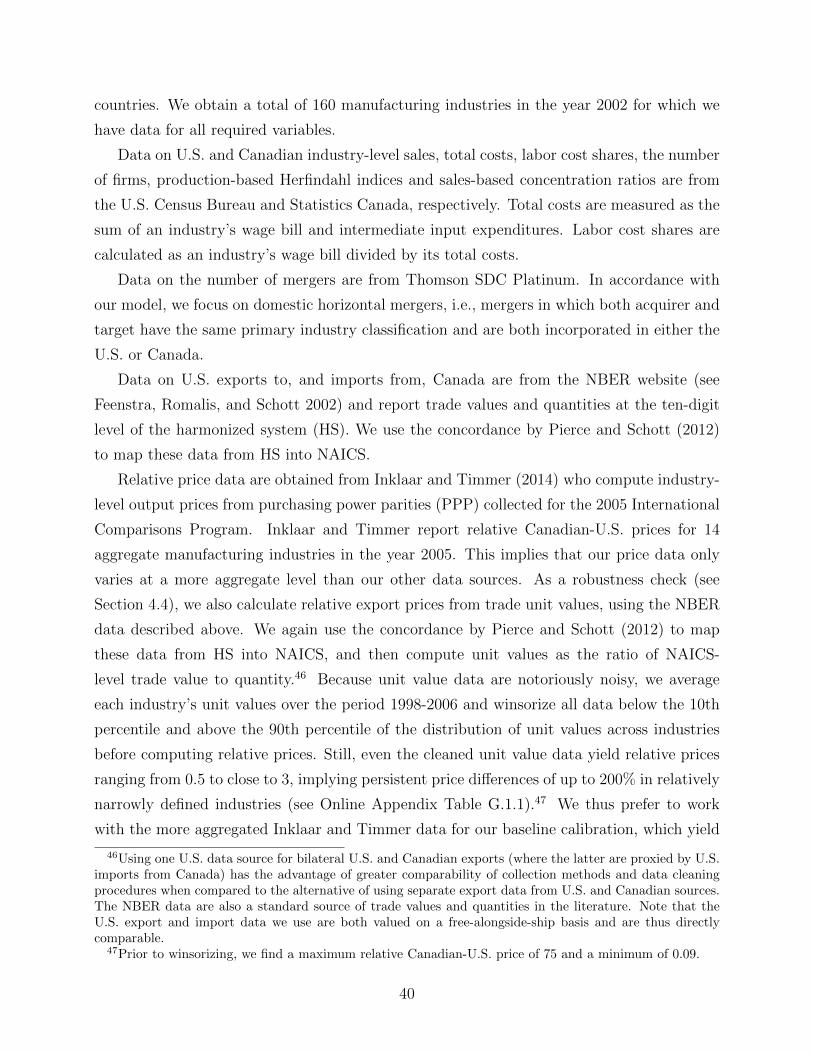
countries. We obtain a total of 160 manufacturing industries in the year 2002 for which we
have data for all required variables.
Data on U.S. and Canadian industry-level sales, total costs, labor cost shares, the number
of firms, production-based Herfindahl indices and sales-based concentration ratios are from
the U.S. Census Bureau and Statistics Canada, respectively. Total costs are measured as the
sum of an industry’s wage bill and intermediate input expenditures. Labor cost shares are
calculated as an industry’s wage bill divided by its total costs.
Data on the number of mergers are from Thomson SDC Platinum. In accordance with
our model, we focus on domestic horizontal mergers, i.e., mergers in which both acquirer and
target have the same primary industry classification and are both incorporated in either the
U.S. or Canada.
Data on U.S. exports to, and imports from, Canada are from the NBER website (see
Feenstra, Romalis, and Schott 2002) and report trade values and quantities at the ten-digit
level of the harmonized system (HS). We use the concordance by Pierce and Schott (2012)
to map these data from HS into NAICS.
Relative price data are obtained from Inklaar and Timmer (2014) who compute industry-
level output prices from purchasing power parities (PPP) collected for the 2005 International
Comparisons Program. Inklaar and Timmer report relative Canadian-U.S. prices for 14
aggregate manufacturing industries in the year 2005. This implies that our price data only
varies at a more aggregate level than our other data sources. As a robustness check (see
Section 4.4), we also calculate relative export prices from trade unit values, using the NBER
data described above. We again use the concordance by Pierce and Schott (2012) to map
these data from HS into NAICS, and then compute unit values as the ratio of NAICS-
level trade value to quantity.46 Because unit value data are notoriously noisy, we average
each industry’s unit values over the period 1998-2006 and winsorize all data below the 10th
percentile and above the 90th percentile of the distribution of unit values across industries
before computing relative prices. Still, even the cleaned unit value data yield relative prices
ranging from 0.5 to close to 3, implying persistent price differences of up to 200% in relatively
narrowly defined industries (see Online Appendix Table G.1.1).47 We thus prefer to work
with the more aggregated Inklaar and Timmer data for our baseline calibration, which yield
46Using one U.S. data source for bilateral U.S. and Canadian exports (where the latter are proxied by U.S.imports from Canada) has the advantage of greater comparability of collection methods and data cleaningprocedures when compared to the alternative of using separate export data from U.S. and Canadian sources.The NBER data are also a standard source of trade values and quantities in the literature. Note that theU.S. export and import data we use are both valued on a free-alongside-ship basis and are thus directlycomparable.
47Prior to winsorizing, we find a maximum relative Canadian-U.S. price of 75 and a minimum of 0.09.
40

more plausible price differences (see Table 1). As seen in Section 4.4, however, both types
of relative price data yield very similar conclusions regarding the types of merger policy
conflicts.
We convert all value entries into U.S. dollars using the average U.S.-Canadian dollar
exchange rate over the period 1997-2007.48 In accordance with our choice of units and
numeraire, we further normalize value entries by the average U.S. wage rate for the year
2002. We calculate U.S. and Canadian wage rates by dividing the economy-wide wage bill
by the number of persons in employment. This yields an average wage for the U.S. of USD
36,510 and an average wage rate for Canada of USD 27,386 in 2002.49
48We use this 11-year average rather than the 2002 exchange rate because the latter is a clear outlier (1.57CND/USD as opposed to the 11-year average of 1.37 CND/USD).
49Data are again from the U.S. Census Bureau and Statistics Canada. We count both employees andself-employed persons. For the latter, we use total receipts (i.e., sales) as a proxy for the wage bill. This willoverestimate wages of the self-employed, although dropping the self-employed does not change average wagesby much.
41