mergers & acquisitions reviewmergers &...
TRANSCRIPT
MERGERS & ACQUISITIONS REVIEWMERGERS & ACQUISITIONS REVIEWFINANCIAL ADVISORS
First Nine Months 2012
Any New Zealand Involvement Announced (AD39)
Any New Zealand Involvement Completed (AF46)
Japan M&A
Any Americas Involvement Announced (AD49) 7
US Target Completed (AF2)
Americas Deals Intelligence
6
US Target Announced (AD2) 7
M&A Financial Advisory Review
First Nine Months 2012 | Mergers & Acquisitions | Financial Advisors
1
Japan Deals Intelligence
Any European Involvement Announced (AD21)
Any Americas Involvement Completed (AF55)
17
17
18
18
Global M&A
Global Deals Intelligence
Scorecard: Worldwide Announced M&A
Scorecard: Worldwide Completed M&A
Top Fifteen Worldwide Announced Deals
Any German Involvement Announced (AD35)
Americas M&A Any Spanish Involvement Completed (AF41)
Any UK Involvement Announced (AD32)
Any UK Involvement Completed (AF39)
13
12
Any Italian Involvement Announced (AD36)
Any Nordic Involvement Announced (AD37)
Any European Involvement Completed (AF3)
https://www.thomsonone.com
10
12
12
Any French Involvement Announced (AD33)
Worldwide Completed (AF1)
Top Ten Japanese Involvement Announced Deals
Any Italian Involvement Completed (AF43)
20
20
19
Top Ten US Announced Deals
Any French Involvement Completed (AF40)
Any Japanese Involvement Completed (AF23)
20
19
15
Mergers & Acquisitions Criteria Summary
Any EMEA Involvement Announced (AD47)
European Deals Intelligence
Any Benelux Involvement Announced (AD40)
8
8
7
Any German Involvement Completed (AF42)
16
Any Canadian Involvement Completed (AF49)
Any Australian Involvement Completed (AF31)
10
9
Any Canadian Involvement Announced (AD42)
16
Any Asia (ex-Japan) Involvement Completed (AF32)
Any EMEA Involvement Completed (AF53)
Any Benelux Involvement Completed (AF47)
10
Any US Involvement Completed (AF48)
Top Ten Any Asia (ex-Japan) Involvement Announced Deals 15
7
8
9EMEA M&A
Any US Involvement Announced (AD41)
Any Spanish Involvement Announced (AD34)3
3
6
6
Any Japanese Announced Fairness Opinion13
Asia Pacific (ex-Japan) M&A
Asia Pacific (ex-Japan) Deals Intelligence
20
21
21
22
21
20
11
12
13
13
Regional Contacts
Criteria Summary
Any EMEA Announced Fairness Opinion
11
14
Worldwide Announced (AD1)
20
10
18
Any Japanese Involvement Announced (AD19)
Any Asia Pacific Announced Fairness Opinion
2
2
8
Table of Contents
16
16Any Australian Involvement Announced (AD24)
9
1
Top Ten European Involvement Announced Deals
Thomson Reuters Soultions for the Deal the Deal
Making CommunityAny Asia (ex-Japan) Involvement Announced (AD25)
20
2
11
15
Fairness Opinion Rankings
Worldwide Announced Fairness Opinion
Any Americas Announced Fairness Opinion
Any USAnnounced Fairness Opinion
11
14
Any Nordic Involvement Completed (AF44)
First Nine Months 2012
FINANCIAL ADVISORS
MERGERS & ACQUISITIONS REVIEW
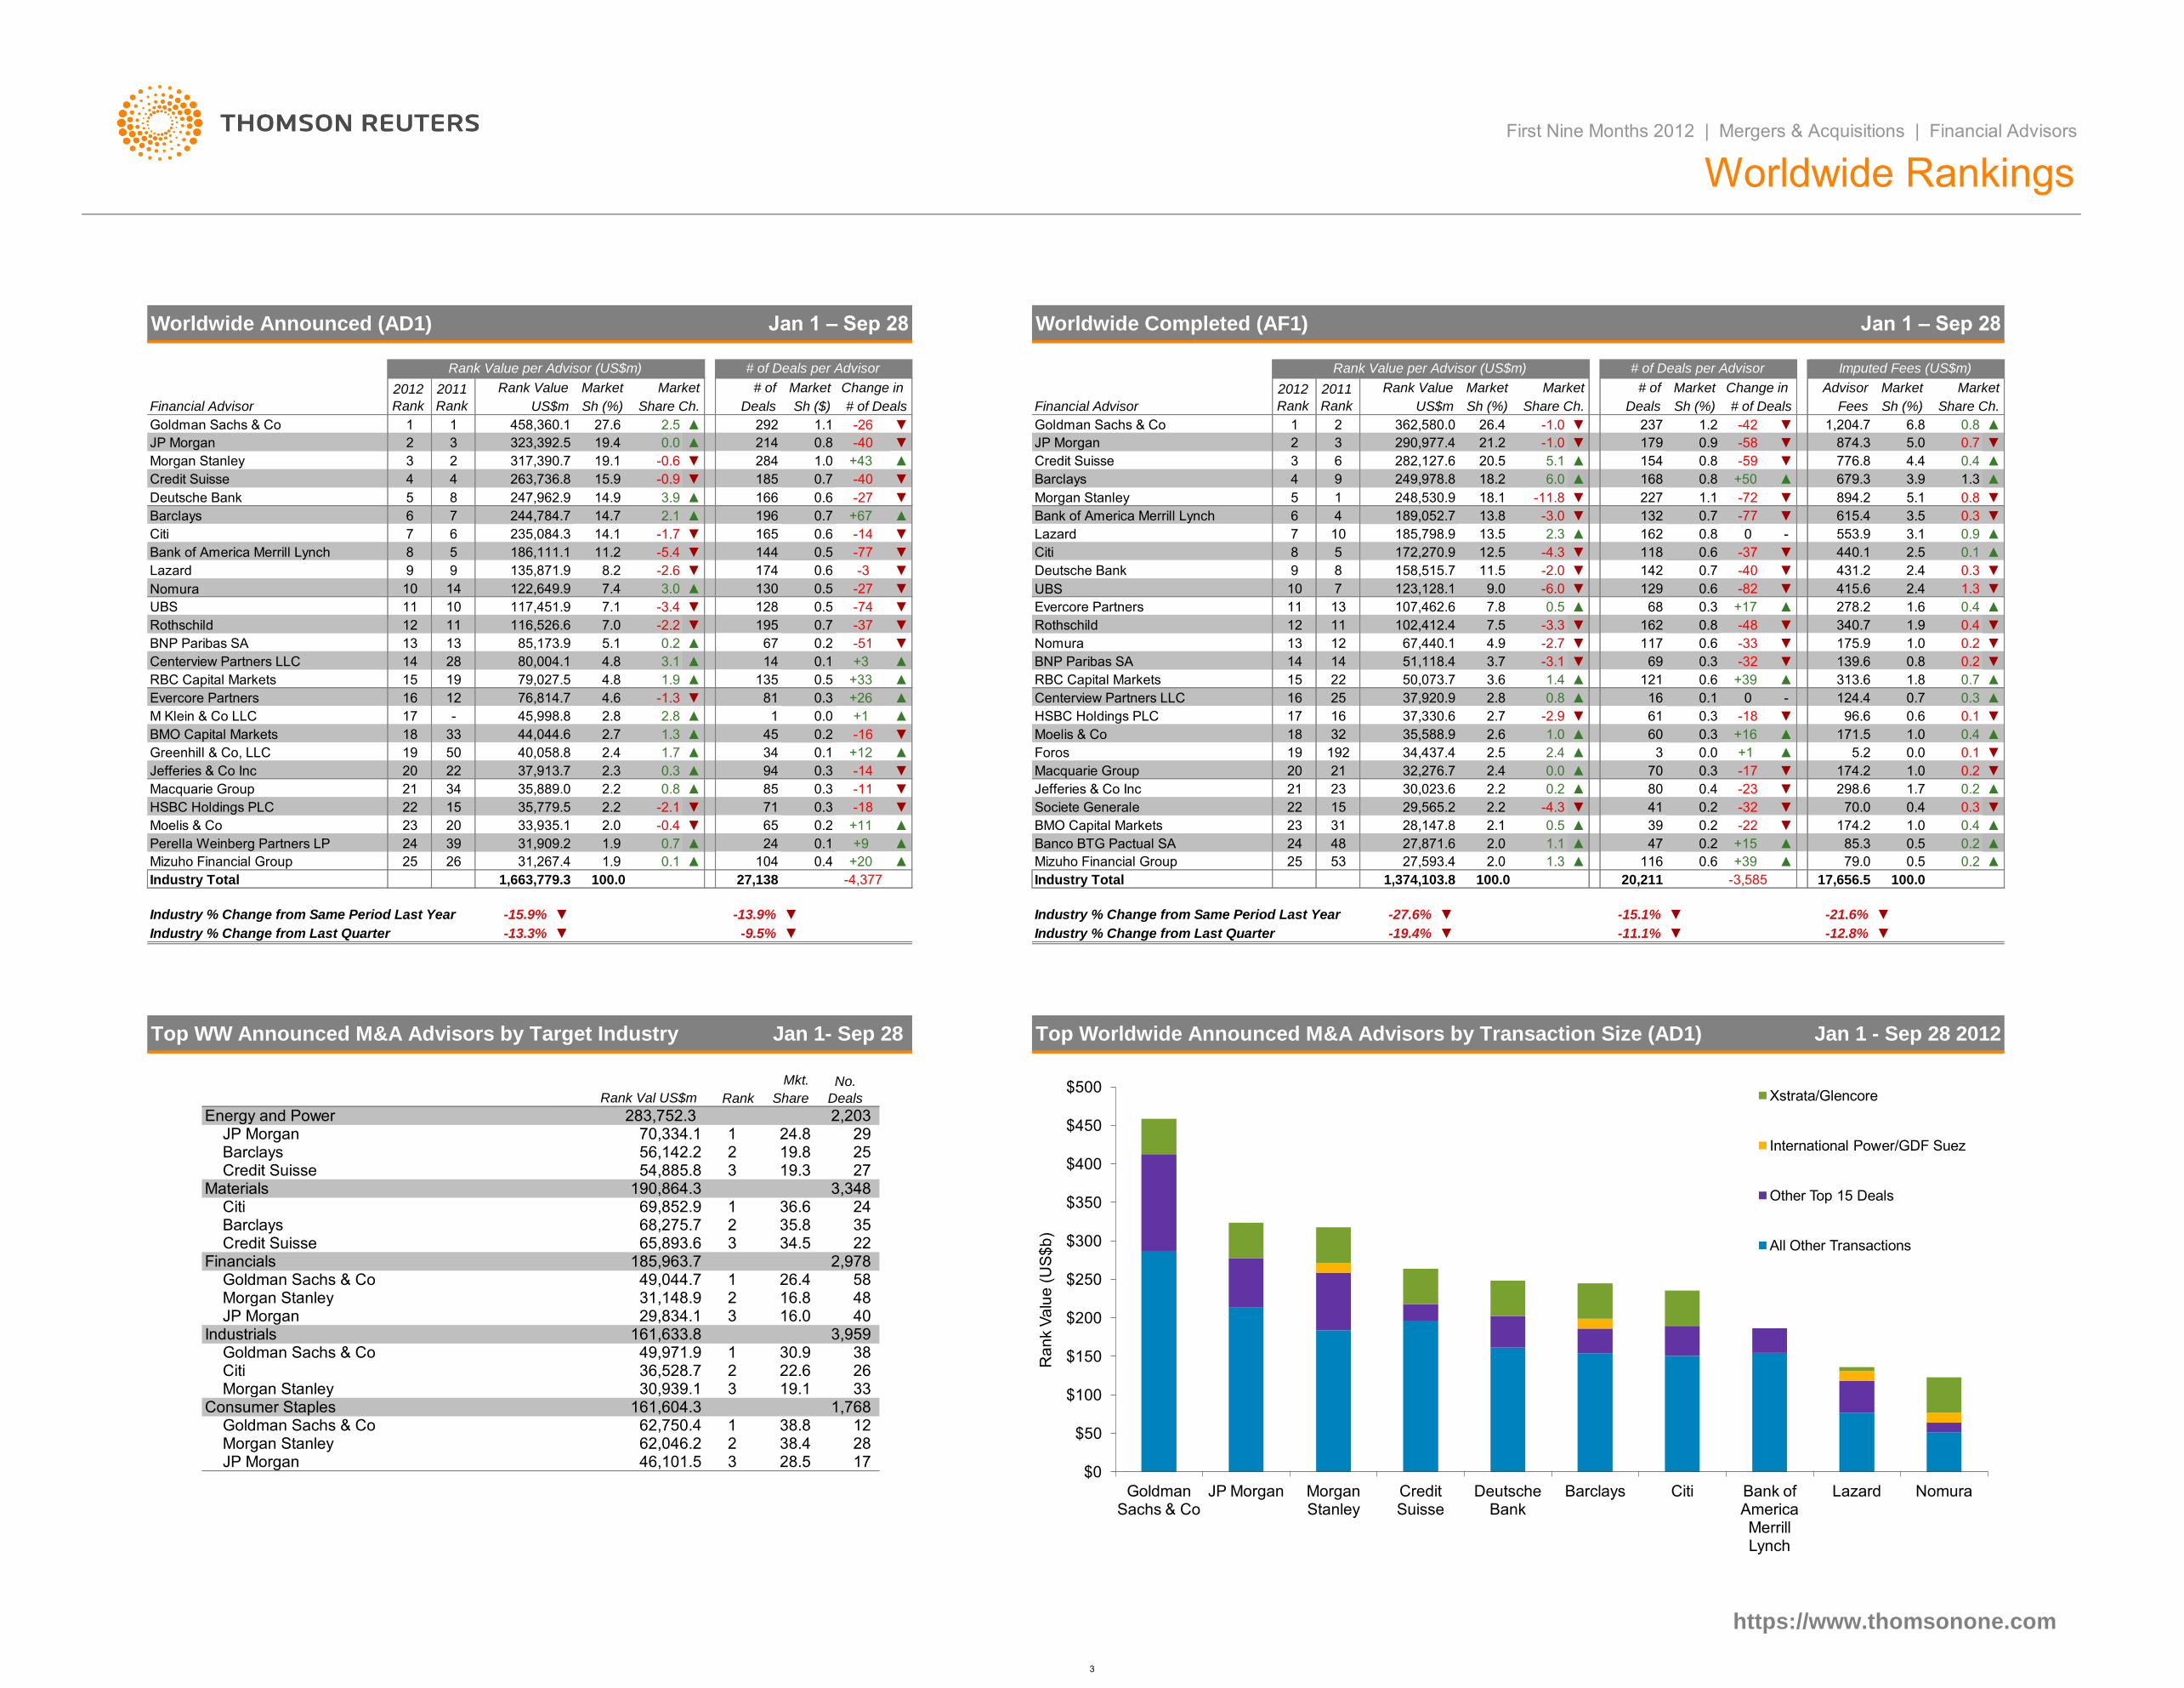
Worldwide M&A Down 16% to US$1.7 trillion l Cross Border M&A Down 1% l Goldman Sachs Tops Advisory Rankings l Advisory Fees Down 22%
Global Deals Intelligence
Worldwide Cross Border Volume Worldwide Announced Buyside Financial Sponsor Activity
https://www.thomsonone.com
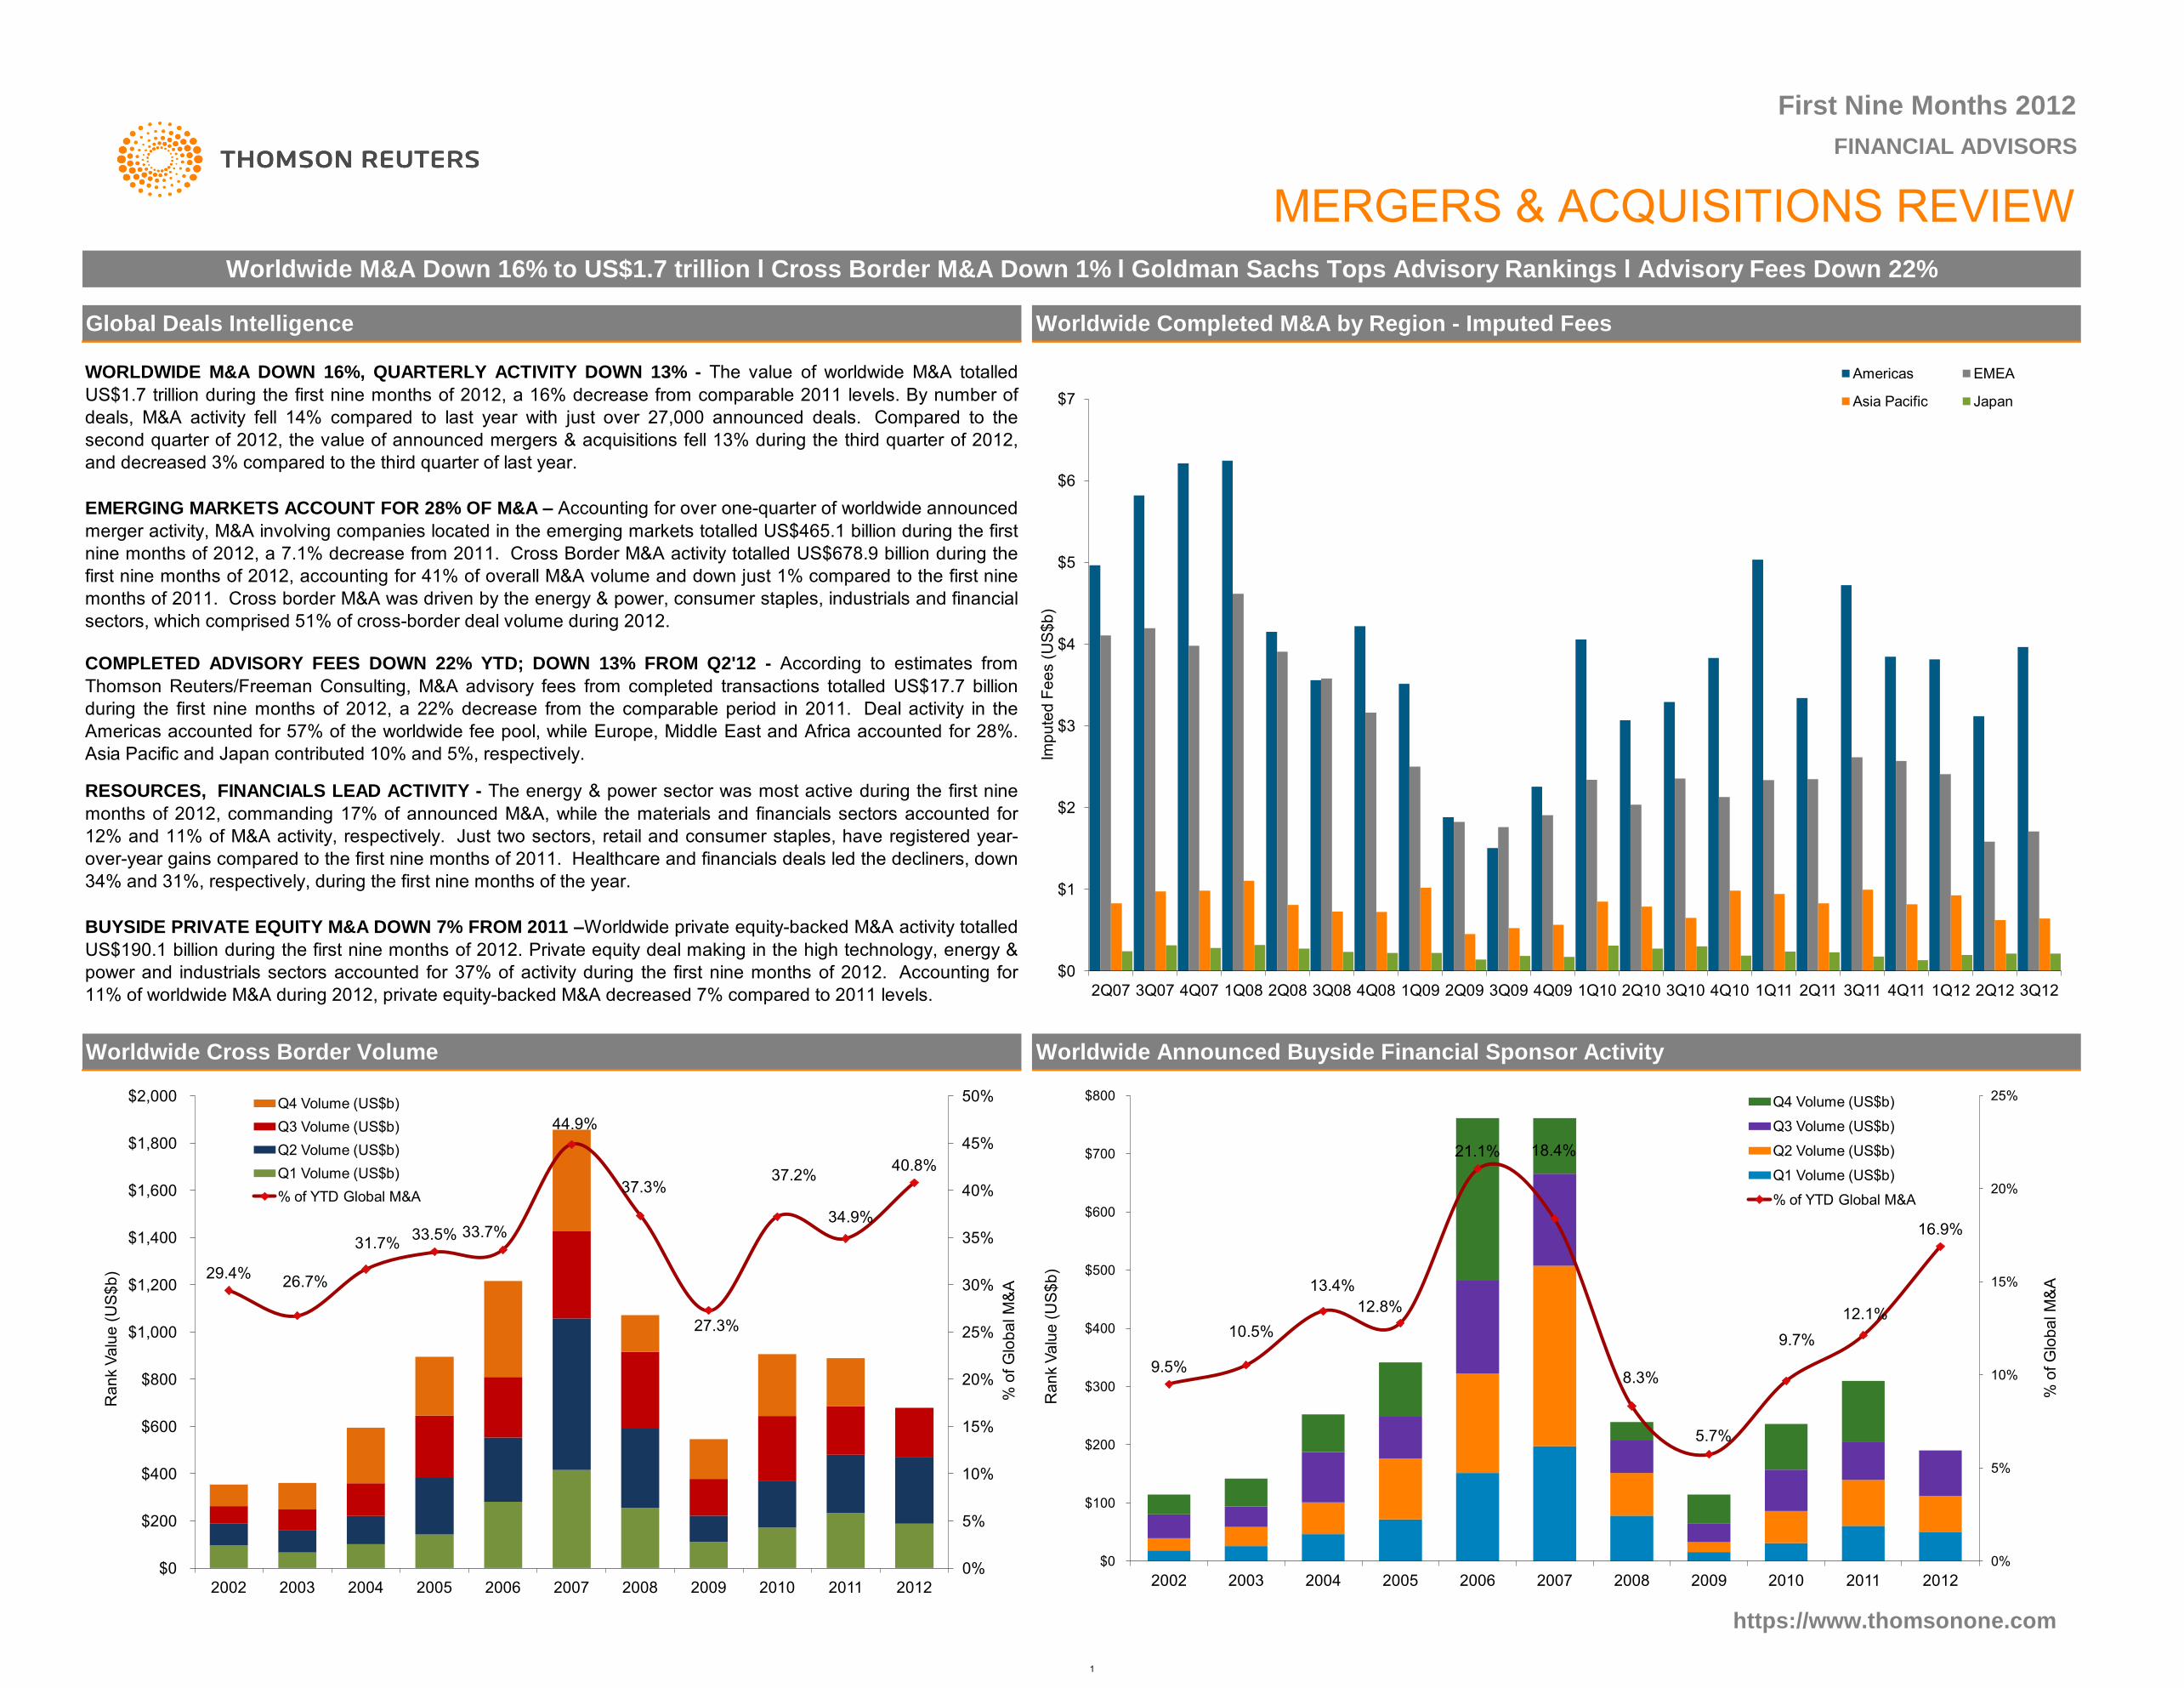
RESOURCES, FINANCIALS LEAD ACTIVITY - The energy & power sector was most active during the first nine
months of 2012, commanding 17% of announced M&A, while the materials and financials sectors accounted for
12% and 11% of M&A activity, respectively. Just two sectors, retail and consumer staples, have registered year-
over-year gains compared to the first nine months of 2011. Healthcare and financials deals led the decliners, down
34% and 31%, respectively, during the first nine months of the year.
BUYSIDE PRIVATE EQUITY M&A DOWN 7% FROM 2011 –Worldwide private equity-backed M&A activity totalled
US$190.1 billion during the first nine months of 2012. Private equity deal making in the high technology, energy &
power and industrials sectors accounted for 37% of activity during the first nine months of 2012. Accounting for
11% of worldwide M&A during 2012, private equity-backed M&A decreased 7% compared to 2011 levels.
COMPLETED ADVISORY FEES DOWN 22% YTD; DOWN 13% FROM Q2'12 - According to estimates from
Thomson Reuters/Freeman Consulting, M&A advisory fees from completed transactions totalled US$17.7 billion
during the first nine months of 2012, a 22% decrease from the comparable period in 2011. Deal activity in the
Americas accounted for 57% of the worldwide fee pool, while Europe, Middle East and Africa accounted for 28%.
Asia Pacific and Japan contributed 10% and 5%, respectively.
Worldwide Completed M&A by Region - Imputed Fees
WORLDWIDE M&A DOWN 16%, QUARTERLY ACTIVITY DOWN 13% - The value of worldwide M&A totalled
US$1.7 trillion during the first nine months of 2012, a 16% decrease from comparable 2011 levels. By number of
deals, M&A activity fell 14% compared to last year with just over 27,000 announced deals. Compared to the
second quarter of 2012, the value of announced mergers & acquisitions fell 13% during the third quarter of 2012,
and decreased 3% compared to the third quarter of last year.
EMERGING MARKETS ACCOUNT FOR 28% OF M&A – Accounting for over one-quarter of worldwide announced
merger activity, M&A involving companies located in the emerging markets totalled US$465.1 billion during the first
nine months of 2012, a 7.1% decrease from 2011. Cross Border M&A activity totalled US$678.9 billion during the
first nine months of 2012, accounting for 41% of overall M&A volume and down just 1% compared to the first nine
months of 2011. Cross border M&A was driven by the energy & power, consumer staples, industrials and financial
sectors, which comprised 51% of cross-border deal volume during 2012.
9.5%
10.5%
13.4%
12.8%
21.1% 18.4%
8.3%
5.7%
9.7%
12.1%
16.9%
0%
5%
10%
15%
20%
25%
$0
$100
$200
$300
$400
$500
$600
$700
$800
2002 2003 2004 2005 2006 2007 2008 2009 2010 2011 2012
% o
f G
lob
al M
&A
Ra
nk V
alu
e (
US
$b
)
Q4 Volume (US$b)
Q3 Volume (US$b)
Q2 Volume (US$b)
Q1 Volume (US$b)
% of YTD Global M&A
$0
$1
$2
$3
$4
$5
$6
$7
2Q07 3Q07 4Q07 1Q08 2Q08 3Q08 4Q08 1Q09 2Q09 3Q09 4Q09 1Q10 2Q10 3Q10 4Q10 1Q11 2Q11 3Q11 4Q11 1Q12 2Q12 3Q12
Imp
ute
d F
ee
s (
US
$b
)
Americas EMEA
Asia Pacific Japan
29.4% 26.7%
31.7% 33.5% 33.7%
44.9%
37.3%
27.3%
37.2%
34.9%
40.8%
0%
5%
10%
15%
20%
25%
30%
35%
40%
45%
50%
$0
$200
$400
$600
$800
$1,000
$1,200
$1,400
$1,600
$1,800
$2,000
2002 2003 2004 2005 2006 2007 2008 2009 2010 2011 2012
% o
f G
lob
al M
&A
Ra
nk V
alu
e (
US
$b
)
Q4 Volume (US$b)
Q3 Volume (US$b)
Q2 Volume (US$b)
Q1 Volume (US$b)
% of YTD Global M&A
1
Western Europe
South East Asia2,521.1New Zealand
23,785.7
▼
▼
▼
Target Macro / Mid Industry
-13.1-0.8
-43.31,696
1,059
▼
▼
1,037▼
Financials / BanksEnergy and Power / Oil & Gas
Consumer Staples / Food and Beverage
Consumer Staples / Food and BeverageReal Estate / REITs
Telecommunications / Wireless
Retail / Other Retailing
Consumer Staples / Food and Beverage
British Virgin / Singapore
Consumer Staples / Food and Beverage
Jan 1 - Sep 28 2012
China Telecom Corp Ltd
6/29/2012
8/22/2012
7/4/2012
Industrials / Other Industrials
▼
Materials / Metals & Mining45,998.8
▼
▼
Worldwide Announced M&A Target Industry by Value
% Change
in Rank
Value
Mergers & Acquisitions
-37.1
▼
-14.91,156
1/1/2011 - 9/30/2011
795,252.2 ▼
▼
▼
▼
▼
▼
-75.6-14.7
-12.2
-66.0
▲
▼
▲
62,594.488085,387.7
-40.9
-6.620.0
368
United States 723,054.4
6,064.8
▼
5,496
▼
3.3▲
▼
127
72,197.8
No.
Deals
5,638.82,439.5
4,384.0 17,947.7
615,165.2
344
1,049
1,374,103.8
Rank Val
US$m
% Change
in Rank
Value
South America
4,688
702
-22.084
Target Region/Nation
North America
18,961.17,182.9
132.8 Mexico678,565.6
111-17.7 5,737
▲
6,652
62740,371.7▼
121Central America▼
Rank Val
US$m
1239,704
31,515
34,047.4
962,698.0
No.
Deals
11,190.2-18.4
-70.315096
-27.67,778
-17.9
23,79620,211
Caribbean-46.0
▼
-23.1
-18.2-15.9
906,783.9
▼
176
8,1646,499
▼
-21.411.9
▼
▼
1,1651,665
7,275.2495
45.5 Canada 63,400.4▲
53,727.8Brazil 36,968.6
Middle East
▲
10,411.8
8,447.9819
Chile3.3 ▲ 27,327.8
47.0 8,364.8▲
Sub-Saharan AfricaNorth Africa
1.0
230 16,253.8
251▲ 263Africa/Middle East 576
330,416.9 -44.553,289.5
101
3,126.5
29,263.7
63
538
5,934
595,659.0
-66.8
3,231.2 42
-44.3
211
82,002.6
2,642
-35.9
▼
-27.1
489,067.5
▼
7,146
▼
-50.0
▼
-43.5
▲
-23.81,2913,217.0
4,70996,106.0
▼
-23.0107
2,0327,966 9,788
38,659.063,226.9
848964
292,588.0
1,504
1,008
45,275.9
Industrials / Automobiles & Components
▼
▲
Japan / Japan
United States / United States
73,934.334
-15.1
▼
-28.4-5.0121,664.3
13,548.8
244.8
-10.59360.1
66,533.5
-69.9
236 13,109.61889,696.0
546
349
48433,926.9
903543
5.2
Acquiror / Target Nation
983 ▼
▲
32,416.1United States / United States
5,237.0 1,518.7
Top Fifteen Worldwide Announced Deals
100,335.2
277,127.4
104,557.4
21,657.1
Central Asia62,753.9
20
Rank Value (US$m)
Japan
Acquiror
81,373.7808
782
106,591.5
Germany
Asia-Pacific
92,530.6
213,233.5
33,580.520,980.6
865
▲
54,269.7
France
South East AsiaMalaysia
85370
13,796.5
3,866
114.6
2,476.1
▲
Australia
▲
-39.513.2
-50.8New Zealand
▲
51,569.3
34,506.7
▼
▼
-12.8 ▼
Australasia▼-49.8
1,937
EuropeEastern Europe
277.5
▼
▼
United Kingdom-2.9
▼
334
-34.6
-23.3
-10.6
194.5
3,22455,340.1
91
7,157
345
8,646
North Africa365
16,634.0 435
12,636.4
84,616.72,532Europe
22,870.1
34,133.6Africa/Middle EastMiddle East
Sub-Saharan Africa
930
Eastern Europe469,189.1
United Kingdom
33,045.4
-14.2
108
4,546.0
124
1,166
66
4,168.5
1,254
11,315.5 356
553,805.7
1,543.4
▼
▼
16,481.911,870
Shareholders
59,535.6
248
ChinaSouth Korea
1,9081,664North AsiaSingapore
115,579.4
676
Target (% Sought/Acquired)
55,734.0
4,056
19.1
10,549.8300
1,815
351,457.2 7,752
1,028
32.8▲
376
Xstrata PLC (65.9%)
2.6
25,881.6
-20.8
804
▼
39 528,877.7
33,969.4-17.0
▲8.0
Switzerland / Switzerland
29,541.8
1,181
Glencore International PLC
633South Asia
-12.7
Americas
169,525.1
Asia-Pacific
South Asia▼
▼
165,284.2▲
Central America
Australasia
North AsiaChina
SingaporeIndonesia
6,693
27,593.7
715
14,010.9
49,379.7
21,490.4
12,860.9
2,388705
2,727106,689.930,028.3 34,405.5
271
3,475
South Korea
60,436.9
Archstone-Smith Trust (26.5%)
International Power PLC (40.93%)
1/23/2012
Date Effective
Spain / Spain
Alliance Boots GmbH (55%)United States / United States
Volkswagen AG
Pfizer Nutrition (100%)
Shareholders
Cooper Industries PLC (100%)
20,093.4
ConocoPhillips-Refining ,Mktg (100%)
Kraft Foods Inc-N Amer Grocery (100%)FROB
Switzerland / United States12,240.311,850.0
▼
76,313.2
9/17/2012
1/23/2012
5/25/2012 Pending
Pending
Banco Financiero y de Ahorros (100%)
Rank Date
317.1
https://www.thomsonone.com
China / China 18,047.3
Belgium / United KingdomEnergy and Power / Power
Energy and Power / Oil & GasEnergy and Power / Power
9,219.311,810.0
Germany / Germany
Nestle SA
TCC Assets Ltd
Belgium / Mexico
United States / Ireland-Rep
7/23/2012
5/9/2012
4/23/2012
CNOOC Canada Holding Ltd
12,612.0
8,854.8
12,855.917,665.6Pending
Nuclear Damage Liability
Nexen Inc (100%)China Telecom Corp-3G Assets (100%)
1,045
115,265.6
8/1/2012
Pending
4/30/2012
Japan
Fraser & Neave Ltd (69.6%)
3,704.7
Dr Ing hcF Porsche AG (50.1%)
5/21/2012
2/7/2012
6/29/2012 Grupo Modelo SAB de CV (49.7%)
Central Asia1,3701,505
-91.4
Lehman Brothers Holdings Inc
Eaton Corp
Anheuser-Busch InbevIntended
Electrabel SA
Pending
Pending
197
1,358
1,058
306,642.1
Australia
Western Europe
Switzerland
52,523.0
63,103.7
Germany
Worldwide 27,1381,663,779.3Americas
6,041.3
North America
194
8,320
United States 5,581
1,716
Rank Val
US$m
787,654.593
593,478.9
Chile
6,988
1,407
1,008
100,376.086,341.7
419,572.0
257
533134
42,640.2
474,912.1 9,689
103,361.4
1,184
50,775.3
No.
Deals
Rank Val
US$m
1,898,228.9
Caribbean
1,046.1252
Worldwide
No.
Deals
▼
16
First Nine Months 2012 | Mergers & Acquisitions | Financial Advisors
1,977,319.56,622
1/1/2012 -9/28/2012 1/1/2011 - 9/30/2011
1826,560.3
449.4
Target Region/Nation
Mexico
1/1/2012 -9/28/2012
United States / SwitzerlandWalgreen Co 21,361.5
Canada / Canada
771,781.9838,044.2
43,776.0South America
9,039.3
66,262.379,416.355,725.4
10,118.8
96,379.5
3/29/2012
6/19/2012
Pending
689,858.5
Brazil65,194.4
Canada
TEPCO (75.73%)7/31/2012
Pending
Pending
9/13/2012
4/12/2012
Scorecard: Worldwide Announced M&A Jan 1 - Sep 28 Scorecard: Worldwide Completed M&A Jan 1 - Sep 28
17.1%
11.5%
11.2%
9.7% 9.7%
8.6%
7.2%
7.0%
5.0%
5.0%
4.6% 3.4%
Energy and Power Materials
Financials Industrials
Consumer Staples Real Estate
High Technology Healthcare
Retail Media and Entertainment
Telecommunications Consumer Products and Services
Government and Agencies
2
Nomura UBS
* tie
Jan 1 - Sep 28 2012
431.2
-82
-3.0
Share Ch.
2.4
3.5
3.9
0.7
4.4 0.4
▼
0.8
Jan 1 – Sep 28Worldwide Completed (AF1)
Market
Imputed Fees (US$m)
▲0.86.8
Market
Sh (%)Fees
179 874.3
Change in
1.2
# of Deals
Market Advisor
+50 ▲
▼
0.8
0.8
-58
-59
1
▼0.6
35
58
HSBC Holdings PLC
0.8
32
Foros
1.0
19 192
Centerview Partners LLC
-2.9
Moelis & Co 180.2 -16
+26
▼
16 -
40
85.3
24
2.635,588.9 60
▼
UBS
154
0.5
174
13.5
-77
▼
227
10 14
4.8
-27
▼
▲7.4
135,871.99
117,451.9
38
1
Morgan Stanley
0.7
67
81
0.5
22
70,334.1
69,852.9
34.5
36.6
48
28.5
3,959
33
30.9
1,768 12
26 22.6
▼Industry % Change from Last Quarter -12.8%
28
19.829 24.8
2,978
https://www.thomsonone.com
46,101.5 338.42
17
11
2
Financial Advisor
5
1
JP Morgan
3
Bank of America Merrill Lynch
Citi 7
8
235,084.3
7
317,390.7
5
6.018.2
27.6
Market
Sh (%)
-0.9
2012
Rank
186,111.1
▲247,962.9
263,736.8
166 0.6
0.511.2
15.9
14.9
▲2.1 0.7
9
-5.4
196
0.7
14.1
185
# of Deals per Advisor
Worldwide Rankings
MarketChange in
-26
Credit Suisse
Morgan Stanley
331,148.9
Goldman Sachs & Co
3
Rank Value
292
US$m
Rank Value
JP Morgan
161,633.8
458,360.1
-1.7
19.1
161,604.3
19.4
284-0.6 ▼
3
Rank Value per Advisor (US$m)
62,046.2
▼
Market
3.9
249,978.8
2
49,044.7
36,528.7
2
Consumer StaplesGoldman Sachs & Co 1
26.41
68,275.7
29,834.1 16.0
185,963.73
35.8
16.8
19.1
62,750.4 38.8
49,971.9
30,939.1
12
0.2
3.1
Barclays
65,893.6
244,784.7 14.7
3.0
80,004.1
122,649.9
116,526.6
▼
7.0 -2.2
7.1 -3.4
8.2 -2.6
▼
Worldwide Announced (AD1)
190,864.3
8
4
6
4
2012
Rank
6
1
Financial Advisor
# of2011
Rank Deals
Market
Share Ch. # of Deals
2.5 1.1
Sh ($)
# of Deals per Advisor
First Nine Months 2012 | Mergers & Acquisitions | Financial Advisors
Rank Value per Advisor (US$m)
Jan 1 – Sep 28
3323,392.5 -40 ▼ JP Morgan
362,580.0
-1.0 5.0
21
Market
Sh (%)
26.4
Sh (%)
Goldman Sachs & Co
2011
Rank
# of
Share Ch.
▼
282,127.6 ▲
-1.0
290,977.4
▼
Deals
▼21.2
-42
0.9
1,204.7
US$m
237
0.0 214 20.8
▼▲
▲
1.0 6
18.1
5.1
▼
20.5
-11.8
▲ 168
1.1
▲
▼ 776.8 ▲
1.3679.3
▲+43 3
-40
-27
Barclays 4
5
▼
Credit Suisse
▼ Morgan Stanley 1
4+67 6Bank of America Merrill Lynch
-14 ▲2.3 0
▼▲
▲185,798.9▼ 0.8
615.40.7
0.9
▼
162
132
3.1
0.6 -3712.5 ▲
▼13.8
2.5
248,530.9
-77
▼ 894.2
0.3189,052.7
5.1▼ -72
▼
0.6
144
▼ 165 -Lazard
172,270.95
7
11.5 142
▼ Citi
▼▼
-4.38
553.910
▼▼ 118
▼
440.1 0.1
▼
0.7
▼
-40 2.4
415.6
-3 Deutsche Bank 158,515.7 0.3
11
710
9
9.0123,128.1
13
8 -2.0
129 0.6
68
▼
0.5
-6.0 1.3
340.7
Evercore Partners128
195
107,462.6
7.512
-74
11
130
-37 102,412.4▼
0.5
-48
7.8
-3.3Rothschild
▼
▼0.8
▼
0.3
162
▲
▼
▼1.0
▲
1.9 ▼
0.2
1.6
▲
0.4
0.4
+39
0.3 0.8 0.2
▲+17 278.2
139.6
▲
175.90.6 ▼117
-32
1.80.6
124.4
51,118.4
1.4
▼
121 ▲
0.2 -33
0.7
313.6
▼
0.7
69▼
▲0.3
135
4.967,440.1
▲
▲
3.7
-51 ▼
14▲0.114▲
Nomura
+33
+3
15
BNP Paribas SA
13
-3.114
RBC Capital Markets
12 -2.7
22
17
50,073.7 3.6
37,920.925 2.8
37,330.6 2.716
▲0.3▲ 0.116
▼ 61 ▼
0
0.6
▲
0.10.3
▲ 171.5+16
▼
0.3
-18 96.6
▼0.0 0.1
1.0 0.4▲
+1 ▲0.0
21
Macquarie Group
0.1 ▲
-11
+12
▼1.0
23
174.232,276.7
30,023.6
0.221
▼ Jefferies & Co Inc85
20
0.3
-1494
▼
▲298.6 1.7
0.4
0.2
-32 0.370.0
5.2
▼
▼
▲
0.2
0.4
-17
41
0.0
0.370
-23
+13
39
▲
2.4
-4.3
2.2
▲
80
0.2
0.52.1 0.4174.2-22 ▼
▼
+15
0.2▲
▼
▲
1.0
-21.6%
17,656.5
0.2
▲
100.01,374,103.8
0.6
100.0
▼▼-15.1%
20,211
▲
47
▲
1.1
79.0+39
-3,585
116
2.0
2.2
0.5 ▲
▲0.5
0.2
2.0 1.3
29,565.2
34,437.4 2.5
2.4 ▲
28,147.8
▲
0.0
0.2
27,871.6
25
Industry Total
15
31
48
27,593.453
▼
1.9 0.7
23
+20 Mizuho Financial Group
240.1 +9 Banco BTG Pactual SA
-9.5%
22Societe Generale
▲
▲
Industry % Change from Same Period Last Year
BMO Capital Markets
54,885.8 19.3
27,138
▼
2
Share
▼
0.4
Jan 1- Sep 28
-4,377
27
-13.3%
▼
3
100.0
Rank
Mkt.
▼
283,752.3
-13.9%
-19.4%
3,348
-27.6%
Top Worldwide Announced M&A Advisors by Transaction Size (AD1)
-11.1%
24
25 26
2431,909.2
0.1
39
Industry Total
25
2,203
Top WW Announced M&A Advisors by Target Industry
-15.9%
Energy and PowerJP Morgan
Rank Val US$m
-0.4
56,142.2
1,663,779.3
No.
Deals
▲
1041.9 ▲
+11
12.8
0.2
Perella Weinberg Partners LP
Industry % Change from Last Quarter ▼
31,267.4Mizuho Financial Group
Industry % Change from Same Period Last Year
45
34
▲1.3
▲1.7
▼4.6
▲79,027.5 4.8 1.9
76,814.7 -1.316
Rothschild
13 85,173.9
34
33
35,889.0
Evercore Partners
19
12
22
Moelis & Co 23
0.3
▲
-18
65
71 ▼-2.12.2
2.4
21
Jefferies & Co Inc 20
▼
37,913.7
35,779.5
▲2.2
11
2.0
15
20
HSBC Holdings PLC
2
0.3
▼
▲
0.8
-
44,044.6
45,998.8
▲
2.7
19
2.817
40,058.8
0.3
Deutsche Bank
Centerview Partners LLC
9
10
18
15RBC Capital Markets
M Klein & Co LLC
Lazard
▼
50
22 2.3
28
BNP Paribas SA 13
12
Financials
33,935.1
14
Greenhill & Co, LLC
Macquarie Group
5.1
BMO Capital Markets
Goldman Sachs & CoMorgan StanleyJP Morgan
Industrials
BarclaysCredit Suisse
MaterialsCitiBarclays
Goldman Sachs & CoCitiMorgan Stanley
Credit Suisse
$0
$50
$100
$150
$200
$250
$300
$350
$400
$450
$500
Goldman Sachs & Co
JP Morgan Morgan Stanley
Credit Suisse
Deutsche Bank
Barclays Citi Bank of America Merrill Lynch
Lazard Nomura
Ra
nk V
alu
e (
US
$b
)
Xstrata/Glencore
International Power/GDF Suez
Other Top 15 Deals
All Other Transactions
3
-
10.2x
11.0x
11.5x
11.9x10.6x
10.3x 11.5x
11.3x
14.8x
12.2x
5.4x
19.9x14.5x
10.5x12.6x
6.7x
33.8
Media and Entertainment
Real Estate
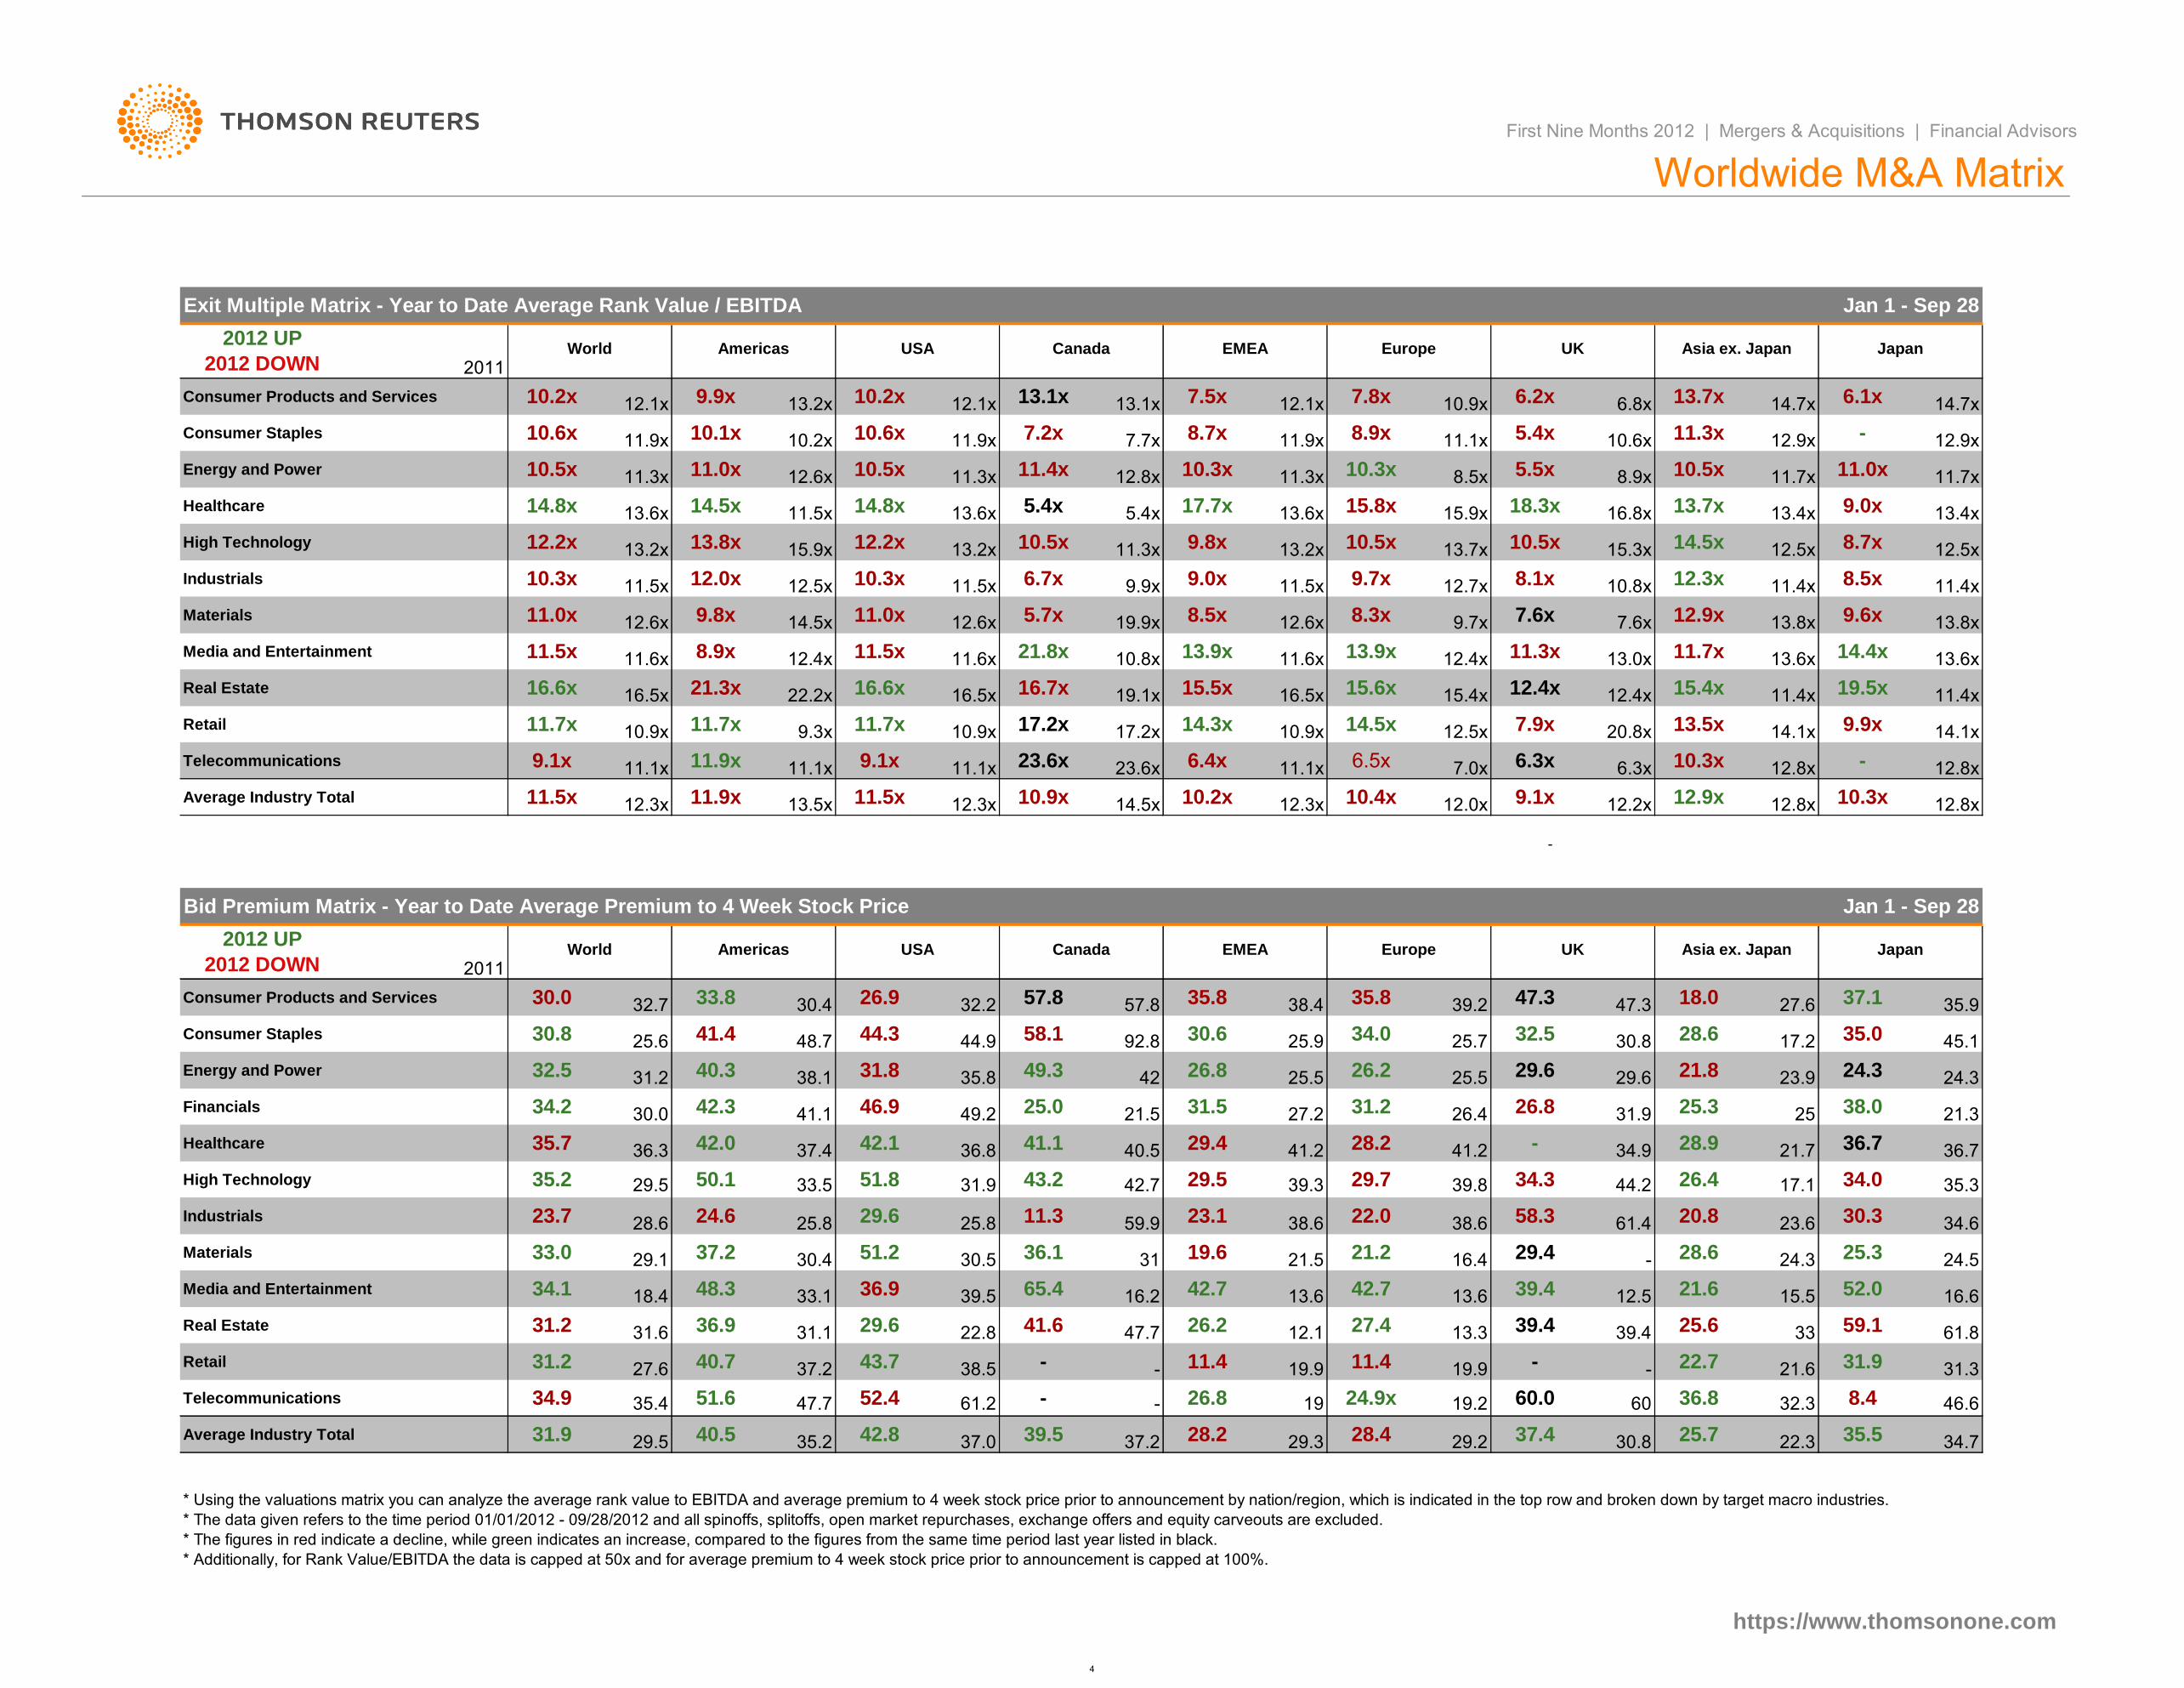
* Using the valuations matrix you can analyze the average rank value to EBITDA and average premium to 4 week stock price prior to announcement by nation/region, which is indicated in the top row and broken down by target macro industries.
* The data given refers to the time period 01/01/2012 - 09/28/2012 and all spinoffs, splitoffs, open market repurchases, exchange offers and equity carveouts are excluded.
* The figures in red indicate a decline, while green indicates an increase, compared to the figures from the same time period last year listed in black.
* Additionally, for Rank Value/EBITDA the data is capped at 50x and for average premium to 4 week stock price prior to announcement is capped at 100%.
6.4x -9.1x11.1x
2011
13.5x 11.5xAverage Industry Total
11.1x
2012 UP
2012 DOWN
12.6x
11.1x
10.9x
11.5x8.9x
16.6x
11.9x
12.6x
11.6x
10.9x
Industrials
9.8x
Consumer Products and Services 12.1x 9.9x
Consumer Staples
Energy and Power
12.0x
Materials
11.3x
13.2x
CanadaUSA
13.1x10.2x 12.1x
11.7x
11.5x
12.1x
8.5x
11.9x 8.9x
10.3x
21.8x
9.9x
13.1x
8.7x
10.8x
9.8x
16.5x
17.2x
16.5x 19.1x21.3x 22.2x 16.7x
11.5x
10.3x 11.3x
5.7x
9.0x
17.7x
14.7x6.2x
11.1x 11.3x5.4x
14.5x
13.7x10.9x
13.4x
15.9x 11.3x
13.6x
13.2x
12.8x
12.4x
5.4x
10.5x
26.9
6.5x
14.3x
Americas USA EMEA
23.6x
10.9x17.2x9.3x
10.5x13.2x
15.8x
11.0x10.5x8.9x 11.7x
9.0x13.7x
12.5x
12.3x 11.4x 8.5x10.8x
12.5x8.7x
16.5x 15.4x
13.9x
8.5x 8.3x12.6x
11.6x 13.9x 12.4x
15.5x
14.1x
11.3x
9.7x 12.7x
7.6x 13.8x13.8x 9.6x
11.4x8.1x
15.6x 12.4x
7.9x 20.8x
13.6x
12.9x
11.4x
14.4x13.6x
19.5x15.4x 11.4x12.4x
7.0x
13.0x 11.7x
12.5x 13.5x 14.1x
12.8x
9.9x
12.3x 10.9x 14.5x 12.0x
14.5x
10.4x
23.6x
9.1x
10.3x11.1x
31.8
12.8x
34.0
27.6
12.8x6.3x 6.3x
47.3
12.8x12.2x
47.339.2
25
30.8
UK
44.9
4235.8 49.3
92.8
57.8
58.148.7
35.8
60
12.9x
61.8
17.1
16.6
Asia ex. Japan
35.3
34.6
35.938.457.8
29.625.5 29.6
18.0
26.2 25.5
32.525.9
24.3 25.3
45.1
36.7
23.9
36.7
30.3
38.0
24.3
31.2
28.240.5 41.2
25.3
41.2
31.5
34.9 28.9
31 21.2
26.4
58.3 61.422.059.9
31.9
-
21.5
12.1
19.6
29.5 39.3 39.829.7
23.1
26.8
-
47.7
11.4
31.6
16.2
47.7
35.4 51.6
42.7
37.0
- -
-
52.4
43.7 38.5
37.242.8
61.2
22.829.636.9 31.1
23.6
26.4
-
38.6
42.7
41.6
31.2 27.6 40.7
18.4 48.3 33.1
-19.9
42.7 13.6
20.8
Japan
26.8
7.6x
15.9x
10.5x 15.3x
5.5x
13.7x
16.8x
6.8x
10.6x
24.5
35.0
21.7
17.228.6
34.0
24.321.8
21.3
10.3x
37.1
37.4
High Technology
Industrials
10.2x
Energy and Power
30.0
11.9x
38.1
30.6
51.8
Europe
25.7
42.0
44.234.3
26.8
36.8 41.1
15.5 52.0
46.9
25.6
13.2x
11.5x
32.7
41.4
12.5x
11.6x
11.7x
44.3
40.3
42.3
30.4
31.9
36.3
41.1
35.2
16.6x
25.8
29.1
50.1 33.5
28.6 24.6
30.4
Average Industry Total
37.2
35.2
Telecommunications 34.9
37.2
29.5 40.5
34.1Media and Entertainment
Retail
31.9
10.2x
31.2
31.2
29.5
10.6x
11.0x
33.0
32.5
30.8
11.7x
World
12.3x
Retail
9.1x
11.5x
World
Materials
30.0
34.2
Telecommunications
Real Estate
35.7
23.7
Consumer Staples
Consumer Products and Services
Financials
31.3
7.2x
Exit Multiple Matrix - Year to Date Average Rank Value / EBITDA
7.7x
39.4
https://www.thomsonone.com
21.6
37.429.3 25.7
13.6x
33
-
9.7x
18.3x
19 24.9x 60.0
11.4x
39.4
First Nine Months 2012 | Mergers & Acquisitions | Financial Advisors
28.239.5
29.4
59.1
35.5
12.5
31.922.719.9 11.4
34.728.4
19.2 36.8 32.3 8.4 46.6
22.330.829.2
25.626.2
28.621.5
13.6
27.4 13.3
16.4
21.639.4
51.2
29.6
42.1
39.5
36.1
36.9
30.5
65.4
25.8 11.3
12.3x
32.2 35.8
Canada
38.6
43.2
27.2
29.4
49.2 25.0
-
Worldwide M&A Matrix
UKEMEA
7.5x
13.4x
Japan
6.1x
Asia ex. JapanEurope
7.8x
12.9x
14.7x
10.3x
12.9x
Healthcare
11.7x
14.8x 14.5x
12.2x
11.9x
Healthcare
High Technology
10.5x
2012 UP
2012 DOWN
11.0x
13.8x
2011
13.6x
10.1x
Americas
Jan 1 - Sep 28
Bid Premium Matrix - Year to Date Average Premium to 4 Week Stock Price Jan 1 - Sep 28
4

Rankings shown are as of the current quarter end in each calendar yearhttps://www.thomsonone.com
First Nine Months 2012 | Mergers & Acquisitions | Financial Advisors
Worldwide Announced Rankings* - A Decade in Review
*League Table positions reflect consolidation within the banking sector
1
2
3
4
5
6
7
8
9
10
2003 2004 2005 2006 2007 2008 2009 2010 2011 2012
1
2
3
4
5
6
7
8
9
10
Ra
nk
Goldman Sachs & Co
JP Morgan
Morgan Stanley
Credit Suisse
Deutsche Bank
Barclays
Citi
Bank of America Merrill Lynch
Lazard
Nomura
5
Americas Deals Intelligence US Announced Advisors by Target Industry Jan 1 - Sep 28 2012
US Target Announced M&A Target Industry by Value (US$ bil)
293 43.7 8 27.9 3 24.2 1
23
Energy and Power
Healthcare
Consumer Staples
Industrials
Real Estate
Credit SuisseJP MorganBarclays
Goldman Sachs & CoJP MorganCredit Suisse
Goldman Sachs & CoCenterview Partners LLCEvercore Partners
Bank of America Merrill LynchGoldman Sachs & CoDeutsche Bank
Bank of America Merrill LynchBarclaysGleacher & Co Inc
Rank Val (US$m)
118,144.6 47,623.744,500.536,121.0
79,389.1
48,728.5
35,691.323,182.822,931.7
73,153.4 45,967.045,138.1
13,590.011,810.0
Rank
123
32,416.1
12
21,315.8
50,932.4 14,631.013,855.813,591.9
1
23
123
Mkt.
443
No.
Deals
37.718 30.613
1
Jan 1 – Sep 28 2012
Share
40.3
Real Estate / REITs
Shareholders
13
552 45.0
Consumer Staples / Food and Beverage
3
Target Macro / Mid IndustryRank Value (US$m)Acquiror / Target Nation
Energy and Power / Oil & Gas
United States / United States
United States / United States
Energy and Power / Oil & Gas
7,150.0
32,416.1
7,534.0
Top Ten US Announced Deals Jan 1 – Sep 28 2012
Pending11,810.0
Consumer Staples / Food and Beverage
Consumer Staples / Food and BeverageUnited States / United States
Target (% Sought/Acquired) Acquiror
Retail / Computers & Electronics Retailing
Healthcare / Biotechnology
Energy and Power / Oil & Gas
https://www.thomsonone.com
6,579.0
1/23/2012
Shareholders
4/23/2012
6/12/2012
9/17/2012
Sara Lee-Intl Coffee,Tea Bus (100%)
4/30/2012 ConocoPhillips-Refining ,Mktg (100%)Pending
Investor Group
4/12/2012
Lehman Brothers Holdings Inc8/6/2012
7/9/2012
Pfizer Nutrition (100%)
Best Buy Co Inc (79.9%)
Kraft Foods Inc-N Amer Grocery (100%)
8/6/2012Canada / United States
Rank Date
Nestle SAPending
Date Effective
1/23/2012 Archstone-Smith Trust (26.5%)
Amylin Pharmaceuticals Inc (100%)
4 44.3
28.713
1
27.2
Richard Schulze
8/13/2012 Tennessee Gas Pipeline Co LLC (100%)Media and Entertainment / Cable
Kinder Morgan Energy Partners
United States / United States
EP Energy Corp (100%)
21,657.1
United States / United States
8,289.7
11,850.0Shareholders
Bristol-Myers Squibb CoEverest Acquisition LLC
Switzerland / United StatesUnited States / United States
6,861.8
61.7
28.9
United States / United States 6,577.9
United States / United States
15 8
206
664 12
6 62.8
First Nine Months 2012 | Mergers & Acquisitions | Financial Advisors
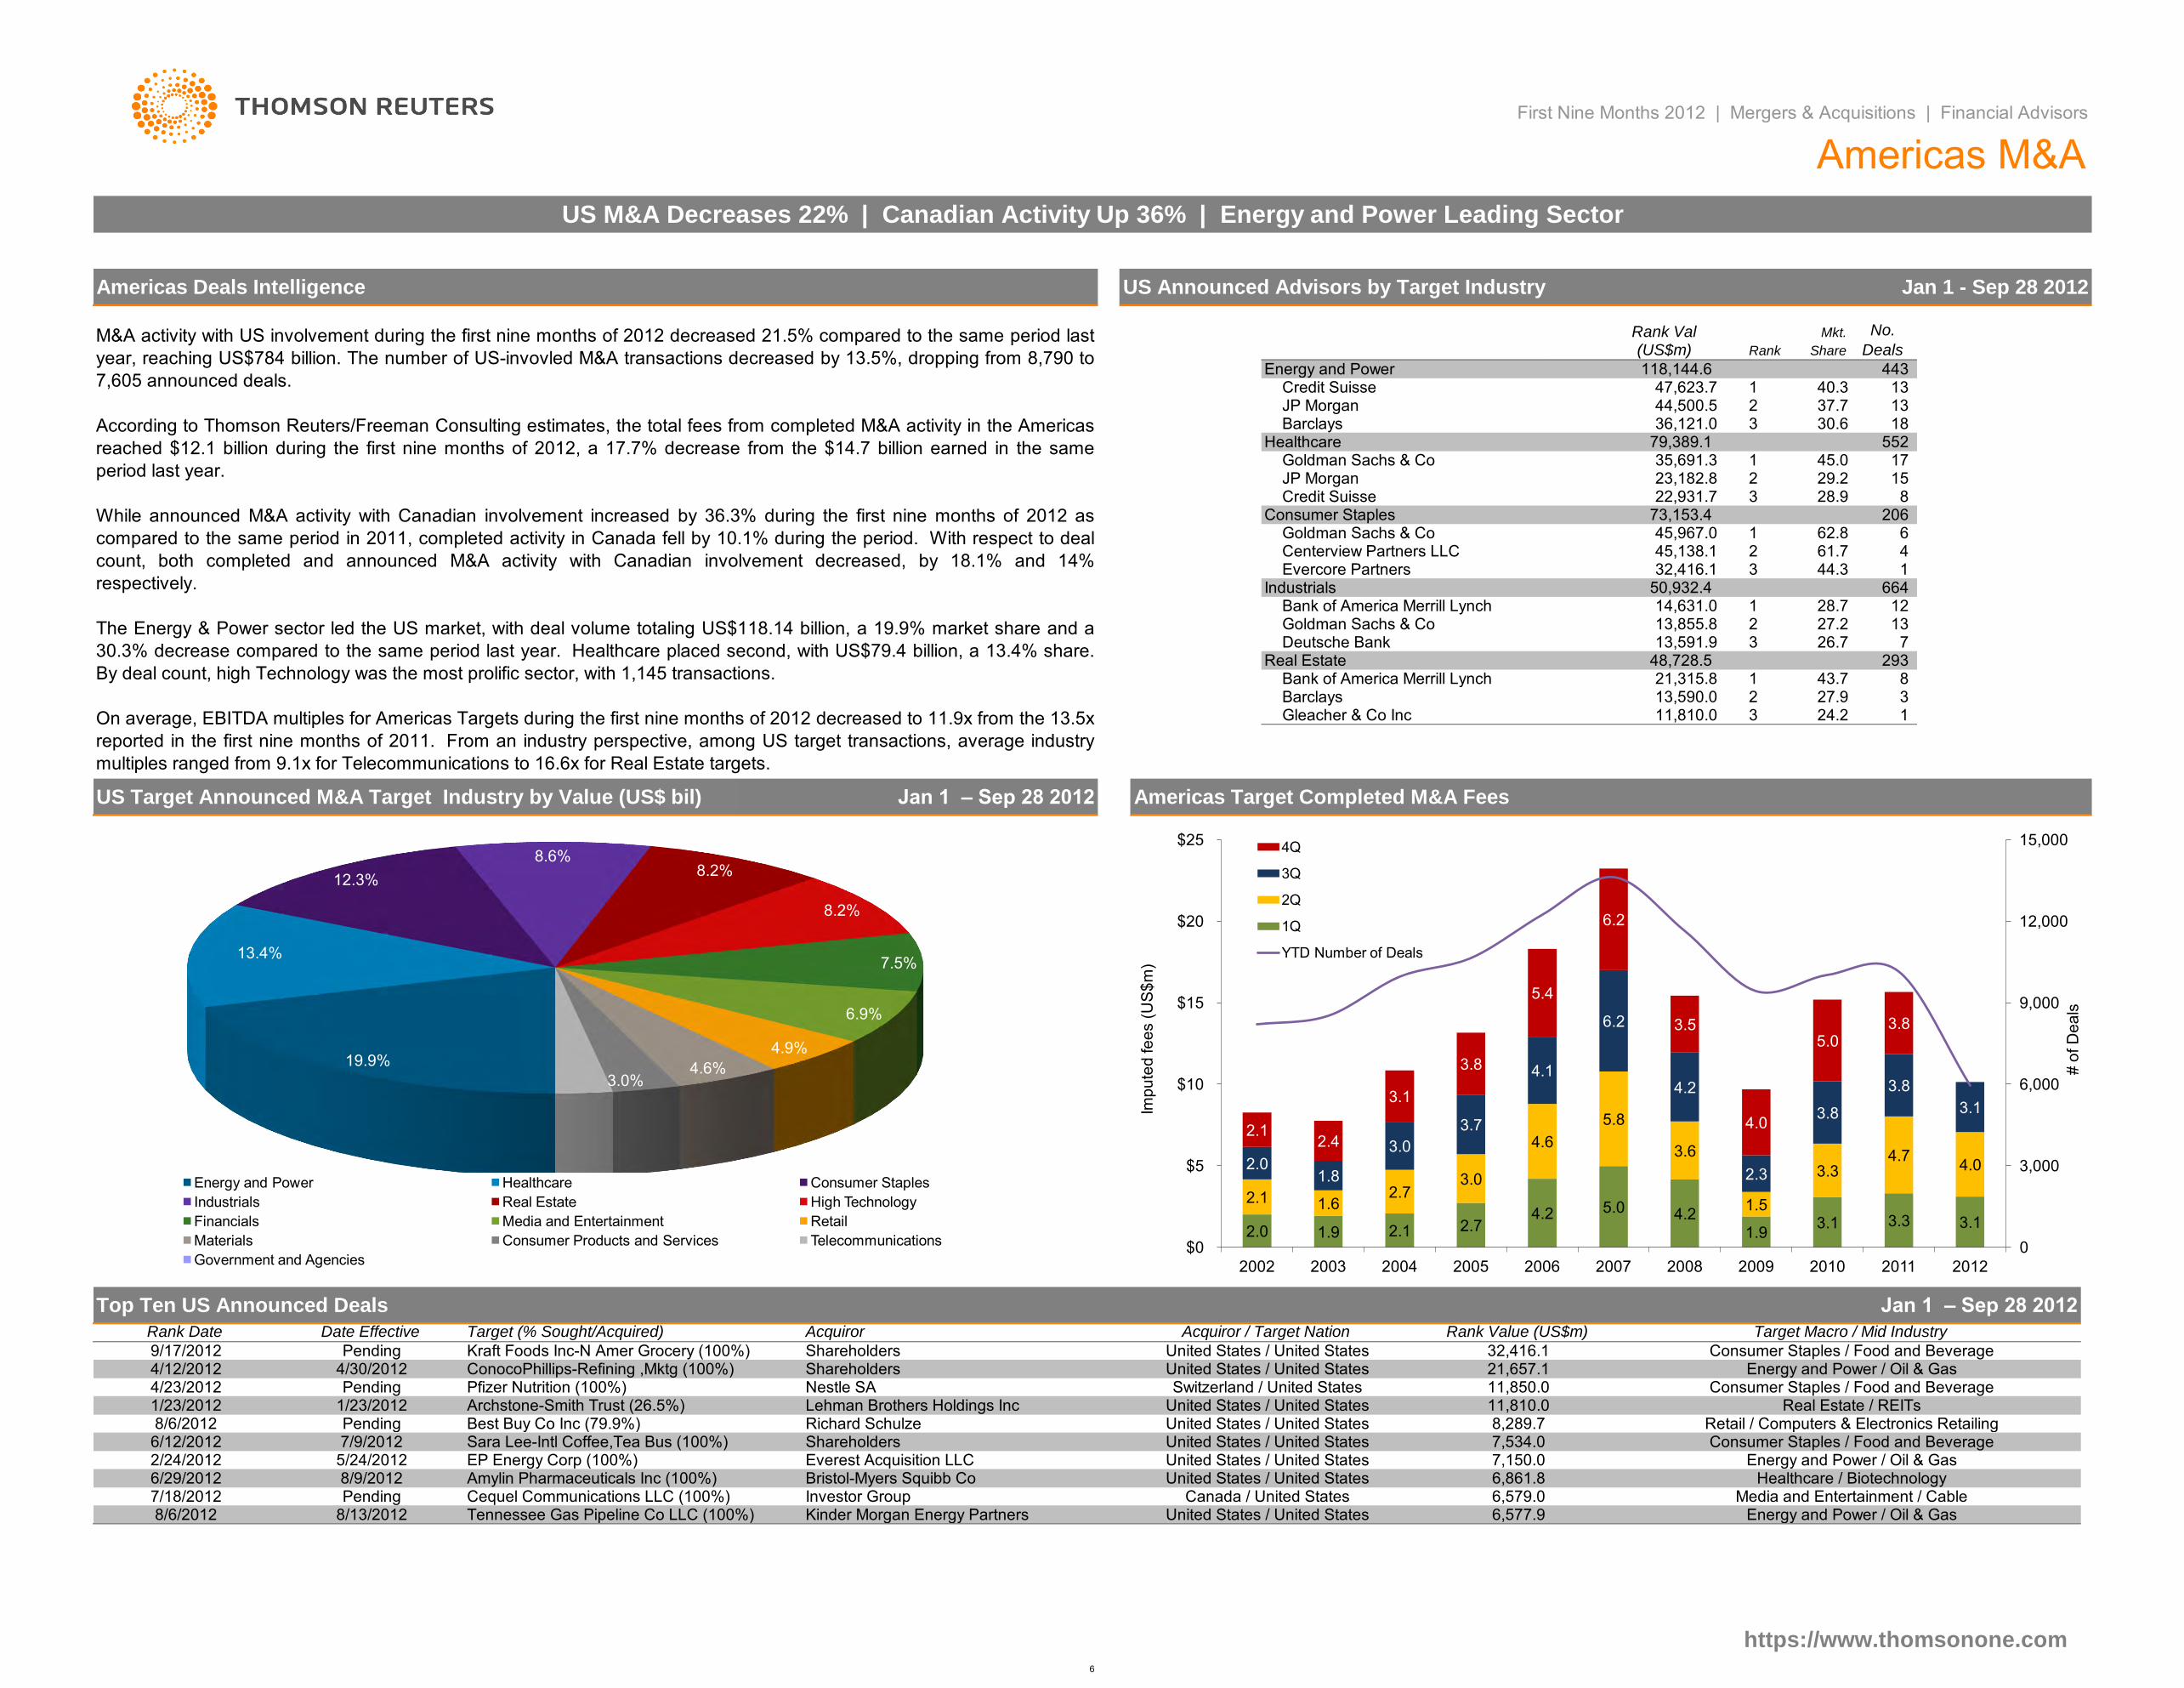
US M&A Decreases 22% | Canadian Activity Up 36% | Energy and Power Leading Sector
17 29.2
Americas M&A
Americas Target Completed M&A Fees
7 26.7
8/9/2012Pending
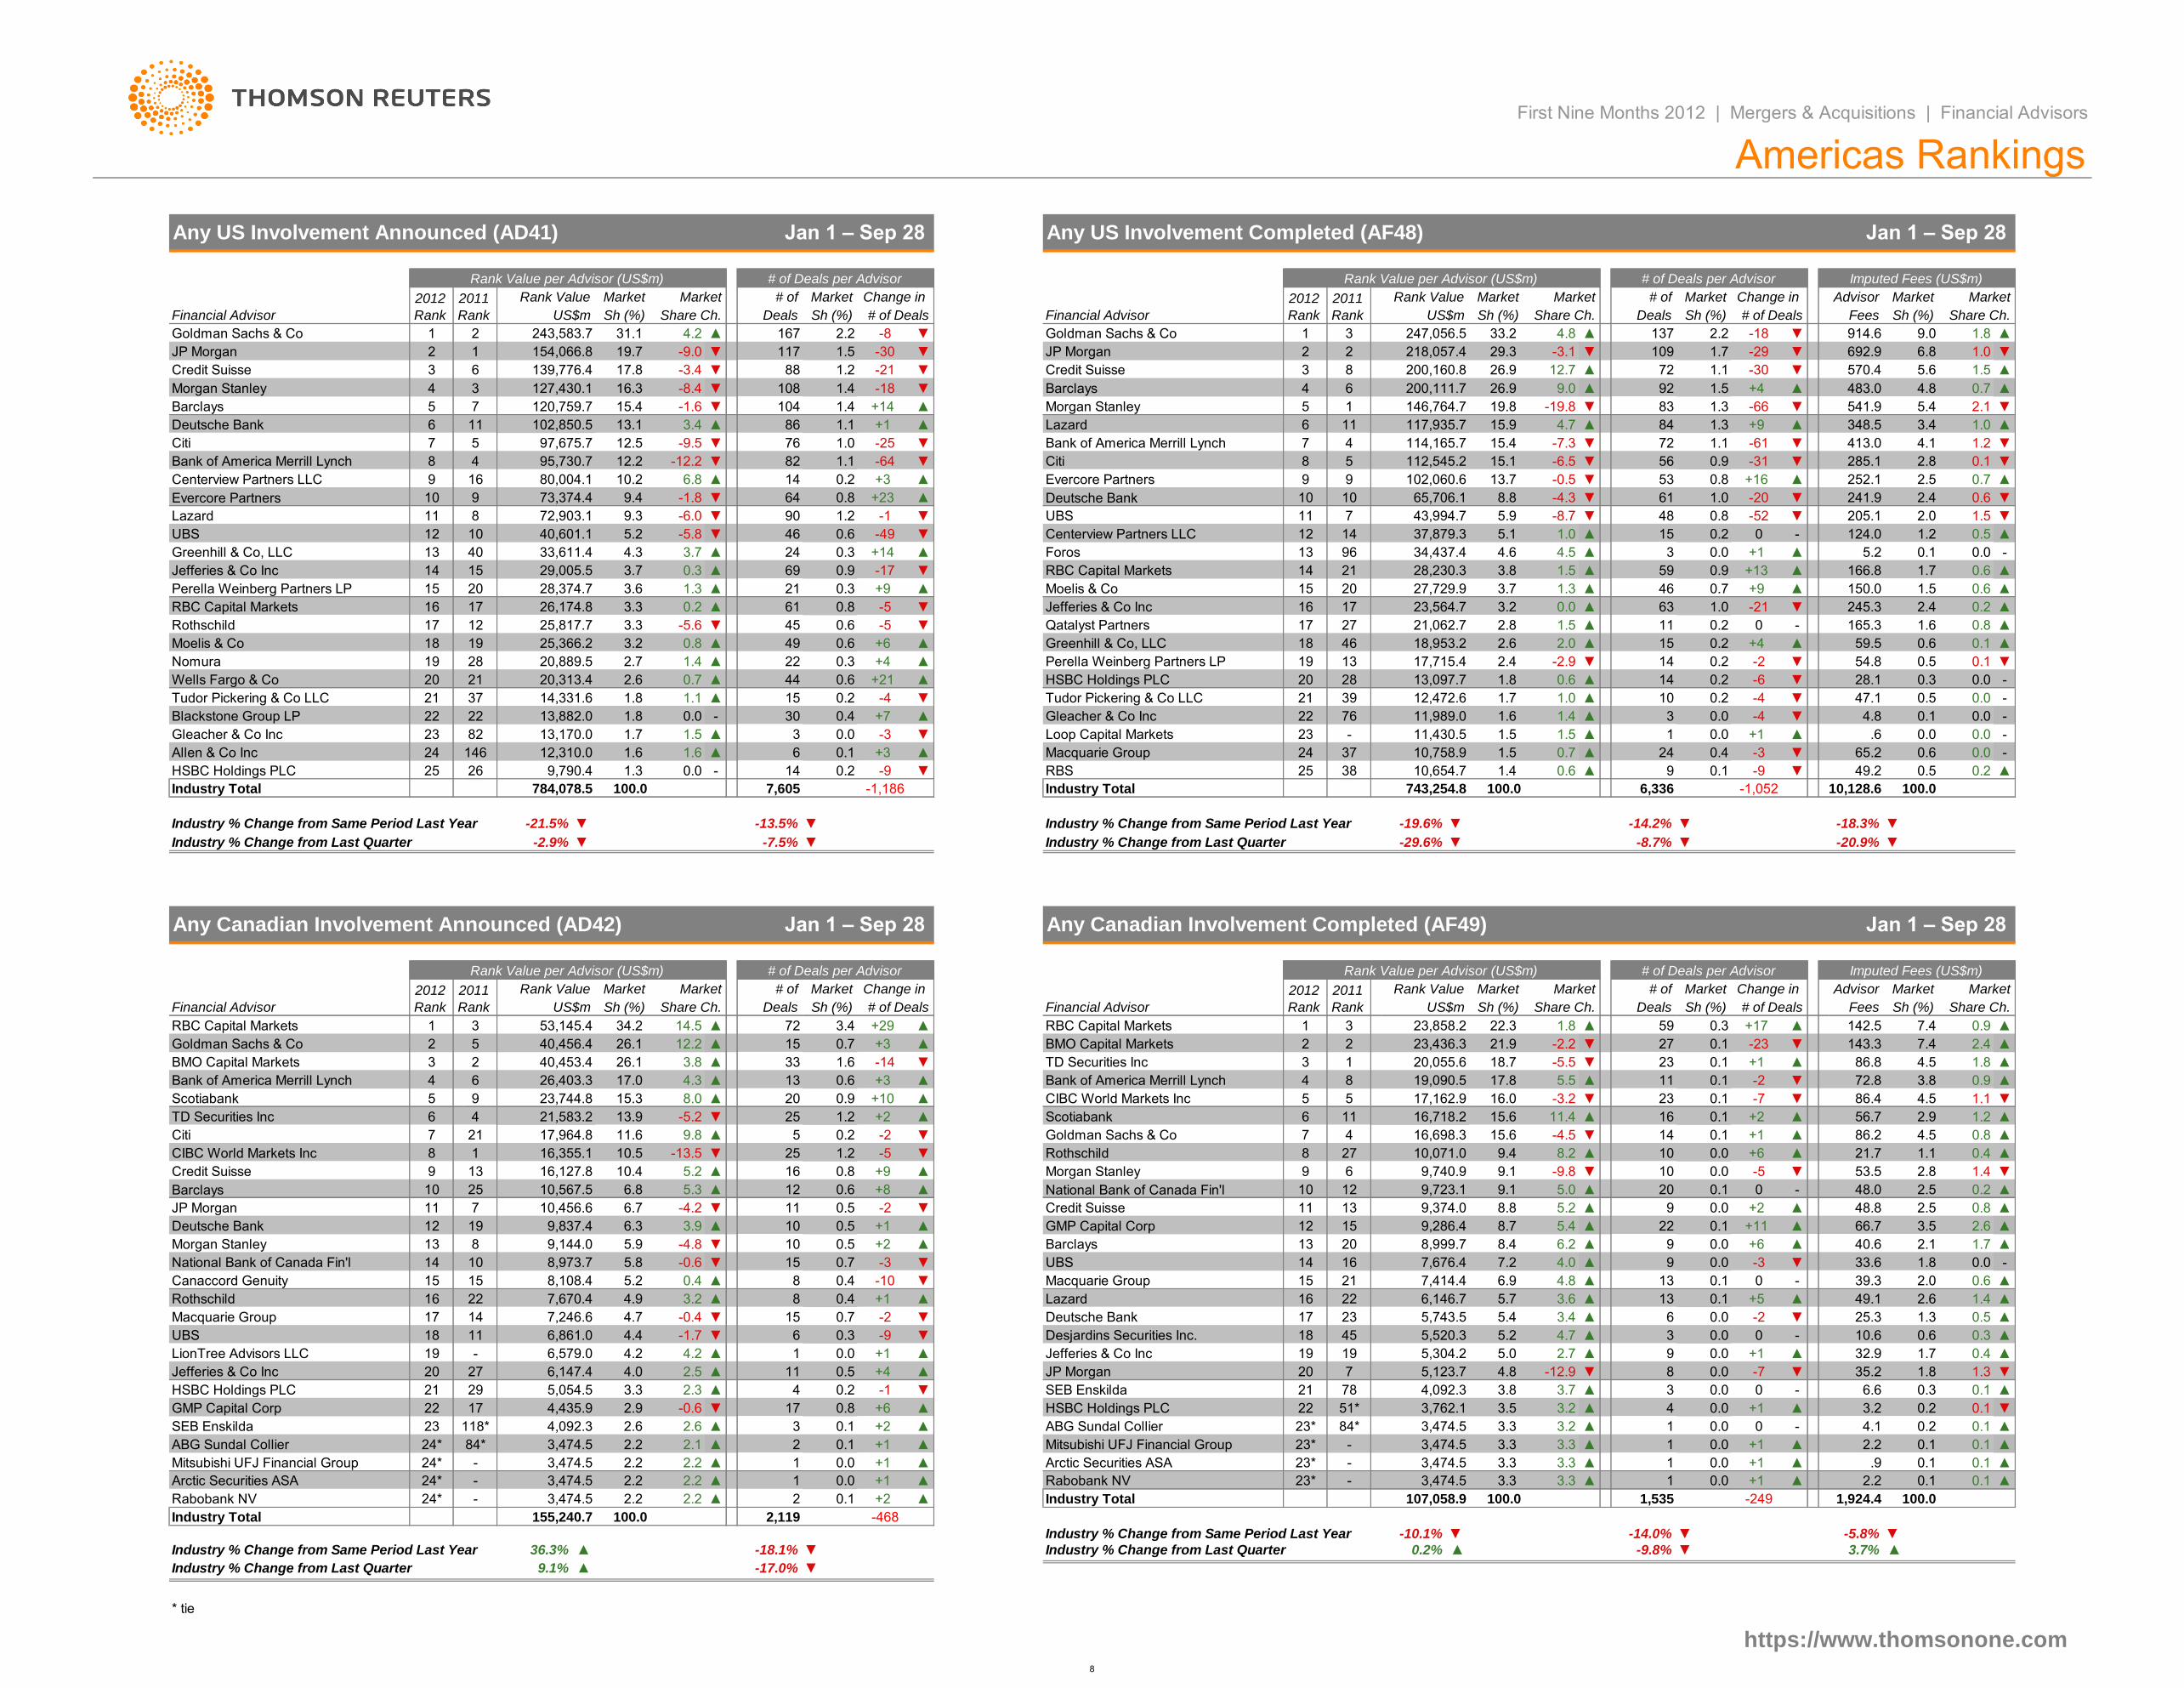
M&A activity with US involvement during the first nine months of 2012 decreased 21.5% compared to the same period last
year, reaching US$784 billion. The number of US-invovled M&A transactions decreased by 13.5%, dropping from 8,790 to
7,605 announced deals.
According to Thomson Reuters/Freeman Consulting estimates, the total fees from completed M&A activity in the Americas
reached $12.1 billion during the first nine months of 2012, a 17.7% decrease from the $14.7 billion earned in the same
period last year.
While announced M&A activity with Canadian involvement increased by 36.3% during the first nine months of 2012 as
compared to the same period in 2011, completed activity in Canada fell by 10.1% during the period. With respect to deal
count, both completed and announced M&A activity with Canadian involvement decreased, by 18.1% and 14%
respectively.
The Energy & Power sector led the US market, with deal volume totaling US$118.14 billion, a 19.9% market share and a
30.3% decrease compared to the same period last year. Healthcare placed second, with US$79.4 billion, a 13.4% share.
By deal count, high Technology was the most prolific sector, with 1,145 transactions.
On average, EBITDA multiples for Americas Targets during the first nine months of 2012 decreased to 11.9x from the 13.5x
reported in the first nine months of 2011. From an industry perspective, among US target transactions, average industry
multiples ranged from 9.1x for Telecommunications to 16.6x for Real Estate targets.
5/24/2012
7/18/2012
2/24/20126/29/2012
Cequel Communications LLC (100%)
19.9%
13.4%
12.3%
8.6% 8.2%
8.2%
7.5%
6.9%
4.9%
4.6% 3.0%
Energy and Power Healthcare Consumer Staples
Industrials Real Estate High Technology
Financials Media and Entertainment Retail
Materials Consumer Products and Services Telecommunications
Government and Agencies
2.0 1.9 2.1 2.7 4.2 5.0 4.2
1.9 3.1 3.3 3.1
2.1 1.6 2.7
3.0
4.6
5.8
3.6
1.5
3.3 4.7
4.0 2.0 1.8
3.0
3.7
4.1
6.2
4.2
2.3
3.8
3.8
3.1
2.1 2.4
3.1
3.8
5.4
6.2
3.5
4.0
5.0 3.8
0
3,000
6,000
9,000
12,000
15,000
$0
$5
$10
$15
$20
$25
2002 2003 2004 2005 2006 2007 2008 2009 2010 2011 2012
# o
f D
ea
ls
Imp
ute
d fe
es (
US
$m
)
4Q
3Q
2Q
1Q
YTD Number of Deals
6
Centerview Partners LLC Deutsche Bank
Centerview Partners LLC Deutsche Bank
# of Deals per Advisor
First Nine Months 2012 | Mergers & Acquisitions | Financial Advisors
Rank Value per Advisor (US$m)
Any Americas Involvement Completed (AF55)
# of Deals per Advisor
19
5,581
Change in
16
69
11▲23
1.5
Market
21
Deals
▼
3.8 ▲
0.8
Gleacher & Co Inc
+4
▲
+5
-8
+2
+2
+9
-5
▲
+18
▼
Industry % Change from Same Period Last Year
Industry % Change from Last Quarter
7,573.1 0.1
-81.2 17
Mizuho Financial Group
3.0 ▲
40
▲
25
-2.0
4.6
-2.6
52
1.3
▲
▲0.8
Imputed Fees (US$m)
Americas Rankings
▲
0.4
Market
-1
▼
Market
US$m
2
▲1.5
185,281.0
1.0
Qatalyst Partners
▼
107,093.4
▼
Greenhill & Co, LLC
61
UBS
18Wells Fargo & Co
4 9
▼
18 0.8
2.0
-6.4
42
▲
Moelis & Co 16
14
17 10
3.3 0.7
21,062.7 1.7
UBS
615,165.2
-3
10
-2.0
▲
0.1
Goldman Sachs & Co 1
Market # of
Financial Advisor US$m Sh (%) Share Ch.
Credit Suisse 3
▼
Jan 1 – Sep 28 Any Americas Involvement Announced (AD49) Jan 1 – Sep 28
Sh (%)
Market
Share Ch.
157
3.4
Sh (%)Sh (%) # of Deals Fees
Advisor# of
Rank Value per Advisor (US$m)
2011
Rank
-27302,232.0
Share Ch.
2012
RankFinancial Advisor Sh (%) Share Ch. DealsUS$m
Rank Value Market Market Rank Value Market
1.9 1,008.3 8.3
# of Deals
2012
Rank
2011
Rank
Change in
-6 ▼
Market
Sh (%)
# of
Financial Advisor
JP Morgan 2 2 203,904.7 ▼
30.0 4.8 ▲
20.2 -4.8
Goldman Sachs & Co 1 1 ▲30.3Goldman Sachs & Co▼195 1.9
1.3
3.73 267,760.7
-29 ▼ 2 235,563.3
1
JP Morgan
635.2
26.6
Morgan Stanley 3 3 164,964.0
2
130 1.3
134 ▼727.0 1.0▼ 122 1.5 -28 ▼ 6.0
▲ 95-14 ▼ 7Credit Suisse 223,937.1 25.3
6-3.9 ▼ 118Credit Suisse 4 5 160,918.3 4-20 ▲0.6
-36
24.6 9.1
11.5 ▲▼ 5.31.2
▼
▲
-6.4
16.0 1.2
▼16.4
-Barclays 5 7 152,663.6
1.1
15.2 0.0
3
Barclays 100
Morgan Stanley 5 ▼ 91
4.21.2 +9 ▲ 503.3217,758.7
2.21 152,825.9 17.3 -18.3 1.1 -80 ▼
▲
Bank of America Merrill Lynch 6 4 148,460.5 14.7
112
-7.3 ▼ 102 1.0
576.4 ▼1.1 +15 4.8
-53 ▼ ▼-3.4Bank of America Merrill Lynch 6 4 0.7▼ 486.1
11 128,359.5 ▲ 393.8▲
149,090.4
7Deutsche Bank 7 11 136,377.3
▼91 1.1 -53 4.0
▼
4.4 ▲13.5
16.9
+8 ▲105 1.0 Lazard ▲
Citi 8 6 133,725.5 13.3 2.6 0.2▼-6.4 315.8
14.5 4.3 3.3 1.11.2 +1096
5 126,892.7 14.4 -5.1 0.8 -32
▲1.0
▼ 6895 0.9 -21 ▼ Citi 8
10 17 80,004.1 7.9
▼
Lazard 9 8 101,826.9 10.1
5.0 ▲ 14
107
10+3 ▲
Evercore Partners-3.7 ▼ 9
0.1
+6 ▲ ▲ 262.0
10 75,778.8
9 103,403.9 0.7 +15
8.6 -3.3
▼ 5911.7 -0.5 2.2 0.6
▼ 74 ▼
RBC Capital Markets 11 13 75,971.4 7.5 UBS 11
2.5 0.20.9 -18 ▼ 299.7
▼ 59 2.0 1.48 60,099.6 6.8 -6.8 0.7 -59 ▼ 246.8 ▼
Evercore Partners 12 10 75,347.3 7.5
124 1.2 +32 ▲
-2.1 ▼ 72 0.7
3.6 ▲
RBC Capital Markets 12+27 ▲ 14 46,546.1 2.4 0.9▲ 288.8▲ 111 1.4 +39 ▲
UBS 13 9 52,592.3 5.2
5.3 1.8
-53 ▼60 0.6 16 37,879.3Centerview Partners LLC 13 ▲
Rothschild 14 12 46,752.3 4.6 -4.1 ▼
-5.2 ▼ 4.3 0.8 1.0 0.40.2 0 - 124.0▲ 15
0.0 +1 0.0 0.1▲ 5.2
Jefferies & Co Inc 15
Foros 14
▼ 713.2 -0.1
117 34,437.472 0.7 -1 ▼ ▲ 33.9 3.8 ▼
BMO Capital Markets 15 19 44,044.6 4.4 2.1 ▲ ▲271.1
80 0.8
45 0.4
Jefferies & Co Inc 16 14 35,087.9
0.9 -21
3.2 1.63.5
▼
0.5 ▲
-15 ▼
-13 ▼ Banco BTG Pactual SA 16
2.2 0.1
29 27,871.6
18 28,303.9
▲
Greenhill & Co, LLC 17 46 33,611.4 3.3 2.7 ▲
▲ 47
Moelis & Co 17
0.7 0.20.6 +15 ▲ 85.3
▲ 48 1.3 0.524 27,757.0 3.1 1.1 0.6 +11 ▲ 152.4 ▲
Perella Weinberg Partners LP 18 25 28,374.7 2.8
24 0.2 +13 ▲
0.8 ▲ 22 0.2 Rothschild 18+9 ▲ 12 27,180.2 1.0 0.4▼ 119.0▼ 51 0.6 -23 ▼
Moelis & Co 19 21 25,393.3 2.5
3.1 -6.1
+9 ▲52 0.5 19 26,927.5BMO Capital Markets 19 ▲
Scotiabank 20 22 24,329.8 2.4 0.4 ▲
0.5 ▲ 3.0 0.3 1.4 0.60.5 -23 ▼ 170.3▲ 38
0.3 -3 0.3 0.1▼ 34.5
Qatalyst Partners 21
Itau Unibanco 20
▲ 112.4 1.3
27 23,470.522 0.2 +10 ▲ ▲ 252.7 0.9 ▼
TD Securities Inc 21 27 21,583.2 2.1 0.2 ▲ ▲165.3
24 0.2
25 0.2
Nomura 22 34 21,220.5
0.1 0
2.3 -0.42.1
-
0.8 ▲
+1 ▲
+1 ▲ TD Securities Inc 22
1.4 0.7
20 20,055.6
33 21,062.7
▲
Wells Fargo & Co 23 28 20,313.4 2.0 0.4 ▲
▼ 23
Banco Bradesco SA 23
0.7 0.30.3 0 - 86.8
▲ 14 0.3 0.171 19,741.4 2.2 1.9 0.2 +3 ▲ 31.1 ▲
Itau Unibanco 24 23 20,160.9 2.0
44 0.4 +21 ▲
0.0 - 54 0.5 Greenhill & Co, LLC 24+16 ▲ 45 18,953.2 0.5 0.1▲ 59.5▲ 15 0.2 +3 ▲
Macquarie Group 25 38 16,703.9 1.7
2.1 1.5
-8 ▼ ▲0.7 ▲ 42 0.4 35 17,734.3Macquarie Group 25 382.0 1.0
Industry Total
0.8 0.10.5 -3 ▼ 101.4
100.0 -1,613
▲
10,251 100.0Industry Total -1,392884,351.8 8,1271,007,276.1
▼ -9.7%
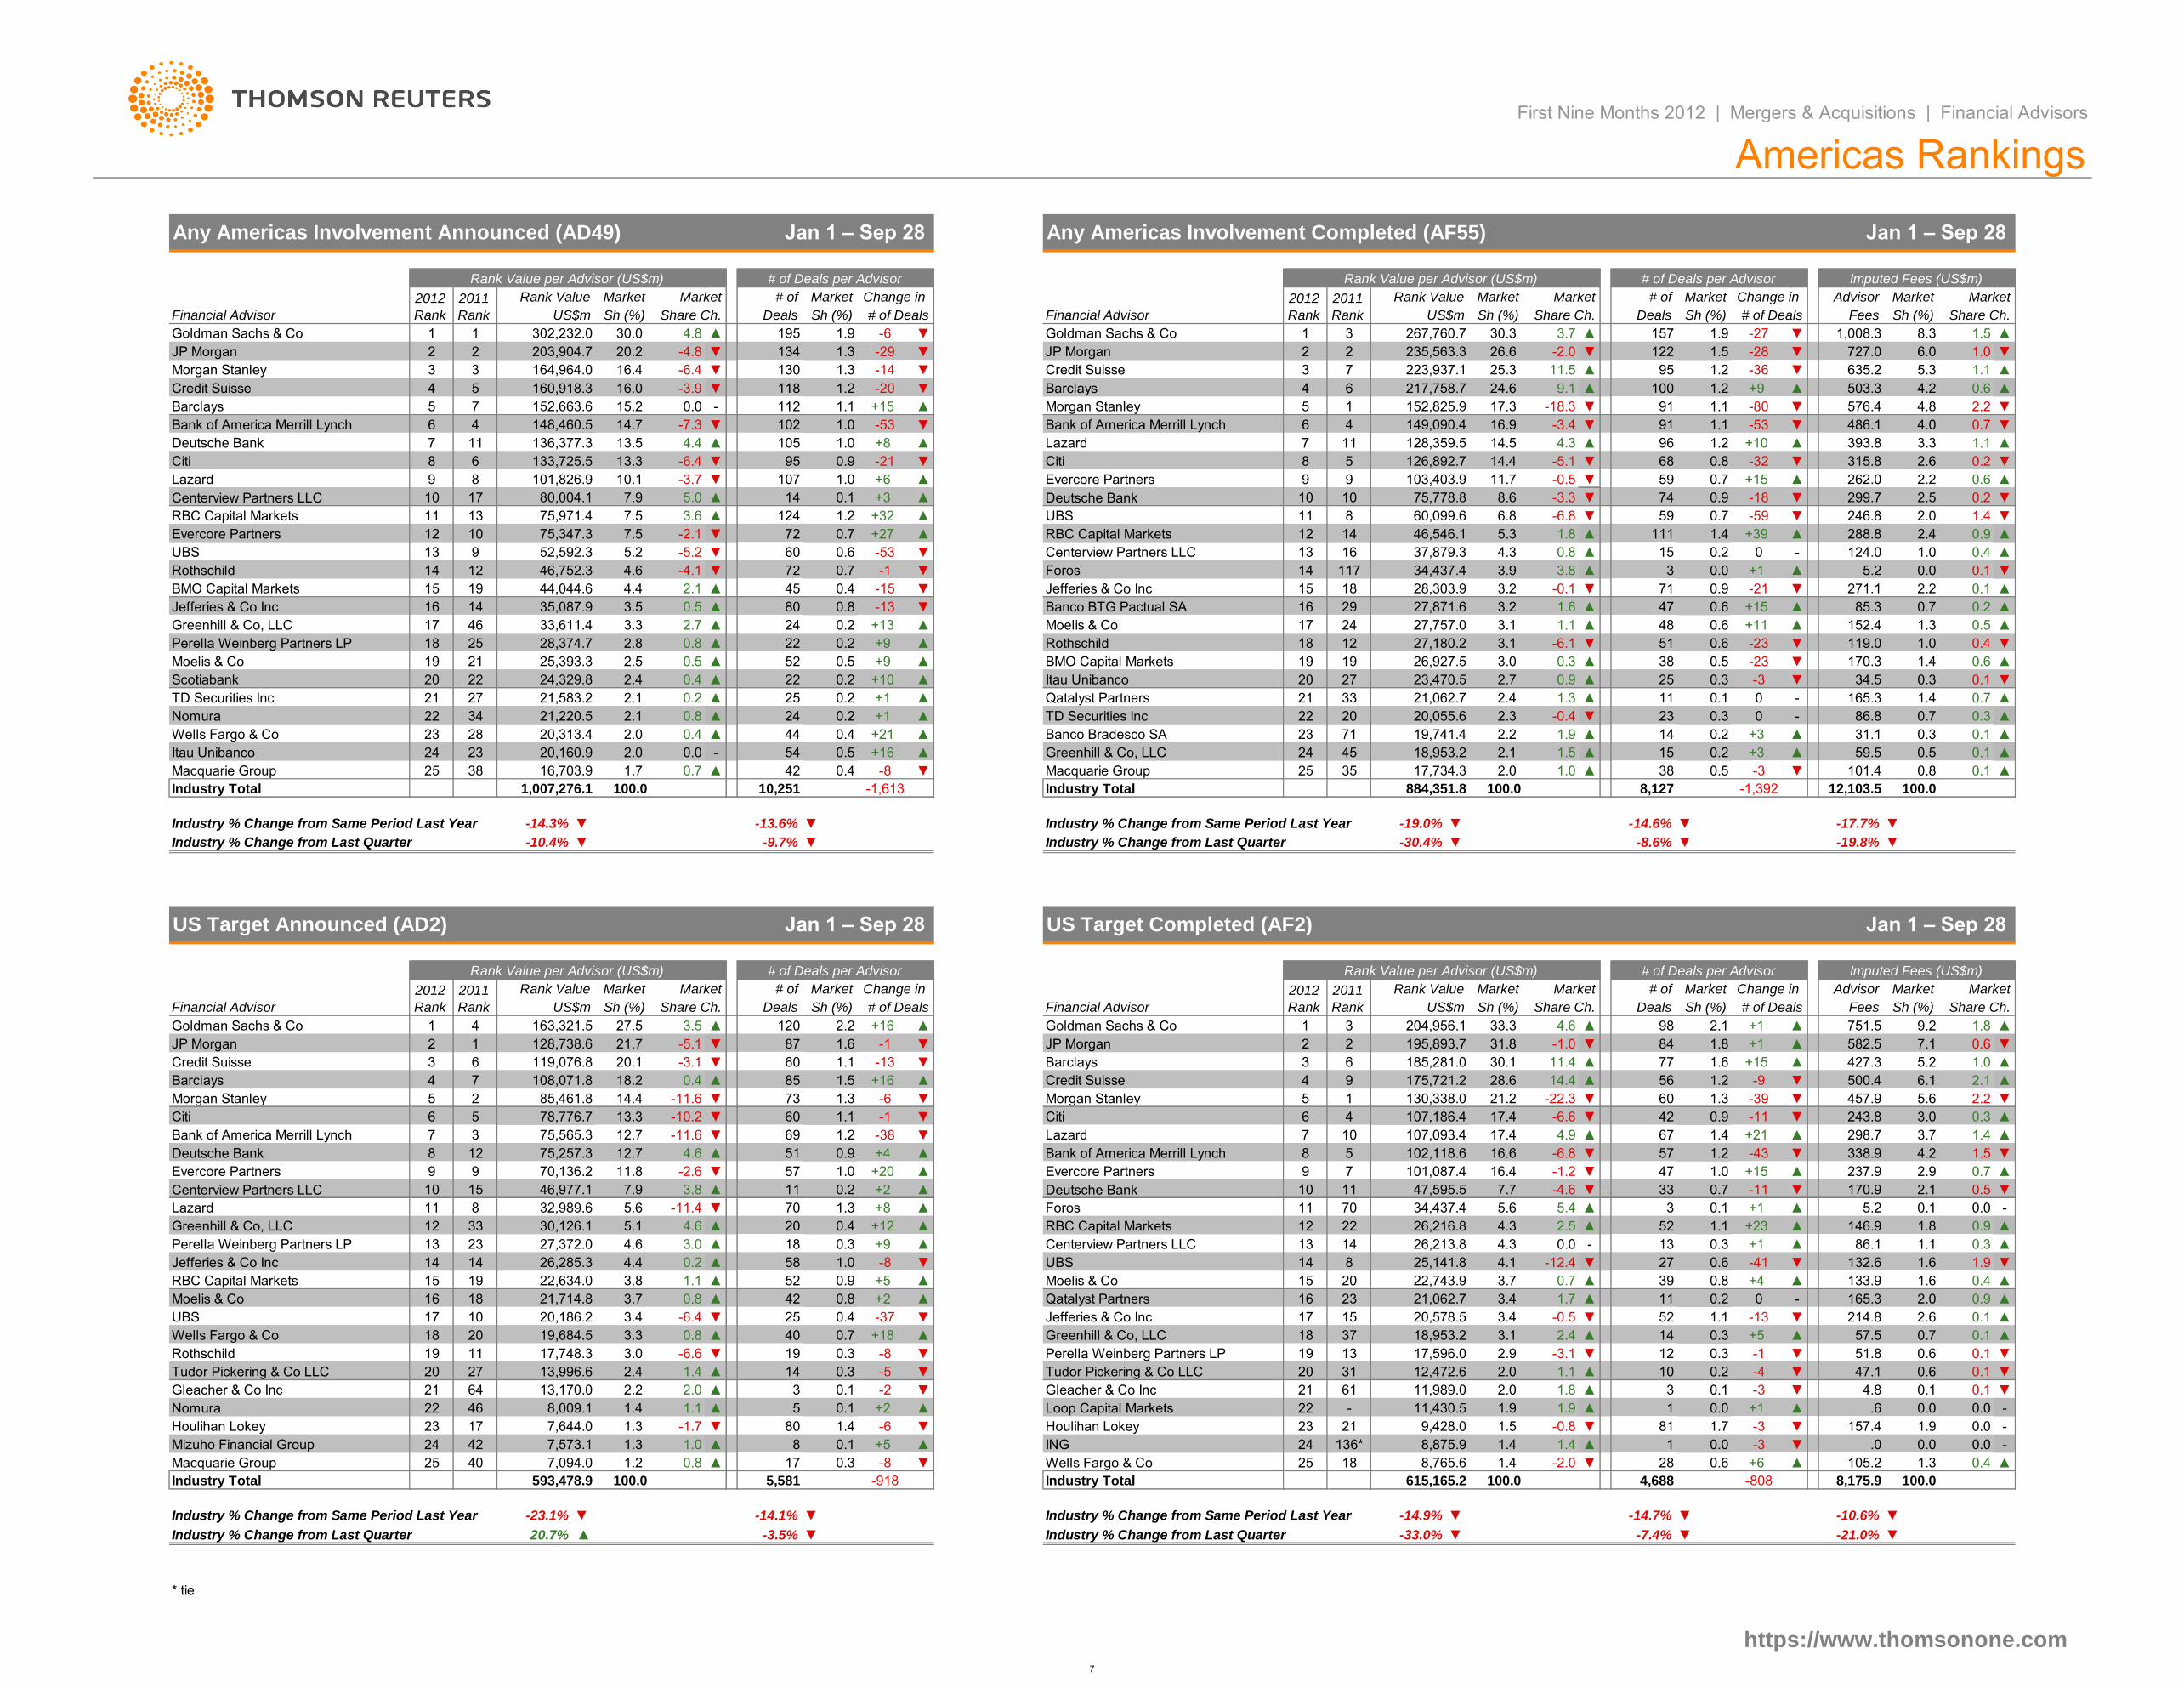
Industry % Change from Same Period Last Year -14.3% ▼ -13.6% ▼
Rank Value per Advisor (US$m) # of Deals per Advisor
▼ -19.8%
Rank Value per Advisor (US$m) # of Deals per Advisor
Industry % Change from Last Quarter -10.4%
▼
100.0
-8.6% ▼▼
Imputed Fees (US$m)
▼
12,103.5
Industry % Change from Same Period Last Year -19.0%
US Target Completed (AF2) Jan 1 – Sep 28
-14.6% ▼ -17.7% ▼
Industry % Change from Last Quarter -30.4%
Sh (%)
2011
Rank
Market
US Target Announced (AD2) Jan 1 – Sep 28
MarketRank Value Market2012
Rank Fees
# of Change in 2012
Rank
2011
Rank
Rank Value Market Change in Market
# of Deals
Market
27.5 3.5 ▲
US$mDeals Sh (%) Share Ch.Sh (%)
Advisor
751.52.2 +16 ▲ Goldman Sachs & Co
Market
Share Ch. Deals Sh (%) # of DealsFinancial Advisor
4 163,321.5 1.89.298 2.11 3120 ▲
21.7 -5.1
+1 ▲204,956.1 33.3 4.6 ▲
▼
7711.46
JP Morgan 2 1 128,738.6
3
JP Morgan-11.687
60 -136 119,076.8 20.1 -3.1 5.2
▼582.5 7.1
▲
0.6
1.0427.3
1.831.8 842 -1.0 ▼195,893.7
▲
Barclays 4 7 108,071.8
+1
30.1
▲
▼ 1.1
▲
1.6 +15 ▲Barclays
0.4 ▲ 1.5 +1685 ▲ 1.2 -9 ▼18.2 Credit Suisse 175,721.2 28.6 14.4 56
-22.321.2Morgan Stanley 5 2 85,461.8 130,338.05 1 60 1.3 -39
▲6.1 2.1
5.6 2.2 ▼
500.4
-10.2
14.4 -11.6 457.9▼ 1.3 Morgan Stanley-673 ▼
60 Citi 6
▼
1.1Citi 6 5 78,776.7 13.3 0.34 107,186.4 17.4 -6.6 ▼ 243.8▼ 0.9 ▲
Bank of America Merrill Lynch 7 3 75,565.3 12.7 -11.6 ▼
▼ 3.0
1.2 -38 Lazard 3.7
-11-1 ▼ 42
10▼ 1.41.4 +2117.4 4.9 ▲ 298.767 ▲
Deutsche Bank 8 12 75,257.3 12.7
▲7
16.6 -6.8 ▼1.5▼ 57 ▼ 338.91.2 -43 4.2
Evercore Partners 9 9 70,136.2
10
57
▲
102,118.6
16.4
▲0.2
11.8 Evercore Partners+20
10 11
79
Bank of America Merrill Lynch 8 5▲
▼
51 0.9
▲
▲
101,087.4 +15 ▲1.047
0.77.7 ▼
-1.2 ▼ ▲237.9 2.9
-
0.52.1170.9 ▼
0.7
5.4 ▲ 0.03 0.1 +1 5.2 0.1▲
47,595.515 -11-4.6 ▼ 3346,977.1 7.9 3.8 11
11 8 32,989.6 +8 ▲ Foros▼ 5.6
1.812 22
5.6 -11.4 70 34,437.4
0.4
11 70
30,126.1 +12 ▲26,216.8 4.3 2.5 ▲ 1.152 +2333 5.1
13
Lazard
0.9▲ RBC Capital MarketsGreenhill & Co, LLC 12
4.6 4.3Centerview Partners LLCPerella Weinberg Partners LP 13 23 27,372.0 18 ▲0.3
▲
0.0 -
-4125,141.8
4.6 ▲ 20
1.0
+1
146.9
86.1
▼58 1.9▼ 14 8
13 ▲
RBC Capital Markets 15 19 22,634.0
1.1
1.6
0.3
▼4.1
14 ▲
Jefferies & Co Inc 14 14 26,285.3 4.4 -12.4 ▼
0.326,213.8
1.1
0.2
0.7 ▲Moelis & Co 150.9
132.627
0.8 +4 133.9 1.6
0.6
39 ▲
Jefferies & Co Inc 3.4
18,953.2
1517
▲0.420 22,743.9 3.7
▲-13 ▼ 2.6-0.520,578.5 1.1 0.1▼ 523.420,186.2
▲
165.3 2.021,714.8 3.7
0.73.1
214.8
18 20 19,684.5
▲
-37
0.2 0 -
▼
0.9
0.137 14 57.52.4 ▲ ▲
Tudor Pickering & Co LLC 20 27 13,996.6
0.3 +5
19 13 17,596.0 2.9 ▼-3.1▼19 11 51.8▼17,748.3 3.0 Perella Weinberg Partners LPRothschild ▼ 12 0.3-6.6 0.1▼ 0.3 -8 0.6
Tudor Pickering & Co LLC 20▲ ▼0.32.4 1.4 31 12,472.6 2.0 1.1 0.2 -4 ▼
▼ 0.1 ▼4.8
47.1▼
0.1
0.6 0.1
1.4 1.1 5
▲11,989.0 2.0▲ -23 0.1Gleacher & Co Inc 21 64 13,170.0 2.2
.6
31.8
46 8,009.1 0.0
1.3 -1.7
1.9 ▲
21
22
Houlihan Lokey 23
▲
Houlihan Lokey 23 17 7,644.0
+1Nomura 22 Loop Capital Markets0.1 +2 0.0
0.0▼1.3
9,428.01.4
8,875.9 1.4
80
1.0
-
81 1.7 -3 ▼ 0.0 -1.9
0.0
157.4-0.8 ▼
▲ 111,430.5 1.9
▼
-
136*
Wells Fargo & Co
24ING8▲ +5 ▲
▲
0.0 -1.4 ▲ .01 0.0 -3
100.0
▲▲ 1.3 0.4105.28,765.6 2818Macquarie Group 25 40 ▼0.3 +6▼1.4
-808
-14.9% ▼
25
Industry Total
0.6
Industry % Change from Same Period Last Year
▼
https://www.thomsonone.com
-14.7%
-7.4%▲
4,688
-14.1%
100.0593,478.9 8,175.9
Industry % Change from Last Quarter -33.0%
-918
▼ ▼
▼-10.6%▼
-21.0%
100.0
* tie
-3.5%
Industry Total
▼
7,094.0
-23.1%
20.7%
0.8
-6
24 42
▼
7
Evercore Partners Deutsche Bank
Barclays National Bank of Canada Fin'l
▲3.3 ▲ 1 0.0 +1 ▲ 0.1▲ 23*Rabobank NV - 3,474.5 3.31 0.0 +1 ▲24*
24*
Arctic Securities ASA
Rabobank NV +2 ▲
2.2 2.2-
-
3,474.5
3.24
1.8
-
▼
+1
6
+6
2.6 ▲
▼
▲
0.1+1
84*
36.3% ▲
2.6
-0.6
Industry Total
▲
3,474.5 2.2 2.2 ▲
0.1
▼
155,240.7
0.0 0
4.1 0.21
0.1▲ 0.1
0.1
0.1
.9
▲
0.0
2.2
1,535
▼
▲3.7%
1
-14.0%
▼
-249 1,924.4
▼ -5.8%
0.2%
Industry % Change from Same Period Last Year
2.2 0.01
2 0.1
-17.0%
-10.1%
2,119
▼
▲
100.0
1 +1
▲
-9.8%
2.2
+1
+1 23* -
+1
▲▲ 0.0
3.33,474.523*▲
0.1
▲
Mitsubishi UFJ Financial Group▲ 3.3
▼0.2
▲
0.03.5
3.2 0.0
3.2
0.12.1
0 -ABG Sundal Collier▲
2
23* 3.3
3.33,474.5
▲
22 51* 3,762.1HSBC Holdings PLC
3 3,474.5
▲
11
17
4
1.3
3.8 3.7
-12.9JP Morgan
▲
3
+4 4.8
21
5,123.7
78
-7▼ 8200.5 7
5.0
▲
35.20.0 ▼
0.1
▲
6.6
▲
19 ▲ 32.99 0.41.70.0▲Jefferies & Co Inc
21 29 5,054.5 3.3 0.3▲-1▲ SEB Enskilda0.2
▲0.0 03 0.6- 10.6 0.3UBS 18 11 6,861.0
5.4
4.4
23 5,743.5
45
14
LionTree Advisors LLC 19 - 6,579.0 4.2 ▲0.04.2 +1
▲
3.4
19 2.7
▼ 18
▼
Desjardins Securities Inc.
7,246.6 4.7 -0.4 17▼ 0.525.3Deutsche Bank ▲
▲
0.0 1.3 ▲
0.1 1.4
▼-2
2.0 0.6 ▲
2.6
-0.1 0
+5 ▲ 49.116▲ 22
Industry % Change from Same Period Last Year -19.6%
Industry % Change from Last Quarter -29.6%
BMO Capital Markets
1
8
-1,052
-14.2% ▼
100.0
-20.9% ▼
-18.3% ▼
▼
20,055.6
-8.7%
▼
Advisor
# of Deals per Advisor
Industry Total 743,254.8
▼
6,336
0.5 0.2 ▲
10,128.6 100.0
0.1 -9 ▼ 49.2▲ 9RBS 25 38 10,654.7 1.4 0.6
0.0 -24 0.4 -3 ▼ 65.2 0.6
0.0 0.0 -
Macquarie Group 24 37 10,758.9 1.5 0.7 ▲
▲ .61.5 1.5 ▲ 1Loop Capital Markets 23 - 11,430.5 0.0 +1
-3 0.0 -4 ▼ 4.8 0.1
0.0 -
Gleacher & Co Inc 22 76 11,989.0 1.6 1.4 ▲ 0.0
▼ 47.11.0 ▲ 10 0.5
HSBC Holdings PLC 20
Tudor Pickering & Co LLC 21
0.313,097.7 1.8
1.7
0.6 ▲
39 12,472.6
▼ 54.814 0.2 -2
28
0.2 -4
0.5
0.0 -14 0.2 -6 ▼ 28.1
0.1 ▼
0.6 0.1 ▲
Perella Weinberg Partners LP 19 13 17,715.4 2.4 -2.9 ▼
1.5 ▲
0.2 +4 ▲ 59.52.0 ▲ 1546 18,953.2
21,062.7 2.8
2.6
27 0.8 ▲11 0.2 0 - 165.3 1.6
0.2 ▲63 1.0 -21 ▼
▲
Jefferies & Co Inc 16 17 23,564.7 3.2 0.0 ▲ 245.3 2.4
0.621 28,230.3 3.8 1.5 1.7166.8▲
3.7 1.3 ▲ 46 1.5 0.60.7 +9 ▲ 150.0
0.0 -96 34,437.4 0.0 +1 ▲ 5.24.6 4.5 ▲ 3
0.5
▲59 0.9 +13 ▲
0.1
▲15 0.2 0 - 1.2124.0
2.0 1.5 ▼
Centerview Partners LLC 12 14 37,879.3 5.1 1.0 ▲
▼ 205.15.9 -8.7 ▼ 487 43,994.7
241.9 2.465,706.1 8.8 -4.3 ▼
0.8 -52
0.6 ▼61 1.0 -20 ▼
252.1 2.5 0.7 ▲53 0.8 +16 ▲
2.8 0.1 ▼
Evercore Partners 9 9 102,060.6 13.7 -0.5 ▼
4.1 1.2 ▼
-6.5 ▼ 56 0.9 -31 ▼ 285.1
-61
▲
▼ 413.015.4 -7.3 ▼ 72
11 117,935.7 15.9 4.7
114,165.7 1.14
1.3 -66
▲84 1.3 +9 ▲ 348.5 3.4 1.0
▼
483.0
83
+4
Morgan Stanley 5 1 146,764.7 19.8 -19.8 ▼
5.6 1.5
541.9 5.4 2.1
0.7Barclays 4 6 200,111.7 92 1.59.0 ▲
-3.1 ▼ 109 1.7
▲▲ 4.8
▲72 1.1 -30
6.8-29 ▼
▼ 570.4
692.9
Share Ch.Financial Advisor US$m Sh (%) Share Ch.
Goldman Sachs & Co 1 3 247,056.5 ▲
Change in Advisor Market# of Market
Deals Sh (%) # of Deals Fees Sh (%)
Industry Total 784,078.5
Industry % Change from Same Period Last Year -21.5% ▼
-1,186
▼
7,605
12.7
26.9
Bank of America Merrill Lynch
Lazard 6
+3
-
1.6146
-7.5% ▼
14
100.0
-13.5%
-3
0.2 -9
0.1
0.0HSBC Holdings PLC 25 26 9,790.4 1.3
12,310.0 1.6 ▲ 6
3 0.01.7 ▲1.5Gleacher & Co Inc 23 82 13,170.0
Blackstone Group LP 22 22 13,882.0
0.6 +21
+70.4
44
30
0.215
20,313.4
21 37 14,331.6
1.8
21
1.8 1.1 ▲
2.7
0.0 -
1.4 ▲ 0.3 +4
25,366.2
Tudor Pickering & Co LLC
22Nomura
2.6 0.7
3.2
▲
18 0.6 +649▲
25,817.7 3.312
0.8
-5.6Rothschild
3.7
Moelis & Co
19 28
19
20,889.5
Jefferies & Co Inc 15 29,005.514 0.3
▼-5.8
40
▲
▲
0.2
28,374.7 3.6
17
3.7
3.3
1.2
-4912 40,601.110 0.6
9.372,903.1
46
Lazard
33,611.4 4.3
UBS
11 8
5.2
Greenhill & Co, LLC 13
2
+1
▲
86 1.1
▼1.076
▲
3 127,430.1
Deutsche Bank
Goldman Sachs & Co 1 2 243,583.7
1 154,066.8JP Morgan
5
RBC Capital Markets 26,174.8
▲1.3
Credit Suisse 3 6 139,776.4
102,850.5
5
Jefferies & Co Inc
6
1
16
Perella Weinberg Partners LP 15
17
Wells Fargo & Co 20
2.5
+9
2.3
0.8
21
▲
+1
40,456.4 26.1
10
20 27 6,147.4 4.0
3,474.5 2.2
100.0
4,092.3
9.1%Industry % Change from Last Quarter
* tie
▲
-18.1%
84* 3,474.5
GMP Capital Corp
-
Industry % Change from Last Quarter▼
Arctic Securities ASA 3.3
107,058.9
▲
100.0
39.321 7,414.4
Lazard
▼
6,146.7 13
Sh (%)
18.7
3.6 ▲
13
US$m
5.7
▼
▲
1.0 ▼
4.8 ▼ 914.62.2 -18 9.0 1.8
-9.5 ▼
▼-1.6
▲3.4
GMP Capital Corp
▼
104
108
▼
5,304.2
5,520.3
Rank Value
▲
5.2
UBS
+1
-2
0.1
4,092.3
-64
+14
5.4
Jan 1 – Sep 28
Market
▼
4.7
82
8.7
1.4
2
Market
Share Ch.
Imputed Fees (US$m)
Jan 1 – Sep 28
Deals
# of
▲
# of Deals per Advisor
167 137
# of Deals per Advisor
-8.44
-9.0 ▼
Market Market
First Nine Months 2012 | Mergers & Acquisitions | Financial Advisors
US$m
Rank Value
Any US Involvement Announced (AD41)
2011
Rank
2012
Rank
Morgan Stanley
Financial Advisor
Rank Value per Advisor (US$m)
31.1
19.7
17.8
16.3
Sh (%)
4.2
1.2 -21
1.5 -30
-8
Change in
▼
117
88
▲
-5.2
7
Market
2.2
Sh (%)
1.4
# of Deals
12.5
-3.4
▼
▲
Credit Suisse
6
14.5
3.8
72
5
▲
▼
0.9 +1020
61
20
8
8 0.4 -10
2
8.0
▲
4.3 13
33
▲26,403.3
Scotiabank
Bank of America Merrill Lynch
2
4
BMO Capital Markets
TD Securities Inc 6
7Citi
CIBC World Markets Inc
5
RBC Capital Markets
Goldman Sachs & Co
-14 3
# of Market
# of Deals
▲
+29
Market
1 34.2
3 26.1 1.6
12.2
40,453.4
3.4
5 ▲
1 1.8
-23 143.3
22.3
Any Canadian Involvement Announced (AD42)
Financial Advisor US$m
Rank Value
2
3 ▲
▼
0.7
53,145.4 142.5RBC Capital Markets 59
2.4
Market
24
# of
# of Deals
Industry % Change from Last Quarter
Rank Value per Advisor (US$m)
Market
Sh (%)
2012
Rank
2012
Rank
Change in
Allen & Co Inc
-2.9%
2011
Rank Deals
Market
Financial Advisor
Market2011
Rank
Rank Value per Advisor (US$m)
15
18
17
Any Canadian Involvement Completed (AF49)
20 27,729.9
DealsShare Ch.
-2.2
-5.5
0.1
▲
Fees
+1 ▲
▼
▲
0.97.4
7.4
1.8
▲
Sh (%) Share Ch.
86.8
3 23,858.2
21.9
4.5
0.3 +17 ▲
13.1
15.4
11
Bank of America Merrill Lynch
6
Moelis & Co
1.1
0.8
Centerview Partners LLC 9
Barclays
Citi 7
120,759.7
48
7
97,675.7
10
14 0.2▲6.8
9
16
73,374.4
80,004.1 10.2
12.295,730.7
-6.0 -1
-1.8
90
-12.2
9.4 ▼
▼ UBS
Citi
▲
-2
▲
▼
▼
▲
Qatalyst Partners
Market
0.9
13
RBC Capital Markets
24 ▲0.3 Foros
1469
+14
▼
0.1▲4 5.5
+3
Sh (%)
27
0.1▼
▲
▲
72.8
▼
Jan 1 – Sep 28
▲
15
Share Ch.
23
0.93.8
9 23,744.8 15.3
+317.0 17.8
0.123▲ CIBC World Markets Inc
▲ 11
-3.2 ▼16.055
8
1.1-7 86.4 4.5▼
4 21,583.2 13.9 +2 ▲+2▼
-2 0.1
0.116,718.26Scotiabank25
▲ 7Goldman Sachs & Co
▼ 10,071.0▼ 27Rothschild
11
Morgan Stanley
1.2
6
2.5
2.8
10
10
▼
Macquarie Group
▲
5.2
-13.5 25
+9
-5
1.453.5▲
10
10
21
1.1
4.5
9
21.7
9,740.913 10.4
0.2
10.5
Rothschild 16 22
8
7 10,456.6
10
9Credit Suisse
JP Morgan
17,964.8 11.6
16,355.1
9.8
0.6 -545
# of Deals per Advisor
▼
▼
▲
0.3
▲4 16,698.3 15.6 +1
TD Securities Inc
17,162.9
▼
▼
Bank of America Merrill Lynch
64
▼
▼
▲
▼
1.2
▲
▲
▲
86.2
2.9
0.4
▼
11.4
▼▼
0.0
0.814
16
-4.5
0.0
▲0.2
▼
▲
56.715.6
▼
11
23,436.3
-9.8
19,090.5
9.4
2011
Rank
-5.0
9.1
▲ ▲
09,723.1 9.1
5
▼
11
▼
Jan 1 – Sep 28
25 10,567.5 6.8
Any US Involvement Completed (AF48)
▼
▼
+23
Americas Rankings
▲
33.2
29.3
▲
12
8
10
20
▲
48.8
0.1
112,545.2
▲
2.6+11 ▲ 66.79,286.4
0.80.09 2.58.813
3.5
200,160.8
2
8
48.0
-5
9,374.0 5.2 ▲
15
+2
+68.2
▲
-
1.7+2 ▲8.4Barclays
12
-37.2 4.016
▲ 22
7,676.4
4.8 ▲
9
6.9
0.0
0.0 2.1
▲ 9 0.0 ▼ 33.6 1.8
+6 ▲13 8,999.720 ▲6.2 40.6
3 26.9
Rank Value per Advisor (US$m)
JP Morgan
Rank Value Market Market
4.9 0.4
15
-90.3
2.2
9,144.0 0.5
8,973.7
▲
7,670.4 3.2 ▲
-4.8
0.7
15
11
0.6
11
14
4,435.9 0.82.922
15 -3
-1.7
+2
Industry Total
24*Mitsubishi UFJ Financial Group
-468
Industry % Change from Same Period Last Year
0.1
HSBC Holdings PLC
SEB Enskilda 23
ABG Sundal Collier 24*
-
https://www.thomsonone.com
17
118*
-4
-5
▲
2 218,057.4
Credit Suisse
+3
-25
15.1
Imputed Fees (US$m)
2012
Rank
Greenhill & Co, LLC
-18
-17
▼
10
Deutsche Bank
-0.6
19
5.9Morgan Stanley
National Bank of Canada Fin'l
1
16,127.8
▲
0.5
+8
Change in
0.6
▲
-2 ▼
Sh (%)
0.8
Canaccord Genuity 5.2
14
13
16
1.2
12
0.4
0.7
9,837.4 3.9
5.3
15
6.3 ▲
6.7 -4.2
8
▲
▼
▼
5.8
▼
▲
▲
Macquarie Group 17
▲
0.5
15
12
▼
8,108.4
10
8
Belgium / Mexico
EMEA Targeted Financial Sponsor Investments (Buyside Sponsor Activity)
21,361.5Financials / Banks
2
Spain / Spain45,998.8
Rothschild
Switzerland / SwitzerlandAcquiror / Target Nation
United States / Switzerland
Rank Date
2/7/20125/25/2012
International Power PLC (40.93%)
Pending Glencore International PLC
Intended
5/21/2012 Industrials / Other IndustrialsBelgium / United Kingdom
Eaton Corp
6/29/2012
Pending United States / Ireland-Rep6/29/20123/29/2012
Target (% Sought/Acquired)Date Effective Acquiror
Banco Financiero y de Ahorros (100%) FROBWalgreen Co6/19/2012 Alliance Boots GmbH (55%)
PendingXstrata PLC (65.9%)
Morgan Stanley
30,689.7 45,169.6
Rank Value (US$m)
Citi
Industrials25
37,239.3 2
49.9
Deutsche Bank29,078.0
1
26,704.6
6 51.7
Consumer Staples / Agriculture & Livestock
Real Estate / REITs
223,929.3 26.3
Retail / Other Retailing
Jan 1 – Sep 28 2012
Target Macro / Mid Industry
3
3Materials
Credit Agricole CIB
Citi
Barclays
Credit Suisse
24,727.4
97,274.2
11,850.0
Goldman Sachs & Co
Dr Ing hcF Porsche AG (50.1%) 8,854.8
Goldman Sachs & Co
18,493.7
Consumer Staples / Food and Beverage20,093.4
29,353.0
Energy and Power
EMEA Deals Intelligence
Electrabel SAAnheuser-Busch InbevGrupo Modelo SAB de CV (49.7%)
11,810.0
Morgan Stanley
FinancialsRank Val US$m
38,872.5
7/4/2012
Pfizer Nutrition (100%)
Pending
Lehman Brothers Holdings IncPending
Pending
Volkswagen AG8/1/2012
Primary Listing of Most Acquisitive EMEA Companies - Top 10 (US$B) Jan 1 - Sep 28 2012
1/23/20121/23/2012
3/20/2012
Cooper Industries PLC (100%)4/23/2012 Switzerland / United StatesNestle SA
Archstone-Smith Trust (26.5%) United States / United StatesGermany / Germany
Viterra Inc (100%)
First Nine Months 2012 | Mergers & Acquisitions | Financial Advisors
EMEA M&A
EMEA Announced M&A Down 9% While Fees from Completed M&A Down 35% | Financials Most Active Sector | Goldman Sachs in First Place
7,361.5Glencore International PLC Switzerland / Canada
53.9
40.3
https://www.thomsonone.com
23,785.7Materials / Metals & Mining
Top Ten EMEA Involvement Announced Deals
33.9
6
Industrials / Automobiles & Components
12,855.9
15
Bank of America Merrill Lynch
2 17
12 Consumer Staples 72,097.7 950
Morgan Stanley
2,081
29.53
61,839.5
3
58,355.9 60.4
32.3
90,986.3
22.220,223.7
1
60.0
1258,757.4
18.2
16 63.6
Rank
Goldman Sachs & Co24.3
JP Morgan
Mkt.
1101,586.8
Share
14
No. Deals
29
25 1,049
8 1,076
13
38.31,426
12
14
Consumer Staples / Food and Beverage
3
2
38,880.4 1
Energy and Power / Power12,240.3
90,504.2
EMEA Involvement Announced Advisors by Target Industry Jan 1 - Sep 28 2012
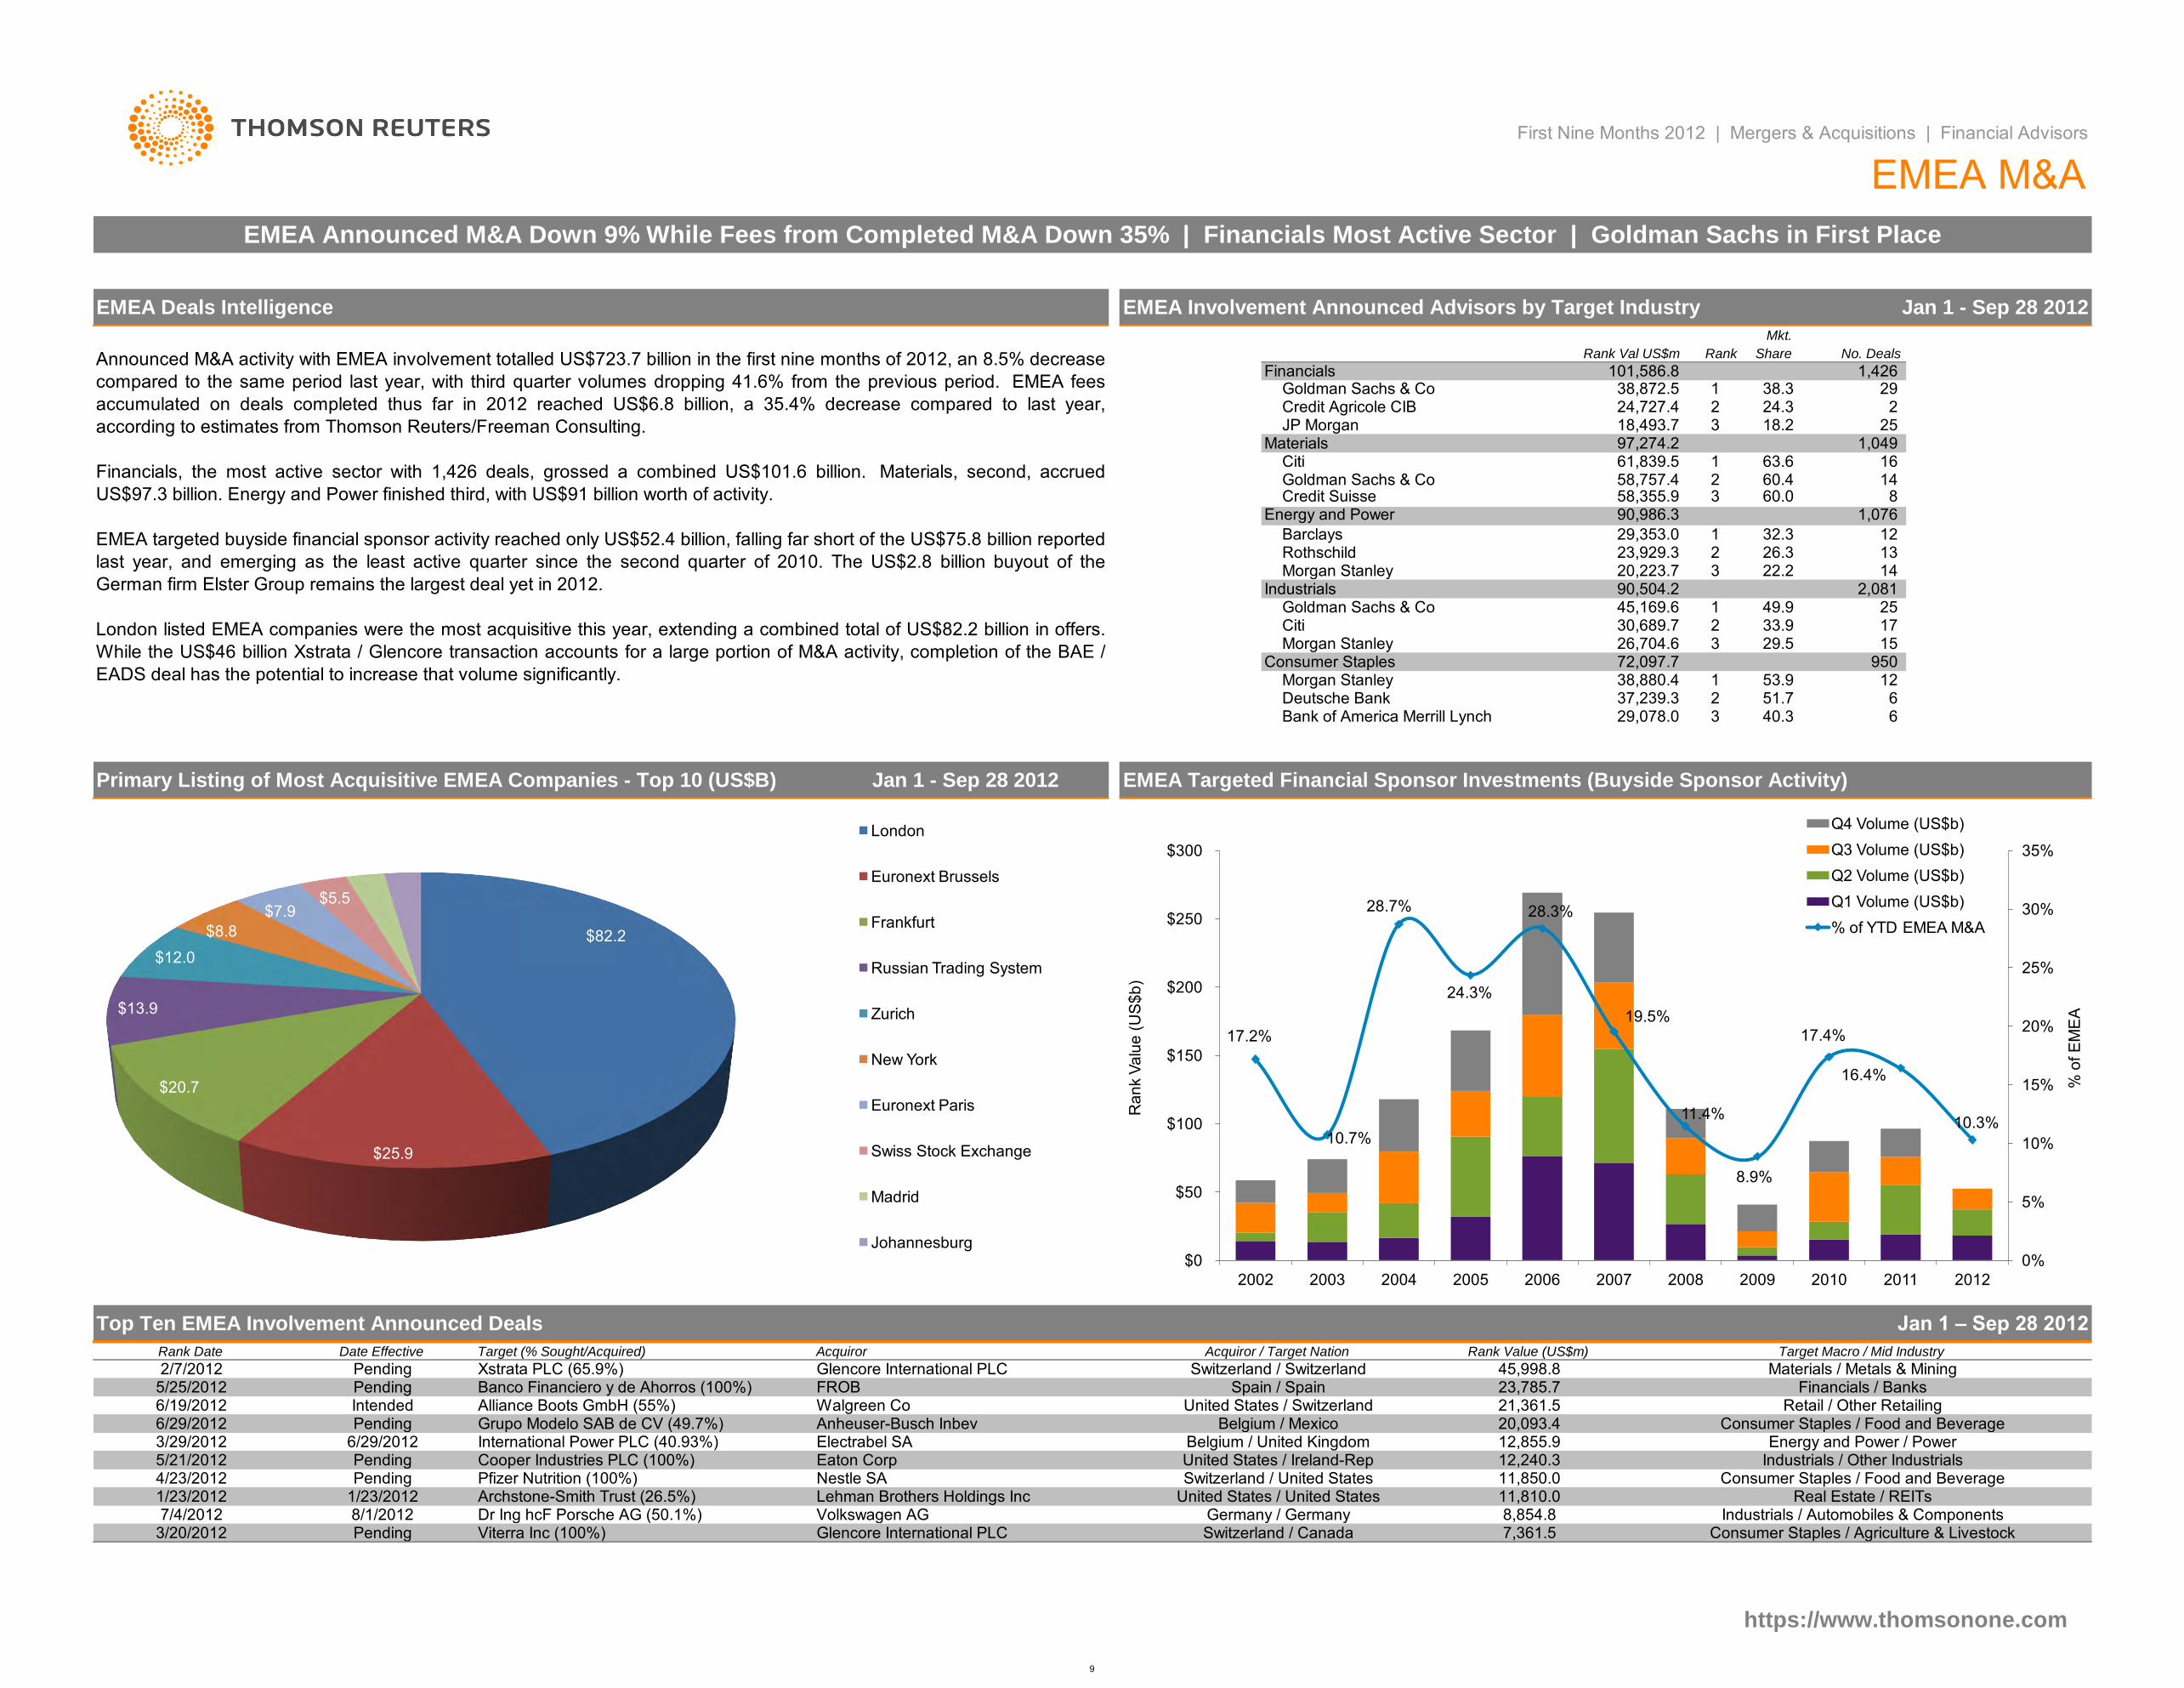
Announced M&A activity with EMEA involvement totalled US$723.7 billion in the first nine months of 2012, an 8.5% decrease
compared to the same period last year, with third quarter volumes dropping 41.6% from the previous period. EMEA fees
accumulated on deals completed thus far in 2012 reached US$6.8 billion, a 35.4% decrease compared to last year,
according to estimates from Thomson Reuters/Freeman Consulting.
Financials, the most active sector with 1,426 deals, grossed a combined US$101.6 billion. Materials, second, accrued
US$97.3 billion. Energy and Power finished third, with US$91 billion worth of activity.
EMEA targeted buyside financial sponsor activity reached only US$52.4 billion, falling far short of the US$75.8 billion reported
last year, and emerging as the least active quarter since the second quarter of 2010. The US$2.8 billion buyout of the
German firm Elster Group remains the largest deal yet in 2012.
London listed EMEA companies were the most acquisitive this year, extending a combined total of US$82.2 billion in offers.
While the US$46 billion Xstrata / Glencore transaction accounts for a large portion of M&A activity, completion of the BAE /
EADS deal has the potential to increase that volume significantly.
17.2%
10.7%
28.7%
24.3%
28.3%
19.5%
11.4%
8.9%
17.4%
16.4%
10.3%
0%
5%
10%
15%
20%
25%
30%
35%
$0
$50
$100
$150
$200
$250
$300
2002 2003 2004 2005 2006 2007 2008 2009 2010 2011 2012
% o
f E
ME
A
Ra
nk V
alu
e (
US
$b
)
Q4 Volume (US$b)
Q3 Volume (US$b)
Q2 Volume (US$b)
Q1 Volume (US$b)
% of YTD EMEA M&A $82.2
$25.9
$20.7
$13.9
$12.0
$8.8
$7.9 $5.5
$4.4 $4.2
London
Euronext Brussels
Frankfurt
Russian Trading System
Zurich
New York
Euronext Paris
Swiss Stock Exchange
Madrid
Johannesburg
9
Rothschild UBS
Rothschild Credit Suisse
0.0
17
23
-15
Rank Value per Advisor (US$m)
Market
Jan 1 – Sep 28Any EMEA Involvement Announced (AD47)
First Nine Months 2012 | Mergers & Acquisitions | Financial Advisors
# of Deals per Advisor
1Goldman Sachs & Co
Share Ch.
▲
Rank Value
Any EMEA Involvement Completed (AF53)
Deutsche Bank
Morgan Stanley 27.4
5
7
113,970.2
110,320.3
Bank of America Merrill Lynch 6
8
10
10
2011
RankFinancial Advisor
14
Macquarie Group
UBS 13
Lazard 9
15
11
14M Klein & Co LLC
12
BNP Paribas SA
Credit Suisse
Credit Agricole CIB
RBC Capital Markets
Nomura
HSBC Holdings PLC
Centerview Partners LLC
Citi
161,311.7
79,704.0
98,199.6
154,355.0Barclays
JP Morgan 4
7
6
2
Jan 1 – Sep 28
Sh (%)FeesDeals
281.13 3
▼
1
▼
-1
0.4
182,478.8
4
5
17
9
15.2
2
28
▲
▼
40,453.5
45
14
3.7
-
▲
▲
15,009.2
19,191.0
-6.8
2.1
2.4
-6.7
15,220.0 2.1
2.7
1.1 12,735.8
14,902.1
51 15,132.7
23
▼ 51
0.0
-18 26
0.3
RBS
2.4
▲
0.0
0.8 ▲
0.1
▲ BNP Paribas SA
Centerview Partners LLC
▲
▲0.1
0.2
Societe Generale▲
-21
Ondra Partners
Gleacher & Co Inc
29▲
▲
0.0
▲
▼
11
2.2
▼
-1.9
0.9 +1
+6
Intesa SanPaolo
19
11,998.0
23
12,974.0
11,279
1.9
1.2
▲
22
Intesa SanPaolo 24
695,032.4
0.1
480,389.0
3.1
832.8
▼Industry % Change from Same Period Last Year
Industry Total
17
25 19
▲
1711,998.0
▼ 1513,922.1
100.0
30 -2.7
-2.011,444.6
▼
12,735.8
-3.3
▲Industry % Change from Last Quarter
25 86 1.7 ▲
-7.5% ▼Industry % Change from Same Period Last Year
-42.6% ▼
Industry Total
Industry % Change from Last Quarter
2.4
100.0
-17.5%
20
87
17
17
-72
-25
0.2 -2
-2,060 100.0
▼
▼
253.2 3.9
▼
Change in
▼
3.3
0.2
0.4 -32
0.1
6,479.9
▼
-2,091
0.4
18.3
+3
0.5
18.6
0.570.0
0.2
0.0
0.0
1.0
0.1
0.3
RBC Capital Markets 19
18
8
11
-
53.2
47 1.1
41
68
Industry Total
▼
17
13,089.8
-13.5%
15.8
6.5
▼
14
-27
811.3 ▲
66,836.9
6.6
40,453.5
▼ 10.650,992.2
28
6 -2.0RBS 21
3.2
14,764.7
2.5
2.148
5
0.2 19
▲
▼
0.4 1944▼
▲
2.2
21 90 17,152.1
22 15,220.0
2.1
0.22.2
11
▲
40
58
2.5 2.3
23
2.7
13
56
2.5
18,973.819
17,520.020
18
15
11
0.7
29,799.0
23,240.0 3.3
20,878.8
4.3 -4.7
87
HSBC Holdings PLC
-7.4
▲
47▼
0.2
4.7 14
-20
-2.8
-8.6+1
31,445.6
6.2
0
▼
4.9 -6.9
Nomura-27
▲
7.8
29,565.26.6 0.0 ▲
416,018.0
5▲45
45,998.8 ▼
▼-6.5
15.9 6.7
11.5
1.4
-10
▼
-18
0.4
69
5.5
14.1 2.4
-2.8
35 +4
▲
0.3
-3558
0.6
0.8
162
0.5
▼
▼95▲
▼
UBS
▲
▼
2.3
7
66,657.43
9
-0.9 ▼ -3374 15.1Lazard0.7 72,373.88
79,058.85
66
83
16.2 2.7 ▲ 0.673
15.9
▼
151,975.7
696.4
21.9
16.6 ▲
+12
0.6
▲
17.2 3.782,664.9
-8.3
4.789,207.4
26.3
11▼ 79,286.0
Rothschild
▲
-20
5Barclays
99,603.2
Financial Advisor
3
734.2
243,205.3
9.8
182,478.8
35.0
▲
102
6
▲
Industry Total
JP Morgan
4
US$m
196,808.7
159,198.7
3
1
Deutsche Bank
9
Industry % Change from Same Period Last Year
Barclays 55
Industry % Change from Last Quarter
4
7 112,827.3
12
2
Citi
Bank of America Merrill Lynch 115,586.9
Sberbank
20Societe Generale
92
Greenhill & Co, LLC 22
21Gleacher & Co Inc
98,019.7
110,220.3
110,500.2
78,368.2
79,704.0
Jefferies & Co Inc
8
Morgan Stanley
1
2011
Rank
Credit Suisse
17
11
12
10
Goldman Sachs & Co
Lazard
7
8
6
24
Any European Inv Announced (AD21)
2.1
Ondra Partners 25
Sh (%)
9
Nomura
BNP Paribas SA
Sberbank
Credit Agricole CIB
Greenhill & Co, LLC
UBS
Societe Generale
HSBC Holdings PLC
Gleacher & Co Inc
Macquarie Group
M Klein & Co LLC
RBC Capital Markets
14 -
22
Centerview Partners LLC
▼ 22
0.0
1013
17
29
54,344.3
44,877.0
6.6
1.5
0.1
2.5
3.315,642.9
0.0
Jefferies & Co Inc
39 13,647.4
▼
23 15,009.2
16.5 -3.6
▼
3.1 ▲
▲
▼
-5.3
-1.8
1.7
2.8
20.7
13.9
16.5
13.9
18.6
-9.5
0.8
-16
-1
▼8.1 -21
▲
91
▼0.9
77
165 0.6
108,505.4
▼
0.0
▲
▲ 58
71
36
1
▲
▲
4.4
-1.1 ▼
▲2.8
▼
45,998.8
11.0
▲
-
22
4.56.2
5.4
0.4
16
11.0
2.5
4
+3
13.6
7.6
-4.5
▲
-19
79,355.6
6.4
-2.5
6.4
0
▼
▲
0.1
+1
0.354,679.3
50
13 2.0
3
13.4
14.5
-1.9
72,373.8 85
6.3 20
0.7
0.9
0.8
-30
▼
▲
71
59
214.1
▼
1.4
▼
▲
247.4
319.6
-48
# of
24.8 91
Sh (%)
Market
▼
-8.5
▲
0.6
1
-8.7
-48
3.5
Financial Advisor
Change in
▲
US$m
-41
76▼
0.8
-12.0
Share Ch.
80
Sh (%)
21.79.5
34.2
3
Market Market# of
-9
-31▲
US$m
0.5247,309.3 0.5 Goldman Sachs & Co▼
Sh (%)Sh (%) Deals
198,502.3
Morgan Stanley
Deutsche Bank
138
117 +40.4
92 0.3
▲
89,392.7
99,773.2
▲
5
108,505.4
10
4
2
4
82,671.4
12▼
2
16.5
Rothschild
▼
▲ JP Morgan
▼
6
▼
-30
-3.3
65
▼
-72
-430.8
4.417.9
0.8▼
136
▲
+5
2.7 0.7
▲
Rank Value per Advisor (US$m)
Market
392.0
Rank Value
▲3.8253.7
300.1 0.6
1
# of Deals
Market
0.7206.1
4.2
16.5
79
▲
0.5
0.6
4.7
19.9
# of Deals per Advisor
Market
Imputed Fees (US$m)
0.2
2011
Rank
0.9 ▼5.8
Market
# of Deals
2012
Rank
2012
Rank
EMEA Rankings
124,036.6
Advisor
0.9
3.0
0.0
▲
3.0
Share Ch.
Change in
▼
18
▼
3.2
Industry % Change from Same Period Last Year
11,444.6
44
9 29,565.2
26
51
18
ING
Jan 1 – Sep 28
100.0 12,179
-21
▲+3
0.1 +2 ▲
+6
-26
0.4
0.6
39
100.0
30
US$m
▼
1.5
-0.1
-3.2
▼
2.5
2.4
20Sberbank
24
2.3
13,947.7
21
25
PricewaterhouseCoopers
17
15
14
Ondra Partners
31,445.6
+3
▲+1
Evercore Partners
92
15,642.9
5.9
4.6
4.723,463.3
23,173.0
41
16,018.0
2.3
3.1
3.1
-8.3
5
-6.8 ▼
2.2
5 0.1
▼
+5
▼
9,730
# of Deals per Advisor
▼
Any European Involvement Completed (AF3)
59
22.6
▲
▲
41
4
▲
-35
0.2
+2
0.1
0.4
▲
0.8
-30 ▼
▼
0.2
79
0.1
-21
-
▼
▼
0.2
0.9 ▼
+4
0
0.2
-
▲
-
0.1
▼
Imputed Fees (US$m)
▼
0.0
0.2
0.0
▲
▼
0.2
0.1
▲
▼
▼
-
▼
▼
▼
▼
Share Ch.
0.7 ▼
▼
▼
▲
▼
▼
▲
▼
0.7
100.0
▼
▼
0.4
0.8
0.3
0.3
0.4
▲
-0.2
0.0
26.0
47.3
0.2
-13.7%
69.4
15.0
-25
-35.0%
0.8
▼
0.9
-19
▼
12.1
0.7
-
0.2+2
0.2
0.2
▲
0.6
20
1.1
56 -32
40
-18.6%
9,172
▼
▼
MarketRank Value
Goldman Sachs & Co 1 24.8119,069.0
2012
Rank Sh (%)
0.4
10
4
-0.8%Industry % Change from Last Quarter
-42.6%
-11
▼
▼
▼
15,423.3
-21
2.8
133
0.9
Market
Deals
500,490.1
0.7
0.7
0.9
60
▲
▲
Rank Value per Advisor (US$m)
Share Ch.
-12.6
2011
Rank
2
12
-1.9
0.7
0.6
0.8
▼
-66
1.5
74
86
▼
3.8
# of Market
47
▲
▲
0.6
▼
75
3.0
116.0
53.0
-36
▼
▼
0.1
0.0 0
0.2
-7.0 ▼
0.2 ▼
-71
0.2
RBC Capital Markets
Sh (%)
▼
-15
278.9
Fees
294.9
1.1
17
0
-29
▲
0.5
-1
-2
Advisor
370.7
-11
-3.5%
47.3
6,772.3
Market
-44 ▼
Jan 1 – Sep 28
-35.4%
5.7
Market
# of Deals
▼
Sh (%)
0.3
0.1
1.067.3
53.0
26.0
0.5
18.3
12.7
75.6
0.8
▼
0.63.7
1.7
1.1
▼
▲
2.0 ▼
▲
▼
3.2 ▲
▲
4.4
3.0
0.4
75 0.3
108
5+14
-19
116,255.3 16.1
3.8
5.3
77 -3
7.025.2
116,695.1
21.3
22.3
16.1
16.1 0.3
0.3
72 -23 Barclays 82,664.9
▼
-2.8
8.1
-4.9
69,508.9 ▼13.9
▼
10.9
▼
▼
▼
10 7
8
Citi 6
80,325.5
▼Lazard
Bank of America Merrill Lynch
11
68
7
67,171.9
54,420.2
▼
0.6
0.5
0.7
-33
11
8 -6.6 ▼ 56
▼ 200.3
220.0
131.9
1.03.0
▼ 0.4
1.53.3
▼
▼
▼
0.4 -32
▼
-48
-23
0.2 -23
0.2
1.1
0.2
0.3
0.4
0.5
0.7
0.1
0.0
116.0
70.0
0.3
0.8
1.0
0.3
0.0
0.8
72.7
0.2
▼
▼
▼
▲
▼
▲
0.3
-
0.6
▲
8.1
15.0+3
-21
-46
▼
▼ 194.8
18.6
-31
▼
Evercore Partners
12
15
PricewaterhouseCoopers
22
Centerview Partners LLC
ING
Deutsche Bank
-35
49
+6
0.2
+2
0.2
▲
▲
0.1
▲
11
HSBC Holdings PLC
▲
▼
▼
18
13
▼
17
▼
2
1
Financial Advisor
-2,293
+2
Sh (%)
1.2
# of Deals per Advisor
-37
Nomura
Credit Suisse 9
▼
# of Deals
Change in
-6
-8
▼
0.4
6
0.3
-11.7%
97
4
0.1
▲
▲
-17.8%
39 0.1▲
▼
130
0.0
36
▲
▲
0.2
-12.7%
▼
65.2
-48
0.5
-2.2%
4.3
▼
4.6
206.1
234.9
1.8
213.4
▼
122.4
212.1
3.2
3.3
▼
-37
0.6
1.1
-
72.7
8.1
1.7
0.4 ▼
-
1.9
0.4
43.9
▼
3.6
-
https://www.thomsonone.com
0.8
0.4
▲
1.1
▲
3.0
▲
295.9
▲
4.6
1.1
20
1.5%
Societe Generale
20
16 4.823,173.0
18
-42.5%
15,132.7
17
7
23
13
23,323.3
13
15
3.3
9
Bank of America Merrill Lynch
Citi
8.4
2.9
0.2
0.9
4
Morgan Stanley
Gleacher & Co Inc
BNP Paribas SA
10
12
15
JP Morgan
6
▲
0.0
Sberbank
6
3
# of
114
Market
1.0 +4
▼
▲
-27
+1
-1
▲
1.9
3.0
+1
1
22
▲
▲
4
723,654.5
4.0
15
16
14
+2
-15.8%
-41.6%
1.7
Deals
▼
-2,440
4
▼
29
22,513.1 3.1
4.1
44,877.0
29,799.0
12
1516
3.3
23
18
60
24,002.7
19
17 22
17,520.0
56
17,152.1
1.6
1.8
40
12,974.0
41
1.8 1.6
Market
13
▲
▲
▼
13,297.1
87
Ondra Partners
▲
24
28.3
▼
Rank Value per Advisor (US$m)
2012
Rank Share Ch.
2
-8.5%
▲
22.9
▼
▲
Rank Value
0.4
Market
-7.0 ▼
10
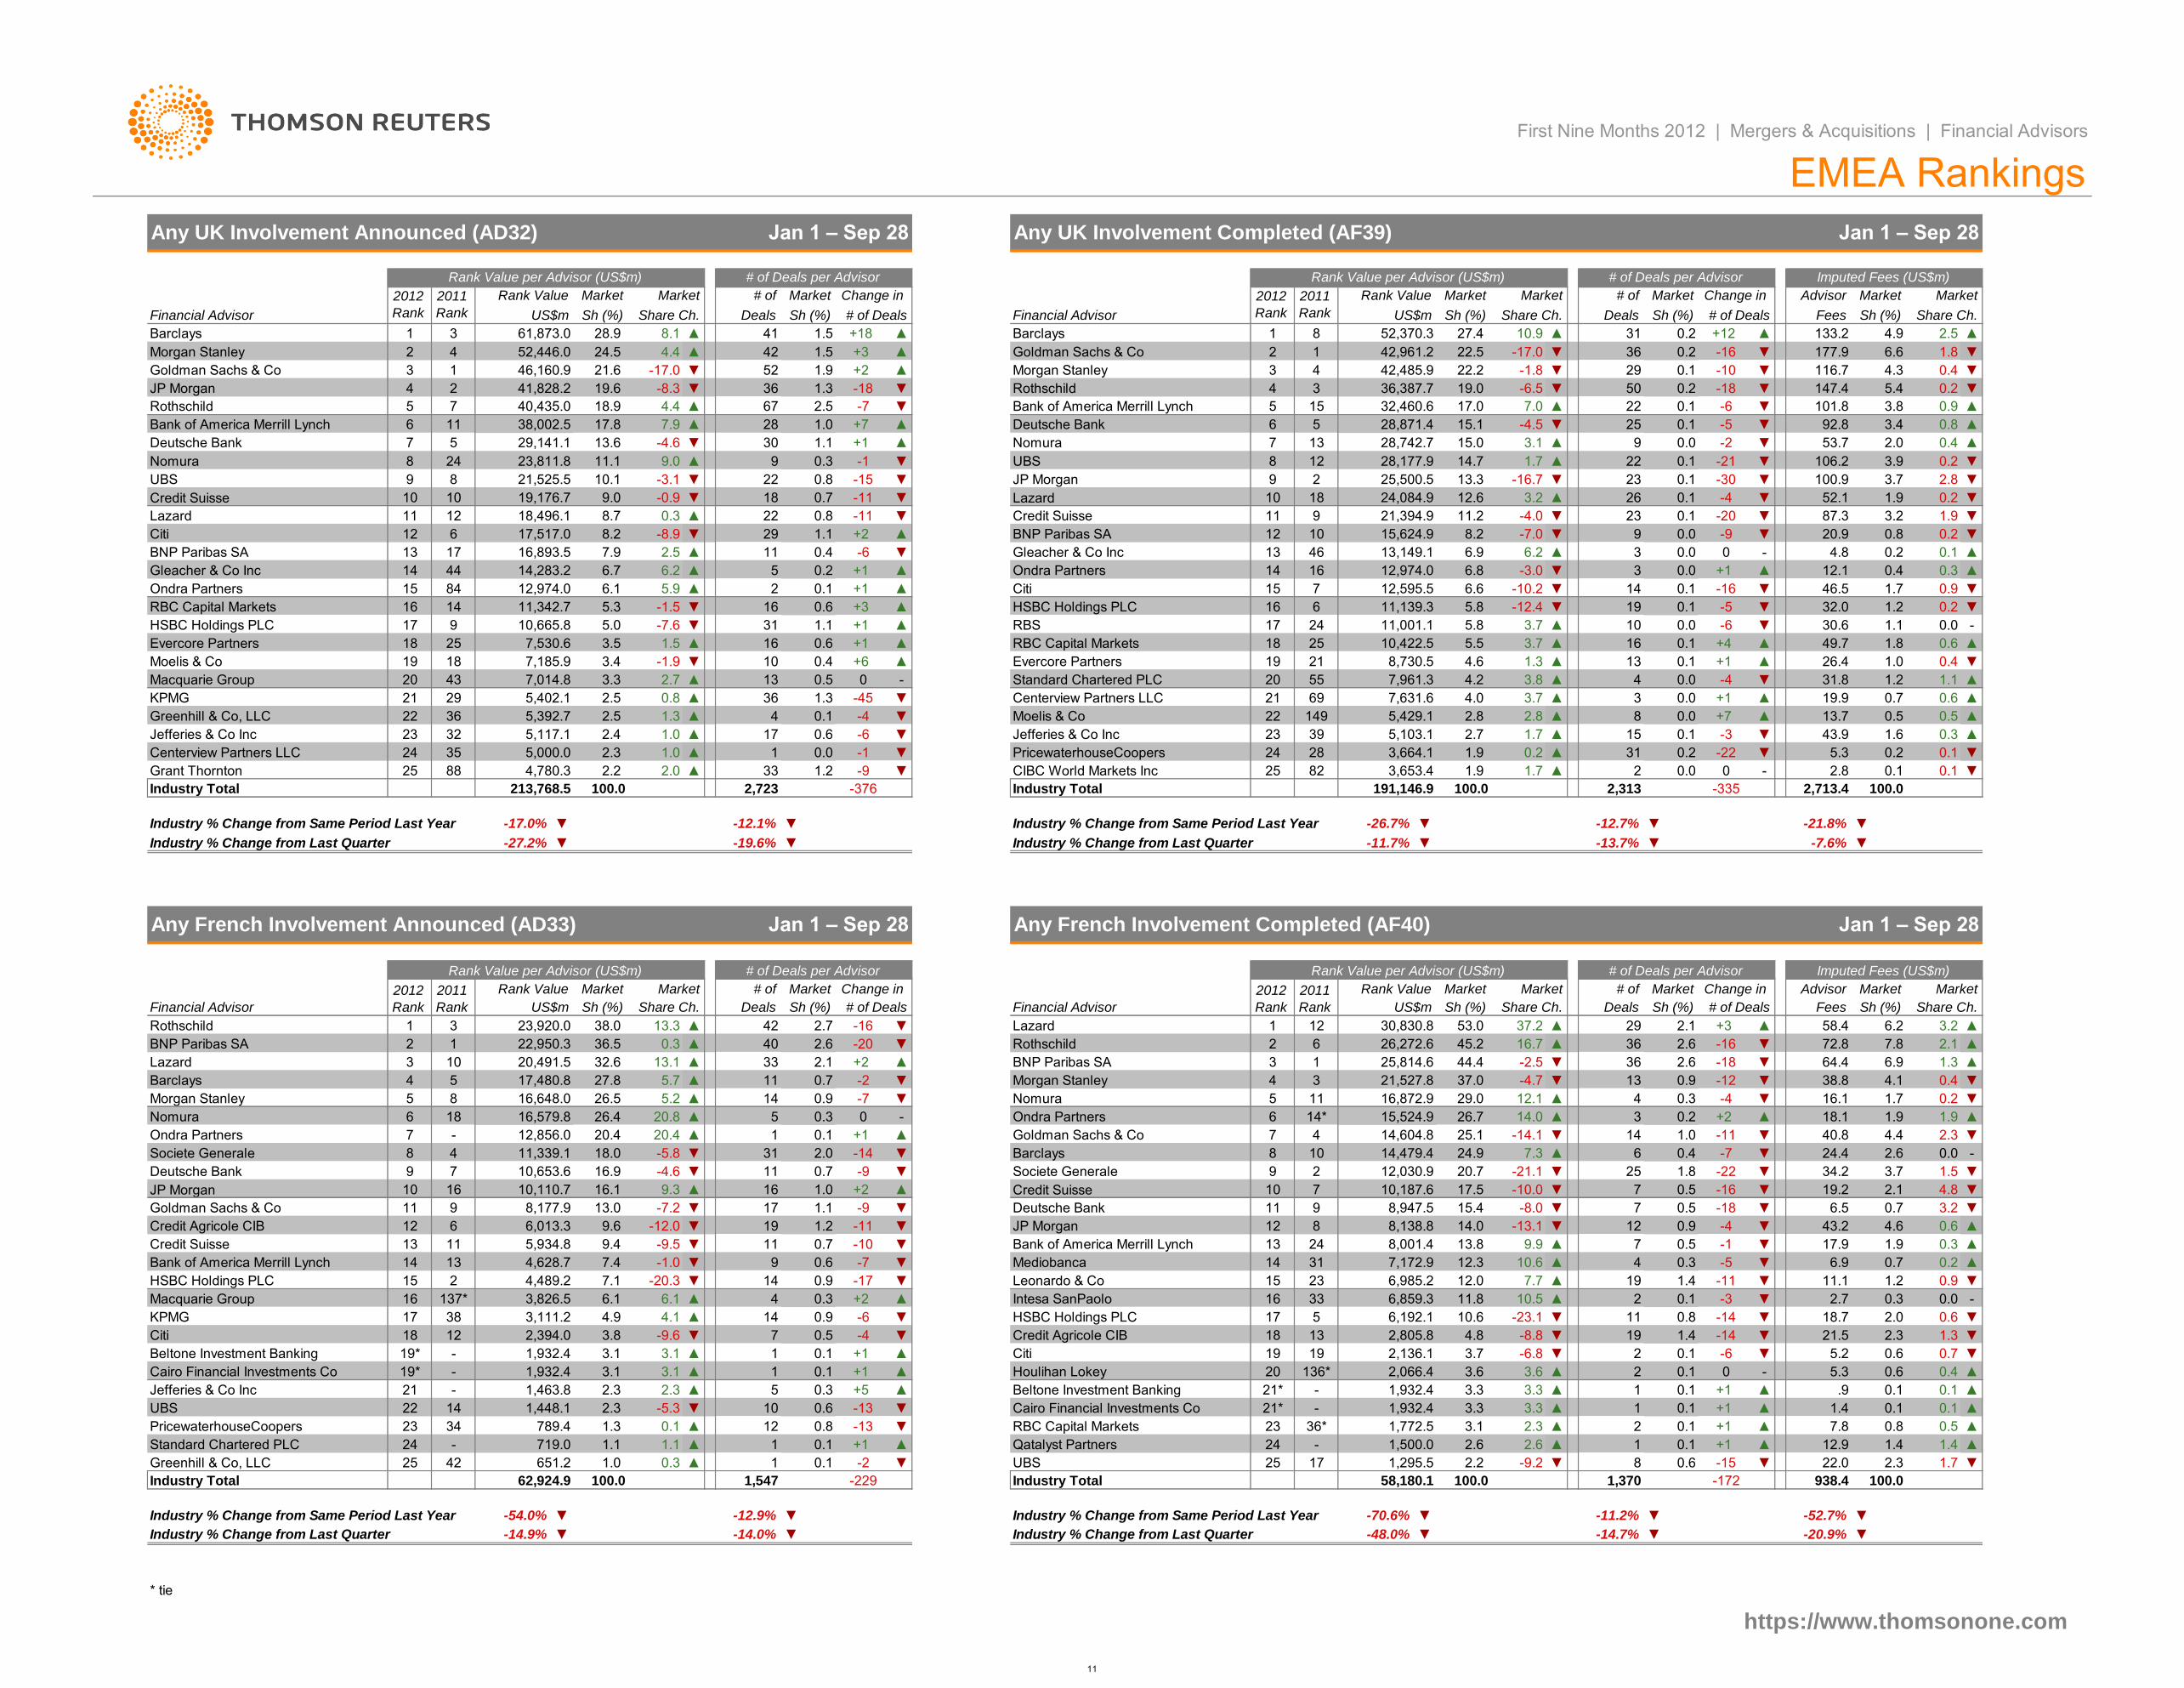
Credit Suisse Lazard
* tie
JP Morgan Credit Suisse
Lazard
Credit Agricole CIB
4.8
10.6
-
▼
21
1
-26.7%
10.5
31
6,985.2
6
11,001.1
25
11,139.3
Morgan Stanley 42,485.9
1
69
21
55
16
18
15
EMEA Rankings
Any UK Involvement Announced (AD32)
213,768.5 100.0
Centerview Partners LLC 24
25 88
35 5,000.0
1.0
# of Deals per Advisor
Centerview Partners LLC
18
39
Standard Chartered PLC
0.2-17.0
27.4
Rank Value per Advisor (US$m)
52,370.3
▲
US$m
▲
▼
10.9 ▲
▼
-10.26.6
5.8
2
-3.0
-12.4
▲
▲
-14.7%
▲
▼
19
▲
▲2,066.4
1,295.5
7
16Ondra Partners 14
+1
-6
20
17
19
▼
Citi
▲
5 ▲
0.6 ▲+1
▲+3
▲
1.1 +1
Barclays 27.8
-12.1%
21
2
29
0.2
1.1
▲
-9
2.3
2.7
11
+6
16
0.4
1
10 20,491.5
US$m
Rank Value
22,950.3
38.0
# of Deals
Rank Value per Advisor (US$m)
23,920.0
▲
4,780.3
3
2011
Rank
Market
2.2
0.3
0.2
2.8
1.9
0.4
▲
4.4
0.7
34.2
24.4
6.2
2.6
1.7
1.9
▼
▼
19.2
1.2
Imputed Fees (US$m)
▲
6.5
▲
16.1
▼
▼
▼
18.1
▼
▼
11.1▼
0.7
2.1
3.7
▼
43.2
6.9
▼
0.317.9
0.0
1.9
▼
▼ 0.2
2.7
0.9
1
▼
-6
0.1
00.1
+1
0.1 ▼
-14
-172
1
+1
▼
+1
0.1 ▲
0.1 +1
▲
24
15
16
▼-70.6%
-23.1
2,805.8
▼2.3 -13 ▼
▼
6,859.3
5
Credit Agricole CIB
6,192.1
Intesa SanPaolo 33
-14
1.4
-3
-5
1.4
0.8
0.1
-11
4
0.59.9 -1
7.7 ▲
▲
0.3
19
7
1.8
0.4
8,947.5
-13.114.0
▼
2512,030.9
7
15.4
10.6
-7
-18
-22
-16
0.5
0.9
0.5
7
-10.0
-412
-10
▼
14 ▲
-21.12
▼
7,172.9
▼
▼
-202.6
8,001.4
Deutsche Bank
-14
JP Morgan
9
14,479.4
8,138.88
▲
▲
▲
25,814.6▲
45.2
▲
21,527.8
5Nomura
24
Credit Suisse
31
3.2
▼
8
-1.8
▼
Sh (%)
▲
Advisor
0.2
Sh (%)
36
# of
Deals
Change in
# of Deals per Advisor
5.7
20.8
17,480.8
32.6
▼
Market
First Nine Months 2012 | Mergers & Acquisitions | Financial Advisors
▼
▼
-14.1
-8.0
7
5.2
0.3
2.0
29.0
20.7
▲
-229
-13
0.1
1,547
-54.0% Industry % Change from Same Period Last Year
100.0
* tie
▼
-14.0%
-11.2%
1.3
-
42 ▲
-14.9% ▼
0.3
62,924.9
651.2
100.0
719.0
1.0
13
Macquarie Group
-
13
18
15 2
16
Credit Suisse
3,826.5
7.4
1,932.4 3.1
4,489.2HSBC Holdings PLC
17 4.9
19*
▲
-6 HSBC Holdings PLC
Mediobanca▼
+2
▼
-7
Bank of America Merrill Lynch
-11
-12.7%
0.1
22
-18
0.0
50
-17.0%
-45
-10
-
▼
+1
Gleacher & Co Inc
2
Financial Advisor
Rothschild
2012
Rank
-27.2%Industry % Change from Last Quarter
1
0.1
0.1
▼
▼
# of Deals
▼
▲
3
BNP Paribas SA
▲
▼
▲
▼
Industry % Change from Same Period Last Year
Any French Involvement Announced (AD33)
▼
Market
BNP Paribas SA
▲2.5
Market
1.7
▲
▲
0.6
▼
-1.1
▼0.9
▼
0.0
1.0 0.4
▲
0.1
▲
0.5
0.61.8
▲
40.814 1.0 ▼
-40.3
0.2
-11
2.6
▲
16.7
-4.7
▲
▼
2.1
▼
13
+3
0.9
-18
-16
-9
▼
12.1
-12
+2
2.3
8,177.9 13.011
3.8
6.1
5,934.8
6,013.3
9
11 9.4
7.1
12
3,111.238
12
137*
-
789.4
4,628.7
2,394.0
Bank of America Merrill Lynch
23
21
14
14
Cairo Financial Investments Co
KPMG
Citi
34
3.1
3.1
-19*
3.11,932.4
PricewaterhouseCoopers
Jefferies & Co Inc
22 1,448.1
1.1
UBS
Industry % Change from Same Period Last Year
24
1,463.8
Greenhill & Co, LLC 25
Industry Total
▼
Standard Chartered PLC
Industry % Change from Last Quarter
2.6
1,370
1.722.0▼
▲ 12.9
938.4
-48.0%
36* 3.1
UBS
58,180.1
17
▼
▼
1,500.0
Industry Total
Industry % Change from Last Quarter
https://www.thomsonone.com
-52.7%
-20.9% ▼
0.5
1
-12.9%
7
0.6
0.8
8
Ondra Partners
16,648.0
26.4
5 26.5
6 16,579.818Nomura
10,110.71610
Deutsche Bank
16
▼
12,856.0 20.4
6
16.1
9.6
20.4
-5.8
▲
▼
16.9 ▼
Societe Generale
7
4 11,339.18
-
10,653.6
18.0
79 -4.6
Goldman Sachs & Co
-5.3
-20.3
2.3
-9.6
Beltone Investment Banking
0.1
-12.0
-7.2 ▼
▲
▲
▲
-9.5
-1.0
▼
Financial Advisor
12
4.1 ▲
-7
HSBC Holdings PLC
▲1.1
10
6.1
▼
1
14
▼
+1
Moelis & Co
RBS
Evercore Partners
RBC Capital Markets
1.0
0.1
0.7
1.1
1
1.3
13.1
9.3
2.7
Sh (%)
0.6
0.1
31
▲
2,723
Market
33
▲
0.4
0.6
0.7
9
-19.6%
5
11
0.6
0.9
▲
▼
0.3
17
11
19 1.2
4
▼
-4
+1
0.1 +1
0.1
+2
▼-17
▼
▲
0.9
1
5
▲1
14
0.3 +5
▲
21*
23
Qatalyst Partners
0.1
Change in
-7.6%
# of Deals
2.2
2 -
Share Ch.
Imputed Fees (US$m)
▼
-21.8%
Advisor
2
▼
0.1
Sh (%)
100.0
1.643.9
-22 ▼
0.3
1.1
-2
▼
0.2
2,713.4
-5
1.2
0.5
0.3
5.3 0.2
0.1
0.7
2.8 0.1
▲
▲
0.2
0.2
▼
▼
▼
▼
0.2
▲
▼
3.4
0.4
0.2 ▲0.1
▼
0.8
3.7
3.9
2.0 0.4
3.2
0.8
1.9
4.3
Fees
+12
1.86.6
Share Ch.
▼
133.2
Jan 1 – Sep 28
-16
Sh (%)
177.9
4.9
26
0.1 106.2
0.1 ▼
147.4
92.8
-2 ▼
0.1
-9
0 -
▼
▼
52.1
87.3
116.7
-6
5.4
▼
53.7
▼
-5
12.1
20.9
-20
-30
4.8
▲
9
23
25
0.1
46.5
▼
100.9
-21
-4
101.8
▼
▼
▼
▼
▼
32.0
30.6
▲
0.0 -6
0.1
49.7
13.7▲
+1
+7
19.9
-4
26.4▲
Fees
6.9
-335
Market
Jan 1 – Sep 28
▼
1.3
2.1
4.1
64.4
58.4 3.2
72.8 7.8
38.8
Market
# of Deals per Advisor
Any French Involvement Completed (AF40)
▲
▼
Share Ch.
30,830.8 37.2
▲
▼
-
0.2 ▼
1.9
2.3
▲
▼
0.4
▼
1.5 ▼
▼4.8
3.2
0.0
7.8
-
4.6
0.3
▲
1.2
▲0.6
▼
▲
2.0
21.5
18.7
100.0
0.6
2.3
5.3
.9
1.4
2.3
▲0.10.1
▲
5.2 ▼
▲0.1
0.50.8
0.6
0.7
1.3
0.1
▼
▼
▲
▲
▼
▼
▲
1.4
0.6 0.4
1.4
6
▲
1,772.5
4
17.5
14.0 3
2.6
26.7
12.3
13.8
25.1
24.9
11.8
3.6
3.3
▲
▼
12.0
-8.8
▼
Market
29
-9.2
3.3
3.3
7.3
-6.8
▼
2
11
36
▲ 2.62 6 26,272.6
44.43
▲
8,730.5 ▲
5.8
1.7 ▲
▼
6.913,149.1
5.5
46
9
6.213
21,394.9
1
11
-7.015,624.9
22.5
4
Rank Value
22.2
2012
Rank
3
Sh (%)
0.2
29
15.1
4
15
36,387.7
42,961.2
Any UK Involvement Completed (AF39)
+3 Goldman Sachs & Co 2
Barclays
Rothschild
RBC Capital Markets
▲
Jan 1 – Sep 28
24.5 4.4
8.1 ▲
Rank Value per Advisor (US$m)
Sh (%)
Market
Sh (%)
Market
Deals
Change in
+2
-18
22
0.7
17
0.5
-4
0
1.3
0.1
▼
0.0
▼
Change in
▼
▼
▼-1
1.2
# of Deals per Advisor
42
40
# of
▼-16
Market
-376
Rothschild
+2
-9
Goldman Sachs & Co+1
0
▲ BNP Paribas SA
17
12
13 24
Lazard
21*
25
18 13
Ondra Partners
Morgan Stanley
10
Leonardo & Co
Cairo Financial Investments Co
136*
23
Houlihan Lokey
Citi
4
11
19 19
9
7
▼
▼
13.3
0.9
2.1
▲
Morgan Stanley
1
▼
▼
11
-2
Sh (%) Deals
14
Macquarie Group
5,402.1
4
Barclays
2.5
23
5 11
2012
Rank
3622
29KPMG
32
Greenhill & Co, LLC
Industry Total
Grant Thornton
Jefferies & Co Inc
12 6
17
17 9
BNP Paribas SA
Gleacher & Co Inc 14
13
HSBC Holdings PLC
17,517.0
14
84 ▲
-8.9
6.1
▼
2.5 ▲
5.3
25 7,530.6
31
6.7 6.214,283.244 ▲
▼
11,342.7 -1.5
12,974.0
16,893.5
5.9Ondra Partners 15
Evercore Partners 18
7,014.8
16
18 ▼-1.919
4320
10,665.8
Moelis & Co
3.5 ▲1.5
1.0
2.4
-7.65.0
3.4
3.3
7,185.9
▲
▲
10
13
1
5,117.1
5,392.7
0.82.5 ▲
4
33
▲
36
Share Ch.
Jan 1 – Sep 28
2.0 ▲
-6 ▼
36.5
Market Market2011
Rank
# of
# of Deals Financial Advisor Share Ch.Share Ch.
Citi
3
Lazard
Financial Advisor
Market
28.9
US$m
61,873.0
Rank Value2011
Rank
Barclays 1 3
Morgan Stanley 2 4
2012
Rank
11
11.1
RBC Capital Markets 16
12
23,811.8Nomura
7.9
10 19,176.7
5 40,435.0
41,828.2
52,446.0
5
11
29,141.1
46,160.9
10
-17.0
1.5
42
2.5
▼
52
36
1.9
▲
▼
1.5
+1841
Rothschild
JP Morgan 4 2 19.6
Goldman Sachs & Co 1 21.6
7 0.917.0 0.1 3.8▼22▲
19.0
▼
7.0
▼-6.5
Deutsche Bank 6
Bank of America Merrill Lynch
-4.528,871.4
32,460.6
-8.3 1.3
67
3
120.3
-7
5
13
7.9
18.9 4.4
▲+7
▲ 5
▲
▼
17.8 28Bank of America Merrill Lynch 6
Deutsche Bank 7
-3.1
Nomura
8 24
1.038,002.5
-4.6
22
7 28,742.7▼
9.0
30 15.0
8
1.1 ▲
25,500.5
-1
+1
UBS 9
▲ 9
13.6 3.1
-16.78 21,525.5
14.7
▼ 13.3
▼ 12.624,084.9
1.7
9
▼ UBS
JP Morgan
18,496.1
28,177.9
▼ 2-15
0.8
9.0 10-11▼
8.2
10.1
0.718
▲
0.8
▼
8.7 0.3
-0.9
▼ 23 0.1
▼+2
-11
▲ 10
0.0
12
-4.0
8.2
3.7
3
9 0.0
11.2
14
10,422.5
+1
19
10
▼
3 0.06.8
12,595.5
12,974.0
4.6
-16
+416
▲
7,631.6
3.7 ▲
7,961.3
4.0
1.3
4.2
▲ 0.0 ▲
31.8
+1
3.8
13
▲ 0.04
3
▲
▲
3.7
0.2
2.8
15
31
2.8
▼
22 149 8 0.0
0.11.7 -3
Industry Total 2,313
1.9
3,653.4 1.9
100.0
0.2
▲23
CIBC World Markets Inc 82
Jefferies & Co Inc
3,664.1
2.7
0.0
5,429.1
5,103.1
PricewaterhouseCoopers 28
Industry % Change from Last Quarter
24
191,146.9
25
Deals
▼
▼
# ofRank Value
-11.7%
US$m
-13.7%
Market
4
53.012
2011
Rank
Market
Sh (%)
37.0
10 10,187.6
▼
▼
16,872.9
36
-2.5
Industry % Change from Same Period Last Year
Rank Value per Advisor (US$m)
3
Beltone Investment Banking 3.3
15,524.9
▲
14*
8
6
Societe Generale
14,604.8
-
1,932.4
3.7
20
-
2.3 2
- 1,932.4
3.6
2,136.1
▲
0.1
0.6 -15
1
8
▲
▲
▼
▼0 -
11

Bank of America Merrill Lynch BNP Paribas SA
Perella Weinberg Partners LP Lincoln International
Industry % Change from Same Period Last Year
▼
* tie
-5 0.2
Lazard
2,554.0
# of Deals per Advisor
2
1,499
1.218
▼
6
▲
Deals
1.5
+7
-4
# of Deals
1.1
5
18,095.6
13
4
7
Deutsche Bank
16,979.1
3
6
1
Goldman Sachs & Co
2011
Rank
1Morgan Stanley 24,853.6
Industry % Change from Last Quarter -43.3%
1
12.4
1.0
0.8
13
Any German Involvement Completed (AF42)
# of
2331.2
+4
5
1.1
0.8
617
14
-19.5%
1.9
10
▼
-4
▲
Change in
# of Deals per Advisor
10
1.1
▼
+1 ▲
-1
-7
0.2
+3
-10
-5
# of Deals
-149
6,783.0
EMEA Rankings
0.8
0.6
0.5 -4
2.926.3
1
-30
0.3
▼
6
2
4
▼ 6
8.5
3
4,069.7
3,534.5
▼
▼
18.9+9
9.4
▼
▲
2.6
4.6
0.8
0.2
1.4
1.2
1.411.0
▼1.8
▲
▲
1.5
.8
13.2
4.4
2.5
1.3
▼
▲0.8
▼0.4
1.4
5.6
▼
▼0.5
▲
0.8
0.4
4.2
▼
0.6
0.6
7.5
3.8
8.6
▼
▲1.8
0.8
0.3 ▲
▼34.0
3.3
▲
Sh (%)
25.1 ▼
▲
50.7
▲
▼
Jan 1 – Sep 28
MarketAdvisor
-61.4%
312.2 100.0
2.8 2.7
1.656.1
0.7
8.0
2.4
1.81.9
6.2
0.80.8
2.2
Share Ch.
▲
Market
Imputed Fees (US$m)
0.8 ▲
Fees
▲
▲
-21.1%
▼
▲
▼
▼
0.2
5.8
10.5
4
1,824.0
6,147.0
4,968.1
Market
Sh (%)
0.6
▼
3
2.1
5.9 -5.1
7,888.5
22.6
Any Spanish Inv Announced (AD34)
2012
Rank
2011
Rank
▲
Goldman Sachs & Co
6.1
38
7,820.5
-13.1
26.0
-4
4
2,614.9 ▼
2,524.7
2,342.7
4.87 2,434.6
13
4.9
18 15 2.81,427.6 -7
-7▼
1.4
22.9 5.9
1,264.2
3.6
1.9
0.5
▲ 15
12
14
+8
-
+2
-1
4.3 14.31,301.5 ▲
▲
▼
▼
▼
Barclays
▼
UBS
RBS
▼
▼
11 917.5
4.2
▼
8
22
36
34
1,776.0
▲
0.3
0.32
0.4
▲
0.2
▼6
1
1.3
▼
▼8
-17
1
16
1,824.0
Ernst & Young LLP 14
Banco BTG Pactual SA 15
1,773.2
1,933.2
-
Credit Suisse 17
BNP Paribas SA
10
11
12
RBS
13Rothschild
Morgan Stanley
25
6
14
9
8
JP Morgan
Societe Generale
UBS
Deutsche Bank
16
5
7
Fees
Market
Sh (%)
4
8
5,214.9 10.2
4,435.7
Share Ch.
Rank Value per Advisor (US$m)
First Nine Months 2012 | Mergers & Acquisitions | Financial Advisors
Market
Financial Advisor Deals
Market
Sh (%)
Change in
US$m Share Ch.
2011
Rank
# of Deals per Advisor
# of Deals
Rank Value
1
6
1
11
Goldman Sachs & Co
Barclays
2 5
Financial Advisor
2,730.4
2,895.6
2
3
3,791.3 7.4
Santander
28,989.9
11.35,787.5
23,794.1
-4.0
18.8
Credit Agricole CIB
Jan 1 – Sep 28
# of
▼ 0.8
Deals
-3Citi
4,122.8
3.8
0.3
4
3
14
▼8.1 0.7
-32
-5
0.3
4
▼
0.86
-4
2
1
10
0.1
2
1 KPMG
▲
▼
▼
16,606.8
9
▼
+1
0.1
0.1
1.9
19
2
US$m
5
9.6
6,424.2Barclays
JP Morgan 8
10.3
14.7
13,783.9
810
10
7
7
+2
+70.7
-100.5
0.5
▼
2
6 12
8.2
8.1
0.1
▼ 1.0 -3
▼
Societe Generale
▲
7.4▼
11
0.8 -4
▲
15
▲
▲
0.6
0.12
5.7
5.2
9 -1
6.7
▲4.34.3 0
4.94.9
3.1 -24▼-1.6
17
0.3
-3
▼
11.3
67
59
4.3
-15.5
-10.3
▲ 99.4
7
100.0
167.0% ▲
▼-1
1.7 ▼
-6.0%
-362
▼
-24.9%
▲
+1 ▲
100.0
0.11.0
1,195
▼
0.1
60.7%
0.2
0.10
0.43.1
-
3.2
0.3
▼-1
1.0 ▲
▲1.3
0.6 ▲
▲
0.1 ▲
▼
▲0.4
1.3
0.1
▼2.5
0.4
▲2.7
▲
0.8
▲
4.5
0.1
▼
▼ 0.433
101.0
1.6
1,384.4 1.7
▼
Morgan Stanley
▲
-2
▼
Macquarie Group
-6
▼
▲
0
▼
Ernst & Young LLP
0.4
-1
+7
▲
▼
UBS
-4
0.1
360 Corporate
Mediobanca
21
22*
13
17
Banco BTG Pactual SA
HSBC Holdings PLC
Leigh Fisher Associates 18
Societe Generale
▼
10
10
.6▼
▼
Bank of America Merrill Lynch
Santander 2,686.7-10
50.7
4
0.8
0.5
▼
▼
-2
-2
Market
6
-87 1.0
0.3
1
2
14
Change in
Jan 1 – Sep 28
▼
Sh (%)
# of Deals per AdvisorRank Value per Advisor (US$m)
Any Spanish Involvement Completed (AF41)
Imputed Fees (US$m)
6.1
Share Ch.US$m
▲+1 4
Market
# of Deals
5
-14.9
▼
▲
▲27.0
-5.5
56.6
8.7
46.5
88
▲
▼
1
Leonardo & Co 21
25
Industry % Change from Same Period Last Year
UniCredit
1,339.1
▲
-Gleacher & Co Inc
83,256.1
181824
Industry Total
23
19
4.9
1.91,594.4
2,253.3
1,885.81,885.8 2.352Greenhill & Co, LLC
4
1,922.5 2.3
13
22
BNP Paribas SA
23UniCredit
-8.0
0.2
5 -1
6
0.2
3
23*
▼
-379-379
1
+2
-3
-5
▲
-2.7 ▼
-23.2%
▲2.2
32
84* 2
62,239.2
1,339.1
3
1▲
1,258.7
2,263.8
▼
0.6
▼
0
3
1
Jefferies & Co Inc 17
19
20Nomura
HSBC Holdings PLC
4
-
55
82*
11Ernst & Young LLP 16
15
TAP Advisors LLC 18
Bank of America Merrill Lynch -10.38
Nordea
RBC Capital Markets
Barclays
14 66
13
12
-6.6
9Lazard 11
6.4
7,259.0 -8.0
5,298.3
8.7
▼4,702.0 -18.0 ▼
1.07
0
▼ 3.2Bank of America Merrill Lynch
0.1
0.2
▼
▼
0.0
0.3
▼
Market
-67.0%
30,075.3
Rank Value
▼
Market
-12.9% ▼
Market
23
Jan 1 – Sep 28
Share Ch.
▼
▼
Sh (%)
▲
▲
36.0
Financial Advisor
Rothschild
▼
32.2
Sh (%)
10
16
1.7
▼
10.0 26
0.7-1.4
▲
8Macquarie Group
Rothschild 3 6
Goldman Sachs & Co 4 3
5
Credit Suisse
Citi 6
11.3
22,553.7
JP Morgan 5
UBS 7
9 -15.5
12,703.3
15 11,038.5
7
13.3
-1.615.3
7.6
10
11.3
2 12
9,373.182* ▲
-
8,178.8 9.8
7,861.7 5,094.29.4
▼
13
Credit Suisse
10
9.4
-18.0 0.5
▲ 0.3
▲ 0.1
▼
2011
Rank
Citi
Deutsche Bank
2012
Rank
Market
0.1
-5
+1
2012
Rank
Rank Value per Advisor (US$m)
▲
▼
▲1.0
0.6
▲
Change in
-209
2 -30.3
# of Market
▼
-14.2%
Industry Total 100.051,228.7
-22.3%
730
Lazard 23 1.3
Banco Espirito Santo SA 25
9
24
296.033
▼
▼1.2
1.0
-13.4
9
-8
Ambers & Co
-14
2Rothschild
PricewaterhouseCoopers
▼
▼
-2
1.1
-5
8
JP Morgan
Lazard
-2
3
49 5,009.2
4,573.1
5,965.6
20
23*
1,045.6
-
21
1.6
https://www.thomsonone.com
0.5
23* 4,194.3
4
27
36
1 29,941.5
16,481.5 19.8
22.5
Any German Inv Announced (AD35)
Morgan Stanley 26,824.3
23,143.6
3.1
8.5
27.8
27.1
10
Financial Advisor
Industry % Change from Same Period Last Year
1.6
2
-76.3%
Rank Value
US$m
1
▼
18
669.2
1,264.2
Industry % Change from Last Quarter
Leigh Fisher Associates 2.5
-27.2% ▼
500.061*
-4.4
1,301.5
-0.2
19PricewaterhouseCoopers 22
Jefferies & Co Inc
BBVA
828.6
1,484.3
-12.0
-0.3
3.6
3.5
-9.3
▼
4.6
2.0
-7.4
-15.5
▲
5.1
▼
▼
2.9
3.3
-7.8
▼
▼
8
11.5
Market
Sh (%)
Advisor
▼
0.9
-0.6 0.0
0.4
2.4
▼
3.0
3.7
5.5
▲0.7
▼
2.1
3.9
16
Rank Value
57*
Industry % Change from Same Period Last Year
3,399.6
Industry Total
15
BBVA
6,306.5
1,978.6
2.2
3.1
3.0
0.925
22* 906.8
-13.0
2,041.9
1,933.2
17
11
-
35
7▲
1,763.4
282.2
-5.5
3.1
2,524.7
3,495.3
2
26.7
1
5
9
22.2
-17.1
▲
0.9
3.0 ▲
▼
7.9
4.1
▲
100.0
▲
27.3 8.2
29.1 ▼
▲
7.0
▼
Share Ch.
10.3 ▲
Deals
39.9
-1.0
▼
Sh (%)
1
▲
19,431.8
-4.1
4,327.2
6.8
▲
▼
9,168.8
-5.7
▼
6.5
9
4,045.0 -20.8
4,069.7
3,672.1
6.5
6.5
▲
0.1
0.1
0.3
12.2
5.9
4.1 4.0
5.8
1.7
+1
1
▲
-5
2
4
0.8
▲
6
17.1
-1
4
0.3
▲ 1.6
1.2 -714
0.2
-10 ▼
15.8
1.5
0.4
0
4.540.8
1.8▲
3.4
13.1
0.2
.3
29.0
899.0
▼
+1
▼
▼
▼
▲
-
1.0
3.5 0.4
1.9
-
▼
0.2
-
+1
0.3 0
0.4
▲
1.2
▼
-1
1.0
-0
7.7
2.6
0.3
-
▼
▲
0.2
▼
1.3
▼
▲
▼
0.3
5
16.5
▼
-12.8
7
9
13
16
-5.0
5
-4.7
2
5.7
5.3
▼
6
15-
14
Perella Weinberg Partners LP
9
▼
▼ -2
-
▲
RBC Capital Markets
RoelfsPartner
22
Industry % Change from Last Quarter
Industry Total
69
1.2Intesa SanPaolo
Gleacher & Co Inc
16
17
39
0.2
25
Deutsche Bank
Market2012
Rank
22.2
3
15.9
-15
# of
26.2 -5.4 ▼ -14
3
13
-7
▼ 7
23
Citi 6
▼
▲
0.8
-2.7
20.4
6.5▲
2.014▲ 2.3
5
0.64
▼ -57
8.9 1.0
▼
6.6
-5.7
▼
11.6
9.1
11.3
4
-3
-6 ▼
5.4
3.23.4
0.5
8.4
-0.8
▼
0.3
-9.6
-12.8
6.5
2.9
▼
▼
▲0.2
▼
4.7
2.0
13.3
8.9
1.0 18.7
▼
▼
▲
2.1
12.0
3.5
0.6 -4
+1
-1
4.3
-4
4.4
-19
▼
13.8
▲
0.4
▼
0.4
0.1
6.0
7.8
3.6 ▲
▲
1.7
2.5
▲5.9 21,773.2
6.2
5.5 ▲
4
6.4
6.1
19 -
-6
1.1
6.8
-31.9
21.0
0.6
▼
20 924.66HSBC Holdings PLC 20 -19.5
2.5
2.5
1
▲
30
Mediobanca 21 942.8 1.828
-4.7
0.4
14
0.3
24 57*- GBS Finanzas SA 1.0313.5
3.0906.8-
1
29.5
▲
▼
▼
Sh (%)
72.3▼
15.9
Rank Value per Advisor (US$m)
▼
-15.9
▲
▼
0 2▲
▲
-13.1
10 0
-18
-4
-2
7
Market
-8
0.8
3 0
+4
▼
16
9 -4
▼
-4
0.6
0.8
0.1
67.6
12.0
-1
1.2
1.3
0.6
0.1
0.3
▲
7.6
5.8 0.55.5▲0.1 18
2,601.1 5
2,554.0 3.1
2.92,400.0
PricewaterhouseCoopers
▼
0.3
2.7
2.7
▲
19
+1
2.0
3,583.6
Jefferies & Co Inc
▼
BNP Paribas SA
1
Moelis & Co 84*
1,029.0
1.7
▲
1.6
▲
1.7
1.7
Blackstone Group LP▼
1,029.0
-25▲
18.1%
-6.4%
995.7Aon Benfield
-20.2%
Industry % Change from Last Quarter
▼ -13.2%
-9.4% ▼
▼▼
-
12
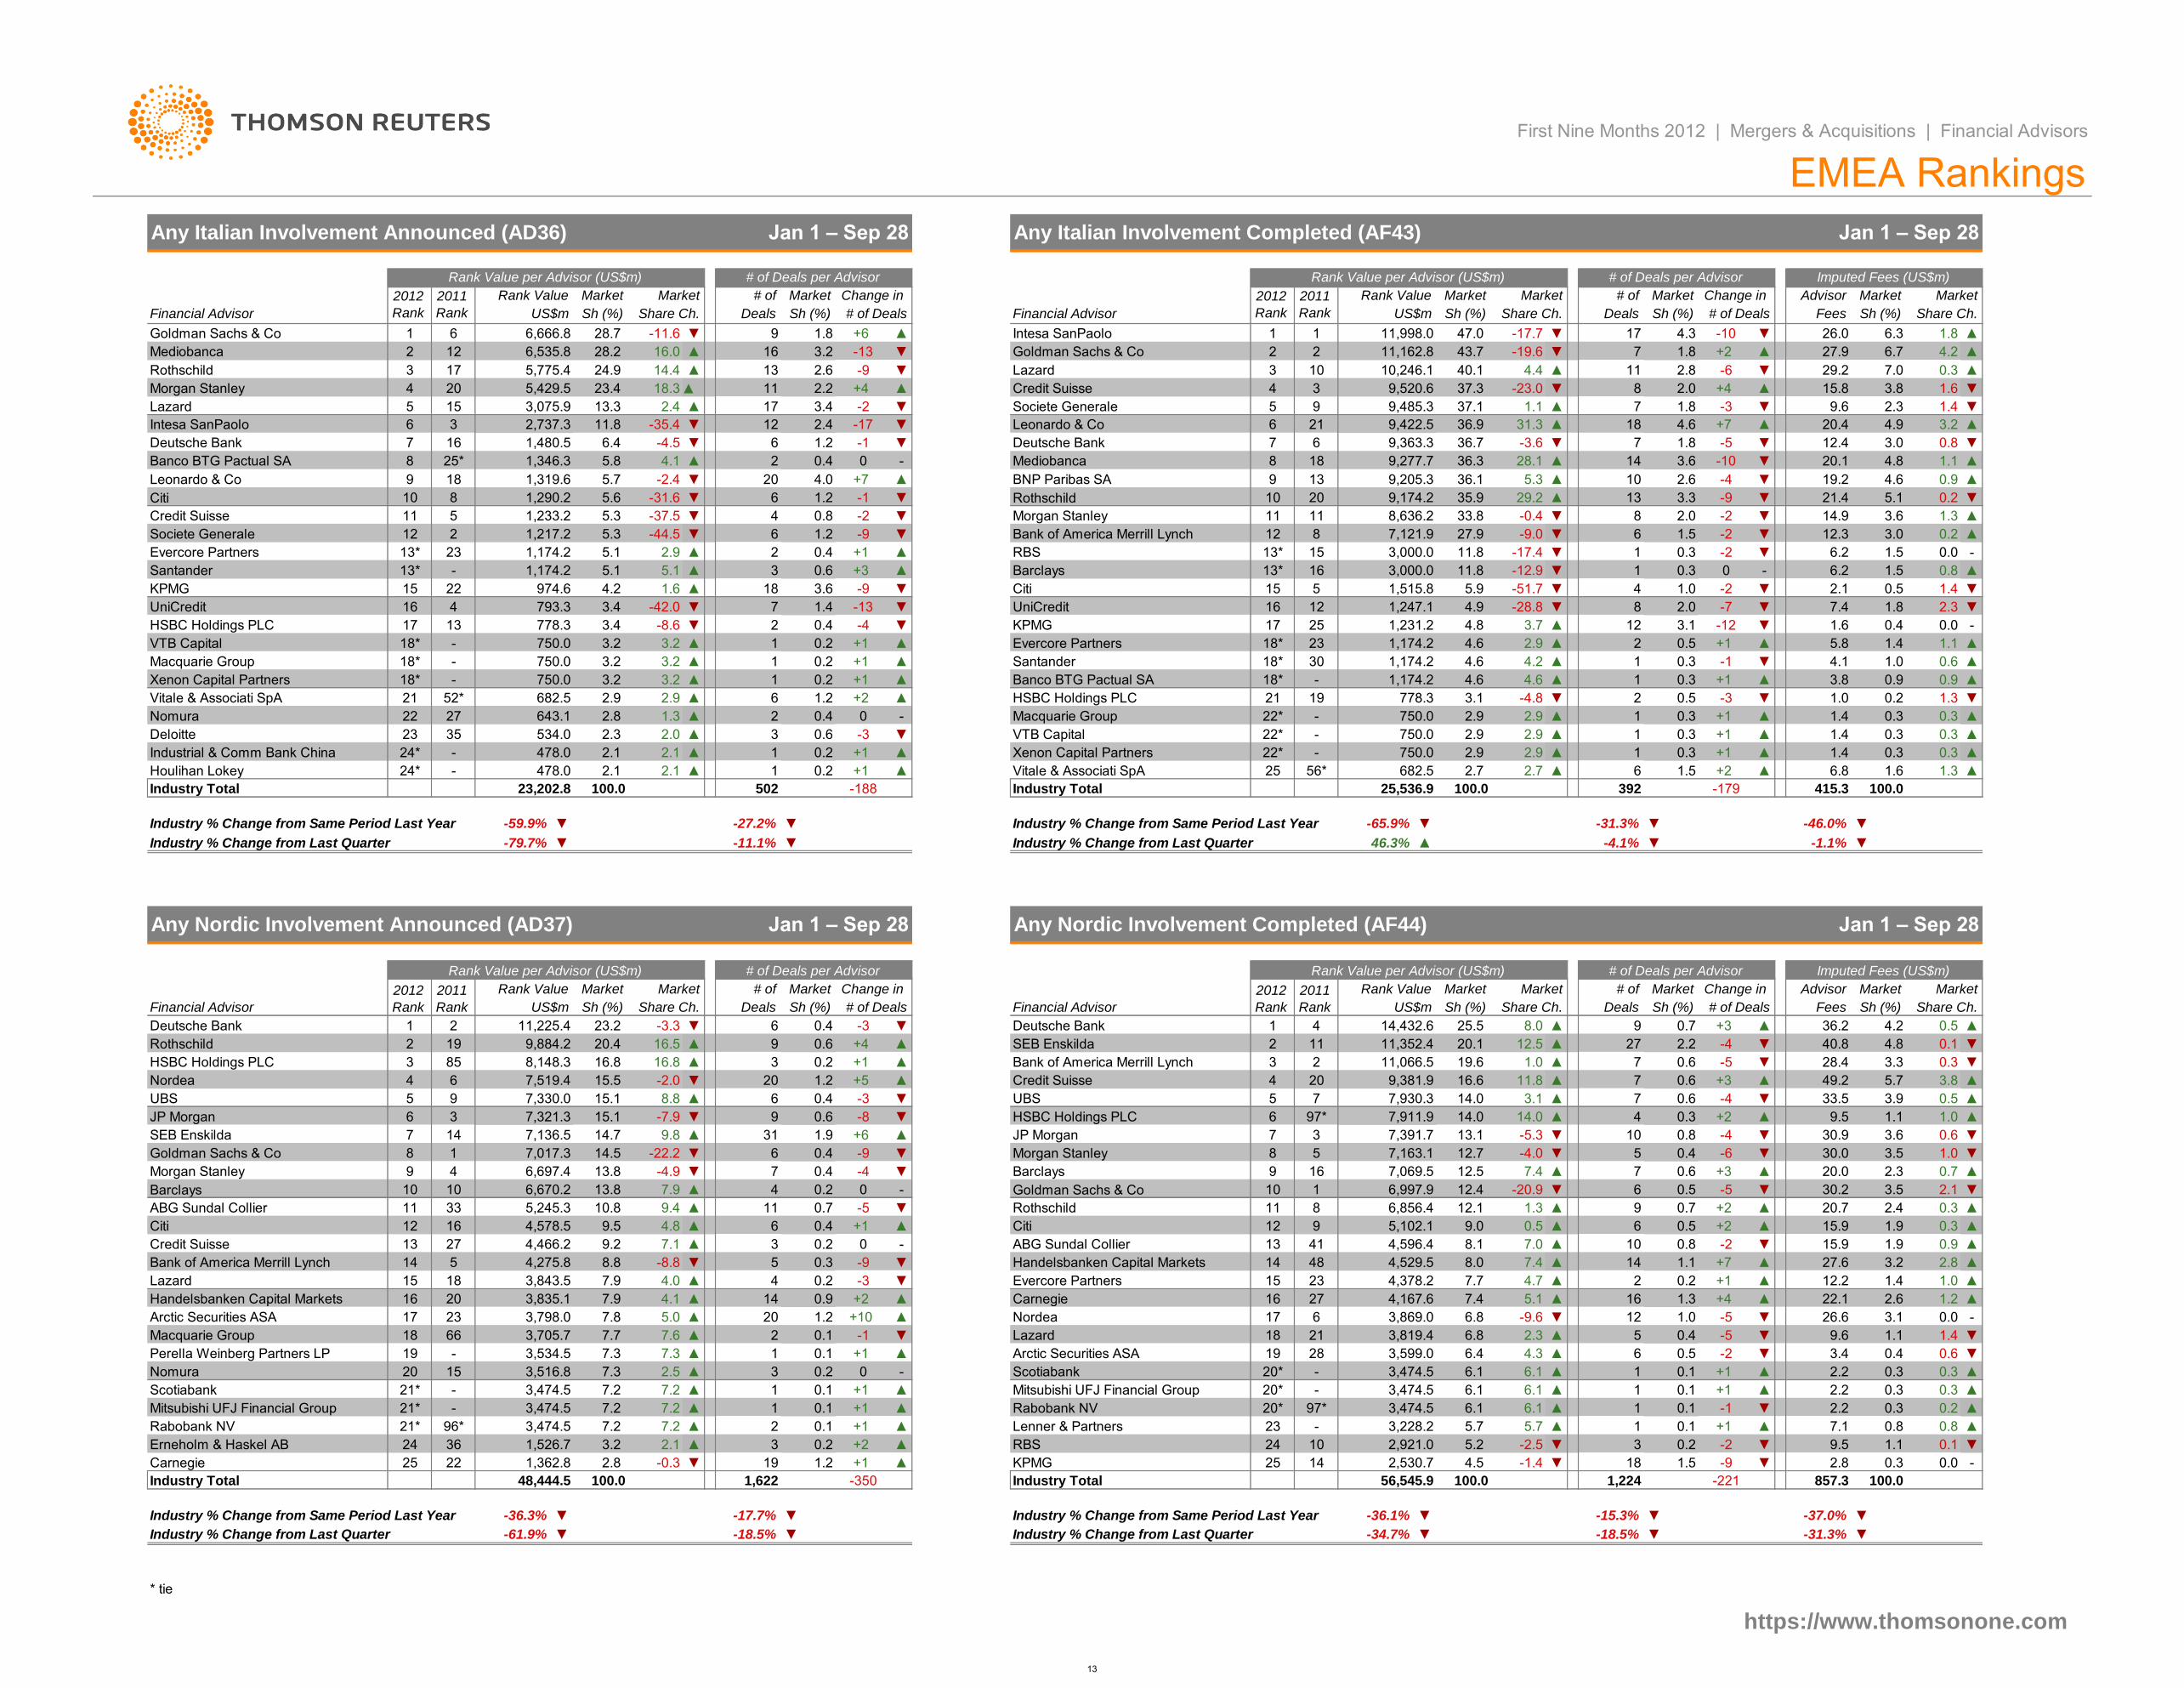
▲
Citi Rothschild
Barclays Goldman Sachs & Co
Rabobank NV 3,474.5
0.4
+4
18
Nordea 3,869.0
4,529.5
6.8
7.4
Evercore Partners 15
16
+7
0.8
2
12.5
7.4
12.4
+1
-5
Sh (%)
▲
+2
-5
-4
1.0
+2
Lazard
16 1.3
+2
0.2
14
+3
3,819.4
1.3
0.5
▲14.0
8.0
+3
-60.4
0.6
1.1
▲ 2.3
-5.3
▲
▼
▼
▼
4
0.5
-4
0.3
0.6
6
7
7
▲
0.8
Barclays
ABG Sundal Collier 13
8
6
-20.9
9
1.1
10
▲
▼
11
SEB Enskilda
Industry Total
-36.1%▼
-18.5%
-37.0%-36.3%
▼
▼ -17.7% -15.3%
Industry % Change from Last Quarter
▼
-18.5%
▼
▼Industry % Change from Last Quarter ▼
https://www.thomsonone.com
▼ -31.3%
56,545.9 100.0857.3-2211,224
▼
▼
2,530.7 18-1.4
▼3
-9▼ ▼ 2.8
Lenner & Partners+1
0.3
-2
0.8
1.1
0.1 +1
▲
▲
+2
1.5
7.1
9.5
▲
▲ KPMG
▼RBS ▼
▲- 3,228.2
25
-2.524
14 4.5
20*
10
23 1
5.2
▼
5.7
2,921.0 0.2
▲
3,474.5+1
0.1 -1
7.2 -
7.2
▲ Mitsubishi UFJ Financial Group
0.1
28Arctic Securities ASA
0.1
+1 6.1▲ 20*
▲
97*▲
0.43.4
2.2
0.16.1 0.32.2
▲4.3
6.1
0.11
0.5
+1
5
▲
▼
+10.2
3,599.0 6.4▲
20*
▲
▲
0.1 6
0
▲+10
- 6.1Scotiabank 3,474.5
6.8
-
+1 19
▲
-0.0▼126 3.1▼
▲
▲
27.6
1
0.1 -1 ▼
-2
-5 ▼
▲
12.2
▲
▲2.6
1.4 ▲
3.28.0
7.4
3,843.5
5
3,835.1
Handelsbanken Capital Markets
Carnegie
7.9
▲
▼
4
27 4,167.6
23 ▲
8.8 14 ▲48
7.74.0 4,378.2
▼
-3
5.1
Citi
7.08.14,596.4
5,102.1
41
12 9.0
4.7
▼-2
9 0.5 ▲
0.7
10▲
▲
▲ 27
3.1
0.67
▲
5▼
11.8
▲
12.7 -4.0
3
10
7,163.1
▼
7,069.5
13.1
12.5
▲
1.0
2.2
+6 JP Morgan▲
97*
16.6
Bank of America Merrill Lynch
-8
-4
-5
▲
7 0.6
▼
0.7
+5
Market
▲
Share Ch. FeesDeals
AdvisorChange in
9 +3
Sh (%)
-1036.3
9,422.5
11
+4
-2 ▼
-13
17 Societe Generale
Credit Suisse
Goldman Sachs & Co
3.4
▲
3.2
Advisor
Fees
11
-9
0.2
0.2
-
6
▼
Rothschild
1
96,856.4 12.1
1,174.2
1,217.2
Lazard 3
2.08
11,998.0
# of
1
3 9,520.6
2 11,162.8
4
Deals
737.1 ▲
10,246.1
▼
▼
1.1
37.3 -23.0
Any Italian Involvement Completed (AF43)
▲
1.8
8▼
6
▲
27.9
▲
36.1
1428.1
18
2.0
7
11.8 ▼
13
1
▼
-0.4
-17.4
2.6
▼-21.5
-9
▼
▼3.3
-4 ▼
1.8
4.6
3.6
MarketMarket
First Nine Months 2012 | Mergers & Acquisitions | Financial Advisors
# of Deals per Advisor
EMEA Rankings
MarketMarket
# of Deals per Advisor
▼-17
2
2.4
6
0
12
▼
▼
▲
▼1.2 -1
4.1 ▲ Mediobanca
▼
-0.4
4
20
11
9
▼0.8
1.26
Morgan Stanley
4.0
▼
▼
-9
▲
▲
▼
-2
-42.0
+7-2.4
-31.6
2.9
3
6
0.2
▼
-3
1.4
+1
+2
0.2▲
3.4
3.2
3.2
-8.6
3.2
0.6
1
35
2.1
▲2.1
2.3
478.0 2.1
478.0
-Industrial & Comm Bank China
Deloitte
24*
▲3.2
2.9
▲
▲
Nomura
Houlihan Lokey
Industry % Change from Last Quarter
Industry % Change from Same Period Last Year
Industry Total
-79.7%
23,202.8
11,225.4
Sh (%)
23.2
Financial Advisor
9,884.2
2.1
Rank Value
▼
-59.9%
0.21
0.2
▼ 2
3.2 ▲ 1
0.4
1.6
0.4
▲
-4
3.6
-13
-9
7
+11
0.6
+1
-1
3.4
▼
2
+33
1.2
▲
6
8
▲
Bank of America Merrill Lynch
4.916
3,000.0
Citi▲ 18
20
RBS
Barclays
9,205.3
33.8
29.235.99,174.2
43.7
Sh (%) Share Ch.
47.0
Market
-17.7
# of Deals
▲
-19.6 27.9 ▲+2
Sh (%)
4.3
7
▼
▲
-10
▼2.8
▼
1.8
17
-6
20.4
15.8
6.326.0
▲
1.8
0.3
6.7
29.2
▲
1.4
4.2
Sh (%) Share Ch.
3.2
▲
▼
4.9
7.0
+4
▼ 2.3
1.6
▼
+7
-5 0.8
-3 9.69,485.35
15
1613*
12 7,121.9
9,277.7
13
1,515.8
▲
Vitale & Associati SpA
1.2
▼ VTB Capital
22*00.4 -
0.2
17
+1
KPMG
1,174.2
18*Evercore Partners
▲
▲
30
▼
+1
22*
# of Deals
▲
1,231.2
▲
Any Nordic Involvement Completed (AF44)
25
Industry Total
+26
25,536.9 392
Xenon Capital Partners
18*
Macquarie Group
Banco BTG Pactual SA
HSBC Holdings PLC
Santander
3,000.0
-4.8
-
-2
# of Deals per Advisor
Jan 1 – Sep 28
2
1
750.0
12
28.2 16.0
▲1.5
8
11 8,636.2
Financial Advisor
6
-37.5
2.0
-44.5
5.1
750.0-
-
3.2
-
22 27
-
23
21
US$m
Market
Jan 1 – Sep 28
+1
20.4 ▲ 9
-350
▲
▲
3
▲
21*
2.1
-61.9%
Industry % Change from Same Period Last Year
▲
* tie
100.0
15.5
16.8
Any Nordic Involvement Announced (AD37)
▼
2
▲
13
▼
6
▲
7.2
24
▲
7.2
25
7.2
▲
# of
6
0.6
Deals
Market
Share Ch.
Market
1.2
3
0.4-3.3
502
1
Change in
-11.1%
▼
-188
Santander
Macquarie Group
HSBC Holdings PLC
KPMG
643.1
▲
13
18*
17
Xenon Capital Partners
Vitale & Associati SpA
24*
52*
-
534.0
682.5
1.32.8
2.9
UniCredit 4 793.3
18*
778.3
18*VTB Capital 750.0
750.0
16
5.3
5.3
974.62215 4.2
5.1
5.6
9
2
1,290.2
5.8
13*
23
5
5.1
11Credit Suisse
Banco BTG Pactual SA
1,233.2
13* 1,174.2
1,346.3
Societe Generale
Evercore Partners
12
5,775.4 24.9
Deutsche Bank
Leonardo & Co 1,319.6
810
16
18
8
15
Morgan Stanley 4
5.7
6.4
5,429.5
1,480.5
2,737.3
7
25*
3 ▼6 11.8Intesa SanPaolo
13.3
-35.4
2.45Lazard
Mediobanca
3,075.9
12
20
Rothschild 3 17
2
1
2011
Rank
2012
RankFinancial Advisor
Rank Value per Advisor (US$m)
6,535.8
US$m
-4.5
▲
▼
23.4
▲
▲
14.4
18.3
1,174.2
5.95
36.9
4.6
Deutsche Bank
13*
2
1
16
778.3
750.0
750.0
2.7
4.2
▲
▲
2.9
▲
4.4
▼
10
9,363.3
1.9
3.1
7
1
Rank Value per Advisor (US$m)
40.1
36.7
4.8
1
+1
0.3
+2
20
2
1,622
4
11▲
9
3
▲
▲
▲
0.6
0.4
6
▼
0.4
0.4
▲ 31
▼
6
UBS
▼
+1
▲
0.2
14.0
Morgan Stanley
7,911.9
5
Credit Suisse
11
19.611,066.5
Financial Advisor
20.111,352.4
2012
Rank
▲
▲
5.3
▼
▼11.8
-3.6
-9.0
4.6
22*
1,174.2
18*
2.9
4.6
23
2.9
4.6
2.9
21
15
10
BNP Paribas SA
1,247.1
-9
9
Change in
2.6
0.2
0.9
8
-4
0
1.2 17
25.514,432.6
14.0
▲
4
▼
▼
Rank Value per Advisor (US$m)
3
▼
7
-5
-
▼
0.4
▼
0.3
▲
0.3
0.8
▲
0.6
0.1
▼
▲
1.4
3.8
1.0
0.6
-0.0
▲
▲
▼
▲
0.3
▼
▲0.3
0.5
▼
▲
▲
▲0.7
9.6 1.1
26.6
22.1 1.2
▲
2.4
▼
▲
▲
0.1
0.3
0.7
Rank Value
▲
▼
0.3
0.3
5
7
2
682.5
Imputed Fees (US$m)
▲
▲
▲
19
-
1.3
0.6
Deutsche Bank
▲
2
20
-
56*
3.7
2.9
9
▲
2.9
31.3
21
2.9
-
46.3%
7,930.3
9,381.9
16
Sh (%)
6.1
-9.6
2.3
1
7,391.7
6,997.9
▲
1,362.8
0.2 ▲2.2
▼-0.3
1.1
▼
0.0
2.3
-
1.3
0.9
▲
▼
▲
1.4
▲
▲
▼
▲
▼
▼
0.2
1.6
4.1
▼3.6
▲
6.8
0.3
Market
0.9
1.45.8
1.0
Change in
7.4
▲
3.0
3.6
6.2
19.2
12.4
1.3
20.1 1.1
21.4
0.9
14.9
4.8
1.5
1.5
4.6
0.25.1
3.0
0.8
0.0
4.2
0.3
2.1
0.9
0.3
▼
2.8
3.3
1.0
4.8
5.7
3.5
49.2
20.7
15.9 1.9
3.9
9.5
30.9
3.5
20.0
30.0
30.2
100.0
0.3
0.5
1.0
Market
▲
Share Ch.
▲
28.4
33.5
-2
0.5
0.3
-2
+1
1.0
2.0
0
-12
-7
▼
▼
12.3
-
6.2
Imputed Fees (US$m)
▼
3.8
Jan 1 – Sep 28
7
Leonardo & Co
-9
▼
▲
Industry % Change from Last Quarter
-
6
2011
Rank
-3
25
HSBC Holdings PLC
UniCredit
US$m
0.2
+4
Any Italian Involvement Announced (AD36)
# of Rank Value
Goldman Sachs & Co ▼6,666.8
Rank Value
Share Ch. Deals # of Deals
2012
Rank
Jan 1 – Sep 28
US$m
Market
28.7
Sh (%)
2011
Rank
1.8
Market
Sh (%)
▼
Market
18
21
6
2.2
Intesa SanPaolo-11.6 +6
▼
0.3
-51.7 ▼
▲ 10
12
4
8-28.8
-12.9
0.4
1.8
▼
1.6
2.1
▼
▼
0.5
3.1
▼
▲ 2
1
▲
-1
▲
0.3
▲
+1 3.8
1.0
0.3
0.5
1
1
▼
1.4 0.3
▼
1.4
▲
+1 1.4
0.2
+1
-3
1
0.3
0.3
▲
▲
0.3 +1
▲
-34.7%
100.0
Industry % Change from Same Period Last Year
2.7
100.0
+11.2
1.915.9
-
96*
3,474.5
7.2
0.36.1
5.7
1
▲
40.8
-46.0%
-179
▼
▼
▼
415.3
0.11
-4.1%
-27.2%
▼
▼ -31.3%Industry % Change from Same Period Last Year
▲
48,444.5
Erneholm & Haskel AB
100.0
2.8
3.236
22
1,526.7
Nomura
Scotiabank
Rabobank NV 21*
Mitsubishi UFJ Financial Group
3,474.5-
3,474.5
20 3,516.8
18
15
-
23
21*
17
20
18
Credit Suisse
14
Perella Weinberg Partners LP 19
Macquarie Group
Lazard
Arctic Securities ASA
Bank of America Merrill Lynch
Handelsbanken Capital Markets 16
3,534.5
66
7.315
7.3
3,705.7 7.7
4.8
27 9.2 7.1
4,578.5
-8.84,275.8
11 33 5,245.3
13
1
7.9
16
4,466.2
14.5
5
ABG Sundal Collier
Citi 12
10
Morgan Stanley
9.4
10 6,670.2
4
9.5
-4.9
13.8 7.9
▼13.8
10.8
-22.2
▲
9.8
9 7,330.0
14 14.7
-7.915.1
7,136.5
6
3
2
2012
Rank
2
4
85
19
2011
Rank
SEB Enskilda
9
6
Goldman Sachs & Co
6,697.4
7,321.3
7,017.3
3
UBS
1
8
HSBC Holdings PLC
Nordea
5
Rothschild
Deutsche Bank
7
JP Morgan
3
4.1
20
2
14
7.8 5.0
2.5
7.3
7.6
3,798.0
19
Industry Total
Carnegie
-2.0
8.8
▼
16.8 ▲
0
▲
16.5
4
Market
-1.1%
▼-65.9% ▼
# of Deals
Market
36.2
# of
1
8,148.3
15.1
7,519.4
Sh (%)
-3
# of Deals per AdvisorRank Value per Advisor (US$m)
13
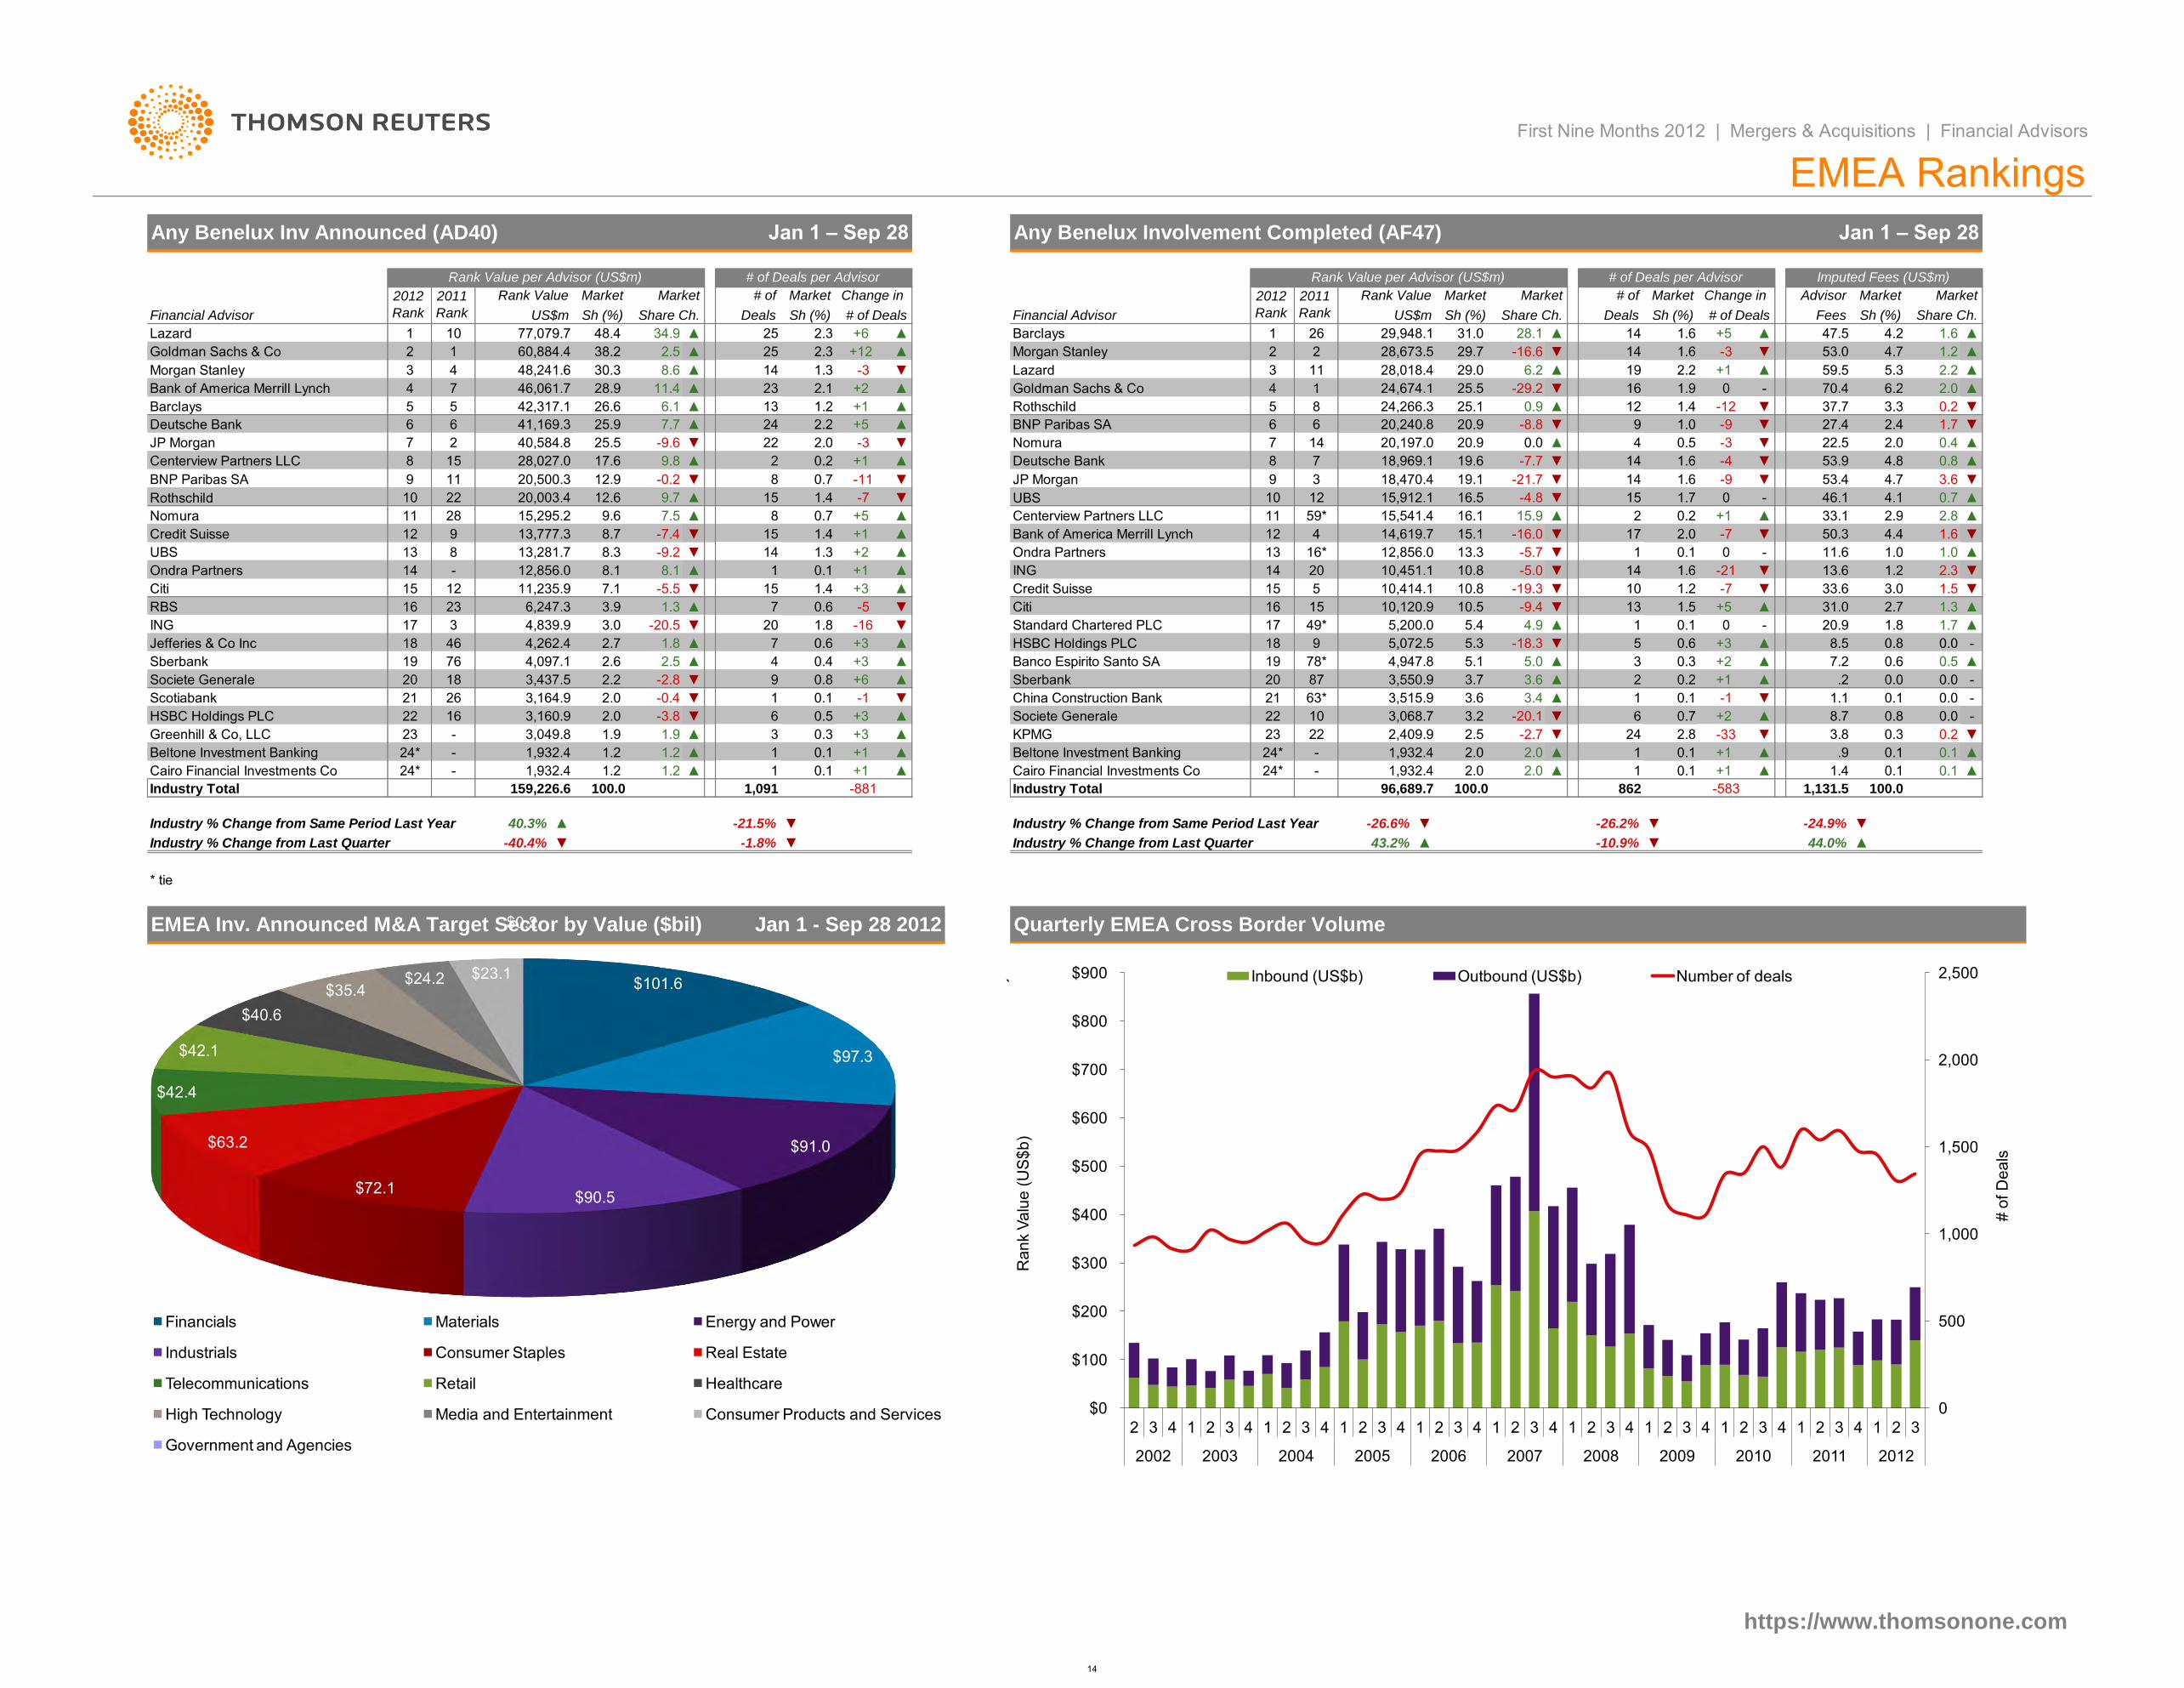
Rothschild UBS
43.2% ▲▼
1
HSBC Holdings PLC
Banco Espirito Santo SA
23 2.5
22
5
1
15.1
10,120.9
▼
3.7 2
▼
▲19
- 2.0
78* 5.0
▲
3.463* ▲
▼
-20.1
-16.0
-5.7
14,619.7
▼
10,414.1
4.9
12
5,072.5
16.5
9 18,470.4
13.3
412
12,856.0
11
14
# of
29.7
4
29.0
2
2011
Rank
28.1
1 25.5
1.2
0 ▲1.0
▼
+1
▼
-
4.4
▼
6.2
4.7
-7
-3
2.3
1.6
▼
11.6
▲
2.0
-881
Cairo Financial Investments Co0.1 +1 ▲
0.3
-40.4%
-26.6%
1,932.4
▼▼
28,018.4
-10.9%▼
https://www.thomsonone.com
▼
+1
862
1
44.0%▲
-
100.0
▲
▼
▼
▼-26.2% -24.9%▼
0.1
-583
0.0
1.4
3.8
1,131.5
8.7
▲
0.1.9
+2 ▲
▲0.1 0.1
0.2 ▼
+1 ▲
6
2,409.9 -2.7
0.73.2
0.1
2.824
2.01,932.4
-3.8 +3
0.1
-33+3
24*+1
▲
▲
22
▲
10
-2.8 0.2
▲
0.8 ▲ 20
-1
+6
▼ 0.01.1 0.1
-
Greenhill & Co, LLC
-0.4
1.9
▲
▼
0.6
0.3
0.0
21
+1
3
0.1
+2 ▲
-1
8.5
0.0▲ .2
▲
7.2 0.6
0.0
▼
5.4
5.1
20.9
+5
+3
1
0.5
0
1.515
1.8-
13 2.7▲▼
0.1
14 1.6 -21-5.0
20.9
1
17
▼-16.6
0.1
Deals
0
53.9
Fees
14 +5
1.6
1.7
1.4
26 29,948.1
1.3
24,674.1
# of Deals
▲
▼ 11
▲
# of Deals
2
▼
Sh (%)
Rank Value per Advisor (US$m)
3
2012
Rank
11 1.6
Sh (%)
▲31.0
Share Ch. Share Ch.
▲ 4.277,079.7
MarketMarket AdvisorChange in
US$m
10 Barclays
Market
Sh (%)
# of
Rank Value per Advisor (US$m)
2011
RankFinancial Advisor
Market Change in Market MarketRank Value
Deals
34.9 +6
Rank Value
US$m
48.4
Sh (%)
# of Deals per Advisor
Jan 1 – Sep 28 Any Benelux Involvement Completed (AF47)
1.9
15-4.8
▲
14-21.7
▼-8.8
-
47.5
53.0
1.6
Jan 1 – Sep 28
▲
4.7▼
0.5
1.2
2.0
3 KPMG
-1.8% Industry % Change from Last Quarter
Industry % Change from Same Period Last Year
* tie
Industry % Change from Last Quarter
40.3%
50.3
1.0
▼
1.213.6
38.2
Market
Deutsche Bank
4 8.6
Share Ch.
46,061.7
30.3
Goldman Sachs & Co
Lazard
2
4
26.65 42,317.1
28.9
41,169.3
5
66
25.5
25.9
▲
60,884.4
Morgan Stanley 3
Bank of America Merrill Lynch
Any Benelux Inv Announced (AD40)
2012
Rank
Barclays
1
48,241.6 14
▲
▲
-9.6
▲
2
▲
▲
# of Deals per Advisor
11.4
2.5
25
Rothschild
-3
2.1
▼ 8
2.3
2.2
25
▼
7.7
▲
0.29.8
24
22
6.1
23
13
+1
▲1.2 +1
▼
▲+5
2.0
0.7
10
▼
+5
-11 JP Morgan
Centerview Partners LLC
-7
▲15,541.4▲ 16.159*
Deutsche Bank
15.9
15,912.1
-7.7
▼
▼
4,947.8
▼
-18.3
2.0
5.3
3.6
-19.3
10.8
-9.4
Industry % Change from Same Period Last Year
96,689.7
16*13Ondra Partners
China Construction Bank
-
87Sberbank
▼1.2
Industry Total
Societe Generale
3,515.9
Beltone Investment Banking
3,550.9 3.6
31.0
ING
24*
17 5,200.0
16
15Credit Suisse
10,451.1
+1
▲
Bank of America Merrill Lynch
18
▼
+2
+1
▲
▲+3
+3
-16
+3
1,091
0.4
0.1
▼
-5
▲
9
4
▼
▼
▼
1
▲
6
▲
0.11
▲
1.2
1.9
1
3,049.8
▲
-21.5%
▲
10.5
3.0
100.0
Citi
3,068.7
Standard Chartered PLC
9
Quarterly EMEA Cross Border Volume
1.5
▲
▲59.5
27.4
70.4
▲
Imputed Fees (US$m)
37.7
1.7
2.2
3.3 0.2
2.0
First Nine Months 2012 | Mergers & Acquisitions | Financial Advisors
5.3
▼
0.0
1.6
▼
-9
▲2.8
2.0
-9
▲0.422.5
▼
1.7
-
0.8
▲
1.3
-
0.3
53.4 3.6
▲
0
33.1▲
0.8
+1
0.8
▲46.1
▼
0.7-
2.4 ▼
▲
Market
2.2196.2
1.0
0.5
▲
0.9
16
4
-29.2▲
-419.6
24,266.3
20.9
▲
5
-3
-12
14
20,240.8
25.1
▲20,197.0
4.1
4.818,969.1 ▼
▼
▼
Morgan Stanley
6
12
▼
9
▲
8
Lazard
28,673.5
BNP Paribas SA
1.619.1
7
3
6
-3
Goldman Sachs & Co
+12
Sh (%)Financial Advisor
EMEA Rankings
2.3
Nomura▼
0.2
▲
▲
49*
7 14
8
14
2.92
▲ 33.6-7
2.0
▲
10.8
20
5
1.4
▲
1.3
1.4
▼
1
▼
▲
▲
0.7
0.6
1.8
1.4
7
0.1
15
7
20
0.6
▼
Citi
8.1
1.3
19
16
Sberbank
-5.5
8.1
2.5
18
13
Ondra Partners
4,262.4
3
2.6
RBS
17ING
9
7
12
Nomura 11 28
BNP Paribas SA
8 28,027.0
2
10
11
JP Morgan
7
15
22
9
Centerview Partners LLC
+2
8
▲
-7.4 15
-0.2
14▼
14
15 12 11,235.9
23
8
-
7.1
8.7
23
-
-
22 16
-
100.0
Credit Suisse
159,226.6
1,932.4Beltone Investment Banking
Cairo Financial Investments Co 24*
Industry Total
24*
1,932.4
HSBC Holdings PLC
8.3
26
Societe Generale 1820
Scotiabank 21
UBS
46Jefferies & Co Inc
2.0
-20.5
17.6
2.23,437.5
13,777.3
13,281.7
4,839.9
4,097.1
20,500.3
3,160.9
9.712.6
9.6
2.7
3.0
15,295.2
12,856.0
20,003.4
3,164.9
-9.2
1.2
1.2
7.5
15
6,247.3
1.8
12.9
3.9
40,584.8
EMEA Inv. Announced M&A Target Sector by Value ($bil) Jan 1 - Sep 28 2012
76
10
$101.6
$97.3
$91.0
$90.5 $72.1
$63.2
$42.4
$42.1
$40.6
$35.4 $24.2 $23.1
$0.2
Financials Materials Energy and Power
Industrials Consumer Staples Real Estate
Telecommunications Retail Healthcare
High Technology Media and Entertainment Consumer Products and Services
Government and Agencies
`
0
500
1,000
1,500
2,000
2,500
$0
$100
$200
$300
$400
$500
$600
$700
$800
$900
2 3 4 1 2 3 4 1 2 3 4 1 2 3 4 1 2 3 4 1 2 3 4 1 2 3 4 1 2 3 4 1 2 3 4 1 2 3 4 1 2 3
2002 2003 2004 2005 2006 2007 2008 2009 2010 2011 2012
# o
f D
ea
ls
Ra
nk V
alu
e (
US
$b
)
Inbound (US$b) Outbound (US$b) Number of deals
14
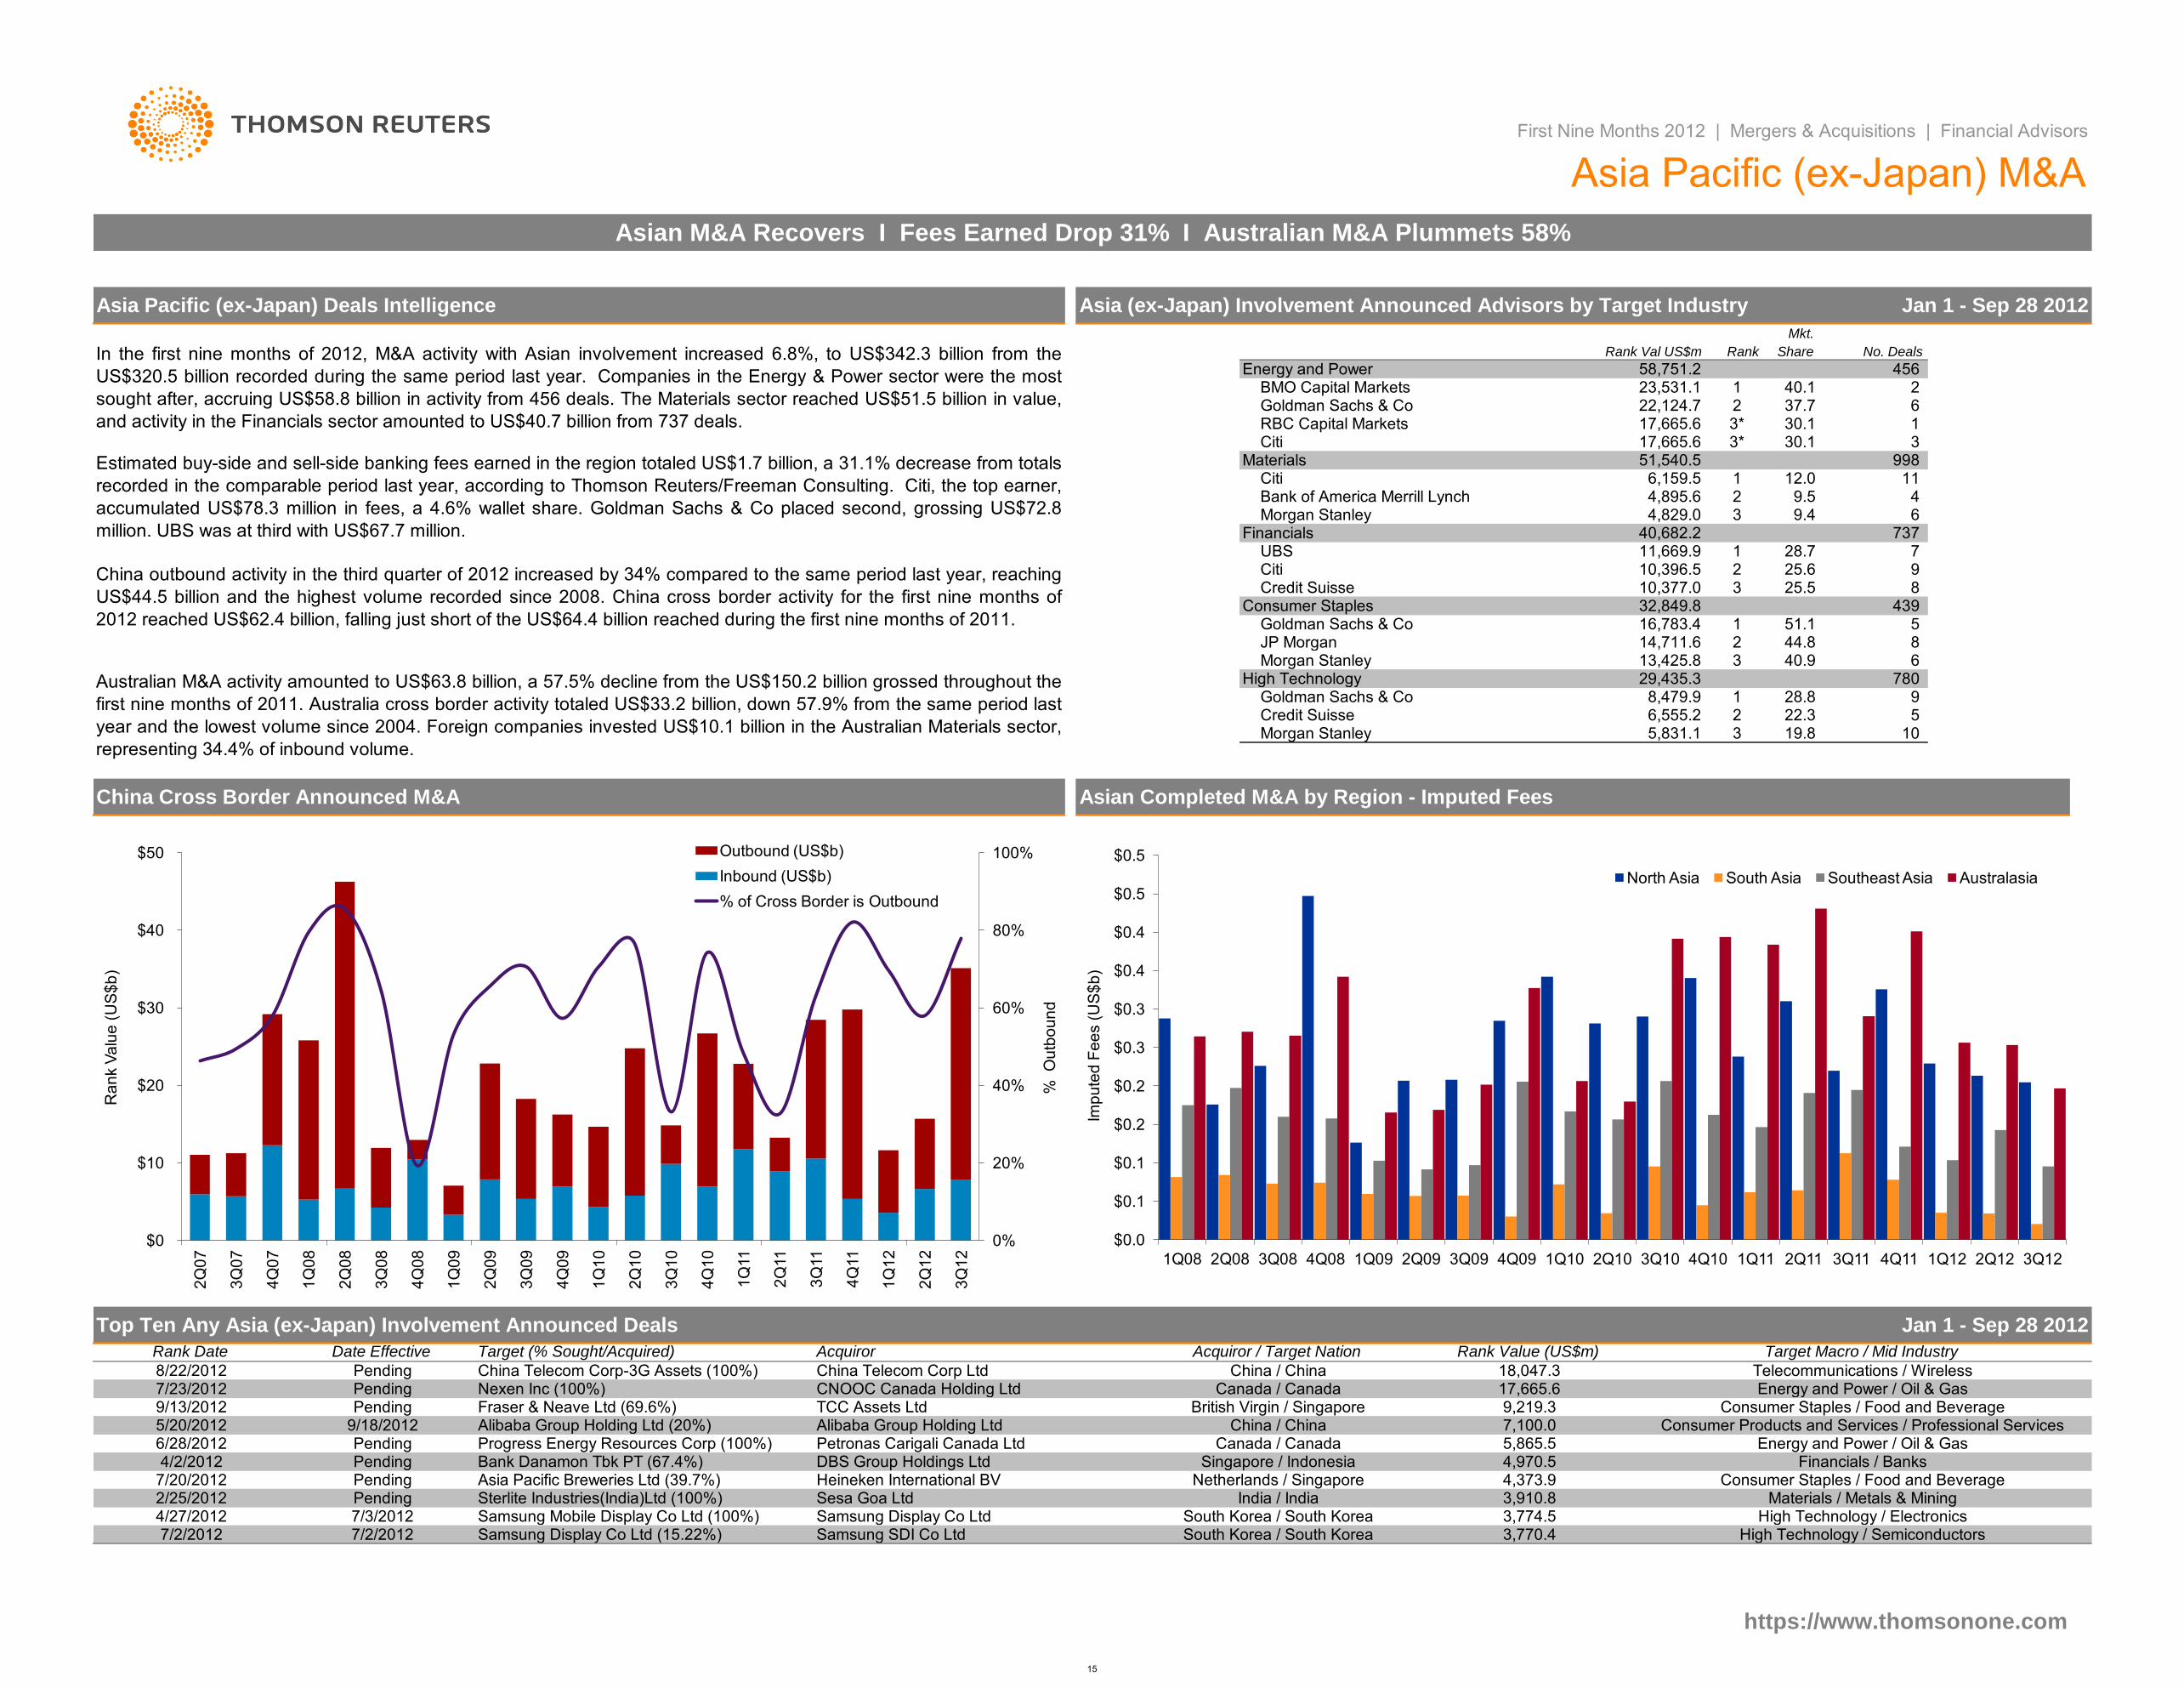
3* 30.1 3
In the first nine months of 2012, M&A activity with Asian involvement increased 6.8%, to US$342.3 billion from the
US$320.5 billion recorded during the same period last year. Companies in the Energy & Power sector were the most
sought after, accruing US$58.8 billion in activity from 456 deals. The Materials sector reached US$51.5 billion in value,
and activity in the Financials sector amounted to US$40.7 billion from 737 deals.
Estimated buy-side and sell-side banking fees earned in the region totaled US$1.7 billion, a 31.1% decrease from totals
recorded in the comparable period last year, according to Thomson Reuters/Freeman Consulting. Citi, the top earner,
accumulated US$78.3 million in fees, a 4.6% wallet share. Goldman Sachs & Co placed second, grossing US$72.8
million. UBS was at third with US$67.7 million.
China outbound activity in the third quarter of 2012 increased by 34% compared to the same period last year, reaching
US$44.5 billion and the highest volume recorded since 2008. China cross border activity for the first nine months of
2012 reached US$62.4 billion, falling just short of the US$64.4 billion reached during the first nine months of 2011.
Australian M&A activity amounted to US$63.8 billion, a 57.5% decline from the US$150.2 billion grossed throughout the
first nine months of 2011. Australia cross border activity totaled US$33.2 billion, down 57.9% from the same period last
year and the lowest volume since 2004. Foreign companies invested US$10.1 billion in the Australian Materials sector,
representing 34.4% of inbound volume.
Pending Netherlands / Singapore
Credit Suisse
High Technology
Citi
Asia (ex-Japan) Involvement Announced Advisors by Target Industry
25.5
40.9
5
Jan 1 - Sep 28 2012
3,774.5
37.7
439
9
1 40.1
44.8 8
9
998
2
780 8,479.9 1
22.3
6
4,895.6
16,783.4 1
13,425.8
Asia Pacific Breweries Ltd (39.7%)Bank Danamon Tbk PT (67.4%)
Canada / Canada 5,865.57,100.0
Fraser & Neave Ltd (69.6%)Alibaba Group Holding Ltd
10,377.0
9.4
28.7
Goldman Sachs & Co
Morgan Stanley 314,711.6
Citi
29,435.3
Financials / Banks
3Consumer Staples 32,849.8
Goldman Sachs & Co
Telecommunications / Wireless
2JP Morgan
6,555.2
India / India
South Korea / South Korea
Sterlite Industries(India)Ltd (100%)
Samsung Display Co Ltd (15.22%) Samsung SDI Co Ltd
Asia Pacific (ex-Japan) Deals Intelligence
China Cross Border Announced M&A
4/2/2012
7/2/2012
2/25/20124/27/2012
Pending
7/20/2012
7/2/2012
Heineken International BV
Pending9/18/2012
6/28/2012 Pending
9/13/2012
Pending
Pending
TCC Assets Ltd
Consumer Staples / Food and Beverage
Alibaba Group Holding Ltd (20%)
4,970.5Progress Energy Resources Corp (100%) Energy and Power / Oil & Gas
4,373.9
China / China
DBS Group Holdings Ltd Singapore / Indonesia
Consumer Products and Services / Professional Services
Pending CNOOC Canada Holding Ltd Canada / Canada 17,665.6
Petronas Carigali Canada Ltd
8/22/2012
British Virgin / SingaporeNexen Inc (100%)
9,219.35/20/2012
Energy and Power / Oil & Gas
10Morgan Stanley
China Telecom Corp Ltd 18,047.3
Acquiror / Target Nation
China / China
Top Ten Any Asia (ex-Japan) Involvement Announced Deals
Acquiror
3
25.6
China Telecom Corp-3G Assets (100%)
Target (% Sought/Acquired) Target Macro / Mid IndustryRank Value (US$m)
10,396.5
5
Credit Suisse
51.1
61
Jan 1 - Sep 28 2012
28
19.8
Asian Completed M&A by Region - Imputed Fees
5,831.1
28.8
2
30.1
11
7
12.0
737
49.56
51,540.5
17,665.6 22,124.7 Goldman Sachs & Co
RBC Capital Markets
23,531.1 Energy and Power
BMO Capital Markets
17,665.6
456 No. DealsRank Val US$m
58,751.2 Share
Mkt.
Rank
Materials / Metals & MiningSesa Goa Ltd 3,910.8
2
Materials
3*
16,159.5 Citi
UBS
Bank of America Merrill Lynch
40,682.2 Financials34,829.0 Morgan Stanley2
1
High Technology / Semiconductors
Rank Date Date Effective
7/23/2012Consumer Staples / Food and Beverage
Samsung Mobile Display Co Ltd (100%)3,770.4
South Korea / South Korea High Technology / ElectronicsSamsung Display Co Ltd7/3/2012
https://www.thomsonone.com
Asian M&A Recovers I Fees Earned Drop 31% I Australian M&A Plummets 58%
11,669.9
First Nine Months 2012 | Mergers & Acquisitions | Financial Advisors
Asia Pacific (ex-Japan) M&A
0%
20%
40%
60%
80%
100%
$0
$10
$20
$30
$40
$50
2Q
07
3Q
07
4Q
07
1Q
08
2Q
08
3Q
08
4Q
08
1Q
09
2Q
09
3Q
09
4Q
09
1Q
10
2Q
10
3Q
10
4Q
10
1Q
11
2Q
11
3Q
11
4Q
11
1Q
12
2Q
12
3Q
12
% O
utb
ou
nd
Ra
nk V
alu
e (
US
$b
)
Outbound (US$b)
Inbound (US$b)
% of Cross Border is Outbound
$0.0
$0.1
$0.1
$0.2
$0.2
$0.3
$0.3
$0.4
$0.4
$0.5
$0.5
1Q08 2Q08 3Q08 4Q08 1Q09 2Q09 3Q09 4Q09 1Q10 2Q10 3Q10 4Q10 1Q11 2Q11 3Q11 4Q11 1Q12 2Q12 3Q12
Imp
ute
d F
ee
s (
US
$b
)
North Asia South Asia Southeast Asia Australasia
15
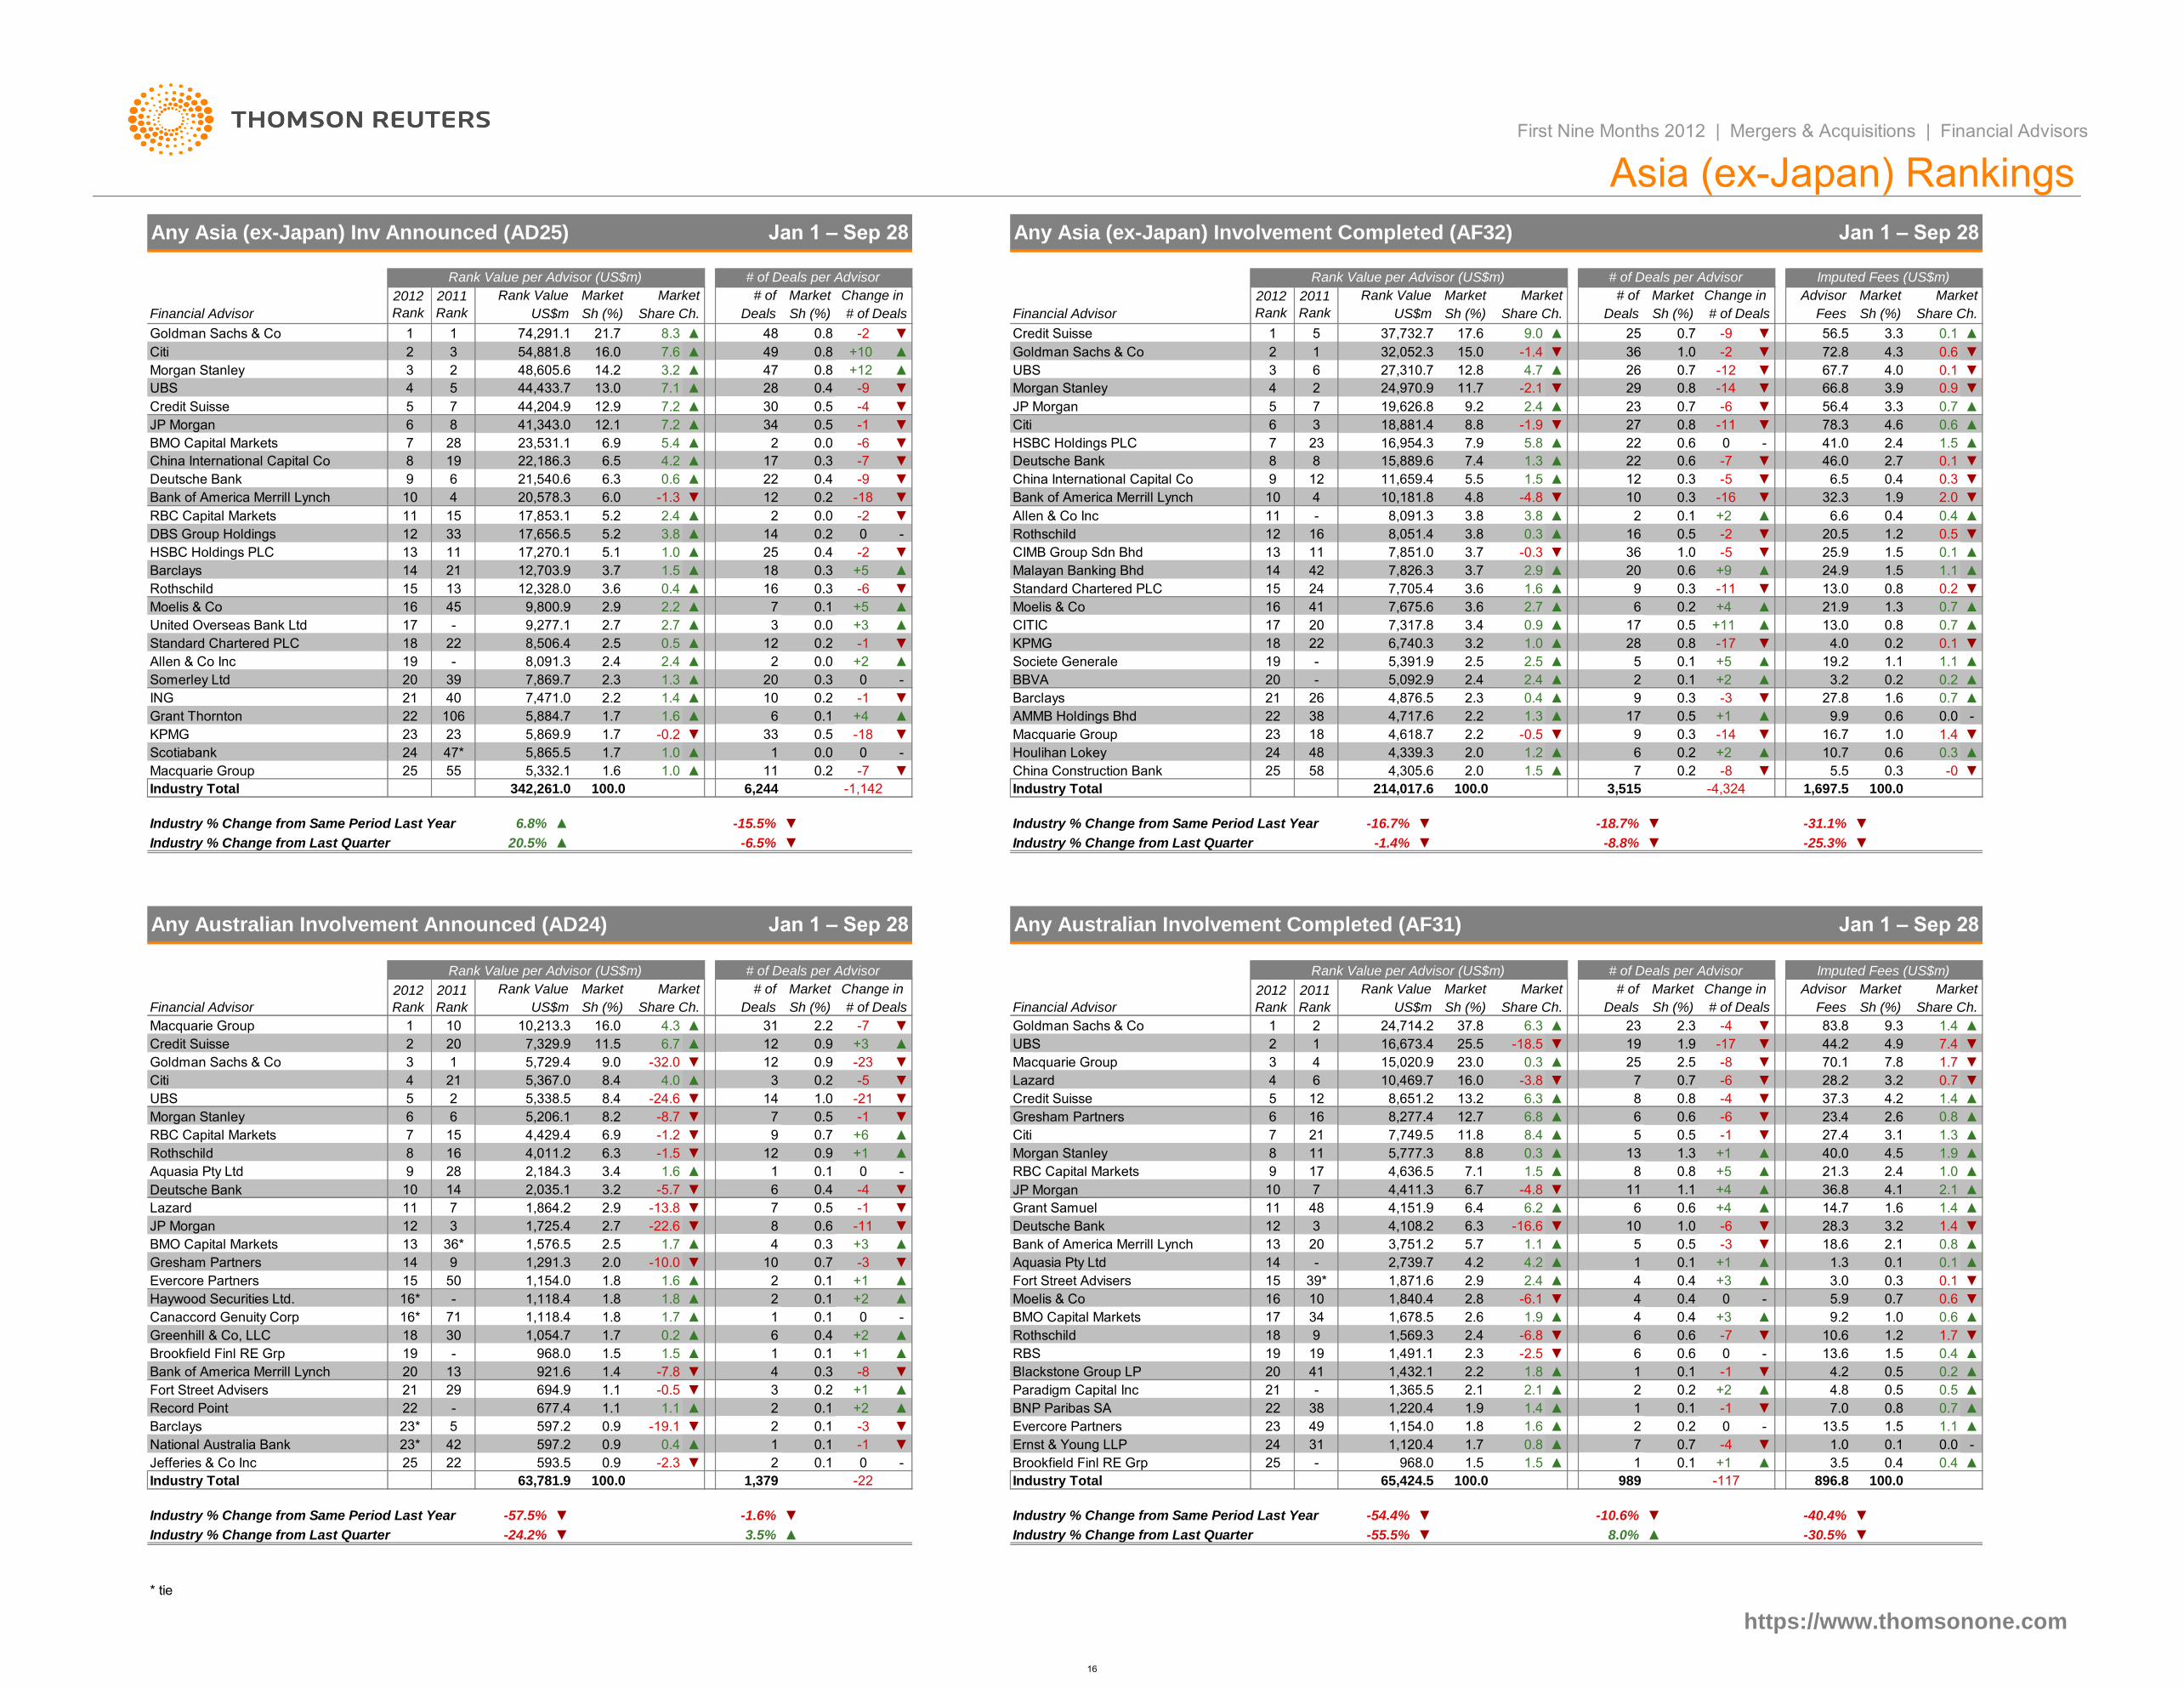
Bank of America Merrill Lynch Bank of America Merrill Lynch
Deutsche Bank JP Morgan
Credit Suisse
15,020.9
Sh (%)
Any Asia (ex-Japan) Inv Announced (AD25) Jan 1 – Sep 28
Asia (ex-Japan) Rankings
▼6.8% -18.7%
Jan 1 – Sep 28
11.8
Rank Value
7,749.5
Market
31
Change in
6.44,151.9
8,277.4Gresham Partners 12.7
8.8
2011
Rank
Macquarie Group
First Nine Months 2012 | Mergers & Acquisitions | Financial Advisors
10.7 0.3
Financial Advisor
▲
342,261.0
20.5%
Industry % Change from Same Period Last Year
Industry Total
Industry % Change from Last Quarter
▲
-7
▲
6
Macquarie Group 10,213.31 10
1.7
694.9
36*
3
BNP Paribas SA 22
Morgan Stanley
▼
1.8
1.8
1,054.7
1
2 20
15
2.5
12 +3
7
1
6
3
0.3
-3.8
1,365.5
13.2
7.1
5,777.3
4,636.5
1,871.6
1,840.4
4,411.3
6.8
▲
6.2
1.8
▲
▲
▼
0.3
-4.8
▼
23 -4▲ 2.3
6
11
25
0.88
1.1
▼
Fees# of Deals Sh (%)
Imputed Fees (US$m)
Deals
Market
Sh (%)
# of Change in 2012
Rank
2011
Rank
Rank Value
Industry % Change from Last Quarter
Advisor
▼
# of Deals per Advisor
-8.8%
Share Ch.US$m Financial Advisor US$m
Rank Value per Advisor (US$m)
2012
Rank
MarketMarket
Jan 1 – Sep 28
-25.3%▼
Any Australian Involvement Completed (AF31)
▼
▼
4,305.6
4.9
-4
▼
▼ 7.8
▼
70.12.5
-17
▼
Market
Share Ch.
83.8
▼7.4
▲1.49.3
Market
44.2
▼0.3 -0-7 ▼ 5.5▲1.5 ▼
-16.7% ▼
0.6▲
0.2
24 ▲ 6
▼-31.1%
▲Houlihan Lokey
-825
0.22.0 +2
72.0
1.2-
25 55 5,332.1 1.6
1
1.0 0.211
1.0
1.4▼ 16.7
24 47* 5,865.5 0.0
▼ Macquarie Group
48
KPMG 23 23
1.7Scotiabank
5,869.9 -0.2
-+1 ▲ 9.9 0.6
0.3
0.0
▼1.0-149-0.50.5 23 ▼2.2-18 4,618.718
0.1 +4 ▲Grant Thornton 22 106 5,884.7 1.7 ▲ 6
0.7
1.3 ▲
2.3
0.54,717.6 2.2 17
27.84,876.5
▲3.2
0.4 ▲▲ 9 0.3 -3
▲+2
1.61.4 ▲
- BBVA▲
Barclays
-
▼
0
1.1
2.4 2.4 0.2 0.22
▲ 5
▲ 0.1
1.1+5 ▲
Somerley Ltd 20 39 7,869.7 2.3
0.0 19.2
Standard Chartered PLC
2.52.52.4 Societe Generale2.4 ▲
▼ 6,740.3
Allen & Co Inc 8,091.3
18 22
19 -
8,506.4 KPMG
-
▼1.0 0.8 0.10.2▼▲ 28
United Overseas Bank Ltd 17
4.0-17
0.1 ▲
22
+2
3
2.5
0.5
0.5
▲
+30.0
0.2▲ 12 -1 3.2
- 9,277.1 2.7 2.7
21.97,675.6
CITIC▲ 7,317.8 13.0
0.7
▲▲
3.6
3.4 0.9 +11 0.70.817
Moelis & Co 16 45 9,800.9 2.9
▲
410.1 2.7 ▲
14
Standard Chartered PLC
Malayan Banking Bhd
7,705.4
1.36 ▲
▼ 13.0-11
0.2
0.3
▲1.1
▼
24.9+90.6
+4 ▲
1.6 0.8 0.2
1.5▲
▲ 9
2.9 ▲ 20
Rothschild 15 13 12,328.0 0.4 ▲3.6
0.1 ▲
12 16 8,051.4 3.8 0.3 ▲
3.7 1.5
Barclays 14 21 12,703.9
▲
11 17,270.1
3.7 1.5
DBS Group Holdings
0.3
▲ 25 0.4
+5
CIMB Group Sdn Bhd
▲
0.5 ▼
1.0
-2 ▼0.2 0 - Rothschild
▼ 25.9-0.3 ▼ -5 ▼36 1.0
1.216 0.5
▲ 2 0.1 +2 0.4
20.512 33 17,656.5 5.2
▲3.80.0RBC Capital Markets 11 3.8- 0.4 ▲6.6
10 2.0 ▼
15 17,853.1 2.4 ▲ Allen & Co Inc5.2 ▼
10 4 20,578.3 6.0 -1.3 1.9▼ 32.34 ▼ 0.3
▲ 12 0.4 0.30.3 -5 ▼
▼-180.2
▼
-16
1.5
10,181.8 4.8 -4.8 10
China International Capital Co 8
Deutsche Bank 9 6.56.3 22 12China International Capital Co 96 21,540.6
19 22,186.3
5.5
Deutsche Bank17
▲0.6
7.4
11,659.40.4 -9
▼1.3 ▲ 22 2.7 0.1
▼
0.6 -7 ▼ 46.0
▲0 - 41.0 1.52.416,954.3HSBC Holdings PLC 7
8
0.0
80.3 -7 ▼ 15,889.6
5.8 ▲
27 0.8
0.622
▼▼-1.9 78.3
56.423 ▼▲2.4
-6
▲0.7 -6
4.6 0.6
3.3 0.7
▲-11
BMO Capital Markets 28 23,531.1 6.9
18,881.4
23
6-134 0.5
7.97
30 0.5
8.8
5 19,626.8 9.2
Citi 3
7Credit Suisse 5 7 44,204.9 12.9
-1429 0.82 24,970.90.4 -9
3
▲
7.2 ▲
4
7.2 -4
Morgan Stanley
JP Morgan▼
3.966.8▼▼
614.2 ▲
28
3.2
7.1 ▼-2.1 0.9▼ 11.7
▼▼ 67.7▲ -12 0.1
▼0.61.0 -2 ▼ 72.8 4.3
12.8
32,052.3
0.7 4.02627,310.7 4.7
▼
0.7▲5
7.6
8.3 0.848
1
9.01 2517.637,732.7
+10 ▲ 2Goldman Sachs & Co 15.0 -1.4 36
21.7
Citi 2 3 54,881.8
US$m
Goldman Sachs & Co 1 1 74,291.1
16.0
Financial Advisor
▼
MarketChange in Advisor
▲3.3 0.1
Sh (%)
56.5-9
Share Ch.
# of Deals per Advisor
Deals Sh (%)
Market
Financial Advisor
Change in
# of Deals
# of
# of Deals FeesSh (%)
2012
Rank
2011
Rank Sh (%) DealsShare Ch. Sh (%)
Market
US$m
MarketMarket Market # ofRank Value
Share Ch.
2012
Rank
2011
Rank
Rank Value Market
Rank Value per Advisor (US$m)
Market
21 40 7,471.0 2.2 10
3.7
▲
3.616
2
Rank Value per Advisor (US$m)
Morgan Stanley 3 2 48,605.6
▲ -2
0.8
Credit Suisse
Imputed Fees (US$m)
▲
13.0
JP Morgan 6 8
UBS 4 5 44,433.7
Any Asia (ex-Japan) Involvement Completed (AF32) Jan 1 – Sep 28
# of Deals per Advisor
ING
HSBC Holdings PLC -25.1
▲
▲
12
143.8
41,343.0 12.1
5.4 2
31
13
11-22 8,091.3
2
58
8.4
1.5
2.8
1,220.4
1,432.1
0.8
1.1
23 1.6
1.1
1.8
-1
65,424.5
1,120.4
1.1
+2
-22
Brookfield Finl RE Grp
-19.1597.2 0.9 ▼
0.1
-3
0-2.3
-
-1.6%
Industry % Change from Last Quarter
25
▼
23*
5
1,864.2
1
0.1
21
▲
▼
▲
28
3.2
▼
▼
2.7
-
1.8
1.4
2
2
597.2
0.9
1.5
▼
20
21
20
5,391.9
26
-1.4%
214,017.6
4,339.3
38
Industry % Change from Same Period Last Year
▲ 49
+12 ▲ UBS47
42
▲
▼
0.8
6.7 ▲
2.2
0.9
-15.5%
20
▼
▼
11.5
16.0 ▼
# of
-1,142
-6.5%
100.0
# of Deals
# of Deals per AdvisorRank Value per Advisor (US$m)
▲
Deals
▼
Any Australian Involvement Announced (AD24)
2.9
3.4
▼6.3
▼
Sh (%)
▲
8.4
-32.0 12
33
6,244
▲
6.5
▲
▲4.2
▼
18
1.7
1.3
2.2
9.0
Share Ch.
4.3
Market
1.6
▼
Sh (%)
12 1,725.4
2
-22.6
▲1.61,154.0
4
2.0 -10.0
UBS
JP Morgan
1,576.5 ▲
8
14Gresham Partners
BMO Capital Markets
10
13
16
Goldman Sachs & Co
4
8
3
9
6
7
Citi
5
4.0
Aquasia Pty Ltd
Morgan Stanley
Rothschild
Lazard 11
14
RBC Capital Markets 15
10
2,184.3
4,429.4
8.2
5,729.4
5,338.5
5,367.0
2,035.1
▲
▼
-1.2
-8.7
▲1.6
6.9
4,011.2 -1.5
0.9
-6
5,206.1
8.4
7
Market
-24.6
7,329.9
▲
0.3
Macquarie Group-23
-5
▼
Lazard
+5
▼-1
0
China Construction Bank
0.3
0.2
5,092.9
▼
2
22AMMB Holdings Bhd
Industry Total
Moelis & Co
7,851.011
18
24
16
19
17
7,826.3
13
15
1.9
-
1.4
▲
▲
▲
▼
0.8
2.1
▲
3.2
21.3
0.6
36.8
▲
▲
▼
0.5
1
10
▲
-3
1.7
▲
4.5
2.4
▲
▲1.0
1.9
▼
4.2
▲
▲
-
+1
18.6 2.1
▼
0.1
▲
1.6
+4
1.0
3.0
1
0.4
▼
0.4
▼Industry % Change from Last Quarter
+5
▲+4
1.3
1.4
-6
▲
14.7
▲
3.2
3.1
2.6
27.4
1.437.3
23.4
0.7
5 0.5
1.3 ▲+1
6
7
4.1
▲
-57.5%
▼
▼
0.3
1.7
-30.5%
▲
40.0
-1
13
-60.6
▼
▼
-40.4%
24
25
-54.4%Industry % Change from Same Period Last Year
896.8
▲ 3.5 ▲1.5
▲
▲+1
100.0
+11
8.0%-24.2%
968.0
-55.5%
Jefferies & Co Inc 1.5
▼
https://www.thomsonone.com
RBC Capital Markets
Citi▲
6.3
8
BMO Capital Markets
Aquasia Pty Ltd
3
21
7
179
11
48
10
7
13
▼
0
▼
-11 Deutsche Bank
11
-
Grant Samuel-1
5
37.8 6.3
Credit Suisse
6
Goldman Sachs & Co
UBS
12
1 24,714.2
1.9
16.0
2
4
191 -18.5
23.0
25.5
10,469.7
-84 ▲
7 0.7
▲ 8 0.86.3
▼ -6 ▼ 28.2
▼
▼
16,673.4
1,697.5
8,651.214 -21
+1
-1
3 0.2
+6
12
1.0
▲
6
0.5 ▼
0.9
7
0.7
0.1
9
1
0.6
▲
Industry Total
-5.7 ▼
-13.8
0.3
0.4
0.1
0.5
0.4
▼
▼
0
-10.6%
7
989
-40.7
0.1
2
▼
-117
16
6.7
12
14
-4
20Bank of America Merrill Lynch
4,108.2
4.22,739.7
▲
▼
Barclays 23*
Haywood Securities Ltd.
Record Point
4
Evercore Partners
-7.8
29
593.5
Ernst & Young LLP
21
Evercore Partners
-0.5
0.9 ▲ ▼
677.4
3
-
17
0.1
+2 ▲
18
10
0
-3
0.1
Industry % Change from Same Period Last Year
Industry Total 1,379
1
15
16* -
▼
+1
1,118.4
921.6 -8
0.1
30Greenhill & Co, LLC
National Australia Bank
Canaccord Genuity Corp
20
Brookfield Finl RE Grp
13
16* 71
19
18
0.3 Blackstone Group LP
2
▼
0.1
1,154.0
41
21
Bank of America Merrill Lynch
38
Fort Street Advisers 0.2
22
42
▼
49
-
* tie
22
9
1,118.4
50
1,291.3
6
21.8
▲
1.7
▼
+3
19▲1.5
-
0.7 ▼
▲
▲
0.2
2.9
16
Rothschild
0.1
9
▲ Fort Street Advisers 39*
3,751.2
▲968.0 19
+1
34 1,678.5
+2
Moelis & Co
1.7
4
2.4
-6.1
1.1
4.2
4
5
-16.6
5.7
1.4 ▼
0.8
0.1▲
▲
1.3
28.3
0.1
0.2
1.7
0.6
▲
0.7
▲
▼
0.1
▼
▲
5.90
+3
9.2
0.8
▼
0.6
1.2
1.0 ▲
▲
0.4
▲
100.0
0.5 0.5
0.4
-
▼
1.1
0.0
▲
3.5%
0.1
1.5
0.4
100.063,781.9
▼
▼
2 0.2
0.6
10.6▼
2.2
2.41,569.3
▲
RBS
▲
2.1
20
Paradigm Capital Inc - 2.1 ▲
0.4
2.3
0.4
41.9 +3
-6.8 -7
2.6 ▲
0
0.66
+2
-1 ▼
▲
0.2
0.1
-
▲
4.2
- 13.6
0.7
4.8
7.0
1.0
▼
1,491.1 6-2.5
1
▲
100.0
1.5
0.1 -1 0.5
13.5
▼
-4,3243,515100.0
16
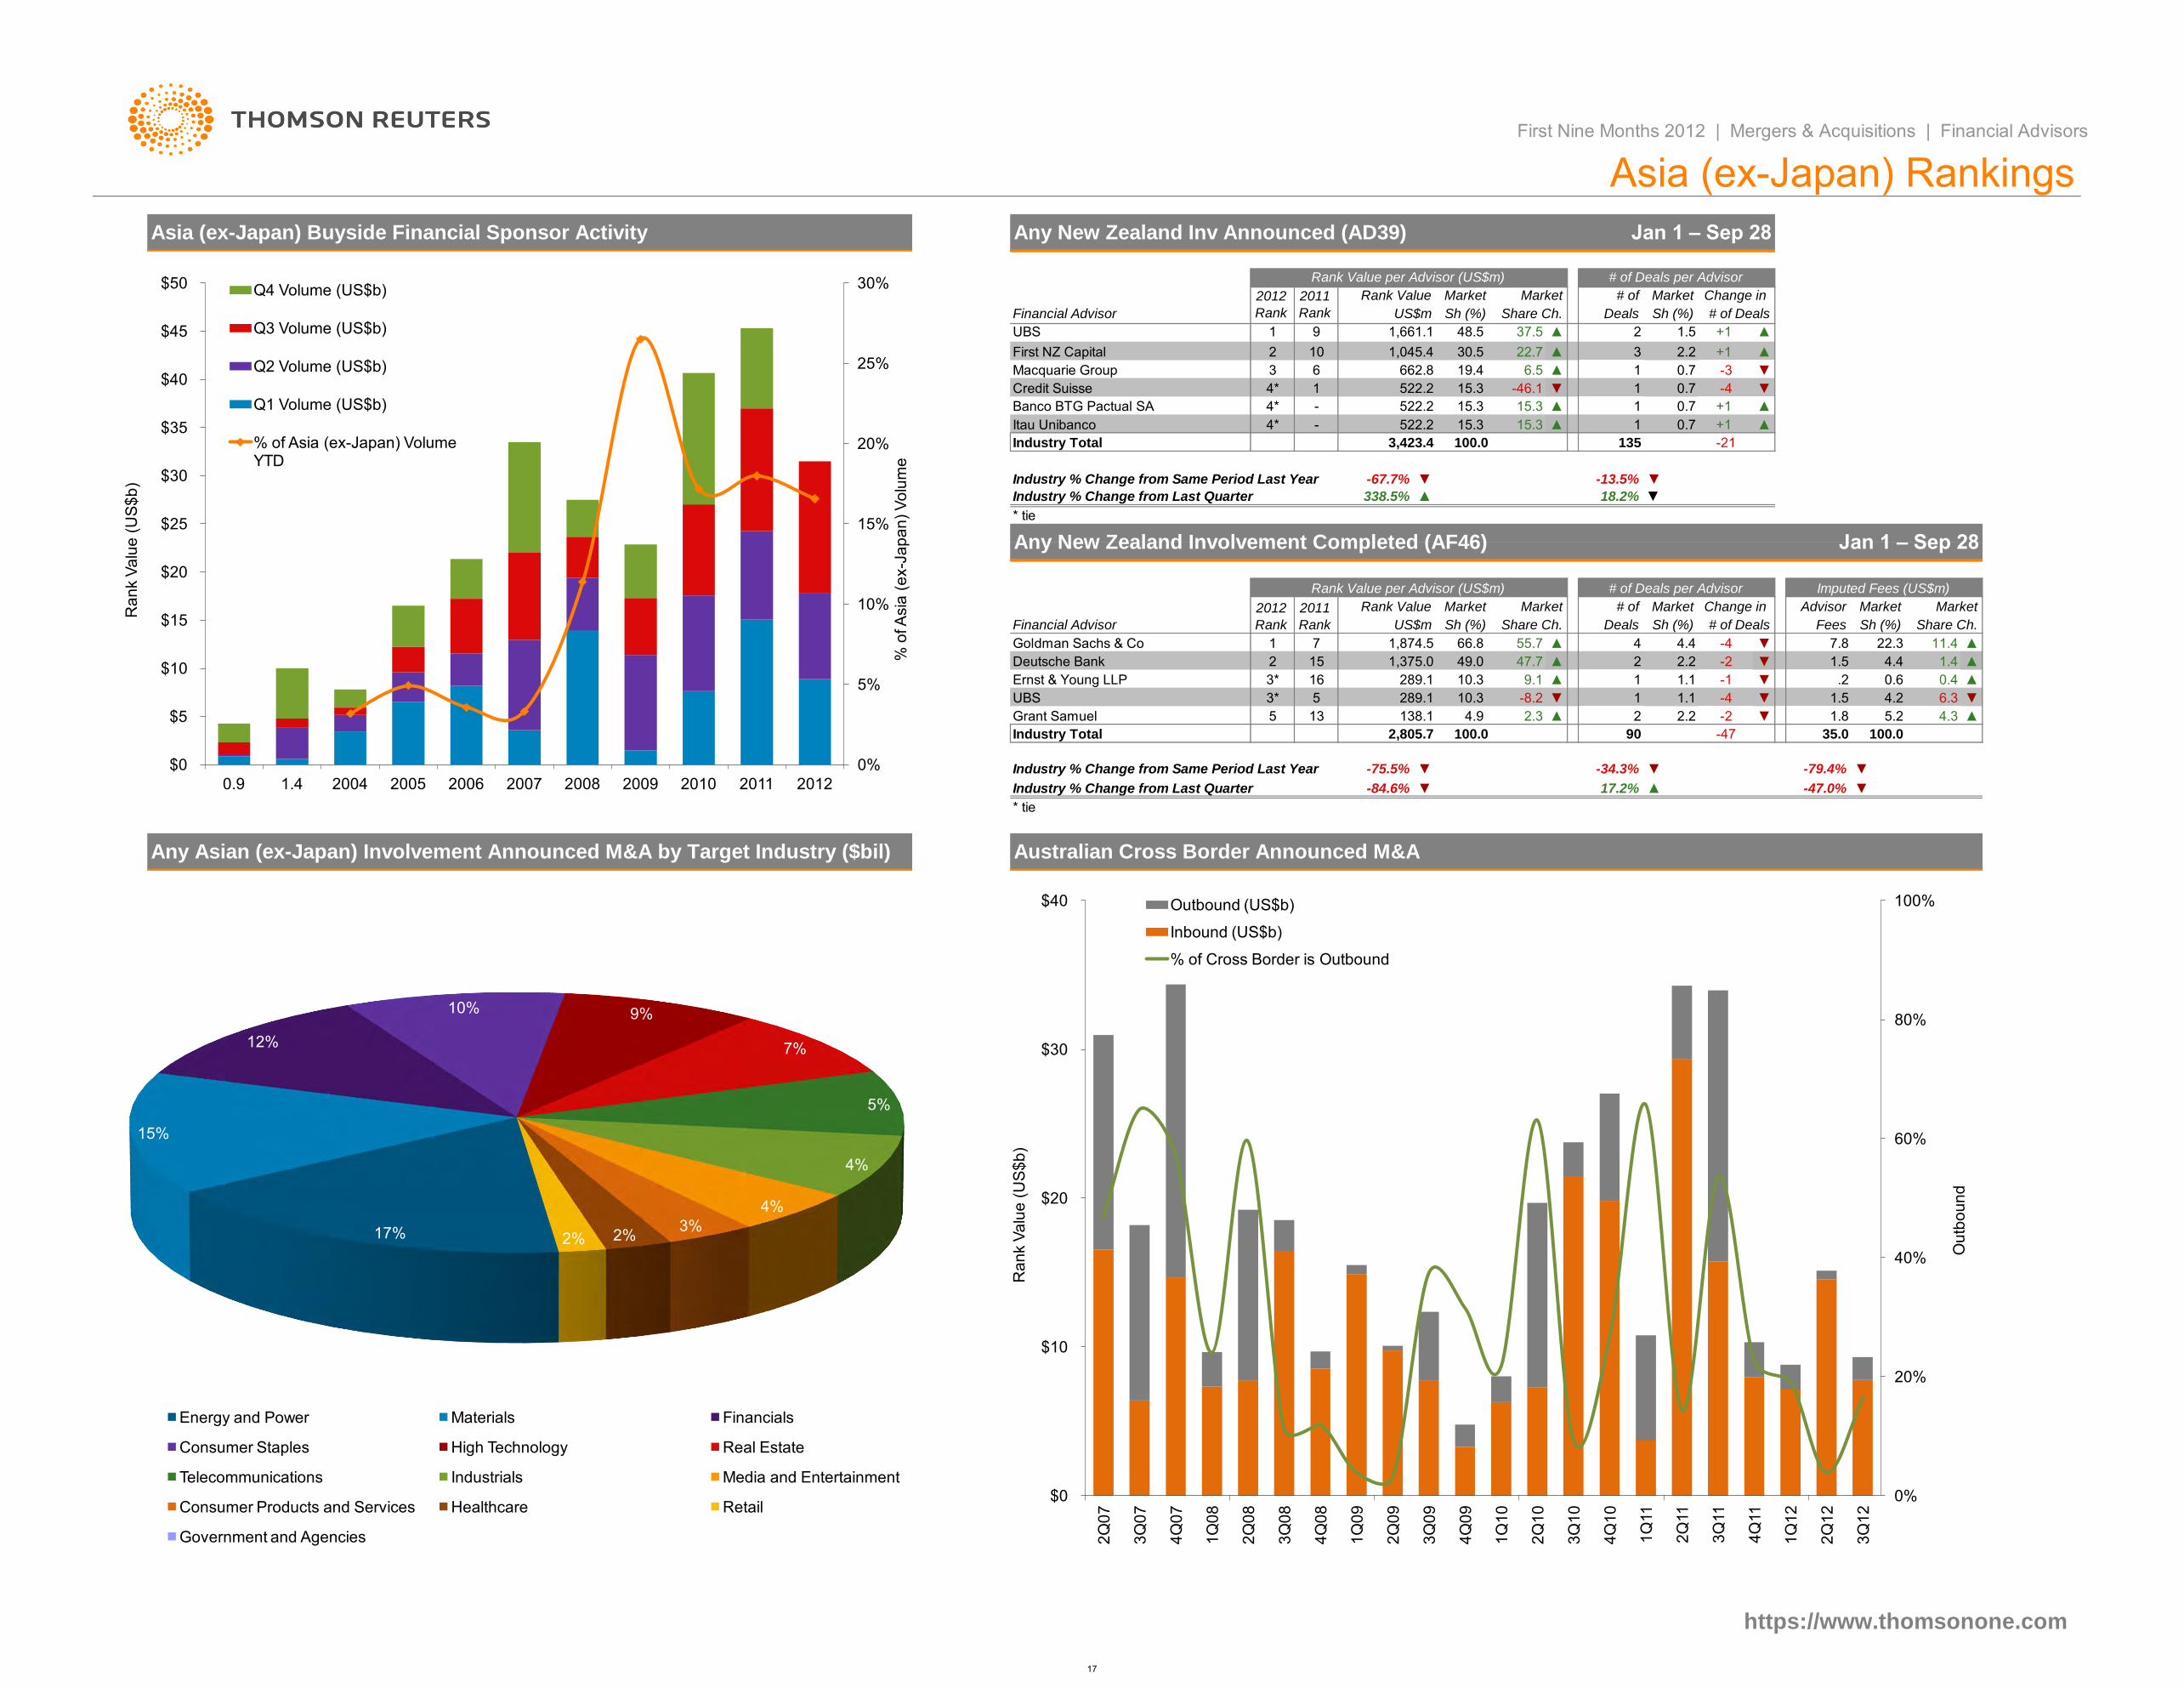
▼
4* 15.3 1 0.7 +1 ▲Itau Unibanco - 522.2 15.3 ▲
Rank Value per Advisor (US$m)
138.1
66.8
Grant Samuel
3*
1
Sh (%)
5
10.3
UBS
3*
15
7Goldman Sachs & Co
* tie
5
1,874.5
10.3289.1
Any Asian (ex-Japan) Involvement Announced M&A by Target Industry ($bil)
-4
1
1,375.0 249.0 2.2
-8.2
13 4.9 2.3 ▼
1.1
2.2
1▼
-1
# of Deals
7.8
# of Deals per Advisor
▼
-30.7
10
Any New Zealand Inv Announced (AD39)
MarketRank Value
30.5
# of Deals per Advisor
# of
▲
+11.5
1 ▼
-4
+1
135
0.7
Market
Market
1
6.5
3
1
# of
Market
Change in
▲
Jan 1 – Sep 28
+1
Change in
Sh (%)
Any New Zealand Involvement Completed (AF46)
Imputed Fees (US$m)
Market
▲
Market
▲
1.8
1.5
▼
▼
Fees
22.3
100.0
5.2
▲
19.4
37.5
3 6 662.8
22.7
▲
2.2
# of Deals
Market
Sh (%)Deals
First Nine Months 2012 | Mergers & Acquisitions | Financial Advisors
▲
Share Ch.
Macquarie Group
Ernst & Young LLP
Credit Suisse
2,805.7
Advisor
▼
16 289.1
Industry % Change from Same Period Last Year
▼
Industry Total
100.0
9.1
55.7
Share Ch.US$m
47.7
0.7
Industry % Change from Last Quarter 18.2%
15.3
▲
Rank Value
338.5%
▲
▲
-21
2
Rank Value per Advisor (US$m)
2 -2
-4
Deals
4.4
Jan 1 – Sep 28
▲
15.3
2011
Rank
3,423.4
522.2
Industry Total
Financial Advisor
▲
1,661.1
-46.1
2012
Rank
Sh (%)
▼
9
Deutsche Bank
15.3
2012
Rank
1
First NZ Capital 1,045.42
2011
Rank
48.5
US$m
522.2
1
4*Banco BTG Pactual SA -
4*
UBS
Asia (ex-Japan) Buyside Financial Sponsor Activity
▲
11.4
Market
4.2
▲
Share Ch.
▲
6.3
0.61.1
4.3
0.4
Industry % Change from Last Quarter
▼
Sh (%)
1.44.4▲ ▼
4
▼
Asia (ex-Japan) Rankings
35.0
-47.0%
-47
Australian Cross Border Announced M&A
▼
▲-84.6%
-75.5% ▼
100.0
Financial Advisor
-13.5% ▼
90
2
.2
Industry % Change from Same Period Last Year -67.7%
* tie
▼
1.5
-2
▼
-34.3%
17.2%
-79.4%
https://www.thomsonone.com
17%
15%
12%
10% 9%
7%
5%
4%
4%
3% 2% 2%
Energy and Power Materials Financials
Consumer Staples High Technology Real Estate
Telecommunications Industrials Media and Entertainment
Consumer Products and Services Healthcare Retail
Government and Agencies
0%
20%
40%
60%
80%
100%
$0
$10
$20
$30
$40
2Q
07
3Q
07
4Q
07
1Q
08
2Q
08
3Q
08
4Q
08
1Q
09
2Q
09
3Q
09
4Q
09
1Q
10
2Q
10
3Q
10
4Q
10
1Q
11
2Q
11
3Q
11
4Q
11
1Q
12
2Q
12
3Q
12
Ou
tbo
un
d
Ra
nk V
alu
e (
US
$b
)
Outbound (US$b)
Inbound (US$b)
% of Cross Border is Outbound
0%
5%
10%
15%
20%
25%
30%
$0
$5
$10
$15
$20
$25
$30
$35
$40
$45
$50
0.9 1.4 2004 2005 2006 2007 2008 2009 2010 2011 2012
% o
f A
sia
(e
x-J
ap
an
) V
olu
me
Ra
nk V
alu
e (
US
$b
)
Q4 Volume (US$b)
Q3 Volume (US$b)
Q2 Volume (US$b)
Q1 Volume (US$b)
% of Asia (ex-Japan) Volume YTD
17
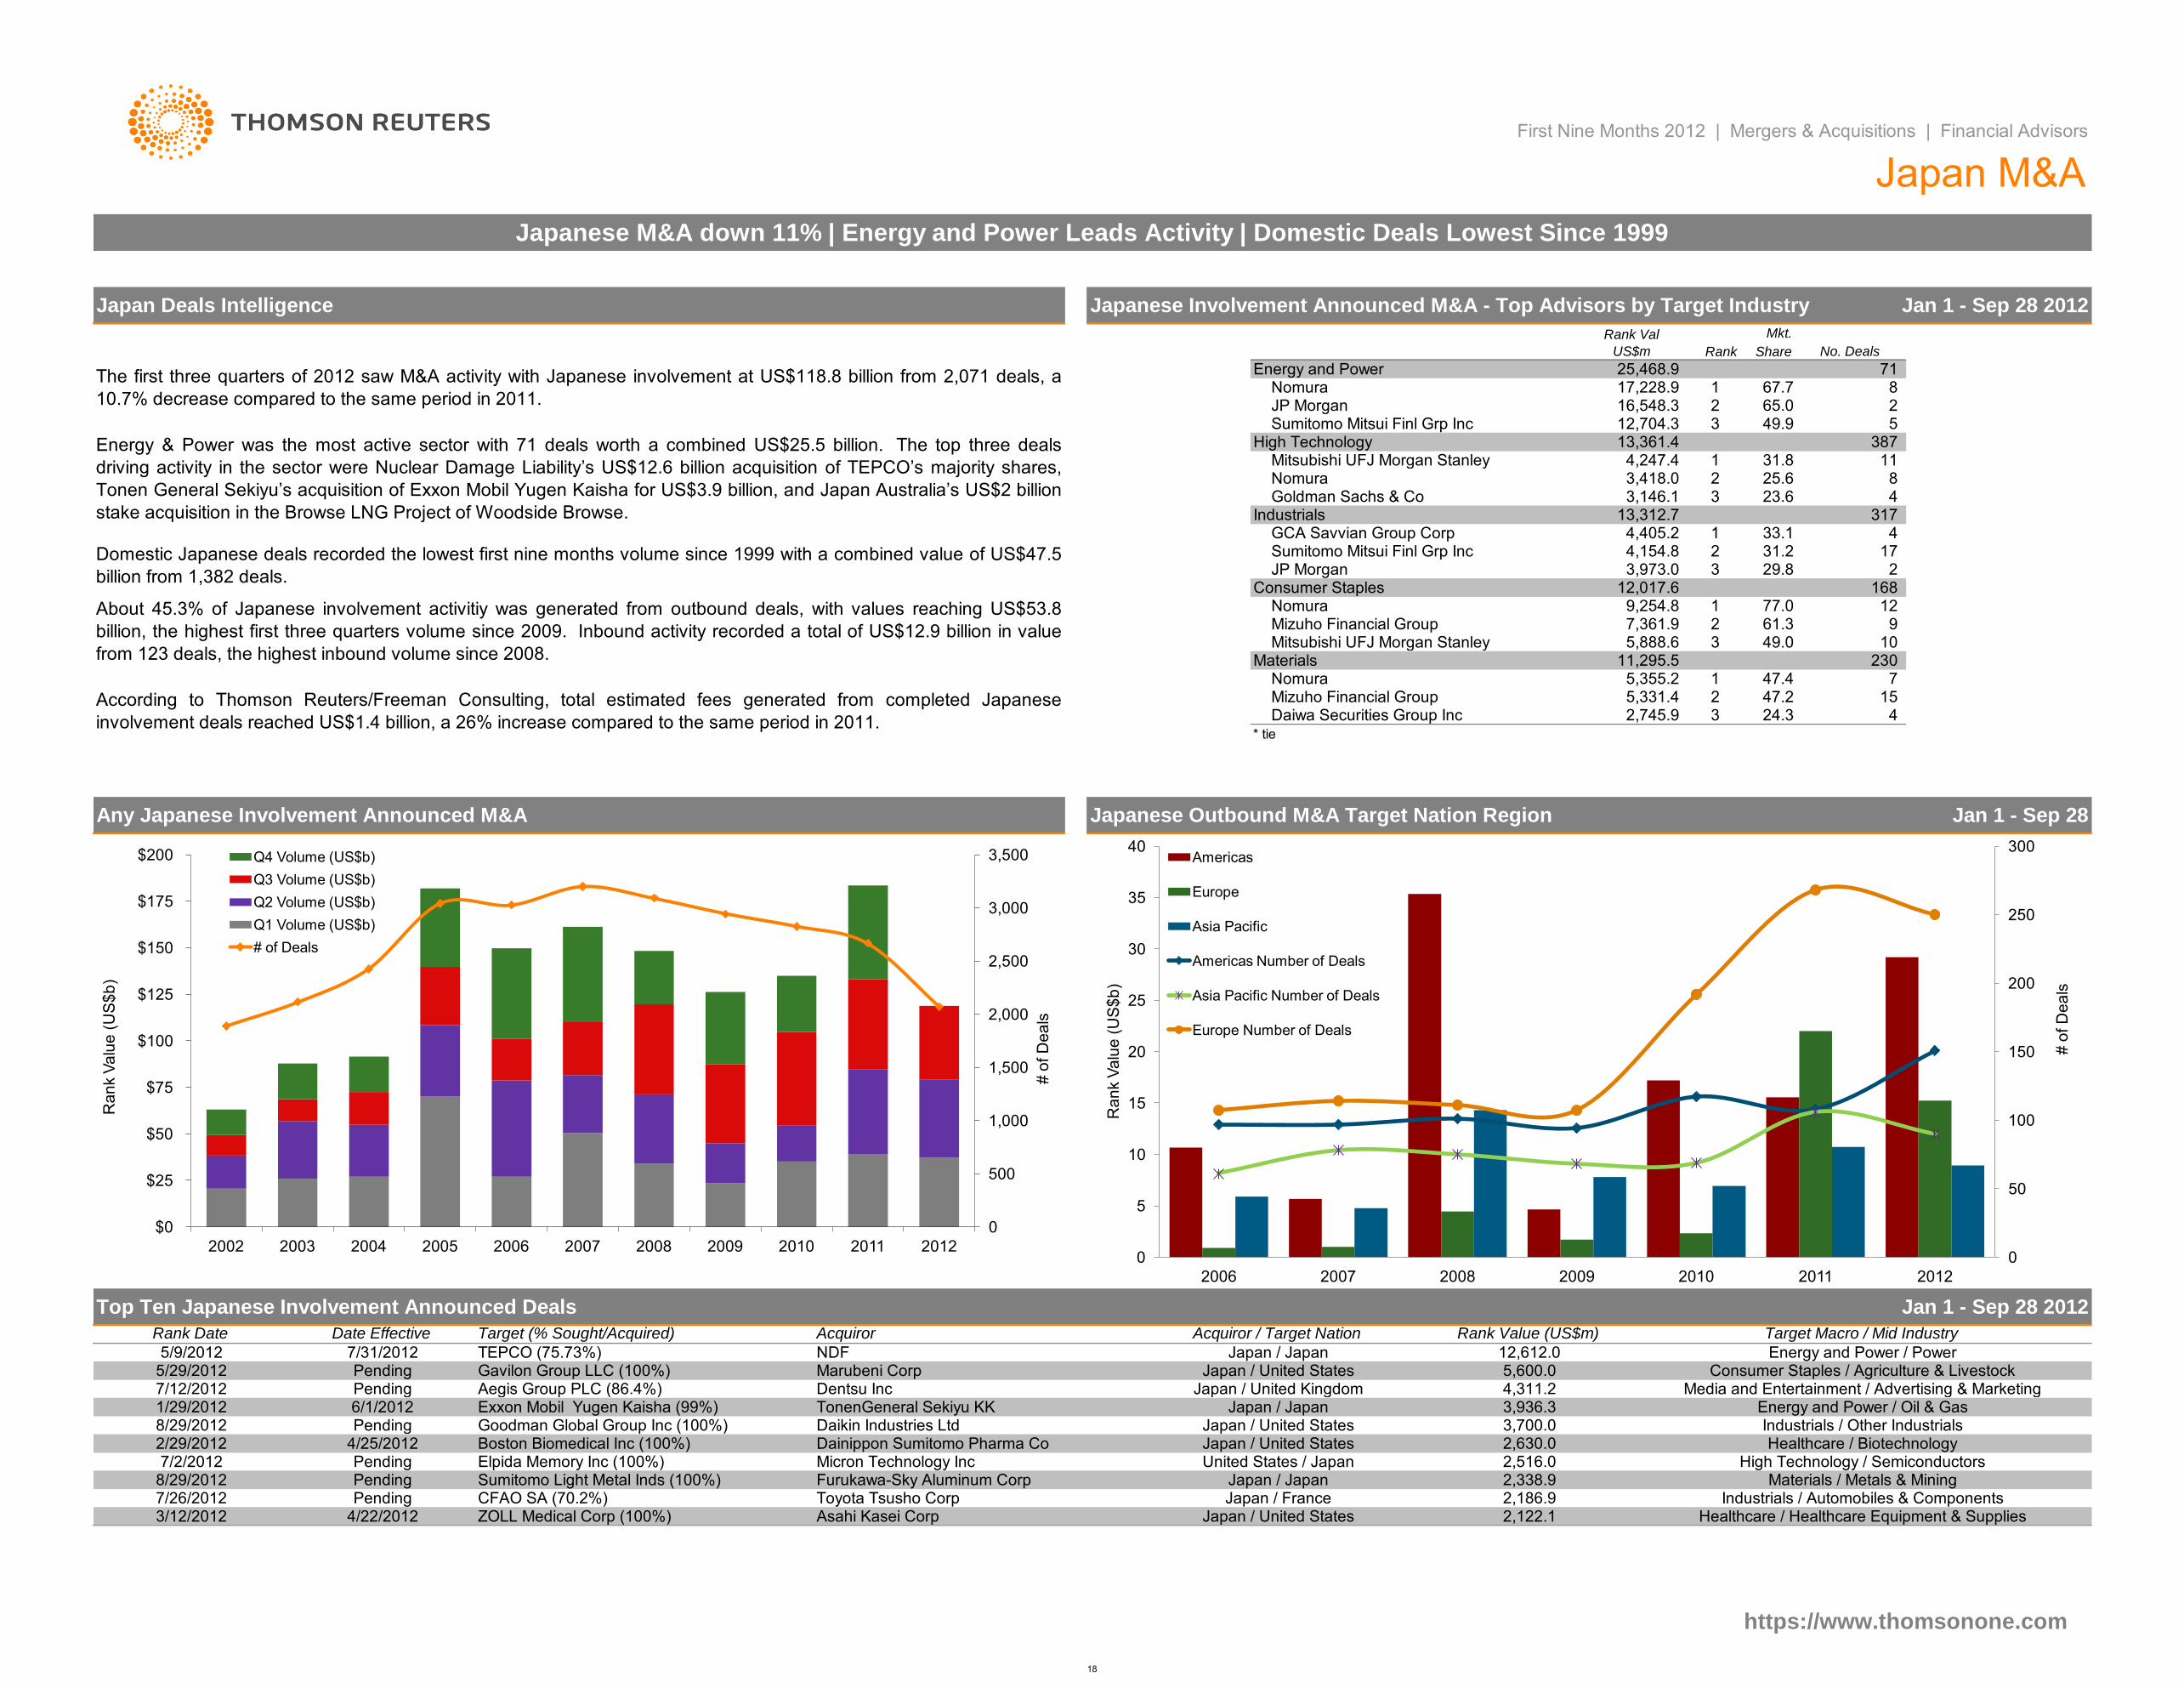
About 45.3% of Japanese involvement activitiy was generated from outbound deals, with values reaching US$53.8
billion, the highest first three quarters volume since 2009. Inbound activity recorded a total of US$12.9 billion in value
from 123 deals, the highest inbound volume since 2008.
According to Thomson Reuters/Freeman Consulting, total estimated fees generated from completed Japanese
involvement deals reached US$1.4 billion, a 26% increase compared to the same period in 2011.
Mitsubishi UFJ Morgan Stanley
* tie
Materials
JP Morgan
Nomura
Mizuho Financial Group
3
2 31.21
The first three quarters of 2012 saw M&A activity with Japanese involvement at US$118.8 billion from 2,071 deals, a
10.7% decrease compared to the same period in 2011.
Energy & Power was the most active sector with 71 deals worth a combined US$25.5 billion. The top three deals
driving activity in the sector were Nuclear Damage Liability’s US$12.6 billion acquisition of TEPCO’s majority shares,
Tonen General Sekiyu’s acquisition of Exxon Mobil Yugen Kaisha for US$3.9 billion, and Japan Australia’s US$2 billion
stake acquisition in the Browse LNG Project of Woodside Browse.
Domestic Japanese deals recorded the lowest first nine months volume since 1999 with a combined value of US$47.5
billion from 1,382 deals.
Nomura25,468.9
1
https://www.thomsonone.com
11,295.5
5
5,355.2 47.4
13,361.4
7/26/2012Healthcare / Healthcare Equipment & Supplies
Pending Japan / FranceJapan / United States3/12/2012
Target (% Sought/Acquired)Date Effective
7/12/2012
7/31/2012
Furukawa-Sky Aluminum Corp
5/29/2012
8/29/2012
TEPCO (75.73%)5/9/2012
Sumitomo Light Metal Inds (100%)7/2/2012
Pending
6/1/2012
Elpida Memory Inc (100%)2/29/2012
Pending
3
Japanese Outbound M&A Target Nation Region
NDF
Rank Date
Japan / Japan
Top Ten Japanese Involvement Announced Deals
Any Japanese Involvement Announced M&A
Jan 1 - Sep 28 2012
Nomura 3,418.0 Mitsubishi UFJ Morgan Stanley
23
2
Sumitomo Mitsui Finl Grp Inc
Energy and Power
16,548.3
First Nine Months 2012 | Mergers & Acquisitions | Financial Advisors
Japan M&A
Japanese M&A down 11% | Energy and Power Leads Activity | Domestic Deals Lowest Since 1999
3,146.1
4,247.4 1
67.7
Rank Val
US$m
8
JP Morgan
Industrials / Automobiles & Components
TonenGeneral Sekiyu KK
Pending
4,405.2
Mizuho Financial Group 5,331.4
Gavilon Group LLC (100%)
Dainippon Sumitomo Pharma CoDaikin Industries Ltd
ZOLL Medical Corp (100%)
Japan Deals Intelligence
12,704.3
17 3
Rank
17,228.9
11 High Technology
Goldman Sachs & Co
Mkt.
Share
2 49.965.0
3,973.0
No. Deals
23.6
4,154.8
387
15
25.6
2
4
2 47.2
Consumer Staples77.0
33.1 4
5,888.6 10
71
31.8
29.8
8
230
9
2,745.9 4 24.3Daiwa Securities Group Inc
Boston Biomedical Inc (100%)
Energy and Power / Power
Japan / United Kingdom
12,612.0
Rank Value (US$m)
Pending
1/29/2012
2,122.1Asahi Kasei Corp
2,630.0Goodman Global Group Inc (100%) 3,700.0
Pending
CFAO SA (70.2%)8/29/2012
4/22/2012
Acquiror
2,516.0
Toyota Tsusho Corp
5,600.0Marubeni Corp
Japan / United States
2,338.9Micron Technology Inc
4/25/2012
Aegis Group PLC (86.4%)Exxon Mobil Yugen Kaisha (99%)
Dentsu Inc
Acquiror / Target Nation
2,186.9
Healthcare / BiotechnologyJapan / United States
Japan / Japan
Consumer Staples / Agriculture & Livestock
High Technology / Semiconductors
Industrials / Other Industrials
United States / JapanMaterials / Metals & Mining
Energy and Power / Oil & Gas
Japan / United States
Japan / Japan
7 1
3,936.3
Jan 1 - Sep 28
12
GCA Savvian Group CorpSumitomo Mitsui Finl Grp Inc
Nomura 9,254.8
317
1
Target Macro / Mid Industry
Media and Entertainment / Advertising & Marketing4,311.2
27,361.9 3
61.3
Japanese Involvement Announced M&A - Top Advisors by Target Industry Jan 1 - Sep 28 2012
13,312.7 Industrials
49.0
12,017.6 168
0
500
1,000
1,500
2,000
2,500
3,000
3,500
$0
$25
$50
$75
$100
$125
$150
$175
$200
2002 2003 2004 2005 2006 2007 2008 2009 2010 2011 2012
# o
f D
ea
ls
Ra
nk V
alu
e (
US
$b
)
Q4 Volume (US$b)
Q3 Volume (US$b)
Q2 Volume (US$b)
Q1 Volume (US$b)
# of Deals
0
50
100
150
200
250
300
0
5
10
15
20
25
30
35
40
2006 2007 2008 2009 2010 2011 2012
Ra
nk V
alu
e (
US
$b
)
# o
f D
ea
ls
Americas
Europe
Asia Pacific
Americas Number of Deals
Asia Pacific Number of Deals
Europe Number of Deals
18
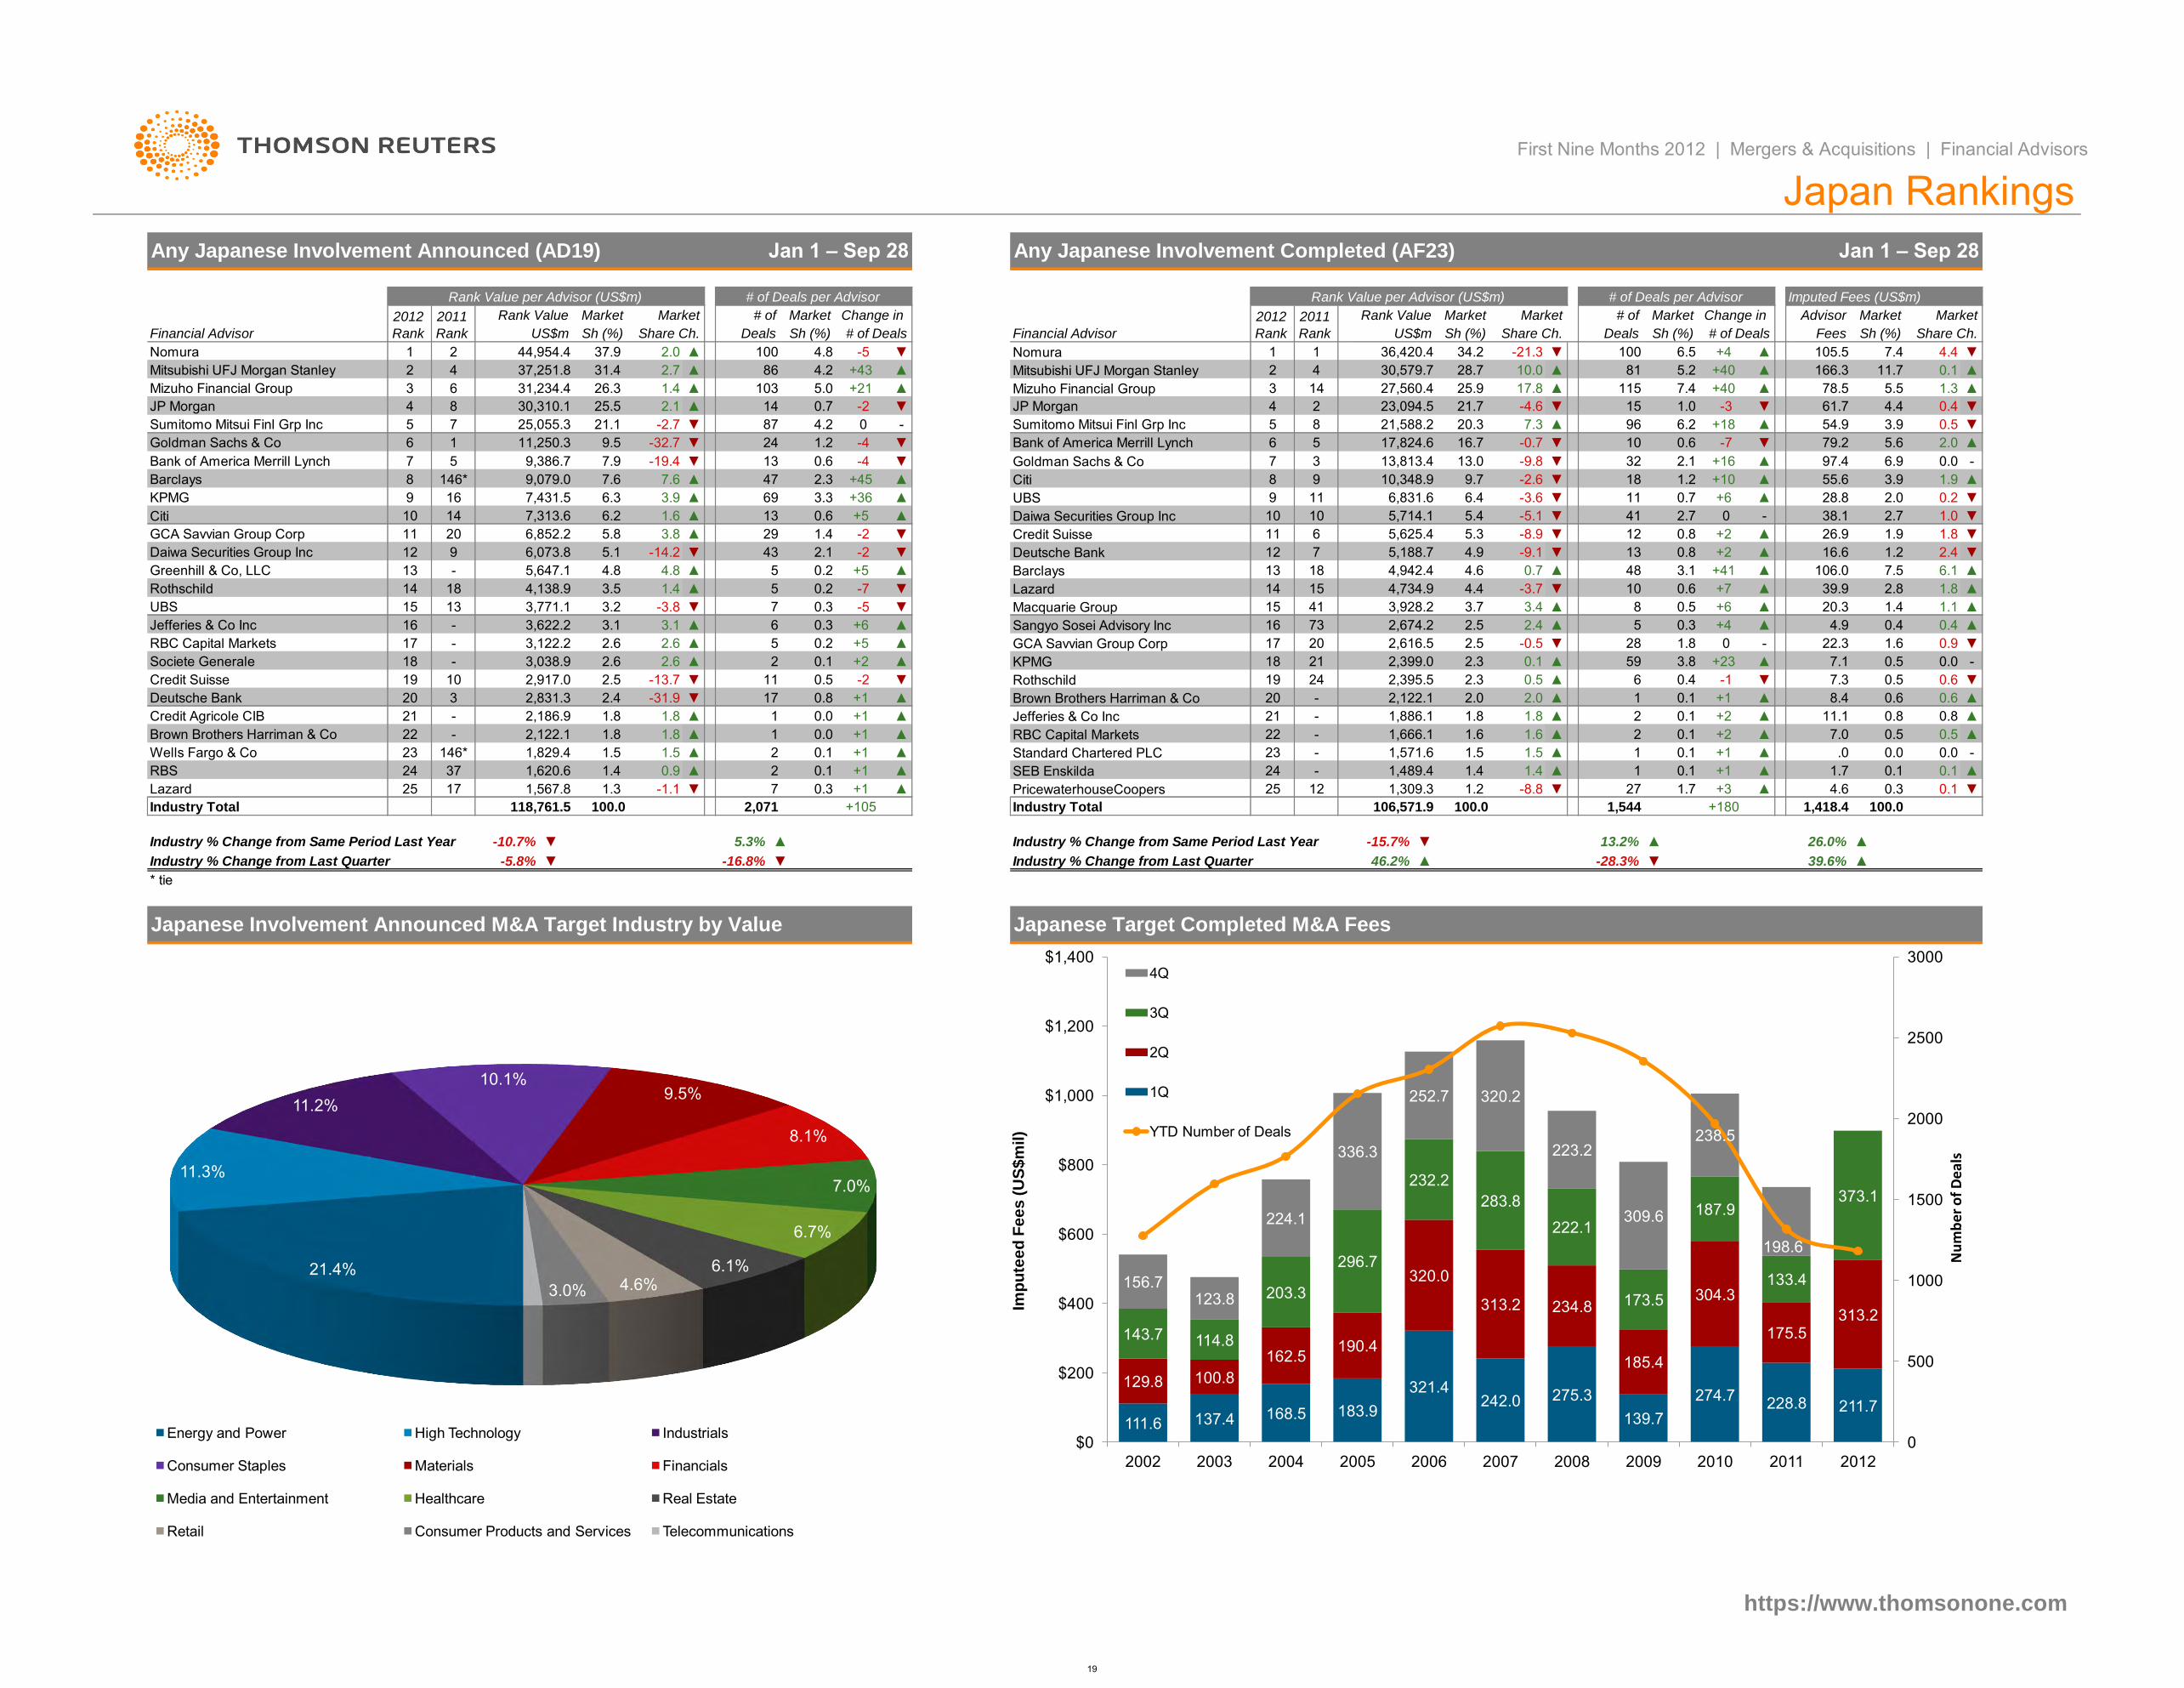
Imputed Fees (US$m)
Financial Advisor
Nomura
Mitsubishi UFJ Morgan Stanley
Mizuho Financial Group
JP Morgan
Sumitomo Mitsui Finl Grp Inc
Bank of America Merrill Lynch
Goldman Sachs & Co
Citi
UBS
Citi Daiwa Securities Group Inc
Credit Suisse
Deutsche Bank
Barclays
Lazard
Macquarie Group
Sangyo Sosei Advisory Inc
GCA Savvian Group Corp
KPMG
Rothschild
Brown Brothers Harriman & Co
Jefferies & Co Inc
RBC Capital Markets
Standard Chartered PLC
SEB Enskilda
PricewaterhouseCoopers
Industry Total
Industry % Change from Same Period Last Year Industry % Change from Same Period Last Year
Industry % Change from Last Quarter Industry % Change from Last Quarter
▲ ▲
7.0
17 1,567.8 1.2+1
+105 106,571.9
25
Japanese Involvement Announced M&A Target Industry by Value Japanese Target Completed M&A Fees
-8.8
100.0
13.2%▼▼
1,544
-15.7%
▼
+1
1,309.3
100.0
1.4 1.4
5.3%
▲
100.0 2,071118,761.5
* tie
-5.8%
-10.7%
▼
▲
0.31.3
▼ -16.8%
Industry Total
-23
1,489.4- ▲+1
1.51,571.6 1.5+11.5
Lazard -1.1 1225 ▼ ▲7
2▲
▲ 0.1
0.1
RBS 3724 20.91,620.6 24▲1.4 ▲ 1.70.1
+1
4.6+3
1
27 ▲
.0▲0.1
Brown Brothers Harriman & Co
21 - 2,186.9 1.8
22 - 2,122.1 1.8
+1
Wells Fargo & Co 23 146* 1,829.4 1.5
1.8 1 0.0
Credit Agricole CIB 1.8 -1 0.0
0.6+1
▲
8.4
11.11.8 1.8 ▲ 0.8+20.1
0.1
▲
2.0
2,395.5
0.8
▲
0.5▼
0.62.0
2▲
▼ 0.8 +1
2.5 0.5 -2
-31.9 172.4
11
01.8
Deutsche Bank 20 3
Credit Suisse 19 -1
▲2,831.3
2.618 - 3,038.9 2.6
-13.7
2.617 - 3,122.2 ▲
10 2,917.0 ▼
0.52 0.1 2.3 0.1
22.3
▲
-+5
3.8
28
3,622.2
20
▲ 16▲ 2.4
-0.5
2,674.2
2.6
18+2
5
0.4+4▲ 0.3
2.5
52.5
1.6
6
7▼
▲
-3.8
4.93.1 0.3 +6
20.30.53.7 ▲+641 3,928.2
5 0.2 -3.7▲1.4
1.4
-7 ▼ 4.414 ▼
83.4 ▲0.3
1015
-5 15▼
48
5,188.7
18 4.64,942.4
4.97
0.7
-9.1
▲
13 0.8▼ +2 16.6▲
▲
3.1 7.5+41 106.0▲
39.9+70.6
4.8 ▲ 5 ▲+5
▼ ▼-243 2.1
29 11
0.6
▼
▲8
+36
10,348.9 18
10
0.6
13.0
10
-9.8
79.2▼
+163
9 ▼
-5.1
3.9
2.0▲0.7
-2.6 +10
6
13,813.4
9621,588.2 20.3 7.3
▼5
▼7
14
04.2 6.25 ▲8
4 ▼▼
▲
9
-4
▲
▼
87
69
24 1.2 -4
▲
▼
▲
1
▲ +1
▲
▲
3
0.7
-
13
▼
13
+4547
0.6
-2 2
+46.5
23,094.5 15
100▼
+40▲
▲
10.0 5.281
10
9.7
-0.7
32
16.7
+6
1
2
Sumitomo Mitsui Finl Grp Inc
4
5
Nomura
Mizuho Financial Group 3
Jefferies & Co Inc 16 -
RBC Capital Markets
Mitsubishi UFJ Morgan Stanley
7
13
9
14
Barclays
25,055.3 21.1
3.2
- 5,647.1
4,138.9
8
11
146*
10
16
UBS 15
8
7
1.2
-3.6 ▼
-8.9 ▼ ▲0.8 +2
-041 2.7▼6.2
5,625.4 125.33.8
1.6 ▲
6,831.6▲ 11
6
3.9
-32.7
-19.4
7.6
5.4
6.4
▲
▲
▲
-
▼
1.8
6.1
0.0
0.1
0.1
▲
26.9
5.6
▼2.7
2.8
55.6
1.8
28.8
97.4
▲
▼
0.0 -6.9
▲
38.1
0.4
2.4
0.2
▼
1.9
▼
0.5
▼
1.0
2.0
▼
0.1
105.5 7.4
▲
▲11.7
4.4
5.5 1.3
Sh (%) # of Deals
1.4 -2
11,250.3
5.8
+5
6,852.2
7,313.6
9,079.0
Greenhill & Co, LLC 4.8
Rothschild 3.5
▲
GCA Savvian Group Corp
18
20
3,771.1
3.1
1.9
▼1.2
▲
▲
1.7
19 24▼
17
-
46.2%
https://www.thomsonone.com
1 0.0
22 1.6 0.50.1 +21,666.1 ▲ 0.5
0.1
▲ +2359
▼
1.6
2,122.1 1
0.5 0.42.3
7.1
6 7.3
2▲
-28.3%
1,886.1
4,734.9
5,714.1
21
21
20
2,399.0
73
2,616.5
-
▲▼ 39.6%
1,418.4
▲
0.3
26.0% ▲
+180
▼
0.4
0.6
1.1
0.9
0.0
▲
-
▲
▼
17,824.6
11
▲
2.1
+18
21.7 -4.6 1.0
+40
-7
61.7
▲
▼
▲
-3
3.954.9
4.4
+21 78.5
▲
34.2
17.8
36,420.4 -21.3
+43 28.7
▲
1-5 ▼
166.3
▲25.914 7.4 ▲1155.0
4 30,579.7
103 27,560.4
2
4.8
4.2
First Nine Months 2012 | Mergers & Acquisitions | Financial Advisors
Any Japanese Involvement Completed (AF23)
# of
Sh (%) Share Ch. # of Deals
MarketMarket Change in MarketMarket Advisor
Sh (%) Sh (%)
2011
Rank
Rank Value
Deals
Japan Rankings
US$m Fees
2012
Rank
Rank Value per Advisor (US$m)
Share Ch.
MarketChange in # of
Any Japanese Involvement Announced (AD19)
Rank Value
Rank Value per Advisor (US$m)
2012
Rank
Jan 1 – Sep 28
Market Market
-14.2
7.6 ▲
130.2
125.1
6.3
2.3
3.3
▲
▲0.2
Societe Generale ▲
US$m
KPMG
Financial Advisor
31.44
44,954.4
7,431.5
9,386.7
Sh (%)
9.5
7.9
6
5
9
Daiwa Securities Group Inc 12
13
14
6,073.8
2.7
▲
▼
31,234.4 1.4
Bank of America Merrill Lynch
JP Morgan
Goldman Sachs & Co 6 1
100
▲
▲37,251.8
2.037.9 ▲
26.3
86
2
▼
25.530,310.1
-2.7
2.1
2011
Rank
Market
Share Ch. Deals
# of Deals per Advisor# of Deals per Advisor
Jan 1 – Sep 28
21.4%
11.3%
11.2%
10.1% 9.5%
8.1%
7.0%
6.7%
6.1% 4.6% 3.0%
0.9%
Energy and Power High Technology Industrials
Consumer Staples Materials Financials
Media and Entertainment Healthcare Real Estate
Retail Consumer Products and Services Telecommunications
111.6 137.4 168.5 183.9
321.4 242.0 275.3
139.7
274.7 228.8 211.7
129.8 100.8
162.5 190.4
320.0
313.2 234.8
185.4
304.3
175.5 313.2
143.7 114.8
203.3
296.7
232.2
283.8
222.1
173.5
187.9
133.4
373.1
156.7 123.8
224.1
336.3
252.7 320.2
223.2
309.6
238.5
198.6
0
500
1000
1500
2000
2500
3000
$0
$200
$400
$600
$800
$1,000
$1,200
$1,400
2002 2003 2004 2005 2006 2007 2008 2009 2010 2011 2012
Nu
mb
er o
f D
eals
Imp
ute
ed
Fe
es
(U
S$
mil)
4Q
3Q
2Q
1Q
YTD Number of Deals
19
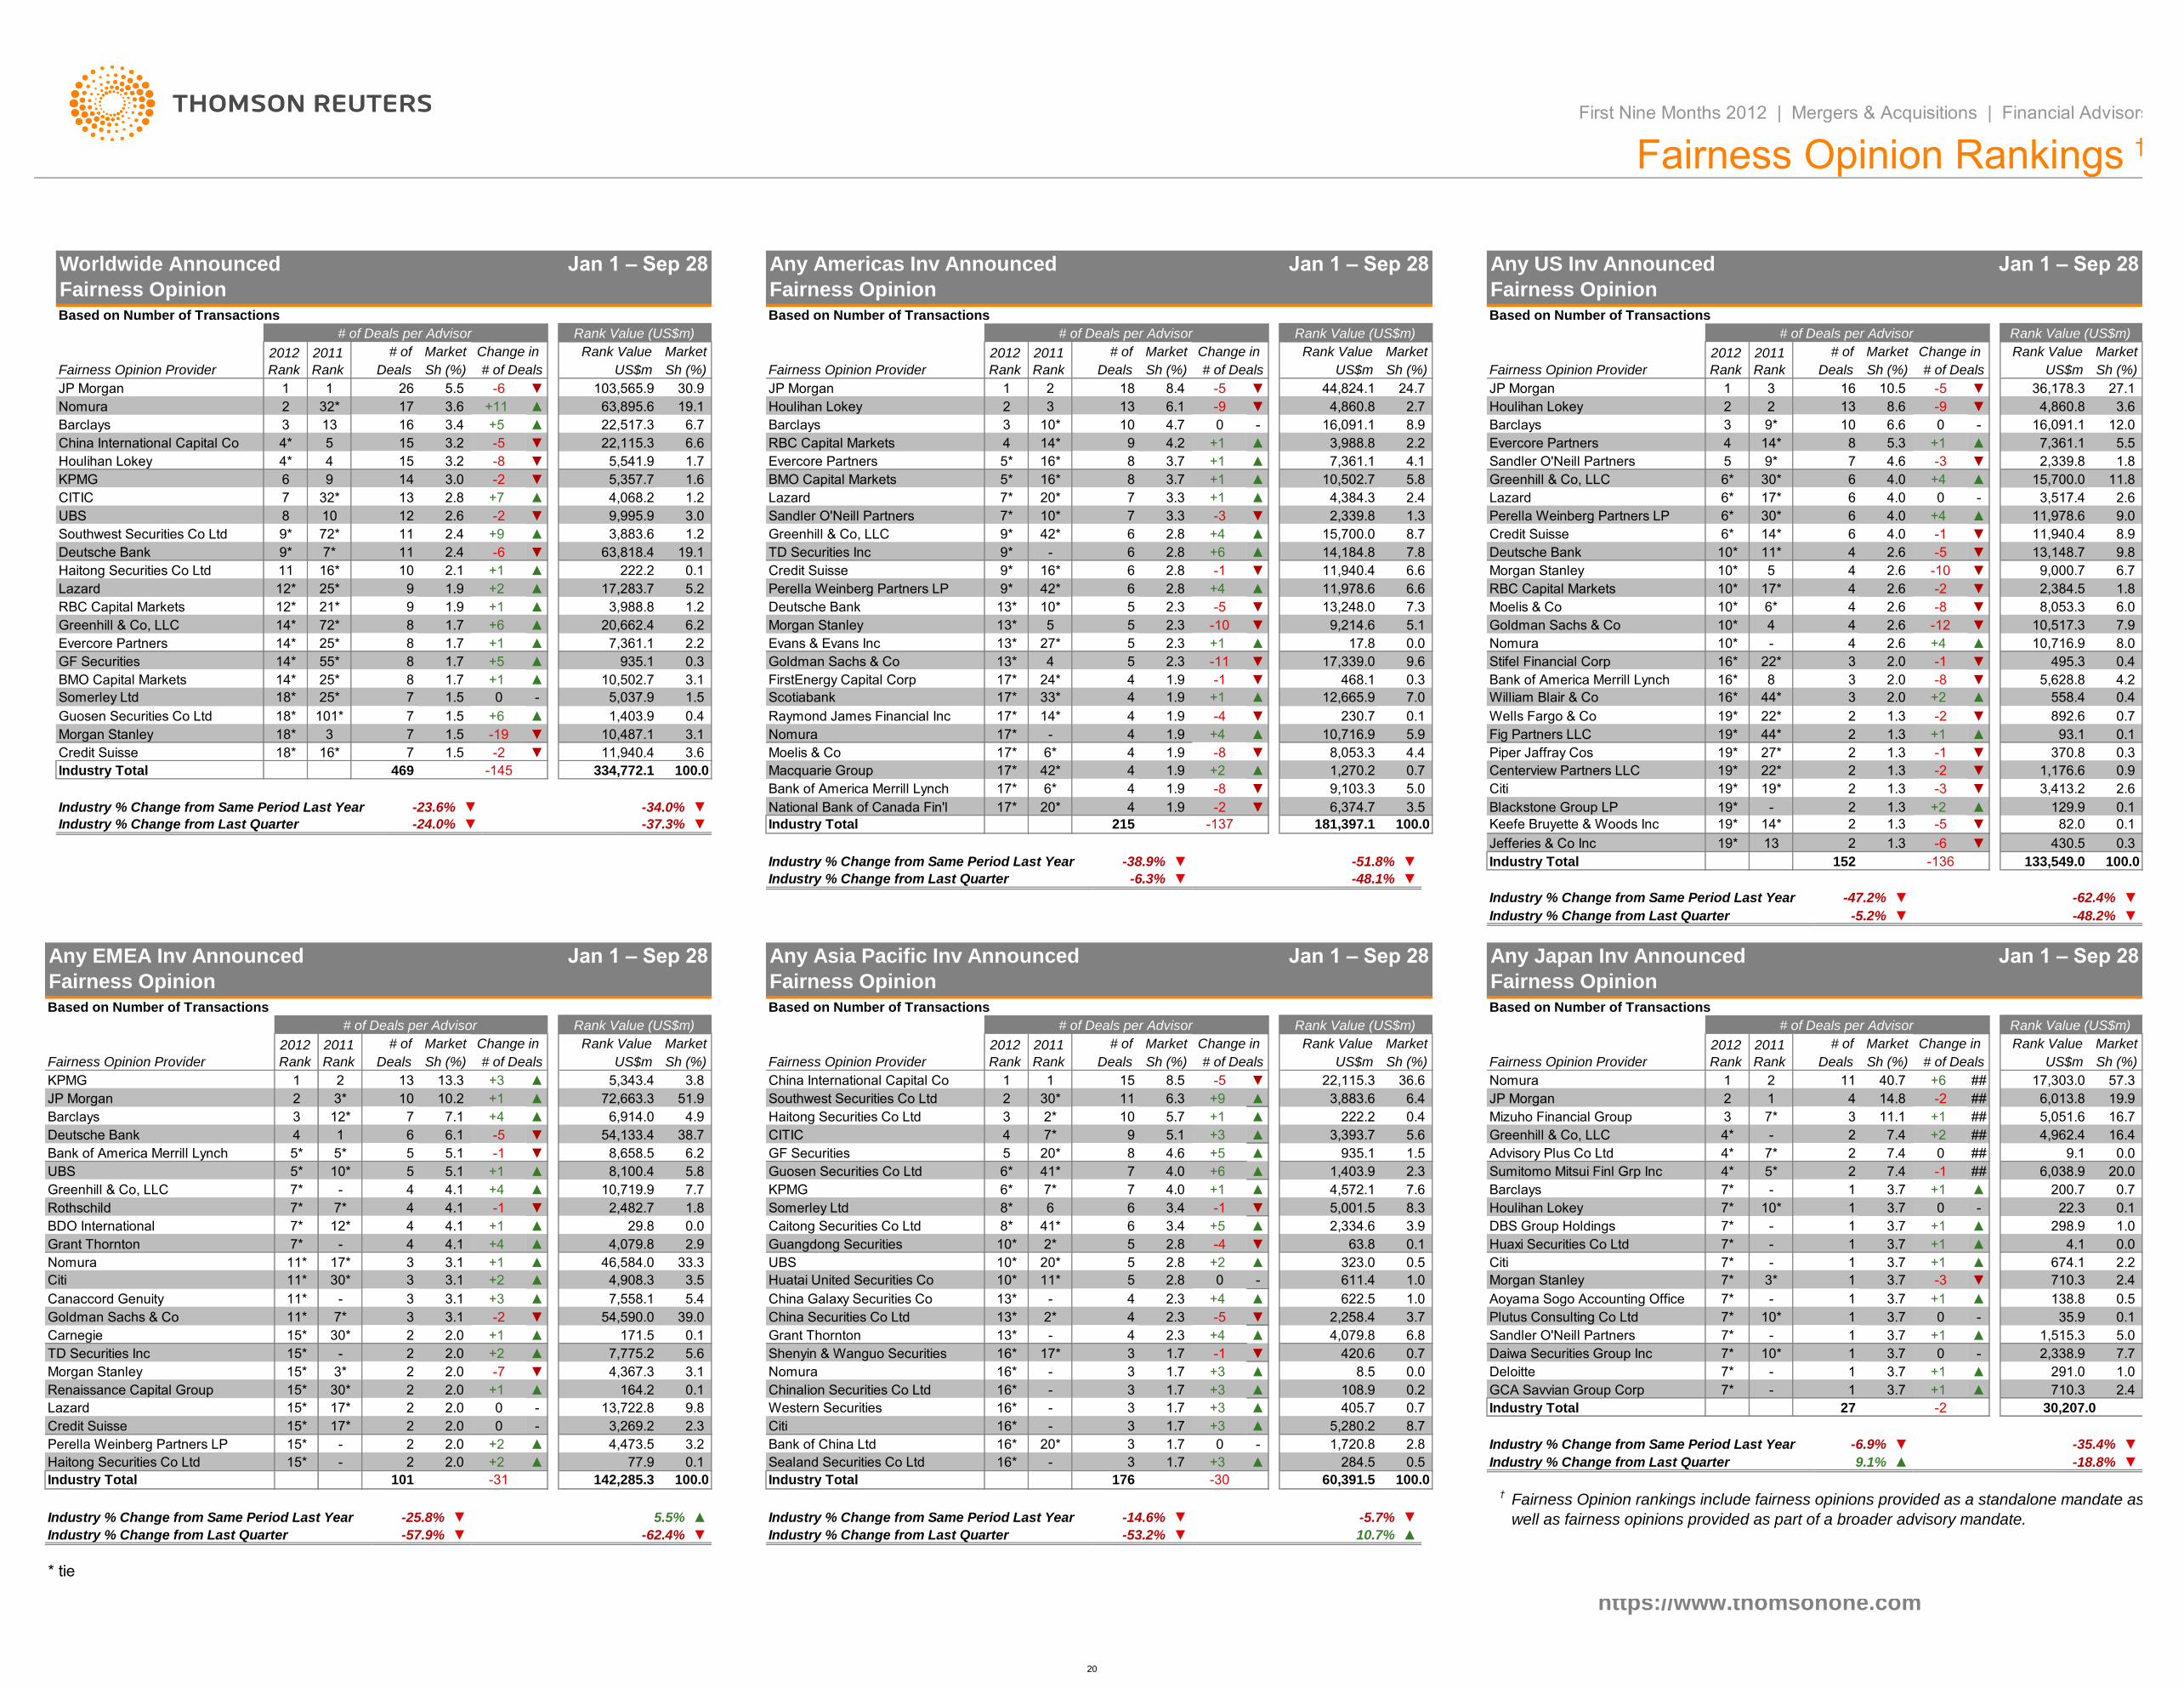
Industry Total
Industry Total
https://www.thomsonone.com
710.3 2.4
0.1
1,515.3 5.0
2,338.9 7.7
291.0 1.0
▲
4.1 0.0
674.1 2.2
710.3 2.4
138.8 0.5
35.9
1 3.7 0 -
1 3.7 +1 ▲
1 3.7 0 -
1 3.7 +1 ▲
1 3.7 -3 ▼
1 3.7 +1 ▲
1 3.7 +1 ▲
1 3.7 +1 ▲
0.3
7*
7*
7*
7*
7*
-
-
3*
-
0.9
3,413.2 2.6
129.9 0.1
82.0 0.1-5 ▼
1.3 -6 ▼
1,176.6
430.5
-2 ▼
1.3 -3 ▼
1.3 +2 ▲
2
2
2
2
2
1.3
1.3
Centerview Partners LLC
Citi
Blackstone Group LP
Keefe Bruyette & Woods Inc
Jefferies & Co Inc
22*
-
14*
13
19*
19*
19*
19*
19*
19*
7*
1.9 -2 ▼
1,270.2 0.7
9,103.3 5.0
6,374.7 3.5
1.9 +2 ▲
1.9 -8 ▼
42*
6*
20*
4
4
4
17*
17*
17*
Macquarie Group
Bank of America Merrill Lynch
National Bank of Canada Fin'l
Fairness Opinion rankings include fairness opinions provided as a standalone mandate as
well as fairness opinions provided as part of a broader advisory mandate.
†
Any EMEA Inv Announced
Fairness Opinion
Any Asia Pacific Inv Announced
Fairness Opinion
7*
7*
7*
Daiwa Securities Group Inc
Any Americas Inv Announced
Fairness Opinion
Credit Suisse
Jan 1 – Sep 28 Jan 1 – Sep 28
Sandler O'Neill Partners
Evercore Partners
10
22,517.3 6.7
Huaxi Securities Co Ltd
Citi
Morgan Stanley
Aoyama Sogo Accounting Office
Plutus Consulting Co Ltd
Sandler O'Neill Partners
-18.8% ▼
+3 ▲
-35.4%
+3
0.5
1 3.7 +1
▼ 420.6 0.7
Industry % Change from Same Period Last Year -6.9% ▼-
Deloitte
GCA Savvian Group Corp
20.0
▼
Industry Total 27 -2 30,207.0
5* 2 7.4 -1 ##
4,962.4
6,038.9
16.4
2 7.4 0 ## 9.1 0.0
## 5,051.6 16.7
Greenhill & Co, LLC 4* - 2 7.4 +2 ##
Mizuho Financial Group 3 7* 3 11.1 +1
57.3
JP Morgan 2 1 4 14.8 -2 ## 6,013.8 19.9
US$m Sh (%)
Nomura 1 2 11 40.7 +6 ## 17,303.0
# of Deals
Rank Value (US$m)
2012
Rank
2011
Rank
# of Market Change in Rank Value Market
Sumitomo Mitsui Finl Grp Inc 4*
Any Japan Inv Announced
Fairness Opinion
Jan 1 – Sep 28
Based on Number of Transactions
# of Deals per Advisor
Fairness Opinion Provider Sh (%)
7*
16* 17* 3 1.7
16* 20* 3 1.7
3 1.7
16*
3
16* - 3
16*
- 3
-
3
1,720.8 2.8
284.5 Industry % Change from Last Quarter 9.1% ▲
▼
▲
8.5 0.0
100.0
5,280.2 8.7
0.7
60,391.5
Industry % Change from Last Quarter -53.2% ▼ 10.7%
176
Industry % Change from Same Period Last Year -14.6% -5.7%
+3 ▲
▲
1.7 405.7
0
1.7 +3
▼
16* - 1.7 ▲
-30
16* -
4,079.8 6.82.3
▲ 108.9 0.2
▲
+3
1.7
-1
2* 4 2.3 ▼ 2,258.4 3.7-5
- 4 2.3
0
13* - 4 +4
13*
13* +4 ▲
0.5
- 611.4 1.0
622.5 1.0
10* 11* 5 2.8
▲ 323.0+210* 20* 5 2.8
41* 6 3.4
10*
2,334.6
2* 5 2.8 -4
▲
▼
8*
0.1
-1 ▼ 5,001.5 8.3
3.9
63.8
+1
+5
8* 6 6 3.4
6* 7* 7 4.0
935.1 1.5+5
▲
3,393.7
▲
1,403.9 2.3
4,572.1 7.6
6* 41* 7 +6
5
4
20* 8
7* 9
0.4+1
+96.3
5.1
4.0
4.6
+3 ▲
▲
2* 10
1 15
2
5.6
5.7
6.4
▲ 222.2
Sh (%)
11
Sh (%) # of Deals US$m
36.6-5 22,115.3▼
MarketRank Value
9.8
3.1
0.1
3.8
Market
3,883.6
UBS
Market
164.2
13,722.8
- 3,269.2 2.3
Industry % Change from Last Quarter -57.9% ▼ -62.4%
Industry % Change from Same Period Last Year -25.8%
▼
▼ 5.5% ▲
142,285.3 100.0-31
2.0 ▲+1
0 -2.0
2.0
2.0
15* - 2.0
15* 3*
2
2
54,590.0
▲ 7,775.2 5.6
-7 ▼ 4,367.3
+2
-2
15* +1 ▲ 171.5 0.1
7,558.1 5.4
▼ 39.0
▲
3.1
2.9
+2
+1 ▲ 46,584.0 33.3
▲ 4,908.3 3.5
+4
2,482.7
4,079.8
1.8
29.8 0.0
▼
▲
3.1
7*
412* 4.1
▲7* 4.14-
10,719.9 7.7
7* 4.1
7* +1
-1
▼ 8,658.5
4.1
6.2
+4
+1 ▲ 8,100.4 5.8
▲
3 7.1 +4 6,914.0 4.9
-1
-5 ▼ 54,133.4
▲
5
55*
5*
4 1
7
6
5* 5.1
4,068.2
US$m
Rank Value
2
2.4
▲
19.1
7,361.1 2.2
1.2
3.0
6.1 38.7
▲ 3,883.6 1.2
2012
Rank
3* 10.2 +1
13.3
2
11
63,895.6 Houlihan Lokey
Sh (%)
# of DealsSh (%)
5,541.9 1.7
▼5.5
22,115.3
32*
2012
Rank
# of Market Change in Market
-6
3.6 19.1
US$m
4* 5
3 13
▲
Market
+5
2011
Rank
Change in
6
3.215
▲3.4
-5 ▼
16
4*
14
15 3.2 -8 ▼
2.8 +7 ▲
9 3.0 -2 ▼
13
16*
-6
+1
12 2.6 -2
+9
10
7* 119*
5,357.7
9* 72* 11 2.4
8 ▼
7 32*
1.9 +1 ▲
9 1.9 +2 ▲
9
1.6
2.4
2,339.8
+1
3.3
5*
1.2
5.8
▲ 15,700.0 8.7
▼
4,384.3
10*
▼ Deutsche BankTD Securities Inc
17,283.7 5.2
9*
7.8
▲
63,818.4
935.1
20,662.4
3,988.8
6.2 Morgan Stanley
222.2 0.1
Barclays
Sandler O'Neill Partners
14,184.8
Lazard
Perella Weinberg Partners LP
Credit Suisse
8.9
3,988.8 2.2
4.1
JP Morgan
Fairness Opinion Provider
Houlihan Lokey
Evercore Partners
Greenhill & Co, LLC
Perella Weinberg Partners LP
Credit Suisse
10*
20* 7
Lazard
RBC Capital Markets
Greenhill & Co, LLC
+555*
8
1.7
8
1.7
872*
-145
▲
▲
18* 7
1.7
+6
2.1
1,403.9
14* 25*
1.5
25*
1.7 +1
1.5
14*
Raymond James Financial Inc▲
0 -
18*
11,940.4 3.6
+6
18*
FirstEnergy Capital Corp
+1 ▲
Goldman Sachs & Co
Scotiabank
10,502.7
0.3
3.1
▲
5,037.9
▼
7
1.5
▼
0.4
3 10,487.11.5
100.0
Southwest Securities Co Ltd
Haitong Securities Co Ltd
14*
12*
8
25*
21*
Deutsche Bank
14* 25*Evercore Partners
12*
1.3
+1
-3
7*CITIC
UBS
Deutsche Bank
Evans & Evans Inc
China International Capital Co
Houlihan Lokey
16*KPMG
7
Lazard
BMO Capital Markets
6.6
7*9,995.9
▲
▲
▲
3.7 7,361.1
10,502.7
3.3
+1
2.7
▲
3 10* 10 4.7 0
4 14*
44,824.1
Barclays
24.7
2 3 13 6.1 -9 ▼
16,091.1
4,860.8
Market
US$m Sh (%)
1 2 18 8.4 -5 ▼
Rank ValueMarket
Deals Sh (%)
JP Morgan103,565.9
# of
Sh (%)
2011
Rank
30.9
Rank Value2011
Rank Deals
+11 ▲2
1 1 26
Greenhill & Co, LLC
Based on Number of Transactions
# of Deals per Advisor
Change in
# of Deals
4.2
Fairness Opinion Provider
-
8
9RBC Capital Markets +1
5* 16*
9* 42* 6 2.8
8 3.7
9*
-1 ▼
- 6 2.8 +6
16*
▲
2.3
6 2.8 6.6
13*
9* 42* 6
-10
13*
2.8
5
+4
▼ 13,248.0
▼ 9,214.65 2.3
5
13* +1
-11
2.327* 5
5 2.313* 4
▼
-4 ▼ 230.7 0.1
11,940.4
▲
-5
+4
-5.2% ▼
▼
11.8
8.9
9.8
2.6
9.0
Fairness Opinion Provider
10,716.9
Industry Total 133,549.0
17*
8.5
11,940.4
17*
152
17* 24*
100.0
5.9
6 4.0
6* 17*
11,978.6
-
+4 ▲
Stifel Financial Corp
0.3
6* 30*
10*
▼
▼
22*17,339.0 9.6
11,978.6
0.0
6.6
-5
6 4.0
1.87 4.6
15,700.0
1.8
+1 ▲ 7,361.1
0
+4
2,339.8▼
3,517.4
▲30*
-3
Huatai United Securities Co
6*
6*
-1
4
6
14*
6.7-10 ▼ 9,000.7
4
▼ 2,384.52.6 -2
6.0
▼
3.6
27.11 3 16 10.5
8.6 -9 ▼
14*4
-
5.5
6.6 16,091.1
8 5.3
0 12.03
Any US Inv Announced
Fairness Opinion
GF Securities
2 2 13
9* 10
▼
2012
Rank
2011
Rank
# of Market Change in
Deals Sh (%) # of Deals
# of Deals per Advisor
MarketRank Value
Sh (%)
13,148.710* 11* 4 2.6
-5
4.0
5 9*
Morgan Stanley 10* 5 4 2.6
6 4.0
468.1
10* 4
RBC Capital Markets
10* 6*
12,665.9
5.1
Nomura▲
Bank of America Merrill Lynch
17* 4
7.3
▲
Moelis & Co
Goldman Sachs & Co
8 3
8,053.3
495.3
▼
1.9 +1
1.9
17.8 10* -
-1
2.0
2.0
2.6
-47.2% -62.4%
-8 ▼
181,397.1
16* 3
Industry Total
2
101
15* 17*
+2
Lazard
15* 30*
+44 2.6
4 2.6
▼ -48.1%
5.1
5,343.4+3
72,663.3
11*
Goldman Sachs & Co
30*
11*
1
12*
17*
Industry % Change from Same Period Last Year
# of Deals per Advisor
-8
Rank Value (US$m)
Industry % Change from Last Quarter
-12
▼
7.0
4
16*
+41.9
1.9
William Blair & Co 16*
4
4
14*
-19 ▼
▲
▲
-48.2%
▼
Nomura
334,772.1
Industry % Change from Last Quarter -6.3%
4
▼
Rank Value (US$m)
33*
Industry % Change from Last Quarter
US$m
36,178.3
4,860.8
8.0
10,517.3 7.9
Industry Total
# of
Deals
13
Haitong Securities Co Ltd
CITIC
3
Sh (%)
51.9
▲
3.1
30*
3
3
2.0
3.1
2
7*
Somerley Ltd
Guosen Securities Co Ltd
2012
Rank
Based on Number of Transactions
# of Deals per Advisor
Deals
30* ▲
Change in
3
Bank of America Merrill Lynch
1.9 ▼
-136
-1 ▼
▼-51.8%
215
2.0
2.0
2.0
First Nine Months 2012 | Mergers & Acquisitions | Financial Advisors
Fairness Opinion Rankings †
Rank Value (US$m)
Worldwide Announced
Fairness Opinion
Jan 1 – Sep 28
Based on Number of TransactionsBased on Number of Transactions
GF Securities
BMO Capital Markets
# of Deals
2012
Rank
4
Barclays
Fairness Opinion Provider
JP Morgan
Nomura 17
3.1
Jan 1 – Sep 28
44* 3
Rank Value (US$m)Rank Value (US$m)
0.4
-8 ▼ 5,628.8 4.2
# of Deals per Advisor
Jan 1 – Sep 28
10,716.9
Barclays
Deutsche Bank
* tie
10*
Haitong Securities Co Ltd 15*
UBS
- 2
Nomura
Carnegie
TD Securities Inc
-
Morgan Stanley
11*
2
11*
0
Perella Weinberg Partners LP 15* 2-
17*
10*
-
10*
-
-
Canaccord Genuity
Grant Thornton
Chinalion Securities Co LtdRenaissance Capital Group
+3
4
4
Grant Thornton
Credit Suisse 15* 2
3
Greenhill & Co, LLC -
17*
6*
Based on Number of Transactions
469
Citi
Fairness Opinion Provider
KPMG
JP Morgan
Rothschild
7*
18* 16* 7 1.5 -2
BDO International
Guangdong Securities
17*
Guosen Securities Co Ltd
7
101*
Somerley Ltd
10
Industry % Change from Same Period Last Year -23.6%
-24.0%
Morgan Stanley
Citi
KPMG
# of
China Galaxy Securities Co
China Securities Co Ltd
Western Securities
Shenyin & Wanguo Securities
Nomura
Southwest Securities Co Ltd
Caitong Securities Co Ltd
-
▼
2011
Rank
-38.9%
Deals
Moelis & Co 4.4
▼
-137▼ -37.3%
8,053.3
1
100.0
-34.0% ▼
China International Capital Co
0.1
4,473.5+2 3.2
Sealand Securities Co Ltd
Bank of China Ltd
77.9
▲
Advisory Plus Co Ltd
-2Wells Fargo & Co 19* 22* 2 1.3
4*
Industry % Change from Same Period Last Year
Fig Partners LLC
558.4 0.4
+1
▼ 892.6 0.7
0.1
+2 ▲
19* 44* 2 1.3 93.1▲
▼ 370.8 0.3Piper Jaffray Cos 19* 27* 2 1.3 -1
Barclays
Houlihan Lokey
DBS Group Holdings
7*
7*
7*
-
10*
-
1
1
1
3.7
3.7
3.7
+1
0
+1
0.7
0.1
1.0
▲
-
▲
200.7
22.3
298.9
20

-
-
-
-
-
-
-
-
-
League tables, commentary, and charts citing announced activity are based on Rank Date and include intended, pending, partially complete, completed, pending regulatory, and
unconditional transactions. Rank Date is defined as the earliest public announcement of when a value can be applied to a transaction.
League table volumes for Mitsubishi UFJ Financial Group and Morgan Stanley, included herein reflect the changes after the commencement of their jointly established securities firms
in Japan: (1) Mitsubishi UFJ Morgan Stanley Securities and (2) Morgan Stanley MUFG Securities. Accreditation for transactions involving the newly established joint ventures are
reflected in totals for Morgan Stanley. For Japanese related rankings, Morgan Stanley is represented as "Mitsubishi UFJ Morgan Stanley”.
Any Involvement league tables include deals where the target, acquiror, or either ultimate parent are domiciled (nation of headquarters) in the specified region or nation. Any
involvement league tables also include the nation of the seller and seller ultimate parent on privately negotiated stake purchases
Japan
Tel: +813 6441 1158
Financial and legal advisors receive full credit for each deal on which they provide financial or legal advisory services, unless they represent minority sellers or advise on only a portion
of the transaction or Thomson Reuters has not been made aware of their participation in that transaction. For pending transactions, advisors to targets of multiple bids receive credit for
the transaction agreed to or, in the absence of an agreement, the value of the highest offer.
Jason Pacannuayan
Akemi Mamiya
EMEA
Tel: +44 (0) 20 7542 3566
E-mail: [email protected]
Announced league tables include all deals that were announced between January 1, 2011 and September 28, 2012 and of which Thomson Reuters was made aware. All current data
and previous year's data is as of 5:00pm EDT on September 28, 2012.
https://www.thomsonone.com
Deals with undisclosed dollar values are rank eligible but with no corresponding Rank Value. Non-US dollar denominated transactions are converted to the US dollar equivalent at the
time of announcement of terms.
Imputed fees are calculated using Freeman & Co. proprietary algorithm where spreads or fees are not disclosed. Deal fees are on a gross basis before all expenses. Each underwriter
or advisor is allocated its share of deal fees using Freeman & Co. allocation methodology, based on the number of underwriters or advisors on the deal and their role. No fees are
allocated to syndicated members.
E-mail: [email protected]
Tel: +632 858 7262
E-mail: [email protected]
E-mail: [email protected]
Asia-Pacific
First Nine Months 2012 | Mergers & Acquisitions | Financial Advisors
Ranking Criteria Summary
Serkan Tecimer
If you would like to participate in the submission
process, receive quarterly press releases, or have
questions about league table criteria please
contact:
League tables include rank eligible mergers, acquisitions, repurchases, spin-offs, self-tenders, minority stake purchases and debt restructurings.
A tender/merger transaction is considered to be effective at the time of consummation of the merger or the date on which it is declared wholly unconditional.
AmericasMichael RawlingsTel: +1 646 223 8364
While Thomson Reuters has used reasonable endeavors to ensure that the information provided in this document is accurate and up to date as at the time of issue, neither Thomson Reuters nor its third party content providers shall be liable for any errors, inaccuracies or delays in the information, nor for any actions taken in reliance thereon, nor does it endorse any views or opinions of any third party content provider. Thomson Reuters disclaims all warranties, express or implied, as to the accuracy or completeness of any of the content provided, or as to the fitness of the content for any purpose to the extent permitted by law. The content herein is not appropriate for the purposes of making a decision to carry out a transaction or trade and does not provide any form of advice (investment, tax, legal) amounting to investment advice, nor make any recommendations or solicitations regarding particular financial instruments, investments or products, including the buying or selling of securities. Thomson Reuters has not undertaken any liability or obligation relating to the purchase or sale of securities for or by any person in connection with this document. © 2012 Thomson Reuters. All rights reserved. Thomson Reuters and the Thomson Reuters logo are registered trademarks and trademarks of Thomson Reuters and its affiliated companies. Any third party name or mark herein belongs to the relevant third party.
21
Thomson Reuters Solutions for the Deal Making Community
FOR INVESTMENT BANKERS
Thomson Reuters Advanced Analytics for deal making improves efficiency at every step, from screening and targeting, to comparables analysis, building league tables, valuing a company and developing a client pitch book. This set of analytical and presentation tools enables you to undertake all these key tasks without having to leave Microsoft Office®. You can also access our key content sets easily to support your analysis.
ThomsonONE.com Investment Banking is our flagship desktop solution that combines real-time market data and Reuters news with our world class reference data. It includes access to Recent Deals, Active Acquirers and M&A New Issues terms and conditions.
FOR JUNIOR BANKERS
SOLUTION FOR• Managing Client Relationships• Deal Origination• New Issues Pre-Marketing / Roadshows
• Financial Modeling• Customized League Tables • Simple Deals screening • Valuation analysis and comparable deal screening • Full integration into Microsoft Office® for on-brand pitch book creation
SOLUTION FOR
FOR INFORMATION PROFESSIONALS, MARKET DATA, RESEARCHSDC Platinum is the world’s foremost financial transactions database, covering new issues, M&A, syndicated loans, private equity, project finance, poison pills, and more.
• Market Analysis & Trends (Geography, Sector, Asset Class, Deal Type, Deal Size, etc.)• Deal Origination (Debt Maturity Analysis, Company Lifecycle including Private Equity)• Pitch Creation (Firm Credentials, Representative Acquirors)• M&A Targeting (Active Strategic/Sponsor Acquirors, Target Company Screener)• Negotiation (T&C Benchmarking)
Microsoft, Office, Word, Excel and PowerPoint are either registered trademarks or trademarks of Microsoft Corporation in the United States and/or other countries. Copyright 2012 Thomson Reuters. All rights reserved. 48003848 0312.
SOLUTION FOR
Access unique analysis for free anytime using Thomson ReutersDeals Intelligence website and receive regular updates,delivered direct to your inbox.Go to online.thomsonreuters.com/dealsintelligence
SOLUTION FOR
FOR STRATEGY AND PLANNING TEAMS
To purchase individual Thomson Reuters Deals or League Table reports,please contact our Thomson Reuters On Demand group:Web: http://financial.thomsonreuters.com/ondemandEmail: [email protected]
Send us a sales enquiry at: financial.thomsonreuters.com/salesRead more about our products at: financial.thomsonreuters.com/products
Thomson Reuters Deals Business Intelligence enables you to slice and dice our renowned Deals and Fees data to create ad hoc reports, analyze market trends, benchmark your performance and identify opportunities – all within a tool built into your workflow in Excel®, saving you valuable time and giving you a competitive edge.
• Conducting market analysis and identifying trends• Benchmarking your performance and monitoring competitors• Targeting clients by wallet size and banking relationship• Allocating resources more effectively by evaluating and analyzing lost deals
22