mergers when prices are negotiated:evidence from the hospital...
TRANSCRIPT
Introduction Model Estimation and identification Institutional setting and data Results Counterfactuals Conclusions
Mergers When Prices Are Negotiated:Evidence from the Hospital Industry
Gautam GowrisankaranAviv Nevo Robert Town
University of Arizona, HEC Montreal, and NBER
Northwestern University and NBER
University of Pennsylvania and NBER
September 18, 2014
1 / 41
Introduction Model Estimation and identification Institutional setting and data Results Counterfactuals Conclusions
Introduction
For many transactions, prices are determined by bilateralnegotiationsExamples include:
Negotiated rates between content providers and cablecompaniesTerms of trade between book publishers and online retailerssuch as AmazonHospital prices in the healthcare markets we study
Each side has an incentive to improve bargaining leverageOne potential way: merging with a competitor
2 / 41
Introduction Model Estimation and identification Institutional setting and data Results Counterfactuals Conclusions
Purpose of paper
This paper formulates and estimates a bargaining model overprices between hospital systems and managed careorganizations (MCOs)
We use high quality administrative claims data from payorsto construct hospital pricesWe examine impact of counterfactual mergers and conductremediesWe use the model to evaluate how hospital bargaining andpatient coinsurance restrain prices
Framework potentially applicable to other settings withnegotiated prices and “gatekeeper” buyers who act asintermediaries
3 / 41
Introduction Model Estimation and identification Institutional setting and data Results Counterfactuals Conclusions
Why hospital mergers?
Sector accounts for over 5% of GDPMore hospital merger trials than for any other industry!Mergers important determinants of bargaining leverage
MCOs obtain lower prices than traditional insurancebecause of bargaining leverageSignificant in restraining medical prices (Cutler et al., 2000)Strategic response of hospitals is merger – threat ofremoving hospital system is larger
Recently:2012 Rockford (IL) Health System2011 ProMedica (Toledo, OH)Decision based in part on simulation models
More consolidation likely given incentives in AffordableCare Act
4 / 41

Introduction Model Estimation and identification Institutional setting and data Results Counterfactuals Conclusions
In the press
Swedish American Hospital in Rockford, Illinois.Swedish would have benefited from theRockford-OSF merger, as the second-largest playerin a hospital duopoly. Image via Wikipedia.
One of the big reasons why healthcare is so expensive is becausemany hospitals havenear-monopoly pricing power intheir local markets. Even so, it’sbeen hard for the government’santitrust agencies to block thesemergers, because the courts havesided with the hospitals against thegovernment. Today, from Illinois,we learn of some promising news:two hospitals have abandonedplans to merge, following achallenge from the Federal TradeCommission. Could this be a turning point in the war against hospitalmonopolies?
In May of 2010, Rockford Health System, a network of providers in northernIllinois, signed a letter of intent to join the OSF Healthcare System, a largenetwork of providers in the same area, including 7 hospitals. (OSF stands forthe Sisters of the Third Order of St. Francis, based in Peoria.)
The principal goal of the merger would be to combine two of Rockford’soldest hospitals, the Rockford Memorial Hospital (part of Rockford HealthSystem) and Saint Anthony Medical Center (part of OSF). The merger wasformalized in February 2011, “pending federal and state regulatory approvaland other customary closing conditions.”
Merger would have left Rockford with twohospitals instead of three
Currently, Rockford benefits from three differenthospitals competing against one another. TheRHS-OSF merger would have reduced that numberto two. And studies show that when a local marketgoes from three hospitals to two, those hospitals
Most Popular
The author is a Forbes contributor. The opinionsexpressed are those of the writer.
Avik’s News Stream
Subscribe to ForbesJust $1 an Issue
PHARMA & HEALTHCARE | 4/13/2012 @ 3:58PM | 2,222 views
Avik RoyContributor
+ Follow on Forbes
I am a Senior Fellow at the ManhattanInstitute for Policy Research and a member ofMitt Romney’s Health Care Policy AdvisoryGroup. To contact me, click here. To receive aweekly e-mail digest of articles from TheApothecary, sign up here, or you can subscribeto The Apothecary’s RSS feed or my Twitterfeed. In addition to my Forbes blog, I write onhealth care, fiscal matters, finance, and otherpolicy issues for National Review. My work hasalso appeared in National Affairs, USA Today,The Atlantic, and other publications.Professionally, I am a health care investmentanalyst. Previously, I worked as an analyst andportfolio manager at J.P. Morgan, Bain Capital,and other firms.
AVIK ROY’S POPULAR POST S
HHS Official: Administration is ShutteringCLASS, Obamacare's Long-Term Care Entitlement59,424 views
Why Switzerland Has the World's Best HealthCare System 31,794 views
Obamacare Mandate Opponents Shouldn't Uncorkthe Supreme Court Champagne Yet 23,160 views
Lipitor is Dead. Long Live Lipitor! 13,015 views
Obamacare Bombshell: 4 Million People WhoThought They Were Gaining Coverage, Won't12,888 views
MORE FROM AVIK RO Y
+ Follow on Forbes
Avik Roy, ContributorThe Apothecary is a blog about health-care and entitlement reform.
How Hospital
8 comments, 8 called-out + Comment now
Help|Sign up|Log in
Subscribe >Hip-Hop's WealthiestArtists
Companies That Pay TheMost Taxes
Apple's Secret Plan For ItsCash Stash
AdVoice: Wave GoodbyeTo Old-School Computing
Business Investing Tech Entrepreneurs Op/Ed Leadership Lifestyle Lists
In Illinois and Ohio, Turning Points in the War against Hospital Monopolie... http://www.forbes.com/sites/aroy/2012/04/13/in-illinois-and-ohio-turnin...
1 of 6 4/18/2012 1:23 PM
5 / 41
Introduction Model Estimation and identification Institutional setting and data Results Counterfactuals Conclusions
Why use a bargaining model?
Alternative would be to estimate a discrete choice model ofBertrand competition with differentiated productsConsumers pay little out-of-pocket for hospital stays
Demand based on patient flows will be very inelasticImplication: very negative marginal costs
MCO incentives generally more elastic than patientincentivesIncentives may also change in different ways following amergerStructural model useful for analyzing out-of-samplepolicies and events and guiding reduced-form analysis
Estimation takes 15 minutesCounterfactuals slower
6 / 41

Introduction Model Estimation and identification Institutional setting and data Results Counterfactuals Conclusions
Relation to literature
We combine and extend three literatures:1 Differentiated products merger literature
Berry and Pakes (1993), Nevo (2000), etc.Difficult to model hospitals using this framework
2 Hospital merger literatureTown and Vistnes (2001); Capps et al. (2003) [CDS]; Ho(2009); Lewis and Pflum (2011); Dranove et al. (2011)Literature typically estimates structural patient choice andreduced form pricing equationsWe develop structural models and counterfactuals
3 Structural bargaining model literatureCrawford and Yurukoglu (2013); Grennan (2013)We apply framework to hospital/MCO bargainingExtend framework to have unobserved term in costsExamine impact of mergers, hospital systems, andcoinsurance
7 / 41

Introduction Model Estimation and identification Institutional setting and data Results Counterfactuals Conclusions
Remainder of talk
1 Model
2 Estimation and identification
3 Institutional setting and data
4 Results
5 Counterfactuals
6 Conclusions
8 / 41

Introduction Model Estimation and identification Institutional setting and data Results Counterfactuals Conclusions
Model
Two-stage model:1 Stage 1: MCOs and hospitals bargain to set hospital prices
and set of in-network hospitals2 Stage 2: Some enrollees get ill and seek hospital care,
basing choice on networks and pricesBase model:
MCOs act as (imperfect) agents for employersExamine robustness model where:
MCOs post premiums then compete for enrolleesLacking data, we calibrate parameters of this model
True incentives likely more aligned than robustness model:Majority of employers offer one planPlans negotiated via long-run contractsSelf-insured employers negotiate administrative fees only
Incentive alignment might be in between two models
9 / 41
Introduction Model Estimation and identification Institutional setting and data Results Counterfactuals Conclusions
Stage 2: patient choice
Patient i can receive one of a number of illnesses, dOne possibility is no illness, d = 0Other illnesses are weighted by the DRG weight, wdProbability fid of each illness
Knowing her illness, each patient makes a discrete choiceamong hospitals in market or outside optionWe employ a multinomial logit utility frameworkMain regressors are:
out-of-pocket pricefixed effects at hospital-year leveltravel timehospital fixed effects interacted with DRG weight
10 / 41

Introduction Model Estimation and identification Institutional setting and data Results Counterfactuals Conclusions
Stage 2: patient choice (details)
We assume that out-of-pocket price is:
cid × wd × pm(i )j
where:cid is individual i ’s coinsurance ratewd is the DRG weightpm(i )j is the negotiated price between i ’s MCO m(i ) andhospital j
Utility consists of an unobservable eij plus
δij = βxijd − αcidwdpm(i )j
α and β are parameters to be estimatedConsumer surplus (necessary for MCO objective function):
Wi (Nm(i ),pm(i )) =D∑
d=1
fid ln
∑j∈0,Nm(i )
exp(δijd )
11 / 41
Introduction Model Estimation and identification Institutional setting and data Results Counterfactuals Conclusions
Stage 1: overview
Network hospitals and prices decided via bargaining gameThere are M × S contracts
Contract is for unique MCO (m) and hospital system (s) pairContract specifies all negotiated base prices for its pairEach hospital within a system has a separate base price
Following Horn and Wolinsky (1988):Each contract solves price vector as Nash bargainingsolutionDisagreement points are second-stage values to each partyfrom having no agreementNash bargaining solution embedded within Nashequilibrium of simultaneous complete information game
Collard-Wexler, Gowrisankaran, and Lee (2012) showalternating offers representation for this type of game
12 / 41

Introduction Model Estimation and identification Institutional setting and data Results Counterfactuals Conclusions
Stage 1: MCO objective function
MCOs/employers maximize weighted sum of enrolleesurplus and payments to hospitals, with weight τLet TCm (Nm,pm) denote the total costs to MCO
Consists of payments to hospitals net of coinsurance
Then, managed care surplus is:
Vm (Nm,pm) =τ
α
I∑i=1
1m(i ) = mWi (Nm,pm)−TCm (Nm,pm)
where:α is price sensitivityτ reflects imperfect agency
Surplus is enrollee welfare minus payments to hospitals
13 / 41

Introduction Model Estimation and identification Institutional setting and data Results Counterfactuals Conclusions
Stage 1: hospital system objective function
Hospitals face constant marginal costsAllow variation across MCO, e.g., due to paperworkProportional to DRG weight
Hospitals maximize weighted sum of profits and quantityEquivalent to cost differences for not-for-profits
Hospital costs can be decomposed into componentsobservable to econometrician and residual:
mcmj = γvmj + εmj
Hospital system s returns (profits) from all its contracts:∑m∈Ms
∑j∈Js
qmj (Nm,pm)[pmj −mcmj ]
where qmj (Nm,pm) is quantity weighted by DRG weight
14 / 41

Introduction Model Estimation and identification Institutional setting and data Results Counterfactuals Conclusions
Nash bargaining problem
Problem is a function of equilibrium values from agreementrelative to disagreement
NBm,s (pmj j∈Js|pm,_s) =
( ∑j∈Js
qmj (Nm,pm)[pmj−mcmj ])bs(m) (Vm (Nm,pm)−Vm (Nm\Js ,pm)
)bm(s)
Bargaining weights are bs(m) and bm(s)
They represent the portion of the surplus that each side isable to captureThe surpluses themselves are expressions in parentheses
Our equilibrium prices solve the Nash bargain:
p∗mj = maxpmj NB(pmj ,p∗m,_j |p∗m,_s)
15 / 41

Introduction Model Estimation and identification Institutional setting and data Results Counterfactuals Conclusions
Bargaining game: FOCs
Differentiate to write the FOC:
bs(m)
qmj +∑
k∈Js∂qmk∂pmj
[pmk − mcmk ]∑k∈Js qmk [pmk − mcmk ]
= −bm(s)
A︷︸︸︷∂Vm
∂pmj
Vm (Nm, pm) − Vm (Nm \ Js, pm)︸ ︷︷ ︸B
Rewrite the #(Js) FOCs for system s as:
q +Ω(p −mc) = −Λ(p −mc)
where
Ω(j ,k ) =∂qmk
∂pmj, Λ(j ,k ) =
bm(s)
bs(m)
AB
qmk
Express as: p −mc = −(Ω+ Λ)−1qmc is our “dependent” variable for estimation
If Λ = 0, this would be Bertrand competition FOCΩ+ Λ is effective price sensitivity
16 / 41

Introduction Model Estimation and identification Institutional setting and data Results Counterfactuals Conclusions
Implications of bargaining game: coinsurance rates
When τ = 1:
∂Vm
∂pmj= −qmj − α
I∑i=1
D∑d=1
1m(i ) = m(1 − cid )cid w2id fid sijd
∑k∈Nm
pmk sikd − pmj
First term is standard price effectSecond term is steering effect:
Raising price on high-priced hospitals has positive effect –consumers may substitute to lower-priced onesSystem may get higher margin on high-cost hospitals
17 / 41

Introduction Model Estimation and identification Institutional setting and data Results Counterfactuals Conclusions
Implications of bargaining game: no coinsurance
Simpler form to FOC when cmid = 0:∑k∈Js
qmk [pmk −mcmk ] =bs(m)
bm(s)[Vm (Nm,pm) − Vm (Nm \ Js ,pm)]
Linear system→ closed form to counterfactual pricesCDS’s similar model is consistent with lump-sum transfer
18 / 41
Introduction Model Estimation and identification Institutional setting and data Results Counterfactuals Conclusions
Implications of bargaining game: price sensitivity
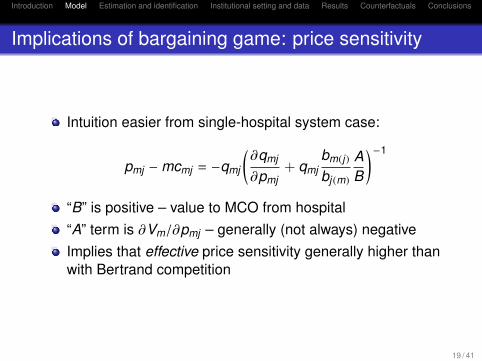
Intuition easier from single-hospital system case:
pmj −mcmj = −qmj
(∂qmj
∂pmj+ qmj
bm(j )
bj (m)
AB
)−1
“B” is positive – value to MCO from hospital“A” term is ∂Vm/∂pmj – generally (not always) negativeImplies that effective price sensitivity generally higher thanwith Bertrand competition
19 / 41

Introduction Model Estimation and identification Institutional setting and data Results Counterfactuals Conclusions
Estimation of patient choice stage
Estimation uses maximum likelihood:Data include information on patient residences, prices paidby MCOs to hospitals and coinsurance ratesOutcome is choice of hospitalParameters are multinomial logit coefficients β and α
20 / 41

Introduction Model Estimation and identification Institutional setting and data Results Counterfactuals Conclusions
Identification of patient choice stage
What identifies our parameters?We include hospital-year interactions
Identification is from ‘within’ hospital-year variationPrice term α identified primarily by variation in coinsurancerates across payors (within hospital-year)
Coinsurance varies between 0.2% and 4.4% across MCOsDo people with higher coinsurance pick cheaper hospitals?
Distance and other interactions identified from patient-levelvariation in location and DRG weights
How far do people travel?Where do high-DRG-weight people seek treatment?
21 / 41
Introduction Model Estimation and identification Institutional setting and data Results Counterfactuals Conclusions
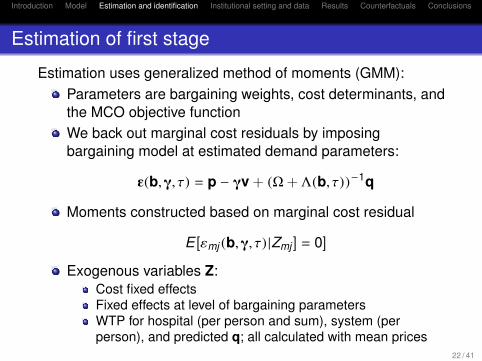
Estimation of first stage
Estimation uses generalized method of moments (GMM):Parameters are bargaining weights, cost determinants, andthe MCO objective functionWe back out marginal cost residuals by imposingbargaining model at estimated demand parameters:
ε(b,γ, τ) = p − γv + (Ω+ Λ(b, τ))−1q
Moments constructed based on marginal cost residual
E [εmj (b,γ, τ) |Zmj ] = 0]
Exogenous variables Z:Cost fixed effectsFixed effects at level of bargaining parametersWTP for hospital (per person and sum), system (perperson), and predicted q; all calculated with mean prices
22 / 41
Introduction Model Estimation and identification Institutional setting and data Results Counterfactuals Conclusions
Identification of first stage
τ identified by extent to which MCOs value hospital choicerelative to payments to hospitalsWe use WTP measures as “instruments”
Measures capture variation in enrollee characteristicsThis (assumed exogenous) variation necessary to identify τ
Cost fixed effects γ have similar implications to bargainingweights b
When we allow bargaining weight differences by MCO, wedo not allow costs to vary across MCO
23 / 41

Introduction Model Estimation and identification Institutional setting and data Results Counterfactuals Conclusions
Robustness model with posted premium competition
MCOs objective in price negotiation with hospitals is tomaximize profitsFollowing price negotiation:
1 MCOs simultaneously set premiums, Pm2 Enrollees choose an MCO or outside option
Enrollee utility at point of MCO choice:
α1Wi (Nm,pm) − α2Pm + ξm + Eim
whereξm is unobservable plan qualityEim is an i .i .d . termα1 and α2 are parameters to estimate
24 / 41

Introduction Model Estimation and identification Institutional setting and data Results Counterfactuals Conclusions
Calibration of posted premium competition model
Model is a function of parameters of MCO choice equation butwe lack data and variation at MCO choice level
We calibrate MCO premium sensitivity from Ericson andStarc (2012), α2 = 0.0019We choose welfare weight of α1 =
τα2α , using estimated α
and τ
Imposes rationality that a dollar at premium stage is worth adollar at hospital choice stage
We calculate plan quality ξm to match MCO market sharesmc and b from base model estimatesNeed assumptions on people who are not ill
They purchase insurance too!Assume each person has one of two outcomes: (1) nodisease (d = 0) or (2) disease observed in data
25 / 41

Introduction Model Estimation and identification Institutional setting and data Results Counterfactuals Conclusions
Inova’s proposed acquisition of Prince William Hospital
Inova Health System sought to acquire Prince WilliamHospital in 2006Inova Health System
5 hospital system in Northern Virginia1,876 bedsLarge tertiary hospital/high end servicesNo meaningful physician ownershipOperating revenue of $1.8 billion
Prince William Hospital (PWH)Community hospital in Manassas, VA170 bedsNo tertiary servicesOperating revenue of $170.5 millionPurchase “price”: $175 million capital commitment
Previous IHS acquisitions:2005: Loudoun Hospital; 1997: Alexandria Hospital
26 / 41

Introduction Model Estimation and identification Institutional setting and data Results Counterfactuals Conclusions
Overview of the proposed merger (continued)
FTC & Virginia AG challenged the acquisition in May, 2008Product Market: General, acute care inpatient hospitalservices sold to private payorsGeographic Market: Virginia Health Planning District 8 andFauquier County
HHI (private revenues): 5,635 to 6,174Outcome:
The parties abandoned the transaction after the case wasfiledPrince William later acquired by Novant Health
27 / 41
Introduction Model Estimation and identification Institutional setting and data Results Counterfactuals Conclusions
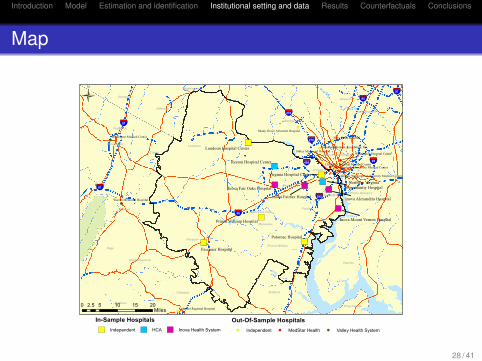
Map
!(
!(!(!(
!(
!(
!(
!(
!(
!(
!(
!(
!(
")
")
")
") ")
")
")
")
")
")
")
§¦95
§¦81
§¦270
§¦495
§¦97
§¦395§¦81
§¦66
§¦270
§¦95
Fauquier
Fairfax
Loudoun
Charles
Montgomery
Culpeper
Clarke
Stafford
Prince William
Warren
Rappahannock
Jefferson
Prince George's
Frederick
HowardBerkeley
MadisonKing George
Arlington
Alexandria
District of Columbia
Page
Anne Arundel
Manassas
Winchester
Washington
Fairfax City
Manassas Park
Potomac Hospital
Fauquier Hospital
Inova Fairfax Hospital
Reston Hospital Center
Loudoun Hospital Center
Prince William Hospital
Virginia Hospital Center
Inova Fair Oaks Hospital
Inova Alexandria Hospital
Inova Mount Vernon Hospital
Northern Virginia Community Hospital
Holy Cross Hospital
Warren Memorial Hospital
Sibley Memorial Hospital
Winchester Medical Center
Culpeper Regional Hospital
Shady Grove Adventist Hospital
Children's National Medical Center
Suburban Hospital Association, Inc.Washington Hospital Center
Georgetown University Medical Center
George Washington University Medical Center
0 5 10 15 202.5Miles
Ü
In-Sample Hospitals") Independent ") HCA ") Inova Health System
Out-Of-Sample Hospitals!( Independent !( MedStar Health !( Valley Health System
28 / 41
Introduction Model Estimation and identification Institutional setting and data Results Counterfactuals Conclusions
Data
Claims data from 4 MCOs who operate in marketUse to construct base prices and patient-specificcoinsurance rates
State inpatient discharge dataUse to define sampleKeep data from same four MCOsIncludes patient ZIP code and at episode level
Hospital characteristics from AHATravel time information from MapQuest
29 / 41
Introduction Model Estimation and identification Institutional setting and data Results Counterfactuals Conclusions
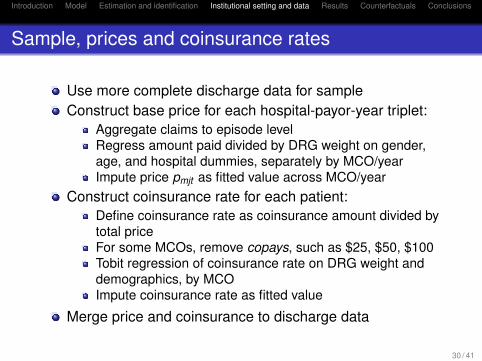
Sample, prices and coinsurance rates
Use more complete discharge data for sampleConstruct base price for each hospital-payor-year triplet:
Aggregate claims to episode levelRegress amount paid divided by DRG weight on gender,age, and hospital dummies, separately by MCO/yearImpute price pmjt as fitted value across MCO/year
Construct coinsurance rate for each patient:Define coinsurance rate as coinsurance amount divided bytotal priceFor some MCOs, remove copays, such as $25, $50, $100Tobit regression of coinsurance rate on DRG weight anddemographics, by MCOImpute coinsurance rate as fitted value
Merge price and coinsurance to discharge data
30 / 41

Introduction Model Estimation and identification Institutional setting and data Results Counterfactuals Conclusions
Sample hospitals
Hospital Beds Mean price FP Mean Cath$ NICU lab
Prince William Hospital 170 10,273 0 1 0Alexandria Hospital 318 9,757 0 1 1Fair Oaks Hospital 182 9,799 0 .5 1Fairfax Hospital 833 11,881 0 1 1Loudoun Hospital 155 11,565 0 0 1Mount Vernon Hospital 237 12,112 0 0 1Fauquier Hospital 86 13,270 0 0 0N. VA Community Hosp. 164 9,545 1 0 1Potomac Hospital 153 11,420 0 1 1Reston Hospital Center 187 9,973 1 1 1Virginia Hospital Center 334 9,545 0 .5 1
31 / 41

Introduction Model Estimation and identification Institutional setting and data Results Counterfactuals Conclusions
Patient summary statistics
Mean Share Mean Mean Mean DischargesHospital age white DRG travel coins. Total Share
weight time ratePrince William Hospital 36.1 0.73 0.82 13.06 0.032 9,681 0.066Alexandria Hospital 39.3 0.62 0.92 12.78 0.025 15,622 0.107Fair Oaks Hospital 37.7 0.54 0.94 17.75 0.023 17,073 0.117Fairfax Hospital 35.8 0.58 1.20 18.97 0.023 46,428 0.319Loudoun Hospital 37.2 0.74 0.81 15.54 0.023 10,441 0.072Mount Vernon Hospital 50.3 0.66 1.38 16.18 0.022 3,749 0.026Fauquier Hospital 40.5 0.90 0.92 15.29 0.033 3,111 0.021N. VA Comm. Hosp. 47.2 0.48 1.43 16.02 0.016 531 0.004Potomac Hospital 37.5 0.60 0.93 9.62 0.024 8,737 0.060Reston Hospital Center 36.8 0.69 0.90 15.35 0.021 16,007 0.110Virginia Hospital Center 40.8 0.59 0.98 15.88 0.017 12,246 0.084Outside option 39.3 0.82 1.39 0.00 0.029 2,113 0.014All Inova 37.5 0.59 1.09 17.37 0.024 85,540 0.641All others 38.1 0.68 0.92 13.74 0.023 60,199 0.359
32 / 41

Introduction Model Estimation and identification Institutional setting and data Results Counterfactuals Conclusions
Multinomial logit demand estimates
Variable Coefficient Standard errorBase price × weight × coinsurance −0.0008∗∗ (0.0001)Travel time −0.1150∗∗ (0.0026)Travel time squared −0.0002∗∗ (0.0000)Closest 0.2845∗∗ (0.0114)Travel time × beds / 100 −0.0118∗∗ (0.0008)Travel time × age / 100 −0.0441∗∗ (0.0023)Travel time × FP 0.0157∗∗ (0.0011)Travel time × teach 0.0280∗∗ (0.0010)Travel time × residents/beds 0.0006∗∗ (0.0000)Travel time × income / 1000 0.0002∗∗ (0.0000)Travel time × male −0.0151∗∗ (0.0007)Travel time × age 60+ −0.0017 (0.0013)Travel time × weight / 1000 11.4723∗∗ (0.4125)Cardiac MDC × cath lab 0.2036∗∗ (0.0409)Obstetric MDC × NICU 0.6187∗∗ (0.0170)Nerv, circ, musc MDC × MRI −0.1409∗∗ (0.0460)N 1,710,801Pseudo R2 0.445Note: specification also includes hospital-year interactions andhospital dummies interacted with disease weight.
33 / 41
Introduction Model Estimation and identification Institutional setting and data Results Counterfactuals Conclusions
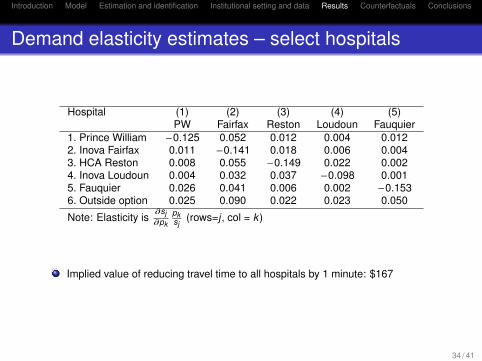
Demand elasticity estimates – select hospitals
Hospital (1) (2) (3) (4) (5)PW Fairfax Reston Loudoun Fauquier
1. Prince William −0.125 0.052 0.012 0.004 0.0122. Inova Fairfax 0.011 −0.141 0.018 0.006 0.0043. HCA Reston 0.008 0.055 −0.149 0.022 0.0024. Inova Loudoun 0.004 0.032 0.037 −0.098 0.0015. Fauquier 0.026 0.041 0.006 0.002 −0.1536. Outside option 0.025 0.090 0.022 0.023 0.050
Note: Elasticity is∂sj∂pk
pksj
(rows=j , col = k )
Implied value of reducing travel time to all hospitals by 1 minute: $167
34 / 41

Introduction Model Estimation and identification Institutional setting and data Results Counterfactuals Conclusions
Bargaining parameter estimates
Specification 1 Specification 2Parameter Estimate S.E. Estimate S.E.MCO Welfare Weight (τ) 2.79 (2.87) 6.69 (5.53)MCO 1 Bargaining Weight 0.5 – 0.52 (0.09)MCOs 2 & 3 Bargaining Weight 0.5 – 1.00∗∗ (7.77 ×10⁻¹⁰)MCO 4 Bargaining Weight 0.5 – 0.76∗∗ (0.09)
Cost parametersInova Fairfax 10, 786∗∗ (3,765) 6, 133∗∗ (1,211)Inova Fair Oaks 11, 192∗∗ (3,239) 6, 970∗∗ (2,352)Inova Alexandria 10, 412∗ (4,415) 6, 487∗∗ (1,905)Inova Mount Vernon 10, 294∗ (5,170) 4,658 (3,412)Inova Loudoun 12, 014∗∗ (3,188) 8, 167∗∗ (1,145)Prince William Hospital 8, 635∗∗ (3,009) 5, 971∗∗ (1,236)Fauquier Hospital 14, 553∗∗ (3,390) 9, 041∗∗ (1,905)No. VA Community Hosp. 10, 086∗∗ (2,413) 5, 754∗∗ (2,162)Potomac Hospital 11, 459∗∗ (2,703) 7, 653∗∗ (902)Reston Hospital Center 8, 249∗∗ (3,064) 5, 756∗∗ (1,607)Virginia Hospital Center 7, 993∗∗ (2,139) 5, 303∗∗ (1,226)MCO 2 Cost −9, 043∗∗ (2,831) – –MCO 3 Cost −8, 910∗∗ (3,128) – –MCO 4 Cost −4,476 (2,707) – –Year 2004 1,130 (1,303) 1,414 (1,410)Year 2005 1,808 (1,481) 1,737 (1,264)Year 2006 1,908 (1,259) 2, 459∗ (1,077)Note: we report bootstrapped standard errors at the payor, year, system level.
35 / 41

Introduction Model Estimation and identification Institutional setting and data Results Counterfactuals Conclusions
Lerner indices, actual and effective price elasticities
Lerner index is the price/cost margin, formally L = p−mcp
We calculate effective price elasticities using inverseelasticity rule for pricing: elast = L−1
System name Lerner Actual Effective Own priceindex own price own price elasticity
elasticity elasticity withoutinsurance
Prince William Hospital 0.52 0.13 1.94 5.16Inova Health System 0.39 0.07 2.55 3.10Fauquier Hospital 0.22 0.17 4.56 6.11HCA (Reston Hospital) 0.35 0.15 2.87 7.34Potomac Hospital 0.37 0.15 2.74 6.77Virginia Hospital Center 0.58 0.13 1.74 6.43
36 / 41

Introduction Model Estimation and identification Institutional setting and data Results Counterfactuals Conclusions
Impact of counterfactual industry structures
Counterfactual System %∆ Price %∆ Quantity %∆ Profits1. Inova/PWH Inova & PWH 3.1 −0.5 9.3merger Rival hospitals 3.6 1.2 12.0
Change at In-ova+PW relative toPW base
30.5 −4.9 91.5
2. Inova/PWH Inova & PWH 3.3 −0.5 8.8merger with sepa-rate bargaining
Rival hospitals 3.5 1.2 11.2
3. Loudoun Inova & Loudoun −1.8 0.1 −4.7demerger Rival hospitals −1.6 −0.2 −4.7
Change at Inovarelative to Loudounbase
−14.7 0.8 −38.5
4. Breaking up All hospitals −6.8 0.05 −18.9Inova
“Separate bargaining” is conduct remedy imposed inEvanston Northwestern-Highland Park merger
37 / 41

Introduction Model Estimation and identification Institutional setting and data Results Counterfactuals Conclusions
Impact of counterfactual coinsurance levels
Counterfactual System %∆ Price %∆ Quantity %∆ Profits1. No coinsur-ance
All hospitals 3.7 0.01 9.8
2. Coinsurance10 times current
All hospitals −16.1 0.9 −0.4
3. Inova/PWH Inova & PWH 2.9 0 7.4merger, no coin-surance
Rival hospitals 1.3 0 3.9
Coinsurance 10 times larger approximates optimalinsurance (Manning and Marquis, 1996)
38 / 41

Introduction Model Estimation and identification Institutional setting and data Results Counterfactuals Conclusions
Baseline predictions across models
Variable Mean value in posted Mean valuepremium competition model in base model
Hospital prices $11,088 $13,618Hospital margin per patient $4,796 $4,893MCO premiums $1,706 –MCO margin per enrollee $792 –Consumer surplus $4,398 –Health insurance take-up (%) 84.5 –
Results broadly similar across modelsNot shown, Lerner indices also similar across models
39 / 41

Introduction Model Estimation and identification Institutional setting and data Results Counterfactuals Conclusions
Merger impact across base and robustness models
Posted premium com-petition model
Base model – Specifi-cation 1
Inova/PWH prices 7.2% 3.1%Other hospitals prices 2.2% 3.6%Inova/PWH margin per patient 16.9% 9.8%Other hospitals margin per pa-tient
6.6% 10.7%
MCO premiums 3.4% –MCO margin per enrollee 1.0% –Consumer surplus -4.4% –Health insurance take-up -1.6% –
Posted premium competition model increases value fromdisagreement on both sides of marketHospitals benefit more from merger with posted premiumcompetition
Hospitals in this model can recapture some patientsfollowing disagreementSpill-and-recapture appears to be dominant differencebetween models
40 / 41
Introduction Model Estimation and identification Institutional setting and data Results Counterfactuals Conclusions
Conclusions
Paper constructs and estimates a model of a bargaininggame between hospital systems and MCOs
Bargaining equilibria differ from Bertrand equilibriumTechniques for analyzing mergers with Bertrandcompetition can be adapted to negotiated prices
Bargaining leverage results in MCOs being more pricesensitive than patients
Implication: MCOs can help lower pricesPatient coinsurance also lowers prices
Implication: recent higher coinsurance rates will do moreSignificant price increase from blocked Inova and PWmerger
Conduct remedies don’t help – they change leverage onboth sides of market
Paper provides structural framework to evaluate bargainingmodels, which are being used for merger policy
41 / 41