meris case 2 water validation early results north sea...
TRANSCRIPT

MERIS CASE 2 WATER VALIDATION
EARLY RESULTS NORTH SEA / HELGOLAND /GERMAN BIGHT
Roland Doerffer (1,2), Helmut Schiller(1), Hajo Krasemann(1),Kerstin Heymann(1), Wolfgang Cordes(1),Wolfgang Schönfeld(1), Rüdiger Röttgers(1), Irina Behner(1), Peter Kipp(1)
(1)GKSS Institute for Coastal Research, Max Planck-Str. 1, 21502 Geesthacht, Germany, (2)[email protected]
ABSTRACTTwo MERIS scenes of case 2 water of the German Bight have been compared with measurements from ship. These firstvery preliminary tests have indicated that the atmospheric correction in the blue part of the MERIS spectrum is notsufficient. An alternative atmospheric correction, using a neural network, produces water leaving radiance reflectances,which are much closer to ship measurements. However, although the MERIS L2 processor indicates that the reflectancespectra are out of range, the derived concentrations show relative profiles along ship transects, which are still in reaso-nable agreement with observations. Most critical for further work is the atmospheric correction, including investigations on the impact by Rayleighscattering, cirrus clouds and sun glitter. Furthermore, due to the high patchiness of substances in the German Bight, fullresolution data are necessary to get a better comparison between water samples and MERIS data and their variances.
OVERVIEW ABOUT VALIDATION ACTIVITIES AND AVAILABLE DATAThe GKSS MERIS validation team has carried out a number of cruises during the spring-summer period of 2002 for thevalidation of MERIS level 2 data of coastal waters. They are listed along with the MERIS scenes, which were availableuntil end of 2002, in Table 1. The weather of this period was mainly cloudy so that the number of blue sky days with aMERIS overpass was small. Only between mid August and end of September we had some stable periods, wherevalidation experiments could be planned. Another limitation was that only two corrected MERIS scenes for which matchup data exists were provided by ESA, shortly before the validation workshop. In addition to the level 2 scenes, whichwere produced with the MERIS processor, we have evaluated the scene of July 29, level 1b, with an experimentalbreadboard processor. It uses the same neural network for the retrieval of the optical properties of water constituents buthas an alternative procedure for atmospheric correction, which is also based on a neural network. Our main validation cruise was carried out with the research vessel "Heincke" from April 23 to May 2. This period waschosen to cover the main phytoplankton bloom in the North Sea. When the application for this ship has to be made early2001, the launch date for ENVISAT was still 2001. Unfortunately, MERIS data are now available only from April 29on. A map of the stations is given in Fig. 1.Due to the cloudy weather during the summer 2002 we decided to change the strategy and do the validation measure-ments from a ship of opportunity, i.e. the ferry boat "Wappen von Hamburg", which operates daily between Cuxhavenand the island of Helgoland (s. Fig. 2). Advantage was that the decision for a cruise could be made on very short notice,disadvantage was that the ship cannot stop during the cruise for measuring vertical profiles. The water types, which arecovered by this transect, ranges from turbid estuarine water at Cuxhaven to clear blue-green water around Helgoland sothat a variety of different water constituents are covered by one match-up scene. Problem is that the distribution is verypatchy.Further data for the validation exist from measurements with the GKSS ferry box. It is installed on the ferry boat, whichsails between Cuxhaven and Harwich. This box consists of an autonomous package of instruments, which measurecontinuously variables such as temperature, salinity, turbidity, fluorescence of phytoplankton and nutrients so thattransects of these variables exist for nearly every day.Beside the ship cruises we have operated a CIMEL sun photometer on the island of Helgoland for the validation of theatmospheric correction. It is part of AERONET, the global network of sun photometers for aerosol research. The validation was focussed on the water leaving radiance reflectance product, which is produced by the atmosphericcorrection procedure and which is critical for the success of the NN algorithm. In a further step we have compared thederived concentrations with in situ measurements.
__________________________________________________________________________________________________________Proc. of Envisat Validation Workshop, Frascati, Italy, 9 – 13 December 2002 (ESA SP-531, August 2003)
Date / Period Ship area Instruments /variables Remarks
23.4. -2.5.2002
Heincke South-easternNorth Sea
- Satlantic, AC-9, BB4, Trios-raft– CTD, pigments, SPM, ISPM, OSPM,DOC, POC, filterpad absorption– Fluorescence and primary production
46 stations,only few days with bluesky, MERIS sceneavailable for 29.4.
29.07.02,30.07.02,14.08.02,15.08.02,03.09.02
WappenvonHamburg
Cuxhaven-Helgolandtransect
Trios above water reflectance, T, S,pigments, SPM, ISPM, OSPM, DOC,POC, filterpad absorption
All days with blue sky andENVISAT overpass,MERIS scenes availablefor 29.7. and 14.8.
20.8.2002,22.8.2002
LudwigPrandl
Elbe Lauenburg Trios above water reflectance, T, S,pigments, SPM, ISPM, OSPM, DOC,POC, filterpad absorption
Elbe flooding
Daily April -October
Helgoland CIMEL sun photometer for aerosols, PAR Only for blue sky days
Daily untilOctober
Ferry Cuxhaven -Harwich
Turbidity, phytoplankton fluorescence, T,S, nutrients
Ferry Box
Table 1 Overview about validation activities of the GKSS MERIS validation team in 2002
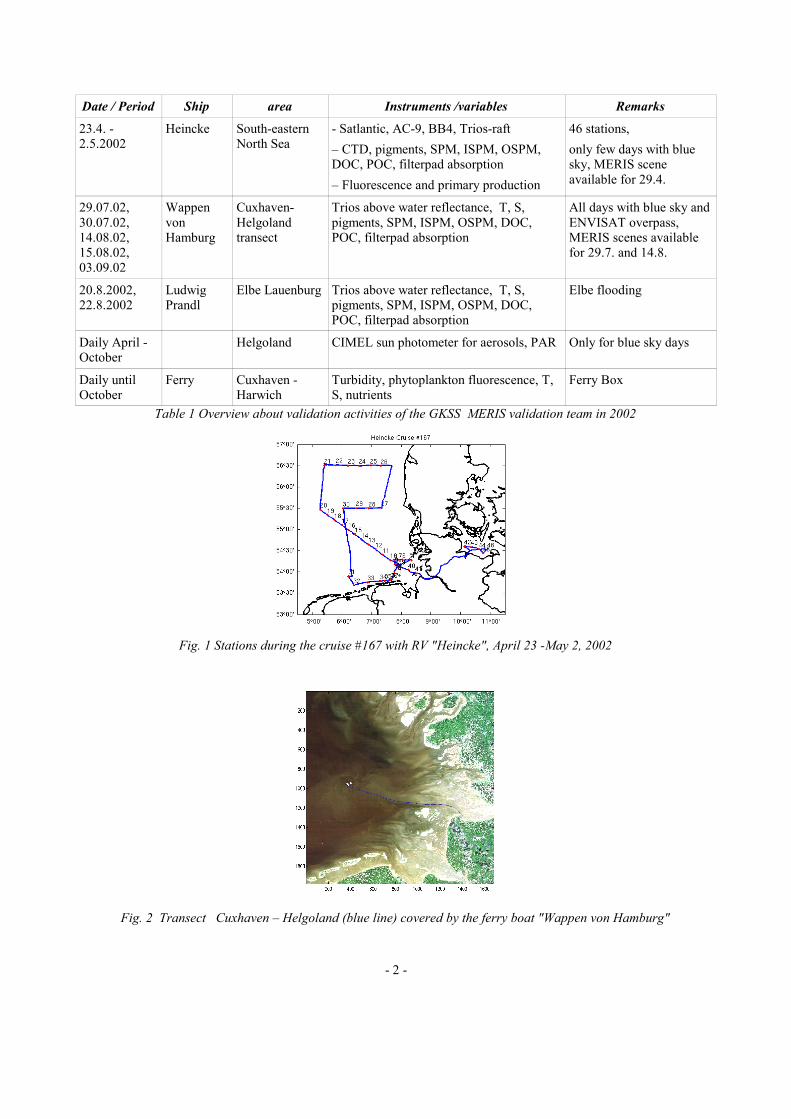
Fig. 1 Stations during the cruise #167 with RV "Heincke", April 23 -May 2, 2002
Fig. 2 Transect Cuxhaven – Helgoland (blue line) covered by the ferry boat "Wappen von Hamburg"
- 2 -

METHODS AND INSTRUMENTS FOR THE VALIDATIONDuring the cruise with RV “Heincke” a full suite of measurements of water constituents and inherent and apparentoptical properties were performed on all stations. The methods are based on the protocols for MERIS validation [1] andhave been intercompared within the MAV-team during the intercalibration exercises (s. the corresponding reports in thisvolume). The bio-optical model and the algorithm, which are used to produce L2 concentration data of case 2 water aredescribed in [2] this volume and [3], a detailed description of the neural network algorithm is given in [4].During the cruises with the "Wappen von Hamburg" only above water reflectance measurements could be performedand samples could be taken only from the water surface.
RESULTSOnly two scenes, of July 29 and August 14, were made available to us for validation. For comparing the water leavingradiance reflectances, we have extracted transects from the MERIS scenes according to the GPS positions of the shiptransects by using the BEAM MERIS VISAT software.
Fig. 3 MERIS scenes of July 29 (a, left) and August 14 (b, right), section of the German Bight, with ship transect
Separation between atmospheric path radiance and water leaving radiance reflectanceOne indication for a successful atmospheric correction is the difference between the path radiance and the water leavingradiance along a transect, where strong gradients or fronts occur either in the water or the atmosphere or both. The shapeof both curves should normally not be correlated. We have applied this test to the scene of July 29 (Fig. 4). The pixelindex from left to right runs along the transect from Cuxhaven to Helgoland. The curves RL_path (path radiance reflec-tance) and RLw_bread (water leaving radiance reflectance) for MERIS band 9 were produced using the breadboard pro-cessor. RLw_L2 is the water leaving radiance reflectance from the MERIS L2 processor. Obviously, the separation works with both methods. However, the MERIS standard product shows a higher covariancebetween the path and water leaving radiance reflectances and the RLw is significantly higher. Furthermore, there aresome gaps in the transect, which cannot easily be explained. Because of the flags (s. Fig. 5), we assume that absorbingdust or absorbing continental aerosol has switched the algorithm to a different branch.
Fig. 4 Radiance reflectances along the transect Cuxhaven (left) to Helgoland (right) for the top of atmosphere(RL_toa), path radiance (RL_path, computed with the breadboard), water leaving radiance (Rlw_L2) and waterleaving radiance determined with the breadboard processor (RLw_bread).
- 3 -
0 10 20 30 40 50 60-2
0
2
4
6
8
10
12
14
16x 10
-3
index no. along transect Cux - Helgo
RL
[sr-1
]
Radiance reflectance, C01 transect 29.7.2002, band9, breadboard
RL_toa RL_path RLw_breadRLw_L2
0 10 20 30 40 50 60-2
0
2
4
6
8
10
12
14
16x 10
-3
index no. along transect Cux - Helgo
RL
[sr-1
]
Radiance reflectance, C01 transect 29.7.2002, band9, breadboard
RL_toa RL_path RLw_breadRLw_L2
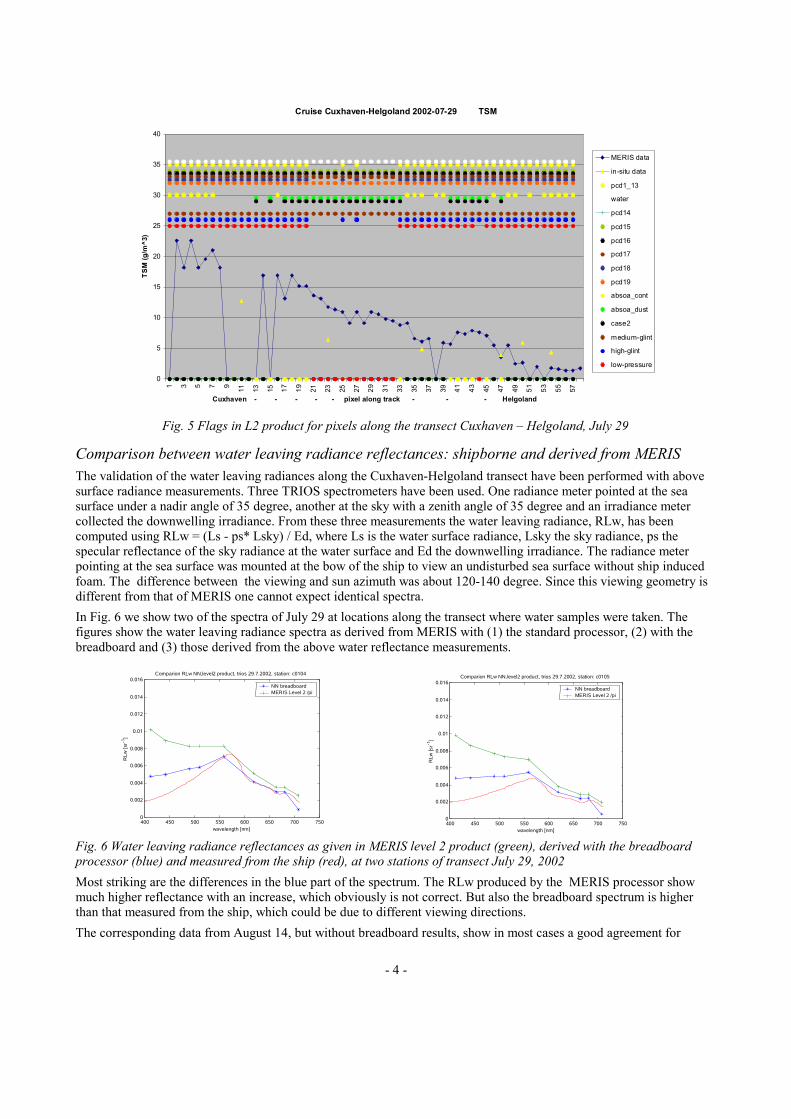
Fig. 5 Flags in L2 product for pixels along the transect Cuxhaven – Helgoland, July 29
Comparison between water leaving radiance reflectances: shipborne and derived from MERISThe validation of the water leaving radiances along the Cuxhaven-Helgoland transect have been performed with abovesurface radiance measurements. Three TRIOS spectrometers have been used. One radiance meter pointed at the seasurface under a nadir angle of 35 degree, another at the sky with a zenith angle of 35 degree and an irradiance metercollected the downwelling irradiance. From these three measurements the water leaving radiance, RLw, has beencomputed using RLw = (Ls - ps* Lsky) / Ed, where Ls is the water surface radiance, Lsky the sky radiance, ps thespecular reflectance of the sky radiance at the water surface and Ed the downwelling irradiance. The radiance meterpointing at the sea surface was mounted at the bow of the ship to view an undisturbed sea surface without ship inducedfoam. The difference between the viewing and sun azimuth was about 120-140 degree. Since this viewing geometry isdifferent from that of MERIS one cannot expect identical spectra. In Fig. 6 we show two of the spectra of July 29 at locations along the transect where water samples were taken. Thefigures show the water leaving radiance spectra as derived from MERIS with (1) the standard processor, (2) with thebreadboard and (3) those derived from the above water reflectance measurements.
Fig. 6 Water leaving radiance reflectances as given in MERIS level 2 product (green), derived with the breadboardprocessor (blue) and measured from the ship (red), at two stations of transect July 29, 2002Most striking are the differences in the blue part of the spectrum. The RLw produced by the MERIS processor showmuch higher reflectance with an increase, which obviously is not correct. But also the breadboard spectrum is higherthan that measured from the ship, which could be due to different viewing directions. The corresponding data from August 14, but without breadboard results, show in most cases a good agreement for
- 4 -
Cruise Cuxhaven-Helgoland 2002-07-29 TSM
0
5
10
15
20
25
30
35
40
1 3 5 7 9 11 13 15 17 19 21 23 25 27 29 31 33 35 37 39 41 43 45 47 49 51 53 55 57
Cuxhaven - - - - - pixel along track - - - Helgoland
TSM
(g/m
^3)
MERIS data
in-situ data
pcd1_13
water
pcd14
pcd15
pcd16
pcd17
pcd18
pcd19
absoa_cont
absoa_dust
case2
medium-glint
high-glint
low-pressure
400 450 500 550 600 650 700 7500
0.002
0.004
0.006
0.008
0.01
0.012
0.014
0.016Comparion RLw NN,level2 product, trios 29.7.2002, station: c0104
wavelength [nm]
RLw
[sr-1
]
NN breadboard MERIS Level 2 /pi
400 450 500 550 600 650 700 7500
0.002
0.004
0.006
0.008
0.01
0.012
0.014
0.016Comparion RLw NN,level2 product, trios 29.7.2002, station: c0104
wavelength [nm]
RLw
[sr-1
]
NN breadboard MERIS Level 2 /pi
400 450 500 550 600 650 700 7500
0.002
0.004
0.006
0.008
0.01
0.012
0.014
0.016Comparion RLw NN,level2 product, trios 29.7.2002, station: c0105
wavelength [nm]
RLw
[sr-1
]
NN breadboard MERIS Level 2 /pi
400 450 500 550 600 650 700 7500
0.002
0.004
0.006
0.008
0.01
0.012
0.014
0.016Comparion RLw NN,level2 product, trios 29.7.2002, station: c0105
wavelength [nm]
RLw
[sr-1
]
NN breadboard MERIS Level 2 /pi

MERIS bands >4, but the same problem in the blue part of the spectrum. A possible explanation might be an error in thecalculation of the path radiance produced by Rayleigh scattering.
Fig. 7 Spectra of the water leaving radiance reflectances at two stations of the transect Aug. 14, 2002. Left spectrum(a) of turbid water, right spectrum (b) of clearer water close to Helgoland
Input to the Neural NetworkConsequence of the strange RLw of MERIS is that the neural network (NN) algorithm for the retrieval of waterconstituents is fed with spectra, which are out of training range. We have tested this with the NN processor for some ofthe spectra. The NN-processor consists of three NNs [2], the inverse NN produces the optical coefficients bp (scatteringby all particles), agpb (absorption by gelbstoff plus by all particles after bleaching) and apig (absorption byphytoplankton pigments). The forward NN computes the RLw from these properties and the third NN compares themeasured RLw with the computed RLw. When the inverse NN is fed with a spectrum, which is out of range of thespectra used for training, an out-of-range flag will be switched on by the compare-NN. Nearly all MERIS spectra, whichwe have analysed, are out of training range. Fig. 8 gives two examples of the transect of July 29. They include the resultof an alternative NN, which was used to test if MERIS band 9 could have produced some problems. Very obvious is thelarge deviation between MERIS RLw and the corresponding recomputed RLw spectrum. Due to the large deviation,which is true for all spectra, we cannot expect that the inverse NN produces correct results.
Fig. 8 Comparison between MERIS water leaving radiance reflectance (black line) and the corresponding spectraproduced with the forward NN with input from the inverse NN (red, without band 9,and green line with all bands)
Comparison of derived concentrationsThe last step of this preliminary validation was to compare the concentrations between the water sample and thosecomputed with the NN. As said above, since the input to the NN is out of range, this comparison is of very limited value.Fig. 9a shows the concentrations of pigments expressed as chlorophyll a, of TSM scattering expressed as TSM dryweight and the absorption by gelbstoff plus bleached particles along the transect of July 29. Obvious are gaps at thoselocations, which are present in the RLw (s. Fig. 4). The general trends of TSM and agpb show a decrease fromCuxhaven to Helgoland, which agrees with observations. However, the pigment concentration (pig2) is too high, whilepig1, which is the chlorophyll concentration produced with the case 1 water algorithm, is in the expected range.
- 5 -
MERIS 14-08-02C03 Cux-Helg. St3
Rrs[/sr]
0
0.002
0.004
0.006
0.008
0.01
0.012
0.014
400 450 500 550 600 650 700 750 800 850 900
nm
[/sr
]
c0303
C0303Tri
MERIS 14-08-02C03 Cux-Helg. St6
Rrs[/sr]
0
0.001
0.002
0.003
0.004
0.005
0.006
400 450 500 550 600 650 700 750 800 850 900
nm
[/sr
]
c0306-match
C0306Tri
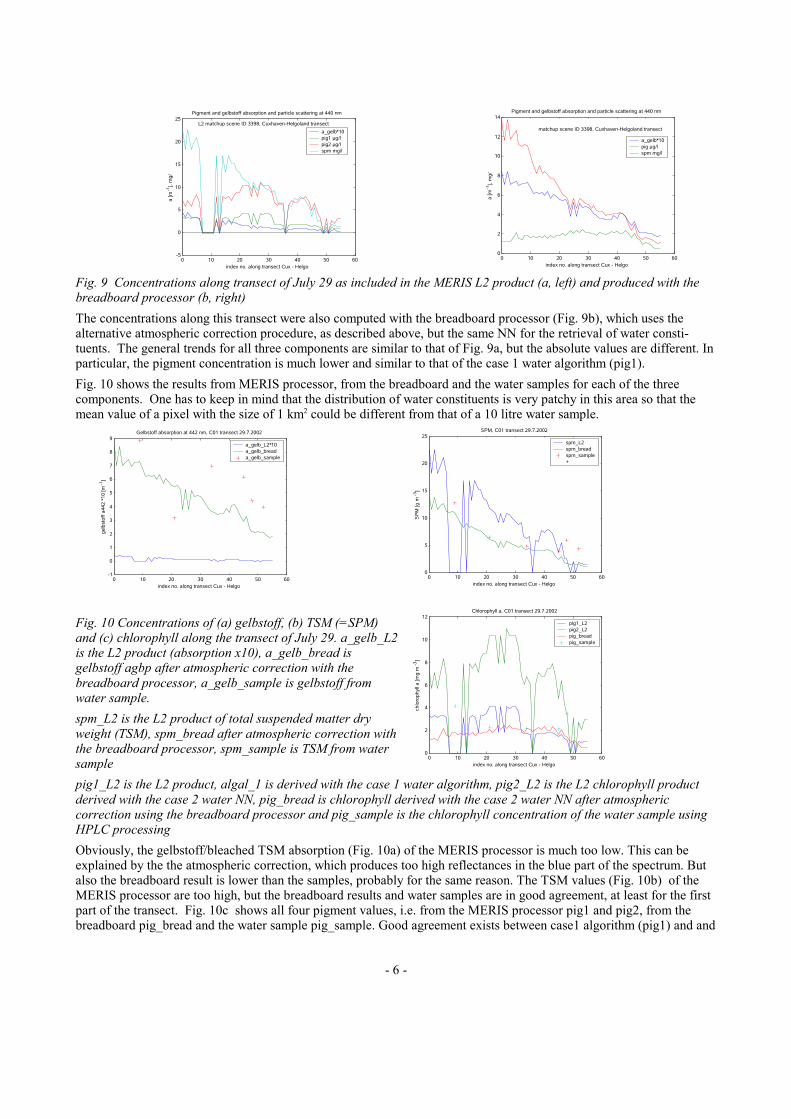
Fig. 9 Concentrations along transect of July 29 as included in the MERIS L2 product (a, left) and produced with thebreadboard processor (b, right) The concentrations along this transect were also computed with the breadboard processor (Fig. 9b), which uses thealternative atmospheric correction procedure, as described above, but the same NN for the retrieval of water consti-tuents. The general trends for all three components are similar to that of Fig. 9a, but the absolute values are different. Inparticular, the pigment concentration is much lower and similar to that of the case 1 water algorithm (pig1).Fig. 10 shows the results from MERIS processor, from the breadboard and the water samples for each of the threecomponents. One has to keep in mind that the distribution of water constituents is very patchy in this area so that themean value of a pixel with the size of 1 km2 could be different from that of a 10 litre water sample.
Fig. 10 Concentrations of (a) gelbstoff, (b) TSM (=SPM)and (c) chlorophyll along the transect of July 29. a_gelb_L2is the L2 product (absorption x10), a_gelb_bread isgelbstoff agbp after atmospheric correction with thebreadboard processor, a_gelb_sample is gelbstoff fromwater sample.spm_L2 is the L2 product of total suspended matter dryweight (TSM), spm_bread after atmospheric correction withthe breadboard processor, spm_sample is TSM from watersamplepig1_L2 is the L2 product, algal_1 is derived with the case 1 water algorithm, pig2_L2 is the L2 chlorophyll productderived with the case 2 water NN, pig_bread is chlorophyll derived with the case 2 water NN after atmosphericcorrection using the breadboard processor and pig_sample is the chlorophyll concentration of the water sample usingHPLC processingObviously, the gelbstoff/bleached TSM absorption (Fig. 10a) of the MERIS processor is much too low. This can beexplained by the the atmospheric correction, which produces too high reflectances in the blue part of the spectrum. Butalso the breadboard result is lower than the samples, probably for the same reason. The TSM values (Fig. 10b) of theMERIS processor are too high, but the breadboard results and water samples are in good agreement, at least for the firstpart of the transect. Fig. 10c shows all four pigment values, i.e. from the MERIS processor pig1 and pig2, from thebreadboard pig_bread and the water sample pig_sample. Good agreement exists between case1 algorithm (pig1) and and
- 6 -
0 10 20 30 40 50 60-5
0
5
10
15
20
25
index no. along transect Cux - Helgo
a [m
-1],
mg/
Pigment and gelbstoff absorption and particle scattering at 440 nm
L2 matchup scene ID 3398, Cuxhaven-Helgoland transecta_gelb*10pig1 µg/l pig2 µg/l spm mg/l
0 10 20 30 40 50 60-5
0
5
10
15
20
25
index no. along transect Cux - Helgo
a [m
-1],
mg/
Pigment and gelbstoff absorption and particle scattering at 440 nm
L2 matchup scene ID 3398, Cuxhaven-Helgoland transecta_gelb*10pig1 µg/l pig2 µg/l spm mg/l
0 10 20 30 40 50 600
2
4
6
8
10
12
14
index no. along transect Cux - Helgo
a [m
-1],
mg/
Pigment and gelbstoff absorption and particle scattering at 440 nm
matchup scene ID 3398, Cuxhaven-Helgoland transect
a_gelb*10pig µg/l spm mg/l
0 10 20 30 40 50 600
2
4
6
8
10
12
14
index no. along transect Cux - Helgo
a [m
-1],
mg/
Pigment and gelbstoff absorption and particle scattering at 440 nm
matchup scene ID 3398, Cuxhaven-Helgoland transect
a_gelb*10pig µg/l spm mg/l
0 10 20 30 40 50 60-1
0
1
2
3
4
5
6
7
8
9
index no. along transect Cux - Helgo
gelb
stof
fa44
2 *1
0 [m
-1]
Gelbstoff absorption at 442 nm, C01 transect 29.7.2002
a_gelb_L2*10 a_gelb_bread a_gelb_sample
0 10 20 30 40 50 60-1
0
1
2
3
4
5
6
7
8
9
index no. along transect Cux - Helgo
gelb
stof
fa44
2 *1
0 [m
-1]
Gelbstoff absorption at 442 nm, C01 transect 29.7.2002
a_gelb_L2*10 a_gelb_bread a_gelb_sample
0 10 20 30 40 50 600
5
10
15
20
25
index no. along transect Cux - Helgo
SPM
[g m
-3]
SPM, C01 transect 29.7.2002
spm_L2 spm_bread spm_sample+
0 10 20 30 40 50 600
5
10
15
20
25
index no. along transect Cux - Helgo
SPM
[g m
-3]
SPM, C01 transect 29.7.2002
spm_L2 spm_bread spm_sample+
0 10 20 30 40 50 600
2
4
6
8
10
12
index no. along transect Cux - Helgo
chlo
roph
ylla
[mg
m-3
]
Chlorophyll a, C01 transect 29.7.2002
pig1_L2 pig2_L2 pig_bread pig_sample
0 10 20 30 40 50 600
2
4
6
8
10
12
index no. along transect Cux - Helgo
chlo
roph
ylla
[mg
m-3
]
Chlorophyll a, C01 transect 29.7.2002
pig1_L2 pig2_L2 pig_bread pig_sample
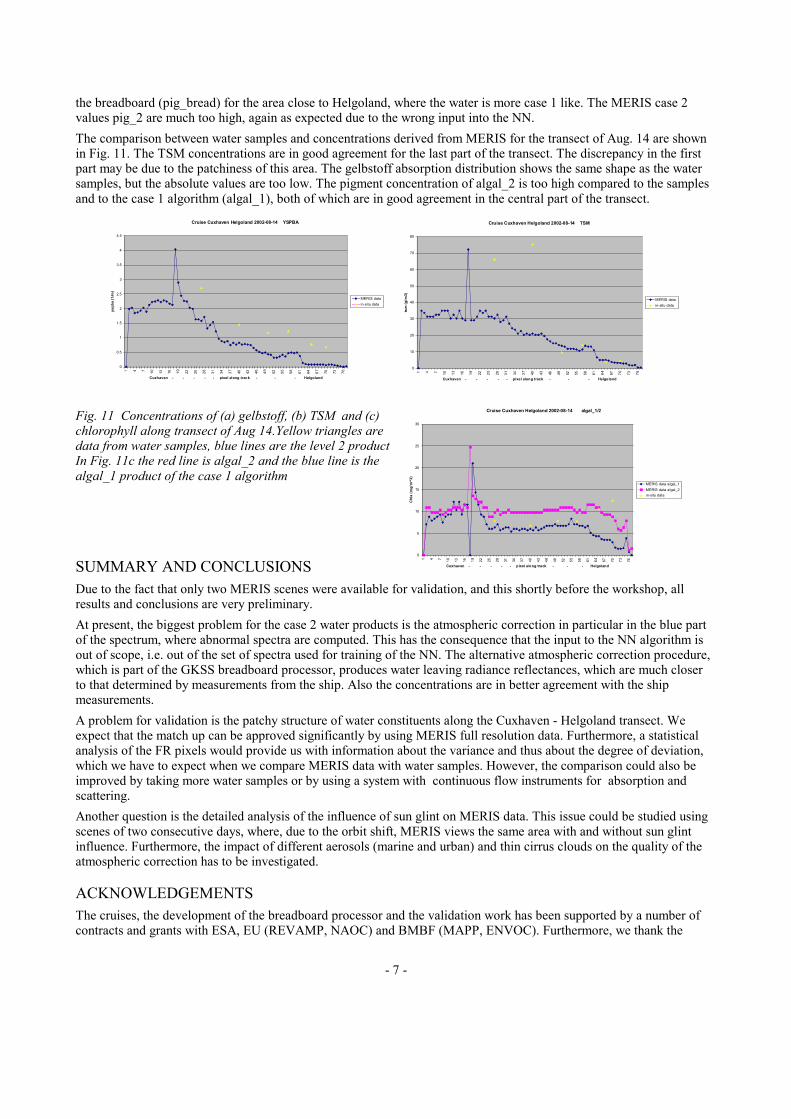
the breadboard (pig_bread) for the area close to Helgoland, where the water is more case 1 like. The MERIS case 2values pig_2 are much too high, again as expected due to the wrong input into the NN. The comparison between water samples and concentrations derived from MERIS for the transect of Aug. 14 are shownin Fig. 11. The TSM concentrations are in good agreement for the last part of the transect. The discrepancy in the firstpart may be due to the patchiness of this area. The gelbstoff absorption distribution shows the same shape as the watersamples, but the absolute values are too low. The pigment concentration of algal_2 is too high compared to the samplesand to the case 1 algorithm (algal_1), both of which are in good agreement in the central part of the transect.
Fig. 11 Concentrations of (a) gelbstoff, (b) TSM and (c)chlorophyll along transect of Aug 14.Yellow triangles aredata from water samples, blue lines are the level 2 productIn Fig. 11c the red line is algal_2 and the blue line is thealgal_1 product of the case 1 algorithm
SUMMARY AND CONCLUSIONSDue to the fact that only two MERIS scenes were available for validation, and this shortly before the workshop, allresults and conclusions are very preliminary. At present, the biggest problem for the case 2 water products is the atmospheric correction in particular in the blue partof the spectrum, where abnormal spectra are computed. This has the consequence that the input to the NN algorithm isout of scope, i.e. out of the set of spectra used for training of the NN. The alternative atmospheric correction procedure,which is part of the GKSS breadboard processor, produces water leaving radiance reflectances, which are much closerto that determined by measurements from the ship. Also the concentrations are in better agreement with the shipmeasurements.A problem for validation is the patchy structure of water constituents along the Cuxhaven - Helgoland transect. Weexpect that the match up can be approved significantly by using MERIS full resolution data. Furthermore, a statisticalanalysis of the FR pixels would provide us with information about the variance and thus about the degree of deviation,which we have to expect when we compare MERIS data with water samples. However, the comparison could also beimproved by taking more water samples or by using a system with continuous flow instruments for absorption andscattering.Another question is the detailed analysis of the influence of sun glint on MERIS data. This issue could be studied usingscenes of two consecutive days, where, due to the orbit shift, MERIS views the same area with and without sun glintinfluence. Furthermore, the impact of different aerosols (marine and urban) and thin cirrus clouds on the quality of theatmospheric correction has to be investigated.
ACKNOWLEDGEMENTSThe cruises, the development of the breadboard processor and the validation work has been supported by a number ofcontracts and grants with ESA, EU (REVAMP, NAOC) and BMBF (MAPP, ENVOC). Furthermore, we thank the
- 7 -
Cruise Cuxhaven Helgoland 2002-08-14 TSM
0
10
20
30
40
50
60
70
80
1 4 7 10 13 16 19 22 25 28 31 34 37 40 43 46 49 52 55 58 61 64 67 70 73 76
Cuxhaven - - - - - pixel along track - - - Helgoland
tsm
(g/m
3)
MERIS datain-situ data
Cruise Cuxhaven Helgoland 2002-08-14 YSPBA
0
0.5
1
1.5
2
2.5
3
3.5
4
4.5
1 4 7 10 13 16 19 22 25 28 31 34 37 40 43 46 49 52 55 58 61 64 67 70 73 76
Cuxhaven - - - - - pixel along track - - - Helgoland
yspb
a (1
/m)
MERIS datain-situ data
Cruise Cuxhaven Helgoland 2002-08-14 algal_1/2
0
5
10
15
20
25
301 4 7 10 13 16 19 22 25 28 31 34 37 40 43 46 49 52 55 58 61 64 67 70 73 76
Cuxhaven - - - - - pixel along track - - - Helgoland
Chl
a (m
g/m
^3)
MERIS data algal_1MERIS data algal_2in-situ data

crews of RV "Heincke" and MS "Wappen von Hamburg" for their support.
REFERENCES1. Doerffer, R., MAVT, Protocols for the Validation of MERIS Water Products, ESA/ACRI Doc. PO-TN-MEL-GS-0043, 20022. Doerffer, R., Heymann, K., Schiller, H., Case 2 Water Algorithm for the medium resolution imaging spectrometerMeris on Envisat, ESA Report, this volume, 20033. ACRI, Reference model for MERIS level 2 processing, Internal ESA document prepared by ACRI, Doc. No. PO-TN-MEL-GS-0026, issue 4, release 13 July 20014. Doerffer, R. and Schiller, H., Pigment index, sediment and gelbstoff retrieval from directional water leavingradiance reflectances using inverse modelling technique, Algorithm Theoretical Basis Document ATBD 2.12, ESACoc. No. PO-TN-MEL-GS-0005, 12.1 – 12.73, 1997, it can be downloaded from:http://www.estec.esa.nl/envisat/Satellite/Instruments/MERIS/pdf/atbd2_12.pdf
- 8 -