meritz securities co., ltd. and itssubsidiaries
TRANSCRIPT

Meritz Securities Co., Ltd. and its subsidiaries
Consolidated financial statementsfor the years ended December 31, 2016 and 2015
with independent auditors’ report

Table of contents
Independent auditors’ report
PageConsolidated financial statements
Consolidated statements of financial position 1
Consolidated statements of comprehensive income 2
Consolidated statements of changes in equity 3
Consolidated statements of cash flows 4
Notes to the consolidated financial statements 6
Independent auditors’ report
The Shareholders and Board of DirectorsMeritz Securities Co., Ltd. and its subsidiaries.
We have audited the accompanying consolidated financial statements of Meritz Securities Co., Ltd. (the“Company”) and its subsidiaries (collectively referred to as the “Group”), which comprise the consolidatedstatements of financial position as at December 31, 2016 and 2015, and the consolidated statements ofcomprehensive income, consolidated statements of changes in equity and consolidated statements of cashflows for the years then ended, and a summary of significant accounting policies and other explanatoryinformation.
Management's Responsibility for the Consolidated Financial StatementsManagement is responsible for the preparation and fair presentation of these consolidated financial statementsin accordance with Korean International Financial Reporting Standards, and for such internal control asmanagement determines is necessary to enable the preparation of the consolidated financial statements thatare free from material misstatement, whether due to fraud or error.
Auditors’ ResponsibilityOur responsibility is to express an opinion on these consolidated financial statements based on our audits. Weconducted our audits in accordance with auditing standards generally accepted in the Republic of Korea. Thosestandards require that we comply with ethical requirements and plan and perform the audit to obtain reasonableassurance about whether the consolidated financial statements are free from material misstatement.
An audit involves performing procedures to obtain audit evidence about the amounts and disclosures in theconsolidated financial statements. The procedures selected depend on the auditors’ judgment, including theassessment of the risks of material misstatement of the consolidated financial statements, whether due to fraudor error. In making those risk assessments, the auditors consider internal control relevant to the entity'spreparation and fair presentation of the consolidated financial statements in order to design audit proceduresthat are appropriate in the circumstances, but not for the purpose of expressing an opinion on the effectivenessof the entity's internal control. An audit also includes evaluating the appropriateness of accounting policies usedand the reasonableness of accounting estimates made by management, as well as evaluating the overallpresentation of the consolidated financial statements.
We believe that the audit evidence we have obtained is sufficient and appropriate to provide a basis for ouraudit opinion.
OpinionIn our opinion, the consolidated financial statements present fairly, in all material respects, the financial positionof the Group as at December 31, 2016 and 2015, and its financial performance and cash flows for the yearsthen ended in accordance with Korean International Financial Reporting Standards.
March 15, 2017This audit report is effective as at March 15, 2017, the independent auditors’ report date. Accordingly, certainmaterial subsequent events or circumstances may have occurred during the period from the date of theindependent auditors’ report to the time this report is used. Such events and circumstances could significantlyaffect the accompanying consolidated financial statements and may result in modifications to this report.

Meritz Securities Co., Ltd. and its subsidiaries
Consolidated financial statementsfor the years ended December 31, 2016 and 2015
“The accompanying consolidated financial statements, including all footnotes and disclosures, have beenprepared by, and are the responsibility of, the Group.”
Alexander Heemoon ChoiChief Executive OfficerMeritz Securities Co., Ltd.

(Korean won in thousands)
NotesAssetsCash and due from banks 7, 37, 43, 44, 47 \ 816,956,144 \ 646,068,280Financial assets at fair value 8, 23, 37, 43, 44, 45, 47 8,051,294,747 7,470,734,837
through profit or lossAvailable-for-sale financial assets 9, 37, 43, 44, 47 1,574,562,097 733,421,016Investments in associates 10, 37 231,751,610 25,186,159
and joint venturesLoans 11, 43, 44, 45, 47 5,477,539,160 4,449,846,184CMA 11, 43, 44, 47 28,009,548 54,820,249Lease assets 12, 43, 44, 47 260,006,034 472,664,412Property and equipment 13 99,645,669 101,299,873Investment property 14 21,163,351 30,052,288Intangible assets 15 35,713,934 40,451,501Tax assets 35 65,029,381 45,992,366Other assets 16, 37, 43, 44, 45, 47 606,141,558 358,131,463Total assets \ 17,267,813,233 \ 14,428,668,628
LiabilitiesDeposits 17, 37, 43, 44, 47 \ 3,102,818,819 \ 3,463,870,842Financial liabilities at fair value 18, 23, 37, 43, 44, 45, 47 2,626,203,945 1,196,829,299
through profit or lossBorrowings 19, 43, 44, 45, 47 8,974,565,294 7,364,956,845Provisions 20, 39 10,186,258 6,865,566Defined benefit liabilities 21 2,628,149 1,506,629Tax liabilities 35 14,966,779 76,054,817Other liabilities 22, 37, 43, 44, 45, 47 658,133,762 600,020,384Total liabilities \ 15,389,503,006 \ 12,710,104,382
EquityIssued capital 24 \ 496,638,534 \ 496,638,534Capital surplus and adjustments 25, 26 553,151,474 552,416,177Accumulated other comprehensive income 27 79,007,654 69,538,207Retained earnings 28 749,512,565 599,971,328
Equity attributable to equity holder of the parent 1,878,310,227 1,718,564,246Non-controlling shareholders' equity - -Total equity \ 1,878,310,227 \ 1,718,564,246Total liabilities and equity \ 17,267,813,233 \ 14,428,668,628
The accompanying notes are an integral part of the consolidated financial statements
December 31, 2015
as at December 31, 2016 and 2015
Meritz Securities Co., Ltd. and its subsidiariesConsolidated statements of financial position
December 31, 2016
1

Consolidated statements of comprehensive incomefor the years ended December 31, 2016 and 2015(Korean won in thousands)
NotesOperating revenues:
Commission income 29 \ 343,273,840 \ 346,740,943Gain on valuation and disposal of financial instruments 30 498,547,762 471,392,957Gain on derivative valuation and transactions 23, 30 2,560,164,797 1,557,499,954Interest income 31 478,379,756 438,896,325Gain on valuation and disposal of loans 11 8,294,777 25,229,847Gain on foreign exchange transactions 1,009,782,003 291,664,682Lease income 12 27,107,273 40,010,387Others 33 21,051,457 69,613,838
4,946,601,665 3,241,048,933
Operating expenses:Commission expenses 29 (29,693,021) (21,292,401)Loss on valuation and disposal of financial instruments 30 (502,413,130) (314,277,243)Loss on derivative valuation and transactions 23, 30 (2,497,752,034) (1,546,492,097)Interest expenses 31 (242,891,204) (223,139,350)Loss on valuation and disposal of loans 11 (11,352,283) (14,759,959)Loss on foreign exchange transactions (1,009,575,611) (308,845,807)General and administrative expenses 32 (319,643,722) (395,222,256)Lease expense 12 (1,052,273) (1,587,037)Others 33 (5,372,412) (10,312,629)
(4,619,745,690) (2,835,928,779)
Operating income 326,855,975 405,120,154Other income 34 8,630,514 4,233,589Other expenses 34 (2,883,630) (2,865,106)
Income before income taxes 332,602,859 406,488,637Income tax expense 35 (78,756,155) (119,151,902)
Net income 28 \ 253,846,704 \ 287,336,735
Other comprehensive income:Items that will not be reclassified subsequently to profit or loss:
Remeasurements of the net defined benefit liabilities 21 (36,999) (293,932)
Items that may be reclassified subsequently to profit or loss:Gain (loss) on valuation of available-for-sale financial assets 9 8,970,776 (58,971,291)Gain (loss) on effect of foreign currency translation (10,155) 10,542Capital change in equity method 545,824 -
9,469,446 (59,254,681)Total comprehensive income: \ 263,316,150 \ 228,082,054
Controlling interests 263,316,150 237,469,543Non-controlling interests - (9,387,489)
Basic and diluted earnings per share 36 \ 560 \ 812
The accompanying notes are an integral part of the consolidated financial statements
Year endedDecember 31, 2015
Year endedDecember 31,
Meritz Securities Co., Ltd. and its subsidiaries
2

Meritz Securities Co., Ltd. and its subsidiariesConsolidated statements of changes in equityfor the years ended December 31, 2016 and 2015(Korean won in thousands)
\ 311,782,377 \ 111,625,899 \ 128,205,667 \ 348,143,771 \ 177,373,799 \ 1,077,131,513- - - (44,309,445) - (44,309,445)
- - - 296,137,002 (8,800,267) 287,336,735
Remeasurements of the net defined benefit liabilities - - (341,683) - 47,751 (293,932)Gain (loss) on valuation of - - (58,335,932) - (635,360) (58,971,292)
available-for-sale financial assetsGain (loss) on foreign currency transactions - - 10,155 - 387 10,542
50,000 14,709 - - - 64,70966,811,951 144,828,868 - - (167,986,310) 43,654,509
117,994,206 295,366,946 - - - 413,361,152Acquisition of treasury shares - (3,744) - - - (3,744)Allocated expense , of stock options - 583,499 - - - 583,499
\ 496,638,534 \ 552,416,177 \ 69,538,207 \ 599,971,328 \ - \ 1,718,564,246
\ 496,638,534 \ 552,416,177 \ 69,538,207 \ 599,971,328 \ - \ 1,718,564,246- - - (104,305,466) - (104,305,466)
- - - 253,846,703 - 253,846,703
Remeasurements of the net defined benefit liabilities - - (36,999) - - (36,999)Gain (loss) on valuation of - - 8,970,777 - - 8,970,777
available-for-sale financial assetsCapital change in equity method - - 545,824 - - 545,824Gain (loss) on foreign currency transactions - - (10,155) - - (10,155)
Allocated expense, of stock options - 735,297 - - - 735,297\ 496,638,534 \ 553,151,474 \ 79,007,654 \ 749,512,565 \ - \ 1,878,310,227
The accompanying notes are an integral part of the consolidated financial statements
TotalAs at January 1, 2016DividendsTotal comprehensive income: Net income
Issued capitalCapitalsurplus
Accumulatedother
comprehensiveincome
Retainedearnings
Non-controllingshareholders'
equity
TotalAs at January 1, 2015DividendsTotal comprehensive income: Net income
Issued capitalCapitalsurplus
Accumulatedother
comprehensiveincome
Retainedearnings
Non-controllingshareholders'
equity
Other comprehensive income:
New issuance of stocks for stock options
As at December 31, 2015
Other comprehensive income:
As at December 31, 2016
New issuance of stocks for mergerCapital increase with consideration
3

Meritz Securities Co., Ltd. and its subsidiariesConsolidated statements of cash flowsfor the years ended December 31, 2016 and 2015(Korean won in thousands)
Operating activities:Net income before income taxes \ 332,602,859 \ 406,488,637Adjustments to non-cash items :
Loss (gain) on valuation of financial instruments held-for-trading 21,221,231 2,924,442Loss (gain) on derivative valuation, net (18,171,280) (20,288,450)Loss (gain) on valuation of financial assets designated at fair value through profit or loss, net 12,776,898 (1,905,440)Loss(gain) on evaluation of other financial instruments, net (6,016) (7)Provision(reversal) of allowance for doubtful accounts 11,071,679 13,930,308
197,549 19,005(2,310,496) (372,903)
Depreciation of property and equipment 5,891,509 5,956,023Amortization of intangible assets 7,109,290 7,188,060Depreciation expenses on operating lease assets 242,586 747,426Loss (gain) related to financial investments available-for-sale, net (5,362,532) (70,589,968)Loss (gain) related to lease, net (22,743) (8,383)Contribution to provision (reversal) 3,693,244 (199,193)Provision(reversal) of credit risk adjustments (71,309) 354,032Day 1 profit or loss adjustments (reversal) 120,786 260,353Post-employment benefit 4,382,567 4,510,330Loss (gain) on valuation of incentives (6,457,233) 2,842,712Compensation expenses associated with stock option 735,297 583,499Other operating revenues (695,020) (721,219)Loss (gain) on disposal of property and equipment, net 235,249 24,638Loss (gain) on disposal of investment property 85,597 -Loss (gain) on disposal of intangible assets, net (244,305) -Loss (gain) on disposal of investments (875,416) (1,294,608)in associates, subsidiaries and joint venture, net
Impairment loss on intangible assets - 2,565,669Loss (gain) in equity method (2,453,020) -Impairment loss on investments in associates and joint venture (reversal) (34,661) 34,243Interest income (502,991,670) (475,619,291)Interest expense 242,891,204 223,139,350Dividend income (13,474,703) (19,561,558)
(242,515,718) (325,480,930)Changes in operating assets and liabilities:
Cash and Due from banks (59,170,369) (48,646,097)Held-for-trading financial assets (547,914,581) -Financial assets at fair value through profit or loss (94,051,657) (1,481,008,573)Loans (1,028,417,146) (1,073,149,191)CMA 26,900,000 3,100,000Lease assets 212,694,088 135,801,767Other assets (237,711,408) (160,206,111)Due to customers (368,826,811) 191,098,142Held-for-trading financial liabilities 1,278,318,269 -Financial liabilities at fair value through profit or loss 155,774,833 (249,292,242)Provisions (773,622) (119,571)Defined benefit liabilities (3,309,775) (7,783,030)Other liabilities 96,925,870 167,140,433
(569,562,309) (2,523,064,473)
Total interest received 461,509,698 469,210,993Total interest paid (232,003,147) (218,474,032)Total dividends received 12,929,783 19,500,268Income tax paid (161,846,522) (90,995,945)
Net cash flows used in operating activities (398,885,356) (2,262,815,482)
Year endedDecember 31,
2016
Year endedDecember 31,
2015
Provision(reversal) of other allowance for doubtful accountsLoss (gain) on foreign currency translation, net
4

Meritz Securities Co., Ltd. and its subsidiariesConsolidated statements of cash flowsfor the years ended December 31, 2016 and 2015(Korean won in thousands)(Continued)
Investing activities:Disposal of financial assets available-for-sale \ 1,820,102,518 \ 574,862,656Disposal of invetment associates and joint venture 410,649,725 -Receipt of dividends from assoiciates 2,515,298 -Disposal of property and equipment 292,214 -Disposal of investment property 8,246,382 -Decrease in intangible assets 2,175,007 -
632,588 832,405(2,615,309,352) (602,729,718)
(615,771,561) -Acquisition of property and equipment (3,835,109) (5,271,313)Acquisition of intangible assets (3,872,753) (1,353,138)
(1,691,326) (696,065)Disposal of investments in subsidiaries (Note 41) (307,945) (28,158,040)
Net cash flows used in investing activities (996,174,314) (62,513,213)
Financing activities:1,609,550,628 2,071,137,851
Cost of stock issuing - 413,070,180Acquisition of treasury stock - (3,744)Subsidary's appraisal right by stockholders - (259,702)
(104,305,466) (44,309,445)Net cash provided by financing activities 1,505,245,162 2,439,635,140
Net increase in cash and cash equivalents 110,185,492 114,306,445Effect from exchange rate changes on cash and cash equivalents 776,176 228,025Cash and cash equivalents at the beginning of the year (Note 7) 546,225,923 431,691,453Cash and cash equivalents at the end of the year (Note 7, 41) \ 657,187,591 \ 546,225,923
The accompanying notes are an integral part of the consolidated financial statements
Year endedDecember 31,
2016
Year endedDecember 31,
2015
Decrease in guarantee depositsAcquisition of financial assets available-for-saleAcquisition of investment associates and joint venture
Increase in guarantee deposits
Increase in borrowings, net
Dividends paid
5

Meritz Securities Co., Ltd. and its subsidiariesNotes to the consolidated financial statementsDecember 31, 2016 and 2015
6
1. Group information
Meritz Securities Co., Ltd. (the "Company") was established on February 24, 1973 under the name of HanilSecurities Co., Ltd. and primarily engages in the securities business including brokerage service, proprietarytrading and underwriting of securities. The Company changed its name to Hanjin Investment Securities Co.,Ltd. on October 1, 1990 and finally changed its current name to Meritz Securities Co., Ltd. on March 1, 2000.
The Company merged its subsidiary, Meritz Investment Bank Co., Ltd. (“Meritz IB”) on April 1, 2010. As aresult of the merger, the Company is allowed to maintain Meritz IB’s operation, which is various financialservices related to commercial paper, providing corporate loans and payment guarantees and other relatedservices, until March 2020 according to the Financial Investment Industry Regulations. The Companyoperates through a network of the main office, 7 domestic branches including 1 sales department.
The Company prepared consolidated financial statements of the Company and its subsidiaries (see Note 2)(collectively referred to as the “Group”) in accordance with KIFRS 1110 Consolidated Financial Statements.Investments in an associate and interest in a joint venture are accounted for using the equity method in theconsolidated financial statements.
The Company is listed on the Korea Exchange (“KRX”), and the major shareholders of the Company as ofDecember 31, 2016 are as follows:
ShareholdersNumber of
shares
Percentageof ownership
(%)Meritz Financial Group Inc.(“Meritz FG”) 160,702,302 32.36
Cho Jeong Ho 6,424,646 1.29Treasury Stock 43,136,506 8.69Others 286,375,080 57.66
496,638,534 100.00
2. Scope of consolidation
2.1 The Company’s equity ownership in its consolidated subsidiaries as of the reporting date issummarized as follows:
December 31, 2016
Investee CountryOwnersh
ip (%) Company Main Business Type of controlEugene Separate Taxation High-
Yield PE No.2 Korea 100.00 Investment fund and trust
Investment insecurities etc. Equity holding
Eugene Separate Taxation High-Yield PE No.7
Korea 90.45 Investment fund and trust
Investment insecurities etc. Equity holding
Kiwoom Separate Taxation High-Yield No.2 Korea 69.33 Investment fund
and trustInvestment in
securities etc. Equity holding
Daishin Separate Taxation High-Yield Private Investment TrustNo.2
Korea 67.21 Investment fund and trust
Investment insecurities etc. Equity holding
Sparx Separate Taxation High-Yield No.1 Korea 99.21 Investment fund
and trustInvestment in
securities etc. Equity holding
Capstone Private MBS Real EstateInvestment Trust No.2 Korea 100.00 Investment fund
and trustInvestment in
securities etc. Equity holding
Capstone Private MBS Real EstateInvestment Trust No.3 Korea 100.00 Investment fund
and trustInvestment in
securities etc. Equity holding
Smart-S 6th SecuritizationSpecialty Co., Ltd. Korea 1.00 Special purpose
companySecuritization of backed asset
ABS holding,a shareholder with the right of residuaryestate
Smart-S 8th SecuritizationSpecialty Co., Ltd. Korea 1.00 Special purpose
companySecuritization of backed asset
ABS holding,a shareholder with the right of residuaryestate

Meritz Securities Co., Ltd. and its subsidiariesNotes to the consolidated financial statementsDecember 31, 2016 and 2015
7
2.1 The Company’s equity ownership in its consolidated subsidiaries as of the reporting date issummarized as follows: (cont’d)
December 31, 2016
Investee CountryOwnership
(%) Company Main Business Type of control
Smart-S 10th SecuritizationSpecialty Co., Ltd. Korea 1.00 Special purpose
companySecuritization of ba cked asset
ABS holding,a shareholder with the right ofresiduaryestate
Meritz Securitization Specialty Co.,Ltd. Korea 0.90 Special purpose
companySecuritization of backed asset
A shareholder with theright ofresiduary estate
M Square Gyeyang 1st Korea - Special purposecompany
Securitization of loans on real estates
Mortgage loancommitment
M Square Gyeyang 2nd Korea - Special purposecompany
Securitization of loans on real estates
Mortgage loancommitment
M Square Sungsu 1st Korea - Special purposecompany
Securitization of loans on real estates
Mortgage loancommitment
M Square Pyeongchon 1st Korea - Special purposecompany
Securitization of loans on real estates
Mortgage loancommitment
M Square Dongcheon 1st Korea - Special purposecompany
Securitization of loans on real estates
Mortgage loancommitment
MJD 1st Korea - Special purposecompany
Securitization of loans on real estates
Mortgage loancommitment
Daegu SG Korea - Special purposecompany
Securitization of loans on real estates
Mortgage loancommitment
New Commons 1st Korea - Special purposecompany
Securitization of backed asset General loan
Haeundae Project 1st Korea - Real estatefinance
Loans on real estates
Mortgage loancommitmentand general loan
Haeundae Project 2nd Korea - Real estatefinance
Loans on real estates
Mortgage loancommitmentand general loan
M Square Shihung 1st Korea - Special purposecompany
Securitization of loans on real estates
Mortgage loancommitment
Sungbok 1st Korea - Special purposecompany
Securitization of loans on real estates
Mortgage loancommitment
M Square Osan 1st Korea - Special purposecompany
Securitization of loans on real estates
Mortgage loancommitment
DM 1st Korea - Real estatefinance
Loans on real estates General loan
M Square Sangbong 2nd Korea - Special purposecompany
Securitization of loans on real estates
Mortgage loan commitment
M Square Woodong 1st Korea - Special purposecompany
Securitization of loans on real estates
Mortgage loan commitment
M Square Dadam Korea - Special purposecompany
Securitization of loans on real estates
Mortgage loan commitment
M Square Yangsan 1st Korea - Special purposecompany
Securitization of loans on real estates
Mortgage loan commitment
Sanbon Master Plaza 1st Korea - Special purposecompany
Securitization of loans on real estates
Mortgage loan commitment
and general loan
M Square Jochon1st Korea - Real estatefinance
Securitization of loans on real estates
Mortgage loan commitment
and general loan
M Square Gunsan 1st Korea - Special purposecompany
Securitization of loans on real estates
Mortgage loan commitment
Yongin Sungbok 1st Korea - Special purposecompany
Securitization of loans on real estates
Mortgage loan commitment
Aberlour 1st Korea - Special purposecompany
Securitization of backed asset
Mortgage loan commitment

Meritz Securities Co., Ltd. and its subsidiariesNotes to the consolidated financial statementsDecember 31, 2016 and 2015
8
2.1 The Company’s equity ownership in its consolidated subsidiaries as of the reporting date issummarized as follows: (cont’d)
December 31, 2016
Investee CountryOwnership
(%) Company Main Business Type of control
Smart Lake 1st Korea - Special purposecompany
Securitization of loans on real estates
Mortgage loan commitment
Dongdaemun H 1st Korea - Special purposecompany
Securitization of loans on real estates
Mortgage loan commitment
Nice Penta 1st Korea - Special purposecompany
Securitization of loans on real estates
Mortgage loan commitment
MDS 1st Korea - Special purposecompany
Securitization of backed asset
Mortgage loan commitment
AM1st Korea - Special purposecompany
Securitization of backed asset
Mortgage loan commitment
SMK 1st Korea - Special purposecompany
Securitization of backed asset
Mortgage loan commitment
SMK 2nd Korea - Special purposecompany
Securitization of backed asset
Mortgage loan commitment
Smart R&D 1st Korea - Special purposecompany
Securitization of loans on real estates
Mortgage loan commitment
UPS 1st Korea - Special purposecompany
Securitization of loans on real estates
Mortgage loan commitment
Highest Ocean 1st Korea - Special purposecompany
Securitization of loans on real estates
Mortgage loan commitment
M Square Sagik 1st Korea - Special purposecompany
Securitization of loans on real estates
Mortgage loan commitment
M Square Chungju 1st Korea - Special purposecompany
Securitization of loans on real estates
Mortgage loan commitment
M Square Base 1st Korea - Special purposecompany
Securitization of loans on real estates
Mortgage loan commitment
Smart Dongcheon 1st Korea - Special purposecompany
Securitization of loans on real estates
Mortgage loan commitment
Smart Penta 1st Korea - Special purposecompany
Securitization of loans on real estates
Mortgage loan commitment
Real benefit Korea - Special purposecompany
Securitization ofbacked asset
Mortgage loan commitment
M Square Mia 2nd Korea - Special purposecompany
Securitization ofloans on real estates
Mortgage loan commitment
Smart Sanghyun 1st Korea - Special purposecompany
Securitization ofloans on real estates
Mortgage loan commitment
Yongin Sungbok 2nd Korea - Special purposecompany
Securitization ofloans on real estates
Mortgage loan commitment
Smartup 1st Korea - Special purposecompany
Securitization ofbacked asset
Mortgage loan commitment
Smartup 2nd Korea - Special purposecompany
Securitization ofbacked asset
Mortgage loan commitment
Smartup 3rd Korea - Special purposecompany
Securitization ofbacked asset
Mortgage loan commitment
CD Two 1st Korea - Special purposecompany
Securitization ofloans on real estates
Mortgage loan commitment
SLT 1st Korea - Special purposecompany
Securitization ofloans on real estates
Mortgage loan commitment
Msquare Mia third, Co., Ltd. Korea - Special purposecompany
Securitization ofloans on real estates
Mortgage loancommitment
Msquare Mia fourth, Co., Ltd. Korea - Special purposecompany
Securitization ofloans on real estates
Mortgage loancommitment
B Lake First Co., Ltd. Korea - Special purposecompany
Securitization ofloans on real estates
Mortgage loancommitment
MJ Sangmi First Co., Ltd. Korea - Special purposecompany
Securitization ofloans on real estates
Mortgage loancommitment
Apple SG Co., Ltd. Korea - Special purposecompany
Securitization ofloans on real estates
Mortgage loancommitment
DSM 3rd Co., Ltd. Korea - Special purposecompany
Securitization ofloans on real estates
Mortgage loancommitment
Yongjuksg Co., Ltd. Korea - Special purposecompany
Securitization ofloans on real estates
Mortgage loancommitment
AM3 Co., Ltd. Korea - Special purposecompany
Securitization ofbacked asset
Mortgage loancommitment

Meritz Securities Co., Ltd. and its subsidiariesNotes to the consolidated financial statementsDecember 31, 2016 and 2015
9
2.1 The Company’s equity ownership in its consolidated subsidiaries as of the reporting date issummarized as follows: (cont’d)
December 31, 2016
Investee CountryOwnership
(%) Company Main Business Type of control
Yongin Seongbok 4th Co., Ltd. Korea - Special purposecompany
Securitization ofloans on real estates
Mortgage loancommitment
Dujeong SG Co., Ltd. Korea - Special purposecompany
Securitization ofloans on real estates
Mortgage loancommitment
SL The Ocean 1st Co., Ltd. Korea - Special purposecompany
Securitization ofloans on real estates
Mortgage loancommitment
Haeundae SG Co., Ltd. Korea - Special purposecompany
Securitization ofloans on real estates
Mortgage loancommitment
Msquare Mia the first, Co., Ltd. Korea - Special purposecompany
Securitization ofloans on real estates
Mortgage loancommitment
H Society 3rd Inc. Korea - Special purposecompany
Securitization ofloans on real estates
Mortgage loancommitment
WE BEST Cheongdam 1st Co., Ltd. Korea - Special purposecompany
Securitization ofloans on real estates
Mortgage loancommitment
N.H.M.A 1 Co., Ltd. Korea - Special purposecompany
Securitization ofloans on real estates
Mortgage loancommitment
Doojung H.S 1 Co., Ltd. Korea - Special purposecompany
Securitization ofloans on real estates
Mortgage loancommitment
MSM 1ST Korea - Special purposecompany
Securitization ofloans on real estates
Mortgage loancommitment
Genius 2nd Co., Ltd. Korea - Special purposecompany
Securitization ofsecurities
Mortgage loancommitment
Msquare Myungji Co., Ltd. Korea - Special purposecompany
Securitization ofloans on real estates
Mortgage loancommitment
Yeksam Trinity 1st Co., Ltd. Korea - Special purposecompany
Securitization ofloans on real estates
Mortgage loancommitment
M SQUARE SONGJEONG Korea - Special purposecompany
Securitization ofloans on real estates
Mortgage loancommitment
SMART CHUNGDAM 1ST Co., Ltd. Korea - Special purposecompany
Securitization ofloans on real estates
Mortgage loancommitment
MBR Co., Ltd. Korea - Special purposecompany
Securitization ofloans on real estates
Mortgage loancommitment
AM 4th INC. Korea - Special purposecompany
Securitization ofbacked asset
Mortgage loancommitment
Yongin Sungbok 7th Korea - Special purposecompany
Securitization ofloans on real estates
Mortgage loancommitment
BK AGE Inc. Korea - Special purposecompany
Securitization ofloans on real estates
Mortgage loancommitment
Chams Fild Oh Kid Co., Ltd. Korea - Special purposecompany
Securitization ofbacked asset
ABS holding,a shareholder
M QUEENS 1st Inc. Korea - Special purposecompany
Securitization ofloans on real estates
Mortgage loancommitment
TH 1st Co., Ltd. Korea - Special purposecompany
Securitization ofloans on real estates
Mortgage loancommitment
H SOCIETY M Korea - Special purposecompany
Securitization ofloans on real estates
Mortgage loancommitment
SLT MISA Korea - Special purposecompany
Securitization ofloans on real estates
Mortgage loancommitment
WONJU SG Korea - Special purposecompany
Securitization ofloans on real estates
Mortgage loancommitment
MDMA 1ST Co., Ltd. Korea - Special purposecompany
Securitization ofloans on real estates
Mortgage loancommitment
My Best 1st Korea - Special purposecompany
Securitization ofloans on real estates
Mortgage loancommitment
Msquare Shihung 1st Co., Ltd. Korea - Special purposecompany
Securitization ofloans on real estates
Mortgage loancommitment
M square Sujeong Korea - Special purposecompany
Securitization ofloans on real estates
Mortgage loancommitment
Genius 1st Korea - Special purposecompany
Securitization ofbacked asset General loan
RREEF SPEZIAL INVEST GmbHtrust of security contract Korea 100.00 Investment fund
and trustInvestment in
securities etc. Equity holding
G New Jump Short-Term BondInvestment Trust 1 Korea 100.00 Investment fund
and trustInvestment in
securities etc. Equity holding

Meritz Securities Co., Ltd. and its subsidiariesNotes to the consolidated financial statementsDecember 31, 2016 and 2015
10
2.1.1 The entities included in or excluded from the scope of consolidation for the year endedDecember 31, 2016 are as follows:
SubsidiariesReason for
consolidationIncluded in the consolidation M Square Mia 3rd (*1)
M Square Mia 4th (*1)B Lake First Co., Ltd (*1)MJ Sangmi First Co., Ltd (*1)Apple SG Co., Ltd (*1)DSM 3rd Co., Ltd (*1)Yongjuksg Co., Ltd (*1)AM3 Co., Ltd (*1)Yongin Seongbok 4th Co., Ltd (*1)Dujeong SG Co., Ltd (*1)SL The Ocean 1st Co., Ltd (*1)Haeundae SG Co., Ltd (*1)Msquare Mia the first, Co., Ltd (*1)H Society 3rd Inc. (*1)WE BEST Cheongdam 1st Co., Ltd (*1)N.H.M.A 1 Co., Ltd (*1)Doojung H.S 1 Co., Ltd (*1)MSM 1ST (*1)Genius 2th Co., Ltd (*1)Msquare Myungji Co., Ltd (*1)Yeksam Trinity 1st Co., Ltd (*1)M SQUARE SONGJEONG (*1)SMART CHUNGDAM 1ST Co., Ltd (*1)MBR Co., Ltd. (*1)AM 4TH INC. (*1)Yongin Sungbok 7th (*1)BK AGE Inc. (*1)Chams Fild Oh Kid Co., Ltd. (*1)M QUEENS 1ST Inc. (*1)TH 1st Co., Ltd (*1)H SOCIETY M (*1)SLT MISA (*1)WONJU SG (*1)MDMA 1ST Co., Ltd (*1)My Best 1st (*1)Msquare Shihung 1st Co., Ltd (*1)M square Sujeong (*1)
Excluded from the consolidation Gold digger equity MMT (*2)MGS 1st (*2)LTSB 1st (*2)Eugene High Yield Private Investment Trust 1st (*2)MDS Ocean 3rd (*2)DS Haeundae Project (*2)MDS Ocean 1st (*2)China Asia Investment & Consulting Ltd. (*3)
(*1)These are structured entities with the objective of investing in loans related to real estate and are included inconsolidation scope, because the Group has existing rights that give it the current ability to direct the relevantactivities, and is not only exposed, or has rights, to variable returns, but also has the ability to use its power to affectthe investees’ returns from its involvement with them.(*2) The Group lost control of these entities due to liquidation, termination of transaction, and decrease in equityratio caused by the redemption of loans, the underlying asset.(*3) Excluded from the consolidation due to loss of controlling power over the entities by selling the securities.
Meritz Securities Co., Ltd. and its subsidiariesNotes to the consolidated financial statementsDecember 31, 2016 and 2015
11
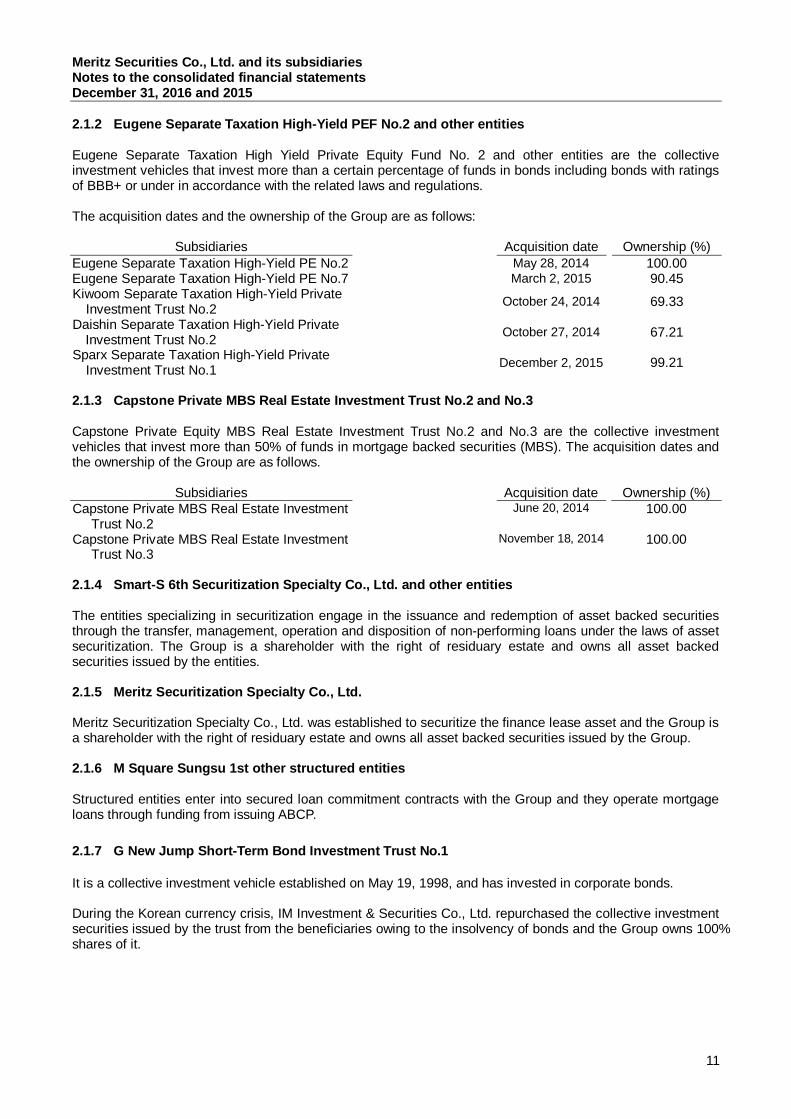
2.1.2 Eugene Separate Taxation High-Yield PEF No.2 and other entities
Eugene Separate Taxation High Yield Private Equity Fund No. 2 and other entities are the collectiveinvestment vehicles that invest more than a certain percentage of funds in bonds including bonds with ratingsof BBB+ or under in accordance with the related laws and regulations.
The acquisition dates and the ownership of the Group are as follows:
Subsidiaries Acquisition date Ownership (%)Eugene Separate Taxation High-Yield PE No.2 May 28, 2014 100.00Eugene Separate Taxation High-Yield PE No.7 March 2, 2015 90.45Kiwoom Separate Taxation High-Yield Private Investment Trust No.2 October 24, 2014 69.33
Daishin Separate Taxation High-Yield Private Investment Trust No.2 October 27, 2014 67.21
Sparx Separate Taxation High-Yield Private Investment Trust No.1 December 2, 2015 99.21
2.1.3 Capstone Private MBS Real Estate Investment Trust No.2 and No.3
Capstone Private Equity MBS Real Estate Investment Trust No.2 and No.3 are the collective investmentvehicles that invest more than 50% of funds in mortgage backed securities (MBS). The acquisition dates andthe ownership of the Group are as follows.
Subsidiaries Acquisition date Ownership (%)Capstone Private MBS Real Estate Investment
Trust No.2June 20, 2014 100.00
Capstone Private MBS Real Estate InvestmentTrust No.3
November 18, 2014 100.00
2.1.4 Smart-S 6th Securitization Specialty Co., Ltd. and other entities
The entities specializing in securitization engage in the issuance and redemption of asset backed securitiesthrough the transfer, management, operation and disposition of non-performing loans under the laws of assetsecuritization. The Group is a shareholder with the right of residuary estate and owns all asset backedsecurities issued by the entities.
2.1.5 Meritz Securitization Specialty Co., Ltd.
Meritz Securitization Specialty Co., Ltd. was established to securitize the finance lease asset and the Group isa shareholder with the right of residuary estate and owns all asset backed securities issued by the Group.
2.1.6 M Square Sungsu 1st other structured entities
Structured entities enter into secured loan commitment contracts with the Group and they operate mortgageloans through funding from issuing ABCP.
2.1.7 G New Jump Short-Term Bond Investment Trust No.1
It is a collective investment vehicle established on May 19, 1998, and has invested in corporate bonds.
During the Korean currency crisis, IM Investment & Securities Co., Ltd. repurchased the collective investmentsecurities issued by the trust from the beneficiaries owing to the insolvency of bonds and the Group owns 100%shares of it.

Meritz Securities Co., Ltd. and its subsidiariesNotes to the consolidated financial statementsDecember 31, 2016 and 2015
12
2.1.8 RREEF SPEZIAL INVEST GmbH trust of securities contract
The Group consigned government and public bonds to NH Bank for 5 years from June 2, 2015 to provide ascollateral, and designated first-party beneficiary as the secured party.
2.2 The summary of financial information in its consolidated subsidiaries as of December 31, 2016and 2015 is as follows (Korean won in thousands):
December 31, 2016Investee Assets Liabilities Operating income Net income (loss)
China Asia Investment &Consulting Ltd. ₩ - ₩ - ₩ 48,564 ₩ 27,907
G New Jump Short-Term BondInvestment Trust No.1 457,852 5 13,567 13,478
RREEF SPEZIAL INVESTGmbH trust of securitiescontract
1,939,647 - 59,443 32,661
Eugene Separate TaxationHigh-Yield PEF No.2 11,566,829 4,496 953,563 763,148
Eugene Separate TaxationHigh-Yield PEF No.7 54,212,625 77,574 3,265,809 2,220,999
Eugene Separate TaxationHigh-Yield PEF No.1 - - 2,235,826 1,398,891
Kiwoom Separate TaxationHigh-Yield PrivateInvestment Trust No. 2 66,470,986 50,580 3,405,359 2,192,326
Daishin Separate TaxationHigh-Yield PrivateInvestment Trust No. 2 43,238,958 30,906 2,521,199 1,774,517
Sparx Separate Taxation High-Yield Private InvestmentTrust No.1 26,385,994 8,849 1,636,766 973,740
Capstone Private MBSReal Estate Investment TrustNo. 2 3,209,198 207,245 440,045 280,408
Capstone Private MBSReal Estate Investment TrustNo. 3 5,342,638 235,197 727,878 538,724
Smart-S 6th SecuritizationSpecialty Co., Ltd. 258,683 5,166,388 34 (41,300)
Smart-S 8th Securitization Specialty Co., Ltd. 10,988 7,716,474 100,135 (72,176)Smart-S 10th Securitization Specialty Co., Ltd. 1,160,987 2,874,334 624,331 245,574Meritz Securitization Specialty Co., Ltd. (*) 827,468 - - -M Square Seongsoo 1st and
other structured entities 2,294,671,288 2,309,578,516 110,167,269 (6,180,121)

Meritz Securities Co., Ltd. and its subsidiariesNotes to the consolidated financial statementsDecember 31, 2016 and 2015
13
2.2 The summary of financial information in its consolidated subsidiaries as of December 31, 2016and 2015 is as follows (Korean won in thousands): (cont’d)
December 31, 2015Investee Assets Liabilities Operating income Net income (loss)
China Asia Investment &Consulting Ltd. ₩ 208,094 ₩ 4,835 ₩ - ₩ (43,837)
G New Jump Short-Term BondInvestment Trust No.1 959,588 14 35,336 35,227
RREEF SPEZIAL INVESTGmbH trust of securitiescontract
1,895,960 - 10,495 10,495
Gold digger equity MMT 55,974,625 - 16,625 16,625Eugene Separate Taxation
High-Yield PEF No.2 12,207,796 4,642 7,869,678 7,193,632Eugene Separate Taxation
High-Yield PEF No.7 49,248,169 49,299 2,573,516 1,437,125Eugene Separate Taxation
High-Yield PEF No.1 39,860,057 9,065 12,011,547 10,883,989Kiwoom Separate Taxation
High-Yield PrivateInvestment Trust No. 2 54,788,581 35,493 7,565,839 6,105,648
Daishin Separate TaxationHigh-Yield PrivateInvestment Trust No. 2 41,676,596 25,712 11,980,434 10,734,392
Sparx Separate Taxation High-Yield Private InvestmentTrust No.1 21,094,052 7,075 94,052 86,977
Capstone Private MBSReal Estate Investment TrustNo. 2 3,189,533 182,685 4,000,219 3,828,197
Capstone Private MBSReal Estate Investment TrustNo. 3 5,310,144 301,604 4,252,355 4,085,804
Smart-S 6th SecuritizationSpecialty Co., Ltd. 2,912,299 7,778,704 2,637 (895,387)
Smart-S 8th Securitization Specialty Co., Ltd. 16,503 7,649,813 744,523 (1,150,091)Smart-S 10th Securitization Specialty Co., Ltd. 1,188,620 3,147,541 2,499,775 1,138,052Meritz Securitization Specialty Co., Ltd. (*) 880,828 - 22,180 11,533M Square Seongsoo 1st and
other structured entities 1,670,599,681 1,685,093,358 69,625,543 (5,291,875)
(*) Financial information of Meritz Securitization Specialty Co., Ltd. is the amounts of its financial statementswithdrawn its finance leases securitization.

Meritz Securities Co., Ltd. and its subsidiariesNotes to the consolidated financial statementsDecember 31, 2016 and 2015
14
3. Unconsolidated structured entities
3.1 Details of the nature of the Group’s interests in unconsolidated structured entities as ofDecember 31, 2015 are as follows:
Purposes Financing method Controlling typeAsset-Backed Security SPC Securitization of
assetsIssuance of ABS/ABCPsecuredunderlyingassets
Purchasecommitment,etc.
Real estate finance Develop realestate andinvest in socialoverheadcapital facilities
Loancommitment,credit linecommitment
Loancommitment,credit linecommitment
Shipping finance andacceptance finance
Financing toacquire vesselsand to raise fundfor acquisitionthe ownership
Investment andborrowing
Loan commitment
Investment fund and trust Investment insecurities, etc.
Sales ofbeneficiarycertificates,investmentby generalpartners andlimited partners
Holdingbeneficiarycertificates,investment
3.2 Details of the Group’s maximum exposure to loss from its interests in unconsolidated structuredentities as of December 31, 2016 are as follows (Korean won in thousands):
Special purposecompany
Real estatefinance
Investment fundand trust
Total assets ofunconsolidated structuredentities ₩ 396,225,647 ₩ 413,657,505 ₩ 1,516,811,862
Assets:Loans receivable 17,153,949 107,158,051 59,905,448Securities 33,329,139 - 302,230,030
₩ 50,483,088 ₩ 107,158,051 ₩ 362,135,478Liabilities:Deposits - 4,933,665 -
₩ - ₩ 4,933,665 ₩ -Maximum exposure to loss:Holding assets 50,483,088 107,158,051 362,135,478ABCPpurchase commitment 263,800,000 - -
Unexecutedcredit line commitment 1,000,000 102,930,000 -
Mortgage loan commitment - 178,109,000 -₩ 315,283,088 ₩ 388,197,051 ₩ 362,135,478

Meritz Securities Co., Ltd. and its subsidiariesNotes to the consolidated financial statementsDecember 31, 2016 and 2015
15
4. Summary of significant accounting policies
4.1 Basis of preparation
The Group prepares statutory financial statements in the Korean language in accordance with KoreanInternational Financial Reporting Standards (KIFRS) enacted by the Act on External Audit of StockCompanies. The accompanying consolidated financial statements have been translated into English from theKorean language financial statements. In the event of any differences in interpreting the financial statementsor the independent auditors’ report thereon, the Korean version, which is used for regulatory reportingpurposes, shall prevail.
Significant accounting policies used to prepare the consolidated financial statements are as follows. Thesepolicies are equally applied to the consolidated financial statements for the years ended December 31, 2016and 2015 except for standards which are effective for the annual periods beginning on or after January 1,2016.
Amendments to KIFRS 1111 Joint Arrangements: Accounting for Acquisitions of InterestsThe amendments to KIFRS 1111 require that a joint operator accounting for the acquisition of an interest in ajoint operation, in which the activity of the joint operation constitutes a business, must apply the relevantKIFRS 1103 principles for business combinations accounting. The amendments also clarify that a previouslyheld interest in a joint operation is not remeasured on the acquisition of an additional interest in the same jointoperation while joint control is retained. In addition, a scope exclusion has been added to KIFRS 1111 tospecify that the amendments do not apply when the parties sharing joint control, including the reporting entity,are under common control of the same ultimate controlling party. The amendments apply to both theacquisition of the initial interest in a joint operation and the acquisition of any additional interests in the samejoint operation and do not have any impact on the Group’s financial statements.
Amendments to KIFRS 1016 and KIFRS 1038: Clarification of Acceptable Methods of Depreciation andAmortizationThe amendments clarify the principle in KIFRS 1016 and KIFRS 1038 that revenue reflects a pattern ofeconomic benefits that are generated from operating a business (of which the asset is part) rather than theeconomic benefits that are consumed through use of the asset. As a result, a revenue-based method cannotbe used to depreciate property, plant and equipment and may only be used in very limited circumstances toamortize intangible assets. These amendments do not have any impact on the Group given that the Grouphas not used a revenue-based method to depreciate its non-current assets.
Amendments to KIFRS 1110 and KIFRS 1028: Sale or Contribution of Assets between an Investor andits Associate or Joint VentureThe amendments address the conflict between KIFRS 1110 and KIFRS 1028 in dealing with the loss ofcontrol of a subsidiary that is sold or contributed to an associate or joint venture. The amendments clarify thatthe gain or loss resulting from the sale or contribution of assets that constitute a business, as defined inKIFRS 1103, between an investor and its associate or joint venture, is recognized in full. Any gain or lossresulting from the sale or contribution of assets that do not constitute a business, however, is recognized onlyto the extent of unrelated investors’ interests in the associate or joint venture. These amendments do not haveany impact on the Group’s financial statements.
Amendments to KIFRS 1001 Disclosure InitiativeThe amendments to KIFRS 1001 Presentation of Financial Statements clarify, rather than significantly change,existing KIFRS 1001 requirements. The amendments clarify:
Ø The materiality requirements in KIFRS 1001Ø That specific line items in the statement(s) of profit or loss and OCI and the statement of financial
position may be disaggregatedØ That entities have flexibility as to the order in which they present the notes to financial statementsØ That the share of OCI of associates and joint ventures accounted for using the equity method must
be presented in aggregate as a single line item, and classified between those items that will or will not besubsequently reclassified to profit or loss

Meritz Securities Co., Ltd. and its subsidiariesNotes to the consolidated financial statementsDecember 31, 2016 and 2015
16
4.1 Basis of preparation (cont’d)
Furthermore, the amendments clarify the requirements that apply when additional subtotals are presented inthe statement of financial position and the statement(s) of profit or loss and OCI. These amendments do nothave any impact on the Group’s financial statements.
Amendments to KIFRS 1110, KIFRS 1112 and KIFRS 1028 Investment Entities: Applying theConsolidation ExceptionThe amendments address issues that have arisen in applying the investment entities exception under KIFRS1110. The amendments to KIFRS 1110 clarify that the exemption from presenting consolidated financialstatements applies to a parent entity that is a subsidiary of an investment entity, when the investment entitymeasures all of its subsidiaries at fair value.
Furthermore, the amendments to KIFRS 1110 clarify that only a subsidiary of an investment entity that is notan investment entity itself and that provides support services to the investment entity is consolidated. All othersubsidiaries of an investment entity are measured at fair value. The amendments to KIFRS 1028 allow theinvestor, when applying the equity method, to retain the fair value measurement applied by the investmententity associate or joint venture to its interests in subsidiaries. These amendments do not have any impact onthe Group’s financial statements.
The Group has not early adopted any other standard, interpretation, or amendment that has been issued butis not yet effective.
Management of the Group is using many assumptions and reasonable estimates to create the consolidatedfinancial statements on the basis of KIFRS. In applying the accounting policies of the Group, themanagement’s judgment is required under KIFRS. Parts that require significant judgments and complexity orparts of which estimations and assumptions have significant impact on the preparation of the consolidatedfinancial statements are disclosed in footnote 5.
4.2 New and amended standards and interpretations
The standards and interpretations that are issued, but not yet effective, up to the date of issuance of theGroup’s financial statements are disclosed below.
KIFRS 1109 Financial InstrumentsKIFRS 1109, enacted on September 25, 2015, is effective for annual periods beginning on or after January 1,2018, with early application permitted. KIFRS 1109 will replace KIFRS 1039 Financial Instruments:Recognition and Measurement. The Group plans to apply KIFRS 1109 for annual periods beginning on orafter January 1, 2018.
The new KIFRS 1109 is retrospectively applied in principle, but there are some exceptions such as exemptionof restatement of comparative information for classification, measurement, impairment of financial instruments.For hedge accounting, the requirements are generally applied prospectively, with some exceptions such asaccounting for time value of options.
Major characteristics of KIFRS 1109 are financial assets being classified and measured on the basis of theholder’s business model and instrument’s contractual cash flow characteristics, impairment model of financialinstruments based on expected credit losses (ECL), broader range of hedged items and hedging instrumentsthat qualify for the application of hedge accounting or changes in evaluation of hedging effectiveness etc.
For smooth adoption of KIFRS 1109, financial impact analysis, accounting policies establishment, accountingsystem establishment and stabilization need to take place. The impact of the standards on the financialstatements in the period they are initially adopted may differ depending on the Group’s decisions andjudgments of accounting policies as well as the financial instruments held by the Group, economicenvironment, etc.

Meritz Securities Co., Ltd. and its subsidiariesNotes to the consolidated financial statementsDecember 31, 2016 and 2015
17
4.2 New and amended standards and interpretations (cont’d)
The Group formed the IFRS9 task force team for the adoption of IFRS 1109 starting from October 2016. Theprocess is divided into three stages: stage 1 (impact analysis and establishment of accounting policies), stage2 (design and build), and stage 3 (application of KIFRS 1039 and KIFRS 1109 at the same time). The Groupis in the process of analyzing the financial impact on its financial statements if the standard is applied.However, the general impacts on the financial statements are as follows.
Financial asset classification and measurementThe new KIFRS 1109 requires a financial instrument to be classified and measured subsequently at amortizedcost, fair value through other comprehensive income (FVOCI), or fair value through profit or loss (FVTPL), onthe basis of the holder’s business model and instrument’s contractual cash flow characteristics as shownbelow. The requirements should be applied to an entire financial asset, even if it contains an embeddedderivative. That is, in contrast with the requirements of KIFRS 1039, a derivative embedded within a hybrid(combined) contract containing a financial asset host is not accounted for separately.
Business model / Contractual cash flowcharacteristics
Composed solely of principaland interest For other cases
Purpose of collecting contractual cash flows Measured at amortized cost (*1)Measuredat FVTPL (*2)
Purpose of collecting and selling contractualcash flows Measured at FVOCI (*2)Purpose of selling, others Measured at FVTPL
(*1) can be designated at FVTPL in order to get rid of or reduce accounting mismatch (cannot cancel)(*2) can be designated at FVOCI in case of equity securities not for held-for-trading purposes (cannot cancel)
The Group holds ₩7,069,026 million of loans and receivables, ₩1,574,562 million of available-for-sale
financial assets, and ₩8,051,295 million of financial assets at FVTPL as of December 31, 2016. (refer toNote 43)
In accordance to KIFRS 1109, a debt instrument that meets the following two conditions must be measured atamortized cost: 1) the contractual terms of the financial asset give rise on specified dates to cash flows thatare solely payments of principal and interest on the principal amount outstanding, and 2) the objective of theentity's business model is to hold the financial asset to collect the contractual cash flows. The Groupmeasures ₩7,069,026 million of loans and receivables as of December 31, 2016 at amortized costs.
In accordance with KIFRS 1109, a debt instrument that meets the following two conditions must be measuredat FVOCI: 1) the contractual terms of the financial asset give rise on specified dates to cash flows that aresolely payments of principal and interest on the principal amount outstanding, and 2) the financial asset isheld within a business model whose objective is achieved by both collecting contractual cash flows and sellingfinancial assets. The Group holds ₩1,223,771 million of debt instruments classified as available-for-salefinancial assets as of December 31, 2016. Debt instruments, the host contract after separating embeddedderivatives from combined (hybrid) financial instruments, included in available-for-sale financial assets andloans and receivables are ₩140,485 million and ₩9,325 million, respectively.
In accordance with KIFRS 1109, if an equity instrument is not held for trading, an entity can make anirrevocable election at initial recognition to measure it at FVOCI, and subsequent recycling fromcomprehensive income to profit or loss is not permitted. The Group holds ₩ 244,490 million of equityinstruments classified as available-for-sale financial assets as of December 31, 2016.
In accordance with KIFRS 1109, a debt instrument of which: 1) the contractual terms of the financial assetgive rise to cash flows that are not solely payments of principal and interest on the principal amountoutstanding, and 2) the financial asset is held within a business model whose objective is achieved by sellingfinancial assets, and equity instruments that are not measured at FVOCI, are measured at FVTPL. TheGroup’s debt instruments and equity instruments classified as financial assets at FVTPL as of December 31,2016 are ₩ 7,184,305 million and ₩ 246,257 million, respectively.

Meritz Securities Co., Ltd. and its subsidiariesNotes to the consolidated financial statementsDecember 31, 2016 and 2015
18
4.2 New and amended standards and interpretations (cont’d)
Financial liabilities classification and measurementIn KIFRS 1109, fair value changes of financial liabilities at FVTPL attributable to changes in credit risk of theliability shall be presented in other comprehensive income, not in profit or loss. Amounts presented in othercomprehensive income shall not be subsequently recycled to profit or loss. However, the new standard allowsthe recognition of the full amount of change in the fair value in profit or loss only if the presentation of thechanges in the liability's credit risk in other comprehensive income would create or enlarge an accountingmismatch in profit or loss.4.2 New and amended standards and interpretations (cont’d)The Group designated ₩ 654,430 million out of ₩ 15,166,450 million of financial liabilities at FVTPL as ofDecember 31, 2016 and recognized ₩7,486 million of evaluation losses related to financial liabilities atFVTPL as current profit and loss for the year ended December 31, 2016.
Impairment: financial assets and contract assetsIn KIFRS 1039, impairment is recognized only when there is objective evidence of impairment based onincurred loss model. In the new KIFRS 1109, impairment of debt instruments, lease bonds, contract assets,loan commitments and financial guarantee contracts that are measured at amortized costs or at FVOCI isrecognized based on the expected credit loss (ECL) impairment model.
KIFRS 1109 outlines a ‘three-stage’ model for impairment based on changes in credit risk since initialrecognition. Loss allowance is measured based on the 12-month ECL or life-time ECL which allows earlyrecognition of credit loss compared to the incurred loss model of KIFRS 1039.
Classification Loss allowance
Stage 1Assets with no significantincrease in credit risk sinceinitial recognition (*1)
12-month ECL: Expected credit losses thatresult from default events that are possible within12 months after the reporting date.
Stage 2Assets with significantincrease in credit risk sinceinitial recognition
Lifetime ECL: Expected credit losses that resultfrom all possible default events over the expectedlife of the financial instrument.Stage 3 Credit-impaired assets
(*1) Low credit risk at the end of reporting period may be considered as no significant increase in credit risk
In KIFRS 1109, accumulated changes in the life-time ECL after initial recognition are taken into account asloss allowance in case credit is impaired at initial recognition of financial assets.
The Group has debt instruments measured at FVOCI for ₩ 1,223,771 million classified as available-for-salefinancial assets, debt instruments for ₩ 7,069,026 million (loans and receivables) measured at amortized cost,and loss allowance for loans and receivables for ₩ 77,602 million as of December 31, 2016. The contractualoutstanding balance for the Group is ₩ 2,967,962 million as of December 31, 2016. (refer to Note 39-3).
Hedge accountingThe new KIFRS 1109 maintains mechanics of hedge accounting (fair value hedge, cash flow hedge, overseasoperations net investment hedge) as set forth in KIFRS 1039. However, unlike requirements in KIFRS 1039that are too complex and strict, KIFRS 1109 is more practical, principle based and less strict and focuses onthe entity’s risk management activities. Also, KIFRS 1109 allows broader range of hedged items and hedginginstruments. Under KIFRS 1039, a hedge is assessed to be highly effective only if the offset is in the range of80-125 percentage by performing numerical test of effectiveness. In KIFRS 1109, such requirements arealleviated.
KIFRS 1115 Revenue from Contracts with CustomersKIFRS 1115 establishes a five-step model to account for revenue arising from contracts with customers.Under KIFRS 1115, revenue is recognized at an amount that reflects the consideration to which an entityexpects to be entitled in exchange for transferring goods or services to a customer. The new revenuestandard will supersede all current revenue recognition requirements under KIFRS. Either a full retrospectiveapplication or a modified retrospective application is required for annual periods beginning on or after January1, 2018. Early adoption is permitted. These amendments are not expected to have impact on the Group’sfinancial statements.

Meritz Securities Co., Ltd. and its subsidiariesNotes to the consolidated financial statementsDecember 31, 2016 and 2015
19
4.3 Principles of consolidation
4.3.1 Subsidiaries
Subsidiaries are fully consolidated from the date on which control is transferred to the Group. Subsidiaries areno longer consolidated from the date on which the Group loses control over them. Control is achieved wherethe Group has the power to govern the financial and operating policies of an entity so as to obtain the benefitsfrom its activities. The Group consolidates special purpose entities if the substance of its relationship withthem indicates that it has control over them. The Group considers the existence and influence of exercisableor convertible voting rights when evaluating its subsidiaries.
All significant intercompany transactions and account balances among consolidated companies are eliminatedon consolidation. Unrealized gains or losses included in loans and borrowings arising from transactionsbetween consolidated companies are eliminated on consolidation. The related accounts receivable andpayable are also eliminated on consolidation. The accounting Policies of subsidiaries can be revised onconsolidation in consistency policies the Group has adopted.
4.3.2 Non-controlling interests
Non-controlling interests must be presented in the consolidated statement of financial position within equity,separate from the equity of the owners of the parent. Total comprehensive income must be attributed to theowners of the parent and to the non-controlling interests even if this results in the non-controlling interestshaving a deficit balance.
Some putable financial instruments or some financial instruments that impose on the entity an obligation todeliver to another party a pro rata share of the net assets of the entity only on liquidation are not accounted asthe residual equity in consolidated financial statements, therefore, those non-controlling interests areclassified as financial liabilities in the consolidated financial statement.
4.3.3 Investment in an associate
Associates are the entities that the Group has significant effect on, but has no controlling power and theGroup generally owned its equity in 20~50% of their shares with voting rights by the Group. The Group’sconsolidated financial statements reflects investment in an associate in using the equity method and theamount of Investment in an associate include goodwill which is acquisition cost less any accumulatedimpairment losses.
After acquiring shares of an associate, the Group’s share of the current income (loss) of the associate isrecognized as current income (loss) of the Group, and the Group’s share of changes in the retained earningsof the associate is recognized as the retained earnings of the Group. If the Group’s share of the loss of theassociate is the same as or above the Group’s investment interest including other plain bond of the associate,the Group no longer recognizes a loss unless the Group is liable for paying or has to pay the associate’s debt.
When signs of damage are not aroused, the Group’s share in the investee’s unrealized profits and lossesresulting from transactions between the Group and its investee are eliminated to the extent of the interest inthe investee. And when necessary, adjustments are made to the financial statements of associates to bringtheir accounting policies in line with those used by the Group.
4.4 Operating segment reporting
Operating segments are disclosed in a manner consistent with the internal reporting provided to the chiefoperating decision maker. The chief operating decision maker is responsible for allocating resources andassessing the performance of the operating segments.

Meritz Securities Co., Ltd. and its subsidiariesNotes to the consolidated financial statementsDecember 31, 2016 and 2015
20
4.5 Foreign exchange
4.5.1 Functional currency
When preparing for the consolidated financial statements, the Group measures and recognizes all thetransactions according to the functional currency, used to conduct operating activities in the primary economicenvironment. Consolidated Financial statements are expressed in Korean won.
4.5.2 Translation of foreign currency transactions and balances at the end of the reporting period
Transactions in foreign currencies are initially recorded at the functional currency rate of exchange prevailingat the date of the transaction. Monetary assets and liabilities denominated in foreign currencies areretranslated at the functional currency rate of exchange prevailing at the reporting date and its exchangedifferences are recognized in net income for the period in which they arise. The Group applies a year-endexchange rate to non-monetary assets and liabilities measured at fair value in the consolidated statements offinancial position. If valuation gain or loss on fair value is recognized as current income, foreign currencytranslation gain or loss is recognized in current income. If valuation gain or loss on non-monetary items isrecognized in other comprehensive income, foreign currency translation gain or loss is recognized in othercomprehensive income. Non–monetary items not measured at fair value are translated using the exchangerates as at the date of the initial transaction and have no exchange differences.
Exchange differences on monetary items receivable from or payable to a foreign operation for whichsettlement is neither planned nor likely to occur in the predictable future (therefore forming part of the netinvestment in the foreign operation), are recognized initially in other comprehensive income and reclassifiedfrom equity to net income on disposal or partial disposal of the net investment.
4.5.3 Translation of the Group’s foreign operation
As at the reporting date, the assets and liabilities of subsidiaries and overseas branches are translated intothe Group’s presentation currency, Korean won (KRW), at the rate of exchange as at the reporting date, andtheir statements of comprehensive income are translated at the weighted average exchange rates for the year.Exchange differences arising on translation are taken directly to a separate component of equity.
4.6 Cash and cash equivalents
Cash and short-term deposits in the statement of financial position comprise cash at banks and on hand andshort-term deposits with an original maturity of three months or less.
4.7 Financial assets
Financial assets within the scope of KIFRS 1039 Financial Instruments: Recognition and Measurement areclassified as financial assets designated at fair value through profit or loss, available-for-sale financial assets,held-to-maturity investments, loans and receivables, as appropriate. The Group determines the classificationof its financial assets at initial recognition.
4.7.1 Financial assets at fair value through profit or loss
Financial assets at fair value through profit or loss include financial assets held for trading and financial assetsdesignated at fair value through profit or loss upon initial recognition. Financial assets are classified as heldfor trading if they are acquired for the purpose of selling or repurchasing in the short-term. Derivatives,including separated embedded derivatives are also classified as held for trading unless they are designatedas effective hedging instruments as defined by KIFRS 1039. Financial assets at fair value through profit orloss are carried in the statement of financial position at fair value with changes in fair value recognized infinance income or finance cost in the statement of comprehensive income. The Group designated DLS,separate deposit from investors and some other financial assets as financial assets at FVTPL.

Meritz Securities Co., Ltd. and its subsidiariesNotes to the consolidated financial statementsDecember 31, 2016 and 2015
21
4.7.2 Available-for-sale financial assets
Available-for-sale financial assets are non-derivative financial assets designated at available-for-sale item,and are not classified as loans and receivables, held-to-maturity financial assets or financial assetsdesignated at fair value through profit or loss. They are measured at fair value and their valuation gains andlosses are recognized in equity as other comprehensive income. The equity securities, whose active marketvalues are not available and fair values cannot be reliably measured, are valued at acquisition cost.Accumulated other comprehensive income previously recognized in equity is recognized in the statement ofcomprehensive income when the investment is disposed of or impairment loss for the investment isrecognized. Dividends earned whilst holding available-for-sale financial assets are recognized in thestatement of comprehensive income when the right of the payment has been established.
4.7.3 Held-to-maturity financial assets
Non-derivative financial assets with fixed or determinable payments and fixed maturities are classified asheld-to maturity when the Group has the positive intention and ability to hold them to maturity. After initialmeasurement, held-to-maturity investments are measured at amortized cost using the effective interestmethod, less impairment. Amortized cost is calculated by taking into account any discount or premium onacquisition and fees or costs that are an integral part of the effective interest rate method (“EIR”). The EIRamortization is included in finance income in the statement of comprehensive income. The losses arising fromimpairment are recognized in finance costs in the statement of comprehensive income. There is no held-to-maturity assets as of December 31, 2016 and 2015.
4.7.4 Loans and receivables
Loans and receivables are non-derivative financial assets with fixed or determinable payments that are notquoted in an active market. After initial measurement, such financial assets are subsequently measured atamortized cost using the EIR, less allowance for possible loan losses. Amortized cost is calculated by takinginto account any discount or premium on acquisition and fees or costs that are an integral part of the EIR. TheEIR amortization is included in finance income in the statements of comprehensive income.
4.8 Regular way trades
Equity securities, debt securities, derivatives, which are traded in the KRX or qualified foreign exchangemarkets, are treated as regular way trades. The Group’s specific accounting policies about regular way tradesare described below.
4.8.1 Proprietary trading
As for proprietary trading, purchase or sale of the asset that require delivery of assets within a time frameestablished by regulation or convention in the marketplace are recognized or derecognized on the tradingdate.
4.8.2 Trading on consignment
As for trading on consignment, the Group serves a clientele of investors who trade public stocks and othersecurities and recognizes the brokerage fees on the trading date. Until the settlement date of the trading onconsignment, the Group does not offset the receivables and payables to customers and offsets thereceivables and payables to the KRX.

Meritz Securities Co., Ltd. and its subsidiariesNotes to the consolidated financial statementsDecember 31, 2016 and 2015
22
4.9 Derecognition of financial assets
A financial asset (or, where applicable a part of a financial asset or part of the Group of similar financial assets)is derecognized when:
Ø The rights to receive cash flows from the asset have expired.Ø The Group has transferred its rights to receive cash flows from the asset or has assumed an obligation to
pay the received cash flows in full without material delay to a third party under a ‘pass-through’arrangement; and either (a) the Group has transferred substantially all the risks and rewards of the asset,or (b) the Group has neither transferred nor retained substantially all the risks and rewards of the asset,but has transferred control of the asset.
When the Group has transferred its rights to receive cash flows from an asset or has entered into a pass-through arrangement, it evaluates if and to what extent it has retained the risks and rewards of ownership.When it has neither transferred nor retained substantially all of the risks and rewards of the asset, nortransferred control of the asset, the Group continues to recognize the transferred asset to the extent of theGroup’s continuing involvement. In that case, the Group also recognizes an associated liability. Thetransferred asset and the associated liability are measured on a basis that reflects the rights and obligationsthat the Group has retained.
4.10 Impairment of financial assets
The Group assesses at the end of each reporting period whether there is any objective evidence that afinancial asset or group of financial assets is impaired. A significant or prolonged decline in the fair value of aninvestment in available-for-sale financial assets below its cost is also objective evidence of impairment. If anysuch evidence exists in the available-for-sale financial assets, the amount of the cumulative loss that is thedifference between the acquisition cost and current fair value deducted the impairment loss on that financialasset previously recognized in profit or loss is recognized in the statement of comprehensive income.Impairment losses recognized in profit or loss for an investment in an equity instrument classified as availablefor sale are not reversed through profit or loss.
Furthermore, the losses on loans and receivables are identified as gains and losses for the current term usingallowance for the account and if the objective evidence of the impairment exists, they are measured as thepresent value on future cash flow.
4.11 Derivative financial instruments and hedge accounting
Derivatives instruments are initially recognized at fair value on the contract date and are subsequentlyrevalued at their fair value. Derivative instruments are accounted differently depending on whether hedgeaccounting is applied, and therefore, are classified into trading purpose derivatives and hedging purposederivatives. In a hedge relationship, when a hedge item is any asset, liability or unrecognized fixed contract,which is exposed at the possibility that its some or entire fair value is fluctuated by the specified risks, fairvalue hedge accounting is applied. In another way, when a hedge item is any asset, liability or expected highlyprobable transaction, which is exposed at the possibility that its cash flow is fluctuated by the specified risk,cash flow hedge accounting is applied. For trading purpose derivative transaction, changes in the fair value ofderivatives are recognized in net income.
At the inception of the hedge relationship, the Group formally documents the relationship between the hedgeditem and the hedging instrument, including the nature of the risk, the objective and strategy for undertakingthe hedge and the method that will be used to assess the effectiveness of the hedging relationship. Also, atthe inception of the hedge relationship, a formal assessment is undertaken to ensure that the hedginginstrument is expected to be highly effective in offsetting the designated risk in the hedged item and the actualresult.

Meritz Securities Co., Ltd. and its subsidiariesNotes to the consolidated financial statementsDecember 31, 2016 and 2015
23
4.11.1 Fair value hedges
The change in the fair value of an interest rate hedging derivative is recognized in finance costs in thestatement of comprehensive income. The change in the fair value of the hedged item attributable to the riskhedged is recorded as a part of the carrying value of the hedged item and is also recognized in finance costsin the statement of comprehensive income.
For fair value hedges relating to items carried at amortized cost, any adjustment to carrying value is amortizedthrough the statement of comprehensive income over the remaining term up to maturity. Effective interest rateamortization may begin as soon as an adjustment exists and shall begin no later than when the hedged itemceases to be adjusted for changes in its fair value attributable to the risk being hedged.
When an unrecognized firm commitment is designated as a hedged item, the subsequent cumulative changein the fair value of the firm commitment attributable to the hedged risk is recognized as an asset or liabilitywith a corresponding gain or loss recognized in the statement of comprehensive income.
4.11.2 Cash flow hedges
The effective portion of the gain or loss on the hedging instrument is recognized directly as othercomprehensive income in the cash flow hedge reserve, while any ineffective portion is recognizedimmediately in finance costs in the statement of comprehensive income.
Amounts recognized as other comprehensive income are transferred to the statement of comprehensiveincome when the hedged transaction affects profit or loss, such as when the hedged financial income orfinancial expense is recognized or when a forecast sale occurs. When the hedged item is the cost of a non-financial asset or non-financial liability, the amounts recognized as other comprehensive income aretransferred to the initial carrying amount of the nonfinancial asset or liability.
If the forecast transaction or firm commitment is no longer expected to occur, the cumulative gain or losspreviously recognized in equity are transferred to the statement of comprehensive income. If the hedginginstrument expires or is sold, terminated or exercised without replacement or rollover, or if its designation as ahedge is revoked, any cumulative gain or loss previously recognized in other comprehensive income remainsin other comprehensive income until the forecast transaction or firm commitment affects profit or loss.
4.11.3 Embedded derivatives
Derivatives embedded in other financial instruments or other host contracts are treated as separatederivatives. When their risks and characteristics are not closely related to those of the host contracts and thehost contracts are not measured by fair value through profit or loss.
4.12 ‘Day 1’ profit or loss recognition
When the transaction price is different from the fair value of other observable current market transactions inthe same instrument or based on a valuation technique whose variables include only data from observablemarkets, the Group immediately recognizes the differences between the transaction price and fair value (a‘Day 1’ profit or loss) in ‘net trading income’.
In case where fair value is determined using data which is not observable, the difference between thetransaction price and model value is deferred and amortized over the life of the associated instrument usingthe straight-line method.
4.13 Interest income and interest expense
The Group recognizes interest income and interest expense using the effective interest rate method on anaccrual basis. When a financial instrument bearing interest is impaired, the Group reduces the carryingamount to its recoverable amount, being the estimated future cash flows discounted at its original effectiveinterest rate of the instrument, and continues unwinding the discount as interest income.

Meritz Securities Co., Ltd. and its subsidiariesNotes to the consolidated financial statementsDecember 31, 2016 and 2015
24
4.14 Fees and commission income
The Group earns fees and commission income from a diverse range of services it provides to its customers.Fees and commissions income from financial services are accounted for based on the related accountingstandards of financial instruments and the purpose of such fees and commissions. Fees and commissionsincome are accounted for as follows:
Ø Fees earned for the provision of services over a period of time are accrued over that period using thestraight line method.
Ø Fees arising from providing significant transaction services for a third party are recognized on completionof the transaction services.
Ø Fees which are regarded as the part of the interest of financial instruments are recognized using the EIR.
4.15 Dividend income
Dividend income is recognized when the Group’s right to receive the payment is established.
4.16 Bonds purchased under resale agreements and bonds sold under repurchase agreements
Securities purchased under agreements to resell at a specified future date (“reverse repos”) are recorded inthe statement of financial position as bonds purchased under repurchase agreements in the other loans.Conversely, securities sold under agreements to repurchase at a specified future date (“repos”) are recordedin the statement of financial position as bonds sold under repurchase agreements in the other borrowingliabilities. Interest income and expense incurred from reverse repo and repo transactions are recorded asinterest income on loan and interest expense on borrowings, respectively in the statement of comprehensiveincome.
4.17 Property and equipment
Property and equipment is stated at cost including transaction costs, less accumulated depreciation andaccumulated impairment in value. Changes in the expected useful life are accounted for by changing theamortization period or method, as appropriate, and treated as changes in accounting estimates.
Depreciation is calculated on a straight-line basis over the estimated useful life of the asset. Land is notdepreciated. The estimated useful lives are as follows:
Property and equipment is derecognized on disposal or when no future economic benefits are expected fromits use. Any gain or loss arising on derecognition of the asset (calculated as the difference between the netdisposal proceeds and the carrying amount of the asset) is recognized in ‘Other operating income' in thestatement of comprehensive income in the year the asset is derecognized.
4.18 Investment properties
Investment properties are measured initially at cost, including transaction costs. Subsequent to initialrecognition, investment properties are measured at depreciated cost.
Investment properties are derecognized when either they have been disposed of or when the investmentproperty is permanently withdrawn from use and no future economic benefit is expected from its disposal. Thedifference between the net disposal proceeds and the carrying amount of the asset is recognized throughprofit or loss in the period of derecognition. And transfers are made to or from investment property only whenthere is a change in use.
YearsBuildings 40Vehicles 4Furniture and fixtures 4

Meritz Securities Co., Ltd. and its subsidiariesNotes to the consolidated financial statementsDecember 31, 2016 and 2015
25
4.19 Investment properties (cont’d)
Land is not depreciated. The estimated useful lives of buildings are as follows:
4.20 Intangible assets
4.20.1 Software
Software acquired separately are measured on initial recognition at cost. The software with finite lives arecarried at cost less any accumulated amortization. Amortization is calculated on a straight-line basis over theestimated useful life of the asset.
4.20.2 Intangible assets with indefinite useful lives
Intangible assets with indefinite useful lives are not amortized, but are annually tested for impairment. Theassessment of indefinite life is reviewed annually to determine whether the indefinite life continues to besupportable. If not, the change in useful life from indefinite to finite is made on a prospective basis.
4.21 Impairment of non-financial assets
The Group assesses at each reporting date whether there is an indication that an asset may be impaired. Ifindication exists, or when annual impairment testing for an asset is required, the Group estimates the assetsrecoverable amount. An asset’s recoverable amount is the higher of an asset’s or cash-generating unit’s(“CGU”) fair value less costs to sell and its value in use. When the carrying amount of an asset or CGUexceeds its recoverable amount, the asset is considered impaired and is written down to its recoverableamount.
After recognition of the impairment of non-financial assets, if there is a change in the assumptions used todetermine the asset’s recoverable amount, a previously recognized impairment loss is reversed. The reversalis limited so that the carrying amount of the asset does not exceed its recoverable amount, nor exceeds thecarrying amount that would have been determined, net of depreciation, had no impairment loss beenrecognized for the asset in prior years.
After application of the equity method, the Group determines whether it is necessary to recognize anadditional impairment loss on the Group’s investment in its associates. The Group determines at eachreporting date whether there is any objective evidence that the investment in the associate is impaired. If thisis the case the Group calculates the amount of impairment as the difference between the recoverable amountof the associate and its carrying value and recognizes the amount in the statement of comprehensive income.
4.22 Lease
The classification of leases is based on the extent to which risks and rewards incidental to ownership of aleased asset lie with the lessor or the lessee.
At the commencement of the lease term, lessees shall recognize finance leases as assets and liabilities intheir statements of financial position at amounts equal to the fair value of the leased property or, if lower, thepresent value of the minimum lease payments, each determined at the inception of the lease. The discountrate to be used in calculating the present value of the minimum lease payments is the interest rate implicit inthe lease, if this is practicable to determine; if not, the lessee’s incremental borrowing rate shall be used. Anyinitial direct costs of the lessee are added to the amount recognized as an asset.
Depreciationmethod Years
Buildings Straight-linemethod 40

Meritz Securities Co., Ltd. and its subsidiariesNotes to the consolidated financial statementsDecember 31, 2016 and 2015
26
4.22 Lease (cont’d)
Minimum lease payments shall be apportioned between the finance charge and the reduction of theoutstanding liability. The finance charge shall be allocated to each period during the lease term so as toproduce a constant periodic rate of interest on the remaining balance of the liability. The depreciation policyfor depreciable leased assets shall be consistent with that for depreciable assets that are owned.
Minimum lease payments, excluding guaranteed residual value, under an operating lease shall be recognizedas an expense on a straight-line basis over the lease term unless another systematic basis is morerepresentative of the time pattern of the user’s benefit. Operating lease assets are depreciated over expecteduseful lives (3 years ~ 5 years).
4.23 Retirement benefits
4.23.1 Defined benefit pension plans
The Group classifies all pension plans under defined benefit pension plans (“DB plan”) except for definedcontribution pension plan (“DC plan”). The retirement benefit liabilities recognized in the consolidatedstatements of financial position represents the present value of the defined benefit obligation reduced by thefair value of plan assets.
The cost of providing benefits under the defined benefit plan is determined using the projected unit creditmethod by an independent actuary. The present value of defined benefit obligation is computed bydiscounting expected future cash outflows with market rate of return measured against the yield of high-graded corporate bond whose date of payment and maturity is similar to that of a defined benefit obligation.Actuarial gains and losses, incurred from the change in actuarial assumptions and the difference between theassumptions and the actual results, are recognized in other comprehensive income for the period.
If the calculated net value is an asset when the fair value of plan assets is deducted from the present value ofdefined benefit liabilities, the asset is recognized up to accumulated unrealized past service cost and thepresent value of an economic benefit available in the form of a refund from the pension plan or a saving offuture contributions.
Unrecognized prior service cost, a change in the present value of defined benefit pension plan for employees’past services which is incurred by introduction or changes of severance payment, is immediately recognizedin current expense for the period in which it arises.
4.23.2 Defined contribution pension plans
As the Group operates a defined contribution pension plans (“DC plan”), the amount of contribution that theGroup has to pay is recognized under current expense as employee benefit expense.
4.24 Income tax expenses and deferred tax assets and liabilities
Income taxes comprise of current and deferred taxes. All items related to taxes, other than those recognizeddirectly in equity, are accounted for in the statement of comprehensive income. Accordingly, items recognizeddirectly in equity and the related income taxes are accounted for in the ‘Other operating income’.
The tax rates and tax laws used to compute the amount are those that are enacted or substantively enactedby the reporting date. If the applied tax laws require an interpretation, the Group calculates income taxpayable expected to be paid to the taxation authorities based on the opinion made when the taxes werereported.
Deferred tax is provided on the temporary differences at the reporting date between the tax bases of assetsand liabilities and their carrying amounts for financial reporting purposes. Deferred liabilities are recognized forall taxable temporary differences, except:

Meritz Securities Co., Ltd. and its subsidiariesNotes to the consolidated financial statementsDecember 31, 2016 and 2015
27
4.24 Income tax expenses and deferred tax assets and liabilities (cont’d)
When the deferred tax liability arises from the initial recognition of goodwill or of an asset or liability in atransaction that is not a business combination and, at the time of the transaction, affects neither theaccounting profit nor taxable profit loss.
In respect of taxable temporary differences associated with investments in subsidiaries, where the timing ofthe reversal of the temporary differences can be controlled and it is probable that the temporary differenceswill not reverse in the foreseeable future.
Deferred tax assets and deferred tax liabilities are offset if a legally enforceable right exists to set off currenttax assets against current tax liabilities and the deferred taxes relate to the same taxable entity and the sametaxation authority.
4.25 Recognition and measurement of financial liabilities
Financial liabilities within the scope of KIFRS 1039 are classified as financial liabilities at fair value throughprofit or loss, borrowings, or as derivatives designated as hedging instruments in an effective hedge, asappropriate. The Group determines the classification of its financial liabilities at initial recognition.
All financial liabilities are recognized initially at fair value and in the case of loans and borrowings, plus directlyattributable transaction costs.
4.25.1 Financial liabilities at fair value through profit or loss
Financial liabilities at fair value through profit or loss include financial liabilities held-for-trading and financial liabilities designated upon initial recognition as at fair value through profit or loss. Financial liabilities are classified as held-for-trading if they are acquired for the purpose of selling in the near term. Allfinancial liabilities including an embedded derivative separated from the host contract are reclassified asfinancial liabilities at fair value through profit or loss except for financial liabilities designated as effectivehedging instruments or financial guarantee contracts. After initial recognition, the changes in the fair value ofthe financial liabilities at fair value through profit or loss and the related interest expenses are recognizedas profit or loss. The Group has designated derivative-linked securities sold by the Group as financial liabilitiesat fair value through profit or loss.
4.25.2 Borrowings and debentures
After initial recognition, interest bearing deposits, borrowings and debentures are subsequently measured atamortized cost using the EIR. Gains and losses are recognized in the statement of comprehensive incomewhen the liabilities are derecognized as well as through the EIR amortization process.Amortized cost is calculated by taking into account any discount or premium on acquisition and fees or coststhat are an integral part of the EIR. The EIR amortization is included in finance cost in the statement ofcomprehensive income.
4.25.3 Derecognition of financial liabilities
A financial liability is derecognized when the obligation under the liability is discharged or cancelled or expired.When an existing financial liability is replaced by another from the same lender on substantially different terms,or the terms of an existing liability are substantially modified, such an exchange or modification is treated as aderecognition of the original liability and the recognition of a new liability, and the difference in the respectivecarrying amounts is recognized in the statement of comprehensive income. Meanwhile, the group hasdesignated derivatives linked securities sold by the group as financial liabilities at fair value through profit orloss.

Meritz Securities Co., Ltd. and its subsidiariesNotes to the consolidated financial statementsDecember 31, 2016 and 2015
28
4.26 Fair value of financial instruments
Financial assets and financial liabilities traded in active markets at the reporting date are based on theirquoted market price or dealer price quotations (bid price for long positions and ask price for short positions),without any deduction for transaction costs.
For all other financial instruments not traded in an active market, the fair value is determined by usingappropriate valuation techniques. Valuation techniques include the discounted cash flow method, comparisonto similar instruments for which market observable prices exist, options pricing models, credit models andother relevant valuation models. These techniques incorporate the Group’s estimate of assumptions that amarket participant would make when valuing the instruments. Valuation techniques which provide reliableestimates on mark-to-market prices are applied.
The Group uses the following hierarchy for determining and disclosing the fair value of financial instrumentsby valuation technique:
Level 1: Quoted (unadjusted) prices in active markets for similar assets or liabilities.Level 2: Other techniques for which all inputs which have a significant effect on the recorded fair value are
observable, either directly or indirectly.Level 3: Techniques which use inputs which have a significant effect on the recorded fair value that are not
based on observable market data.
4.27 Provisions
Provisions are recognized when the Group has a present obligation (legal or constructive) as a result of apast event, it is probable that an outflow of resources embodying economic benefits will be required to settlethe obligation and a reliable estimate can be made of the amount of the obligation.
4.28 Capital stock
Common stock issued is classified as a capital stock in the statement of financial position and additional stockissuance costs or incremental costs related to the stock issuance are recorded as a deduction from issuedcapital net of tax effects.
4.29 Dividends
Dividends on common stock are deducted from the Group’s equity and recognized as a liability when theshareholders’ meeting of the Group approves the dividends.
5. Significant judgements and accounting estimates
The preparation of the Group’s consolidated financial statements requires the management to makejudgments, estimates and assumptions that affect the reported amounts of revenues, expenses, assets andliabilities, and the disclosure of contingent liabilities, at the end of the reporting period. Uncertainty about theseassumptions and estimates could result in outcomes that require a material adjustment to the carrying amountof the asset or liability affected in future periods.
In the process of applying the Group’s accounting policies, the management has made the followingjudgments, which have the most significant effect on the amounts recognized in the consolidated financialstatements.

Meritz Securities Co., Ltd. and its subsidiariesNotes to the consolidated financial statementsDecember 31, 2016 and 2015
29
5.1 Allowance for possible loan losses
The Group assesses at each reporting date whether there is objective evidence that a loan is impaired. Ifthere is objective evidence that an impairment loss has been incurred, the amount of the loss is measured asthe difference between the loan’s carrying amount and the present value of estimated future cash flows, whichis discounted using the initial effective interest rate. The carrying amount of the asset is reduced through theuse of an allowance account and the amount of the loss is recognized in the statement of comprehensiveincome.
The Group first assesses whether objective evidence of impairment exists for individual loan that is significant(individual assessment). If the Group determines that no objective evidence of impairment exists for anindividually assessed loan, the Group includes the loan in a company of loans with similar credit riskcharacteristics and collectively assesses them for impairment (collective assessment).
When an individual loan is impaired, the amount of the loss is measured as the difference between thecarrying amount and the present value of estimated future cash flows (including estimated future cash flowsfrom its collateral). In collective assessments, the amount of the loss is statistically evaluated using theGroup’s historical loss data.
5.2 Impairment of non-financial assets
Impairment exists when the carrying value of an asset or cash generating unit exceeds its recoverable amount,which is the higher of its fair value less costs to sell and its value in use. The fair value less costs to sellcalculation is based on available data from binding sales transactions in an arm’s length transaction of similarassets or observable market prices less incremental costs for disposing of the asset. The value in usecalculation is based on a discounted cash flow model. The cash flows are derived from the budget for the nextfive years and do not include restructuring activities that the Group is not yet committed to or significant futureinvestments that will enhance the asset’s performance of the cash generating unit being tested. Therecoverable amount is most sensitive to the discount rate used for the discounted cash flow model as well asthe expected future cash inflows and the growth rate used for extrapolation purposes.
5.3 Income taxes
Uncertainties exist with respect to the interpretation of complex tax regulations and the amount and timing offuture taxable income. Given the wide range of international business relationships and the long-term natureand complexity of existing contractual agreements, differences arising between the actual results and theassumptions made, or future changes to such assumptions, could necessitate future adjustments to taxincome and expense already recorded. The Group establishes provisions, based on reasonable estimates, forpossible consequences of audits by the tax authorities of the respective countries in which it operates. Theamount of such provisions is based on various factors, such as experience of previous tax audits and differinginterpretations of tax regulations by the taxable entity and the responsible tax authority.
5.4 Impairment losses on available-for-sale equity instruments
The Group assesses its equity securities classified as available–for–sale assets at the end of each reportingperiod whether there is any indication that an asset may be impaired.
The Group also records impairment charges on available–for–sale equity investments when there has been asignificant or prolonged decline in the fair value below their cost. The determination of what is ‘significant’ or‘prolonged’ requires judgment. In making this judgment, the Group evaluates, among other factors, historicalshare price movements and duration and extent to which the fair value of an investment is less than its cost.
When the fair value below the cost of available-for-sale equity instruments is significant or prolonged, theGroup recognizes impairment subsequently and reclassifies previous gain or loss that has been recognized inother comprehensive income to profit or loss.

Meritz Securities Co., Ltd. and its subsidiariesNotes to the consolidated financial statementsDecember 31, 2016 and 2015
30
5.5 Surtax on undistributed corporate earnings
The Group shall pay an additional surtax where the use of corporate earnings on qualifying investments, wageincrease and dividend payments fall below a certain portion of its taxable income for 3 years from 2015. Asthe Group considers the surtax on its undistributed earnings when computing its corporate income tax, theGroup’s income tax may change arising from changes in investment, wage growth, or dividend payouts.
6. Operating segment information
The Group is organized into three operating segments based on their products and services and the detailsare presented below:
a) Securities business: Brokerage service, proprietary trading and underwriting of securitiesb) Merchant banking: Issue, discount and trading of promissory note or bond, investment and loan of
facilities or working capital, payment guarantees, and management of CMAc) Head office : Head office segment exclude segments aboved) Others: The proportion of operating segment of the consolidated subsidiaries was not important in terms
of the Group.
The financial information of the operating segments for the years ended December 31, 2016 and 2015 are asfollows (Korean won in thousands):
Year ended December 31, 2016
Securities businessMerchantbanking
HeadOffice Others
Consolidatedadjustments Total
Total revenue \ 469,172,477 \ 357,919,935 \ 4,048,700,560 \ 127,992,663 \ (48,553,457) \ 4,955,232,178
Total expense (367,330,458) (156,595,151) (4,020,371,556) (122,716,698) 44,384,543 (4,622,629,320)Income (loss) before income tax expense 101,842,019 201,324,784 28,329,004 5,275,965 (4,168,914) 332,602,858
Income tax expense (*1) (24,105,024) (47,651,635) (6,705,202) (8,780) (285,514) (78,756,155)
Net income (loss) \ 77,736,995 \ 153,673,149 \ 21,623,802 \ 5,267,185 \ (4,454,428) \ 253,846,703
Assets (*2) 12,058,029,120 3,262,033,789 - 2,508,902,991 (561,152,667) 17,267,813,233
Liabilities (*2) 10,565,058,766 2,868,950,438 - 2,325,950,563 (370,456,762) 15,389,503,005
Year ended December 31, 2015
Securities businessMerchantbanking
HeadOffice Others
Consolidatedadjustments Total
Total revenue \ 645,682,785 \ 356,965,829 \ 2,164,229,145 \ 157,535,428 \ (79,130,666) \ 3,245,282,521
Total expense (490,390,787) (164,259,243) (2,118,905,930) (90,901,275) 25,663,349 (2,838,793,886)Income (loss) before income tax expense 155,291,998 192,706,586 45,323,215 66,634,153 (53,467,317) 406,488,635
Income tax expense (*1) (59,299,094) (45,933,412) (10,803,211) (231) (3,115,955) (119,151,903)
Net income (loss) \ 95,992,904 \ 146,773,174 \ 34,520,004 \ 66,633,922 \ (56,583,272) \ 287,336,732
Assets (*2) 9,308,668,381 3,565,614,373 - 1,961,130,297 (406,744,423) 14,428,668,628
Liabilities (*2) 7,897,314,250 3,246,345,136 - 1,704,289,841 (137,844,845) 12,710,104,382
(*1) The amount is allocated using the ratio of net income before income tax of each segment for 2016 and 2015.(*2) The total assets and liabilities represent the amount as of December 31, 2016 and 2015.
The measured amounts in each segment are reported to the chief operating decision maker for the purpose ofassessing the performance of each segment.
The geographic operating revenue information and the geographic non-current assets information for theyears ended December 31, 2016 and 2015 are as follows (Korean won in thousands):
Year ended December 31, 2016 Year ended December 31, 2015Domestic Overseas Domestic Overseas
Operating revenue \ 4,946,573,758 \ 27,907 \ 3,240,822,368 \ 226,565Non-current assets (*) 156,522,954 - 171,803,662 -(*) Represents the amount as of December 31, 2016 and 2015.

Meritz Securities Co., Ltd. and its subsidiariesNotes to the consolidated financial statementsDecember 31, 2016 and 2015
30
7. Cash and due from banks
Cash and due from banks as of December 31, 2016 and 2015 are as follows (Korean won in thousands):
December 31,2016
December 31,2015
Cash and cash equivalents:
Cash on hand
Current deposits 1,291,772 11,020,912
Demand deposits 25,801,595 23,869,983
Foreign currency deposit 10,127,261 1,628,459
MMDA 63,900,000 109,500,000
Others 556,066,963 400,206,569
657,187,591 546,225,923
Due from banks in Korean won:Reserve for claims of customers
Deposits(*) 38,410,380 37,000,000Guarantee deposits for securities
Borrowed 62,101,200 9,059,110Guarantee deposits for
trading futures and options 37,100,000 38,723,763
Long - term deposits 2,000,000 2,000,000
Restricted deposits etc. 174,500 129,000
Other deposits 19,982,474 12,930,485
159,768,554 99,842,358\ 816,956,145 \ 646,068,281
(*) Pursuant to the Law on Capital Market and Financial Investment Services and related regulations, theGroup is required to place a deposit after daily calculation in Korea Securities Finance Corporation(“KSFC”) as a reserve against customers’ deposits for the trading of stocks, derivatives and for otherpurposes. These deposits should exceed the amount which is calculated by deducting cash commissionguarantee from total customers’ deposit.

Meritz Securities Co., Ltd. and its subsidiariesNotes to the consolidated financial statementsDecember 31, 2016 and 2015
31
8. Financial assets at fair value through profit or loss
Financial assets at fair value through profit or loss as of December 31, 2016 and 2015 are as follows (Koreanwon in thousands):
Book value (Fair value)December 31,
2016December 31,
2015Financial assets held for trading:
Equity securities \ 237,782,825 \ 278,575,974Debt securities:
Government and public bonds 3,573,543,493 2,923,902,109Special purpose bonds 1,769,127,267 2,077,567,966Corporate bonds 1,273,908,333 1,212,963,721Collective investment securities 188,026,959 87,937,755Commercial papers 269,355,080 368,891,602Asset backed short-term bonds 50,078,198 22,436,864Foreign currency securities 107,072,958 974,166
\ 7,468,895,113 \ 6,973,250,157Derivative assets held for trading:
Interest rate derivatives 74,046,282 112,573,356Foreign currency derivatives 50,225,716 31,296,123Equity derivatives 29,541,408 10,620,497Stock price index derivatives 364,124 21,760Credit 386,719 1,071,624Others 5,271,113 6,003,095Credit risk adjustments (607,797) (489,476)Deferred day 1 profit or loss (1,854,851) 887,031
\ 157,372,714 \ 161,984,010Financial assets designated at fair
value through profit or loss (*1):Equity-linked securities 4,517,369 4,180,453Derivatives-linked securities - 637,855Reserve for claims of customers’deposits (trust) (*2) 270,866,951 295,920,714
Others 149,693,912 34,962,539Credit risk adjustments (6,987) (7,576)Deferred day 1 profit or loss (44,327) (193,316)
\ 425,026,918 \ 335,500,669\ 8,051,294,745 \ 7,470,734,836
(*1) Equity-linked securities, derivatives-linked securities and reserve for claims of customers’ deposits wereappointed as “Financial assets at fair value through profit or loss” by exercising the fair value option.
(*2) Pursuant to the Law on Capital Market and Financial Investment Services and related regulations, theGroup is required to place a deposit after daily calculation in Korea Securities Finance Corporation(“KSFC”) as a reserve against customers’ deposits for the trading of stocks, derivatives and for otherpurposes. These deposits should exceed the amount which is calculated by deducting cash commissionguarantee from total customers’ deposit.

Meritz Securities Co., Ltd. and its subsidiariesNotes to the consolidated financial statementsDecember 31, 2016 and 2015
32
8. Financial assets at fair value through profit or loss (cont’d)
Debt securities of financial assets classified held-for-trading as of December 31, 2016 and 2015 are as follows(Korean won in thousands):
December 31, 2016 December 31, 2015Face value Acquisition cost Fair value Face value Acquisition cost Fair value
Debt securities:Government and public
bonds \ 3,761,036,247 \ 3,590,256,147 \ 3,573,543,493 \ 2,846,915,452 \ 2,923,976,468 \ 2,923,902,109Special purpose bonds 1,752,526,931 1,775,692,786 1,769,127,267 2,054,544,978 2,077,145,127 2,077,567,966Corporate bonds 1,276,987,327 1,277,956,215 1,273,908,333 1,210,142,447 1,213,834,901 1,212,963,721
\ 6,790,550,505 \ 6,643,905,148 \ 6,616,579,093 \ 6,111,602,877 \ 6,214,956,496 \ 6,214,433,796Foreign bonds (*) 93,150,000 104,160,587 102,723,226 - - -
100,000,000 1,122,138 1,042,160 - - -Commercial papers 269,000,000 269,000,000 269,355,080 368,025,000 368,025,000 368,891,602Asset backed short-term
bonds 50,000,000 50,000,000 50,078,198 22,400,000 22,400,000 22,436,864\ 7,302,700,505 \ 7,068,187,873 \ 7,039,777,757 \ 6,502,027,877 \ 6,605,381,496 \ 6,605,762,262
(*) The acquisition cost and fair value of foreign bonds are converted into Korean won.
Derivative embedded securities of financial assets classified held-for-trading as of December 31, 2016 and2015 are as follows (Korean won in thousands):
December 31, 2016 December 31, 2015Nominal
value Issue value Fair value Nominal value Issue value Fair valueEquity linkedsecurities \ 4,472,000 \ 4,472,000 \ 4,517,369 \ 4,744,000 \ 4,744,000 \ 4,180,453
Derivative linkedsecurities - - - 1,475,000 1,475,000 637,855
\ 4,472,000 \ 4,472,000 \ 4,517,369 \ 6,219,000 \ 6,219,000 \ 4,818,308
9. Available-for-sale financial assets
Available-for-sale financial assets as of December 31, 2016 and 2015 are as follows (Korean won inthousands):
Book value (Fair value)December 31, 2016 December 31, 2015
Equity securities and equity investment (*) \ 233,758,085 \ 252,073,398Debt securities:Government and public bonds 341,241,014 85,404,225Special purpose bonds 448,685,474 200,381,207Corporate bonds 248,261,232 83,891,970
Collective investment securities 97,987,525 84,710,716Foreign currency securities 10,731,480 -Commercial papers 185,583,280 20,697,421Others 8,314,005 6,262,079
\ 1,574,562,095 \ 733,421,016
(*) Some non-marketable equity securities were measured at acquisition cost because they could not be evaluated at fair value with a reliable valuation model. If net asset value significantly decreases, the Group recognizes the difference between acquisition cost and net asset value as impairment loss.

Meritz Securities Co., Ltd. and its subsidiariesNotes to the consolidated financial statementsDecember 31, 2016 and 2015
33
9. Available-for-sale financial assets (cont’d)
Valuation gain (loss) on valuation of available-for-sale financial assets as of December 31, 2016 and 2015 areas follows (Korean won in thousands):
December 31, 2016Acquisition
costAmortized
costAccumulated
impairment loss Fair valueGain(loss) on
valuationEquity securities:
Marketableequity securities \ 6,675,537 \ 6,675,537 \ (1,100,206) \ 5,843,940 \ 268,609Non-marketableequity securities 131,978,067 131,978,067 (3,903,847) 227,914,145 99,839,925
138,653,604 138,653,604 (5,004,053) 233,758,085 100,108,534Debt securities:Government and
public bonds 340,411,936 340,357,251 - 341,241,014 883,763Special purposebonds 448,130,280 448,042,918 - 448,685,474 642,556
Corporate bonds 236,378,643 241,763,244 - 248,261,232 6,497,9881,024,920,859 1,030,163,413 1,038,187,720 8,024,307
Collectiveinvestmentsecurities 111,306,758 111,306,758 (7,985,215) 97,987,525 (5,334,018)
Commercial paper 185,137,988 185,370,563 - 185,583,280 212,717Foreign currencysecurities 10,444,600 10,444,600 (94,960) 10,731,480 381,840Other securities 8,314,005 8,314,005 - 8,314,005 -
\ 1,478,777,814 \ 1,484,252,943 \ (13,084,228) \ 1,574,562,095 \ 103,393,380
December 31, 2015Acquisition
costAmortized
costAccumulated
impairment loss Fair valueGain(loss) on
valuationEquity securities:
Marketableequity securities \ 56,498,809 \ 56,498,809 \ (50,091) \ 51,917,330 \ (4,531,388)
Non-marketableequity securities 114,727,359 114,727,359 (3,558,879) 200,156,068 88,987,588
171,226,168 171,226,168 (3,608,970) 252,073,398 84,456,200Debt securities:Government andpublic bonds 81,876,736 81,876,736 - 85,404,225 3,527,489
Special purpose bonds 200,499,003 200,369,814 - 200,381,207 11,393Corporate bonds 84,059,116 84,089,240 (1,475,790) 83,891,970 1,278,520
366,434,855 366,335,790 (1,475,790) 369,677,402 4,817,402Collectiveinvestmentsecurities 90,369,206 90,369,206 (7,984,921) 84,710,716 2,326,431
Commercial paper 20,682,090 20,682,090 - 20,697,421 15,331Foreign currency securities 94,960 94,960 (94,960) - -Other securities 6,262,079 6,262,079 - 6,262,079 -
\ 655,069,358 \ 654,970,293 \ (13,164,641) \ 733,421,016 \ 91,615,364

Meritz Securities Co., Ltd. and its subsidiariesNotes to the consolidated financial statementsDecember 31, 2016 and 2015
34
9. Available-for-sale financial assets (cont’d)
Changes in valuation gain (loss) on valuation available-for-sale financial assets for the years ended December31, 2016 and 2015 are as follows (Korean won in thousands):
Year ended December 31, 2016Beginningbalance Reclassification
Gain onvaluaton
Endingbalance
Equity securities:
Marketable equity securities \ (4,531,388) \ 4,736,807 \ 63,190 \ 268,609Non-marketable equity securities 88,987,588 152,698 10,699,639 99,839,925
84,456,200 4,889,505 10,762,829 100,108,534Debt securitiesGovernment and public bonds 3,527,489 (2,995,783) 352,057 883,763Special purpose bonds 11,393 (381,207) 1,012,370 642,556Corporate bonds 1,278,520 (90,857) 5,310,325 6,497,988
4,817,402 (3,467,847) 6,674,752 8,024,307Collective investment securities 2,326,431 (1,334,285) (6,326,164) (5,334,018)Commercial paper 15,331 (14,696) 212,082 212,717Foreign currency securities - - 381,840 381,840
91,615,364 72,677 11,705,339 103,393,380Income tax effect (22,096,408) (17,515) (2,789,724) (24,903,647)
\ 69,518,956 \ 55,162 \ 8,915,615 \ 78,489,733
Year ended December 31, 2015Beginning
balance ReclassificationGain onvaluaton
Endingbalance
Equity securities:
Marketable equity securities \ 74,711,877 \ (75,056,772) \ (4,186,493) \ (4,531,388)Non-marketable equity securities 88,334,656 (656,293) 1,309,225 88,987,588
163,046,533 (75,713,065) (2,877,268) 84,456,200Debt securitiesGovernment and public bonds 1,656,429 - 1,871,060 3,527,489Special purpose bonds 227,140 (194,491) (21,256) 11,393Corporate bonds 1,477,801 (404,070) 204,789 1,278,520
3,361,370 (598,561) 2,054,593 4,817,402Collective investment securities 2,458,240 (438,621) 306,812 2,326,431Commercial paper - - 15,331 15,331
168,866,143 (76,750,247) (500,532) 91,615,364Income tax effect (40,375,894) 18,350,984 (71,498) (22,096,408)
\ 128,490,249 \ (58,399,263) \ (572,030) \ 69,518,956
Residual maturity of debt securities in available-for-sale financial assets as of December 31, 2016 and 2015are as follows (Korean won in thousands):
December 31, 2016
No laterthan 1 year
After 1 year butno later than 5
years
After 5 year butno later than
10 years TotalDebt securities:
Government and public bonds \ - \ 330,586,942 \ 10,654,072 \ 341,241,014Special purpose bonds 150,129,064 298,556,410 - 448,685,474Corporate bonds 86,536,552 161,724,680 - 248,261,232Commercial paper 185,354,788 228,492 - 185,583,280
\ 422,020,404 \ 791,096,524 \ 10,654,072 \ 1,223,771,000

Meritz Securities Co., Ltd. and its subsidiariesNotes to the consolidated financial statementsDecember 31, 2016 and 2015
35
9. Available-for-sale financial assets (cont’d)
December 31, 2015
No laterthan 1 year
After 1 year butno later than 5
years
After 5 year butno later than
10 years TotalDebt securities:
Government and public bonds \ - \ - \ 85,404,225 \ 85,404,225Special purpose bonds 200,381,207 - - 200,381,207Corporate bonds - 83,891,970 - 83,891,970Commercial paper 20,242,271 455,150 - 20,697,421
\ 220,623,478 \ 84,347,120 \ 85,404,225 \ 390,374,823
10. Investments in associates and joint venture
Details of investments in associates and joint venture as of December 31, 2016 and 2015 are as follows(Korean won in thousands):
Associates Location Closing month Ownership
Book valueDecember 31,
2016December 31,
2015Saengbo Wootoo ShinyoungHousing CR-Reit Co., Ltd. II(*1) Korea December 16.36% \ 25,000,000 \ 25,000,000
Cabiroth InvestmentConsulting (Shanghai) Co.,Ltd. China December 0.00% - 186,159
Globalone Private IPO Investment Trust #1 (*2)
Korea50.00% 6,500,000 -
MPLUS Private Real EstateInvestment Trust #4
Korea83.33% 4,945,084 -
Pureun Partners Fund (*2) Korea 79.92% 3,246,789 -Csquared Merry PrivateInvestment Trust1st (*2)
Korea79.87% 5,626,633 -
Bros IPO InvestmentPrivate Trust 1st (*2)
Korea80.00% 3,225,157 -
Human Investment Trust(*2)
Korea80.00% 3,380,400 -
Aion Private InvestmentTrust 1st (*2)
Korea80.00% 3,272,157 -
Kiwoom Milestone EuropeProfessional Private RealEstate InvestmentTrust3(*2)
Korea
22.53% 23,514,987 -Bestars Samo PropertyNo.8 Investment Inc. (*2)
Korea37.50% 31,188,362 -
Platform Partners activemezzanine private equityinvestment trust No.2 (*2)
Korea
8.50% 1,086,286 -Airplane fund 5 (*2) Korea 42.63% 74,926,701 -Airplane fund 6 (*2) Korea 36.37% 40,154,514 -High Yield Plus InvestmentTrust 3rd (*2)
Korea1.37% 399,653 -
High Yield Plus InvestmentTrust 4th (*2) Korea 0.87% 600,515 -
East Spring High Yield 2nd
(*2) Korea 7.90% 4,684,371 -\ 231,751,609 \ 25,186,159

Meritz Securities Co., Ltd. and its subsidiariesNotes to the consolidated financial statementsDecember 31, 2016 and 2015
36
10. Investments in associates and joint venture (cont’d)
(*1) Reclassified as an associate because the Group holds 21.58% of voting rights over the associate.Investments in this associate are cumulative participating preferred stocks and the Group has the right toreceive dividends based on the dividend rate, if distributable profit is generated.
(*2) Classified as joint venture after the consent of all participants that make important decisions. Joint ventureis financed by the participants and invests in stocks, real estate, etc. and distributes the revenue to theinvestors.
Changes in investments in associates and joint venture for the years ended December 31, 2016 and 2015 areas follows (Korean won in thousands):
Year ended December 31, 2016
BeginningAcquisition Disposal
Gain or losson equitymethod
Receipt ofdividends
Impairment
Capitalchanges in
equitymethod
Other (*)
Increasedue to
businesscombinati
on
Ending
balance balance
\25,186,1
59 \615,771,
561 \(409,676,5
25) \2,453,0
20 \(2,515,2
98) \34,6
61 \718,8
52 \(220,8
21) \ - \231,751,
609
(*) The book value eliminated as a result of selling subsidiary shares for the year ended December 31, 2016that held shares of Cabiroth Investment Consulting (Shanghai) Co., Ltd. is included.
Year ended December 31, 2015
Beginningbalance Acquisition Impairment Other
Increase due tobusiness
combinationEndingbalance
\ 25,207,861 \ - \ (34,243) \ 12,541 \ - \ 25,186,159
Condensed financial statements as of December 31, 2016 and 2015 are as follows (Korean won inthousands):
December 31, 2016Associates Asstes Liabilities Revenue Net profit(loss)
Saengbo Wootoo Shinyoung Housing CR-Reit Co., Ltd. II \ 375,244,229 \ 232,499,761 \ 82,831 \ (2,893,160)
Globalone Private IPO Investment Trust #1 13,537,963 537,963 1,456,932 850,683MPLUS Private Real Estate Investment Trust#4 6,022,861 88,760 490,201 144,112
Pureun Partners Fund 4,064,465 1,998 818,799 640,559Csquared Merry Private Investment
Trust1st 7,049,218 4,806 913,290 727,992Bros IPO InvestmentPrivate Trust 1st 4,038,972 7,567 120,577 (37,372)Human Investment Trust 4,229,228 3,727 319,801 238,027Aion Private Investment Trust 1st 4,090,972 775 181,227 116,643Kiwoom Milestone Europe ProfessionalPrivate Real Estate Investment Trust3 110,225,143 5,847,421 1,619,751 (4,641,595)
Bestars Samo PropertyNo.8 Investment Inc. 176,918,168 93,749,203 10,779,464 6,214,667Platform Partners active mezzanine privateequity investment trust No.2 12,782,641 34 1,008,010 1,007,369
Airplane fund 5 181,753,967 6,001,712 11,052,467 522,255Airplane fund 6 114,127,800 3,729,755 8,297,628 3,145High Yield Plus InvestmentTrust 3rd 29,147,232 13,805 963,629 599,677High Yield Plus InvestmentTrust 4th 69,240,907 17,544 3,343,590 1,450,155East SpringHigh Yield 2nd 59,321,944 44,981 2,449,187 1,637,472
\ 1,171,795,710 \ 342,549,812 \ 43,897,384 \ 6,580,629

Meritz Securities Co., Ltd. and its subsidiariesNotes to the consolidated financial statementsDecember 31, 2016 and 2015
37
10. Investments in associates (cont’d)
December 31, 2015Associates Assets Liabilities Revenue Net Profit(loss)
Saengbo Wootoo Shinyoung Housing CR-Reit Co., Ltd. II \ 388,126,330 \ 242,823,369 \ 210,055 \ (4,055,879)
Cabiroth Investment Consulting(Shanghai)Co., Ltd. 368,554 - 111,568 88,675
\ 388,494,884 \ 242,823,369 \ 321,623 \ (3,967,204)
11. Loans and CMA
Details of loans and CMA as of December 31, 2016 and 2015 consist of the following (Korean won inthousands):
December 31, 2016
Face value
Allowance forpossible loan
losses Book valueLoans:
Call loans \ 60 \ - \ 60RP purchased 745,000,000 - 745,000,000Broker’s loan 605,663,407 - 605,663,407Loans to employees 2,944,648 (68,673) 2,875,975
Loans 3,843,948,015 (56,417,673)3,787,530,34
2Notes discounted 72,300,000 (276,393) 72,023,607Loans purchased 170,535,303 (7,513,521) 163,021,782Privately-placed corporate bonds 115,984,636 (466,826) 115,517,810Payment on behalf of another company 4,399,789 (4,365,996) 33,793Deferred loan fees (14,127,616) - (14,127,616)
\ 5,546,648,242 \ (69,109,082) \ 5,477,539,160CMA:
CMA-notes discounted \ 28,100,000 \ (90,452) \ 28,009,548
December 31, 2015
Face value
Allowance forpossible loan
losses Book valueLoans:
Call loans \ 1,424,923 \ - \ 1,424,923RP purchased 432,200,000 - 432,200,000Broker’s loan 438,243,473 - 438,243,473Loans to employees 3,148,248 (69,746) 3,078,502Loans 3,446,919,425 (117,991,822) 3,328,927,603Notes discounted 178,300,000 (340,284) 177,959,716Loans purchased 36,597,083 (6,706,712) 29,890,371Privately-placed corporate bonds 50,425,997 (1,804,136) 48,621,861Payment on behalf of another company 7,311,254 (7,266,561) 44,693Discount present value - - -Deferred loan fees (10,544,957) - (10,544,957)
\ 4,584,025,446 \ (134,179,261) \ 4,449,846,185CMA:
CMA-notes discounted \ 55,000,000 \ (179,751) \ 54,820,249

Meritz Securities Co., Ltd. and its subsidiariesNotes to the consolidated financial statementsDecember 31, 2016 and 2015
38
11. Loans and CMA (cont’d)
Broker’s loansThe Group provides loans to clients who either make margin transactions for purchasing securities or entrusttheir investment securities to the Group and records them as credit loans granted and loans secured bysecurities, respectively. Credit loans granted are secured with the securities purchased by clients and cash inclients’ deposit account, which amount to 140~150% of the original loan. When the collateral value isinsufficient to secure the loan and its accrued income, the Group requests for additional collateral cash orsecurities.
In addition, the Group asks for an opening guarantee deposit in connection with brokers’ loans and thedeposits are recorded as a liability item guarantee deposit received.
Residual maturity of debt securities as of December 31, 2016 and 2015 is as follows (Korean won inthousands):
December 31,2016
December 31,2015
No later than 1 year \ 3,464,093,262 \ 2,950,912,724After 1 year but no later than 3 years 1,467,605,900 1,336,486,309After 1 year but no later than 5 years 535,390,270 162,234,607After 5 years 93,686,426 144,936,764
\ 5,560,775,858 \ 4,594,570,404
Changes in allowance for possible loan losses for the years ended December 31, 2016 and 2015 are asfollows (Korean won in thousands):
December 31,2016
December 31,2015
Beginning balance \ 134,359,012 \ 128,784,802Bad debts written off (56,637,682) -Collection of loans written-off in prior periods 535,105 -Utilized (15,579,819) (5,858,864)Transfer (*) - 515,824Unwinding effect (4,046,832) (3,660,923)
58,629,784 119,780,839Provision for allowance 10,569,750 14,578,173
\ 69,199,534 \ 134,359,012
(*) It was the amount transferred from provision to allowance for doubtful accounts, or from allowance fordoubtful account to provision for the years ended December 31, 2016 and 2015.
Changes in incidental income or incident expense of deferred loans for the years ended December 31, 2016and 2015 are as follows (Korean won in thousands):
Year ended December 31, 2016Beginningbalance
Income orexpense incurred Depreciation
Ending balance
Incidental income \ (11,509,134) \ (21,405,867) \ 18,448,010 \ (14,466,991)Incidental expense 964,176 - (624,801) 339,375
\ (10,544,958) \ (21,405,867) \ 17,823,209 \ (14,127,616)

Meritz Securities Co., Ltd. and its subsidiariesNotes to the consolidated financial statementsDecember 31, 2016 and 2015
39
11. Loans and CMA (cont’d)
Year ended December 31, 2015Beginningbalance
Income orexpense incurred Depreciation
Ending balance
Incidental income \ (7,434,236) \ (17,072,744) \ 12,997,846 \ (11,509,134)Incidental expense 2,094,393 19,992 (1,150,209) 964,176
\ (5,339,843) \ (17,052,752) \ 11,847,637 \ (10,544,958)
Gain (loss) related to loans for the years ended December 31, 2016 and 2015 are as follows (Korean won inthousands):
Year endedDecember 31,
2016
Year endedDecember 31,
2015
Gain on disposal of loans \ 8,294,777 \ 25,229,847
8,294,777 25,229,847Loss on disposal of loans (782,533) (181,786)Provision for doubtful accounts (10,569,750) (14,578,173)
(11,352,283) (14,759,959)\ (3,057,506) \ 10,469,888
12. Lease
Details of lease assets for the years ended December 31, 2016 and 2015 are as follows (Korean won inthousands):
Year ended December 31, 2016
Acquisition costAllowance for
leaseAccumulateddepreciation
Provision forloss on disposal
of lease Book valueFinanciallease \ 264,854,951 \ (4,848,917) \ - \ - \ 260,006,034
Operatinglease - - - - -
\ 264,854,951 \ (4,848,917) \ - \ - \ 260,006,034
Year ended December 31, 2015
Acquisition costAllowance for
leaseAccumulateddepreciation
Provision forloss on disposal
of lease Book valueFinanciallease \ 477,850,702 \ (6,315,833) \ - \ - \ 471,534,869
Operatinglease 4,548,494 - (3,396,209) (22,742) 1,129,543
\ 482,399,196 \ (6,315,833) \ (3,396,209) \ (22,742) \ 472,664,412

Meritz Securities Co., Ltd. and its subsidiariesNotes to the consolidated financial statementsDecember 31, 2016 and 2015
40
12. Lease (cont’d)
Details of total lease investment and the present value of minimum financial lease as of December 31, 2016and 2015 are as follows (Korean won in thousands):
December 31, 2016 December 31, 2015Total leaseinvestment
Minimumfinancial lease
Total leaseinvestment
Minimumfinancial lease
No later than 1 year \ 156,054,935 \ 150,609,359 \ 225,222,812 \ 217,340,347After 1 year butno later than 5 years 122,151,516 107,991,354 283,336,542 244,230,717
After 5 years - - - -\ 278,206,451 \ 258,600,713 \ 508,559,354 \ 461,571,064
Unearned interests of financial lease as of December 31, 2016 and 2015 are as follows (Korean won inthousands):
December 31,2016
December 31,2015
Total lease investment \ 278,206,451 \ 508,559,354Minimum financial lease 264,854,951 477,850,702
Unearned interest \ 13,351,500 \ 30,708,652
Unsecured residual value of financial lease as of December 31, 2016 and 2015 is as follows (Korean won inthousands):
December 31,2016
December 31,2015
\ 2,121,148 \ 5,332,986
The estimated future operating lease revenues as of December 31, 2016 and 2015 are as follows (Koreanwon in thousands):
December 31,2016
December 31,2015
No later than 1 year \ - \ 325,570\ - \ 325,570
Changes in allowance for lease for the years ended December 31, 2016 and 2015 are as follows (Korean wonin thousands):
Year endedDecember 31,
2016
Year endedDecember 31,
2015
Beginning balance \ 6,315,833 \ 7,105,121Provision for allowance - -Bad debts written off (1,211,362)Recovery of amortized bond 21,346 -Unwinding effect (222,378) (141,422)
4,903,439 6,963,699Provision for allowance
(Reversal of allowance for lease) (54,522) (647,866)\ 4,848,917 \ 6,315,833

Meritz Securities Co., Ltd. and its subsidiariesNotes to the consolidated financial statementsDecember 31, 2016 and 2015
41
12. Lease (cont’d)
Gain (loss) related to lease for the years ended December 31, 2016 and 2015 are as follows (Korean won inthousands):
Year endedDecember 31,
2016
Year endedDecember 31,
2015
Interest on financial lease \ 24,611,914 \ 36,722,966Commissions on operating lease 325,570 1,002,788Gain on disposal of lease 2,092,524 1,628,385Reversal of allowance for doubtful accounts 54,522 647,866Others 22,742 8,383
27,107,272 40,010,388Operating lease depreciation (242,586) (747,426)Lease commission expense (194,312) (483,306)Loss on disposal of lease (599,249) (291,663)Provision for allowance -Others (16,125) (64,642)
(1,052,272) (1,587,037)\ 26,055,000 \ 38,423,351
13. Property and equipment
Details of property and equipment as of December 31, 2016 and 2015 are as follows (Korean won inthousands):
December 31, 2016
Acquisition costAccumulateddepreciation Book value
Land \ 59,306,738 \ - \ 59,306,738Buildings 39,081,619 (9,273,590) 29,808,029Vehicles 122,925 (42,605) 80,320Furniture and fixtures 60,407,262 (50,548,100) 9,859,162Others 591,421 - 591,421
\ 159,509,965 \ (59,864,295) \ 99,645,670
December 31, 2015
Acquisition costAccumulateddepreciation Book value
Land \ 59,272,919 \ - \ 59,272,919Buildings 38,697,660 (8,008,532) 30,689,128Vehicles 552,635 (308,215) 244,420Furniture and fixtures 66,123,566 (55,621,581) 10,501,985Others 591,421 - 591,421
\ 165,238,201 \ (63,938,328) \ 101,299,873

Meritz Securities Co., Ltd. and its subsidiariesNotes to the consolidated financial statementsDecember 31, 2016 and 2015
42
13. Property and equipment (cont’d)
Changes in property and equipment for the years ended December 31, 2016 and 2015 are as follows (Koreanwon in thousands):
Year ended December 31, 2016Beginningbalance Addition (*1) Disposal Depreciation Transfer (*2) Other
Ending balance
Land \ 59,272,919 \ - \ (35,000) \ - \ 68,819 \ - \ 59,306,738Buildings 30,689,128 - (10,849) (957,708) 87,458 - 29,808,029Vehicles 244,420 89,658 (206,578) (47,180) - - 80,320Furniture and fixture 10,501,985 4,118,151 (275,035) (4,485,939) - - 9,859,162Others 591,421 - - - - - 591,421
\ 101,299,873 \ 4,207,809 \ (527,462) \ (5,490,827) \ 156,277 \ - \ 99,645,670
(*1) ₩372,701 thousand of tangible assets based on the recognition of provision for restoration cost areincluded in the acquisition of furniture and fixtures.(*2) Land and buildings are replaced with investment properties based on the change in rental rate.
Year ended December 31, 2015Beginningbalance Addition (*1) Disposal Depreciation Transfer (*2) Other
Ending balance
Land \ 60,756,336 \ - \ - \ - \ (1,483,417) \ - \ 59,272,919Buildings 33,027,336 - - (999,548) (1,338,660) - 30,689,128Vehicles 261,586 - - (113,109) 95,943 - 244,420Furniture and fixture 8,545,041 5,642,644 (24,638) (4,158,467) - 497,405 10,501,985Others 1,368,403 18,973 - (292,128) - (503,827) 591,421
\ 103,958,702 \ 5,661,617 \ (24,638) \ (5,563,252) \ (2,726,134) \ (6,422) \ 101,299,873
(*1) ₩390,304 thousand of tangible assets based on the recognition of provision for restoration cost areincluded in the acquisition of furniture and fixtures.
(*2) Land and buildings are replaced with investment properties based on the change in rental rate and theincrease in vehicle is the amount that was replaced with finance lease receivables due to the earlycancellation of the finance lease vehicles.
Insured tangible assets as of December 31, 2015 are as follows (Korean won in thousands):
Insurance Insured assetInsurancecompany
Insurancecoverage
Propertyinsurance Buildings, etc.
Meritz Fire & Marine Insurance Co., Ltd., etc.
\ 66,608,872
Data processingequipmentinsurance
Data processingequipment, etc.
Meritz Fire & Marine Insurance Co., Ltd.
2,119,660
Automobileinsurance Vehicles
Meritz Fire & Marine Insurance Co., Ltd.
347,030
\ 69,075,562
14. Investment property
Details of investment property as of December 31, 2016 and 2015 are as follows (Korean won in thousands):
December 31, 2016
Acquisition costAccumulateddepreciation Book value
Land \ 12,489,782 \ - \ 12,489,782Buildings 14,976,426 (6,302,857) 8,673,569
\ 27,466,208 \ (6,302,857) \ 21,163,351
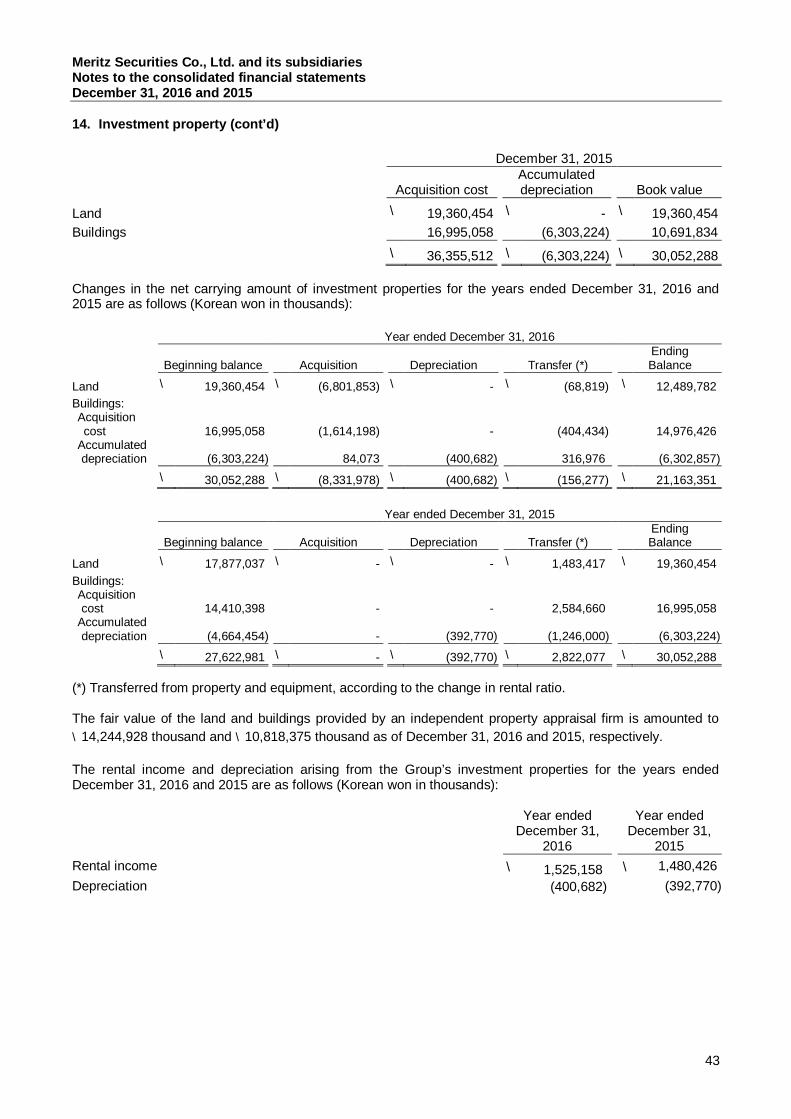
Meritz Securities Co., Ltd. and its subsidiariesNotes to the consolidated financial statementsDecember 31, 2016 and 2015
43
14. Investment property (cont’d)
December 31, 2015
Acquisition costAccumulateddepreciation Book value
Land \ 19,360,454 \ - \ 19,360,454Buildings 16,995,058 (6,303,224) 10,691,834
\ 36,355,512 \ (6,303,224) \ 30,052,288
Changes in the net carrying amount of investment properties for the years ended December 31, 2016 and2015 are as follows (Korean won in thousands):
Year ended December 31, 2016
Beginning balance Acquisition Depreciation Transfer (*)EndingBalance
Land \ 19,360,454 \ (6,801,853) \ - \ (68,819) \ 12,489,782Buildings:Acquisitioncost 16,995,058 (1,614,198) - (404,434) 14,976,426
Accumulateddepreciation (6,303,224) 84,073 (400,682) 316,976 (6,302,857)
\ 30,052,288 \ (8,331,978) \ (400,682) \ (156,277) \ 21,163,351
Year ended December 31, 2015
Beginning balance Acquisition Depreciation Transfer (*)EndingBalance
Land \ 17,877,037 \ - \ - \ 1,483,417 \ 19,360,454Buildings:Acquisitioncost 14,410,398 - - 2,584,660 16,995,058
Accumulateddepreciation (4,664,454) - (392,770) (1,246,000) (6,303,224)
\ 27,622,981 \ - \ (392,770) \ 2,822,077 \ 30,052,288
(*) Transferred from property and equipment, according to the change in rental ratio.
The fair value of the land and buildings provided by an independent property appraisal firm is amounted to\14,244,928 thousand and \10,818,375 thousand as of December 31, 2016 and 2015, respectively.
The rental income and depreciation arising from the Group’s investment properties for the years endedDecember 31, 2016 and 2015 are as follows (Korean won in thousands):
Year endedDecember 31,
2016
Year endedDecember 31,
2015Rental income \ 1,525,158 \ 1,480,426Depreciation (400,682) (392,770)

Meritz Securities Co., Ltd. and its subsidiariesNotes to the consolidated financial statementsDecember 31, 2016 and 2015
44
15. Intangible assets
Intangible assets as of December 31, 2016 and 2015 are as follows (Korean won in thousands):
December 31, 2016
Acquisition costAccumulatedamortization
Accumulatedimpairment loss Book value
Software \ 45,216,379 \ (37,230,508) \ - \ 7,985,871Membership 15,851,273 - (4,179,625) 11,671,648Others 16,396,015 (339,600) - 16,056,415
\ 77,463,667 \ (37,570,108) \ (4,179,625) \ 35,713,934
December 31, 2015
Acquisition costAccumulatedamortization
Accumulatedimpairment loss Book value
Software \ 43,034,773 \ (30,291,018) \ - \ 12,743,755Membership 15,946,156 - (4,464,625) 11,481,531Others 16,396,015 (169,800) - 16,226,215
\ 75,376,944 \ (30,460,818) \ (4,464,625) \ 40,451,501
Changes in carrying amounts of intangible assets for the years ended December 31, 2016 and 2015 are asfollows (Korean won in thousands):
Year ended December 31, 2016Beginningbalance Addition Decrease Amortization Others
Endingbalance
Software \ 12,743,755 \ 2,181,606 \ - \ (6,939,490) \ - \ 7,985,871Membership 11,481,531 2,120,819 (1,930,702) - - 11,671,648Others 16,226,215 - - (169,800) - 16,056,415
\ 40,451,501 \ 4,302,425 \ (1,930,702) \ (7,109,290) \ - \ 35,713,934
Year ended December 31, 2015Beginningbalance Addition Amortization
Impairmentloss (*) Others
Endingbalance
Software \ 16,401,527 \ 1,624,688 \ (6,596,344) \ - \ 1,313,884 \ 12,743,755Membership 14,006,320 40,880 - (2,565,669) - 11,481,531Others 18,005,713 119,680 (591,716) - (1,307,462) 16,226,215
\ 48,413,560 \ 1,785,248 \ (7,188,060) \ (2,565,669) \ 6,422 \ 40,451,501
(*) Impairment loss was recognized due to a significant decrease in recoverable amount of membership forthe year ended December 31, 2015.

Meritz Securities Co., Ltd. and its subsidiariesNotes to the consolidated financial statementsDecember 31, 2016 and 2015
45
16. Other assets
Other assets as of December 31, 2016 and 2015 are as follows (Korean won in thousands):
December 31,2016
December 31,2015
Receivable from proprietary trading \ 240,257,668 \ 28,188,124Receivable from trading on consignment 87,922,838 77,661,415Other receivable 26,723,951 49,467,371Accrued income 80,870,284 38,319,211Guarantee deposits 7,074,919 6,016,181Unsettled spot exchange 46,659,606 107,821,400Unsettled difference 861,411 2,404,554Allowance for possible losses (3,553,525) (4,696,672)Present value discount (301,750) (326,738)
\ 486,515,402 \ 304,854,846Advanced payment 95,106,092 28,742,687Prepaid expenses 22,421,431 22,781,047Others 2,098,633 1,752,883
\ 119,626,156 \ 53,276,617\ 606,141,558 \ 358,131,463
Changes in allowance for other assets for the years ended December 31, 2016 and 2015 are as follows(Korean won in thousands):
Year endedDecember 31,
2016
Year endedDecember 31,
2015
Beginning balance \ 4,696,672 \ 4,677,667Bad debt written-off (1,340,697) -Recovery of amortized bond 50 -Business combination - -Provision for (reversal of) allowance 197,500 19,005
\ 3,553,525 \ 4,696,672
17. Deposits
Deposits as of December 31, 2016 and 2015 are as follows (Korean won in thousands):
December 31,2016
December 31,2015
Customers’ claims on deposits \ 319,674,249 \ 323,290,631Guarantee deposit for customers’ security trading - 283,000Leasehold deposits provided 104,057,434 158,133,067CMA deposits 14,878,546 47,984,195Notes payable 2,669,376,108 2,947,535,124Others 2,042,775 1,333,937
\ 3,110,029,112 \ 3,478,559,954Discounted present value (7,210,292) (14,689,113)
\ 3,102,818,820 \ 3,463,870,841

Meritz Securities Co., Ltd. and its subsidiariesNotes to the consolidated financial statementsDecember 31, 2016 and 2015
46
18. Financial liabilities fair value through profit or loss
Financial liabilities at fair value through profit or loss as of December 31, 2016 and 2015 are as follows(Korean won in thousands):
Book value (fair value)December 31,
2016December 31,
2015Financial liabilities held-for-trading:Stock \ 190,198,715 \ 79,764,851
Bonds: 1,135,551,151 Government bonds 542,038,960 490,643,123Special purpose bonds - -Others 828,935 1,291,137
\ 1,868,617,761 \ 571,699,111Derivatives liabilities held-for-trading:Interest 57,898,596 114,940,846
Currency 30,734,971 13,332,353 Stock 8,878,608 2,158,373Stock index 358,335 25,167Others 5,334,373 4,047,279Credit risk adjustments (141,305) (166,656)Deferred Day1 profit or loss adjustments 92,922 -
\ 103,156,500 \ 134,337,362Financial liabilities designated at fair valuethrough profit or loss:Equity linked securities sold (*) 38,669,005 86,618,863Derivative linked securities sold (*) 603,015,306 404,798,971Others 13,253,118 -Credit risk value adjustments (817,716) (603,324)Deferred day 1 profit or loss adjustments 309,972 (21,684)
\ 654,429,685 \ 490,792,826\ 2,626,203,946 \ 1,196,829,299
(*) The Group designates equity linked securities sold and derivative linked securities sold as financial liabilityat fair value through profit or loss without separating embedded derivative from the host contract.
19. Borrowings
Borrowings as of December 31, 2016 and 2015 are as follows (Korean won in thousands):
Lender Interest rate (%)December 31,
2016December 31,
2015
Commercial paper KTB Investment & Securities and others 1.46~1.63 \ 430,100,000 \ 80,000,000
Commercial Paper (ABCP) 1.85~6.00 882,200,000 642,900,000
Asset backed short-term bonds KTB Investment & Securities and others 1.42~1.83 1,111,500,000 859,100,000
Repurchase agreements sold Woori Bank and others 1.15~1.60 5,351,618,732 5,324,808,245
Borrowing from KSFC Korea securities FinanceCorporation (“KSFC”) 1.35~1.68 625,000,000 100,000,000
Others (*) Meritz Fire & MarineInsurance Co., Ltd. 5.00~6.50 294,190,141 78,250,000
\ 8,694,608,873 \ 7,085,058,245
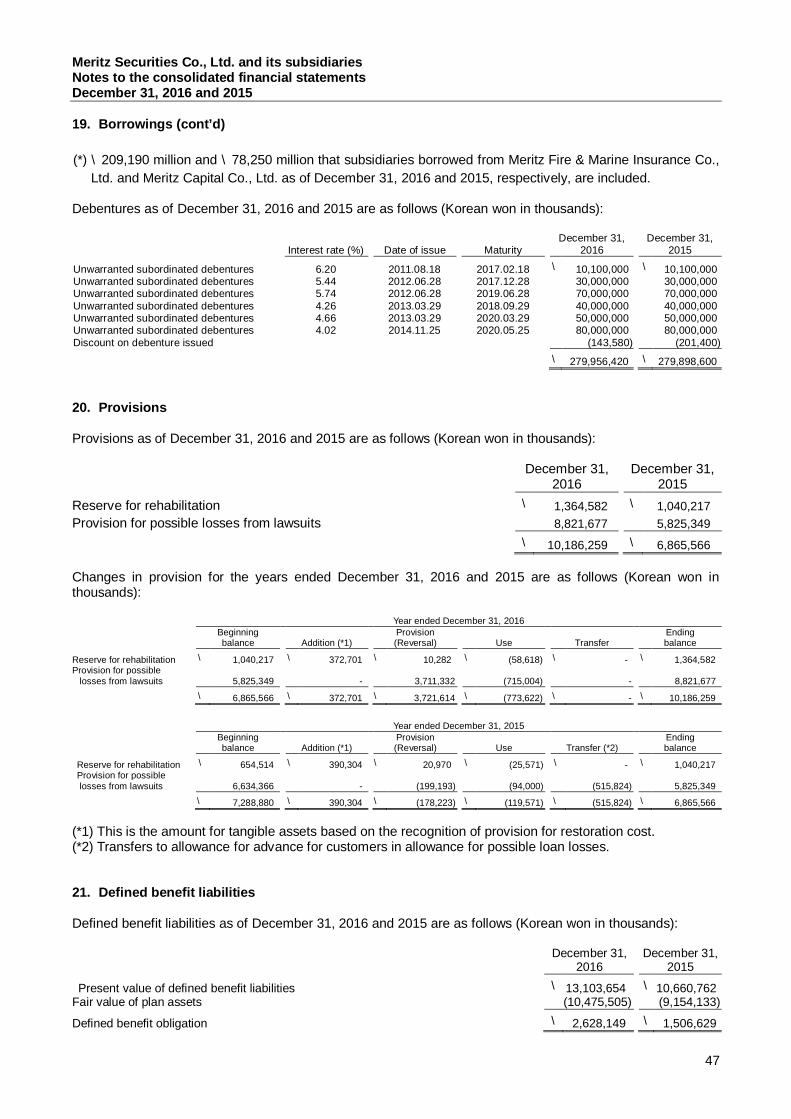
Meritz Securities Co., Ltd. and its subsidiariesNotes to the consolidated financial statementsDecember 31, 2016 and 2015
47
19. Borrowings (cont’d)
(*) \209,190 million and \78,250 million that subsidiaries borrowed from Meritz Fire & Marine Insurance Co.,Ltd. and Meritz Capital Co., Ltd. as of December 31, 2016 and 2015, respectively, are included.
Debentures as of December 31, 2016 and 2015 are as follows (Korean won in thousands):
Interest rate (%) Date of issue MaturityDecember 31,
2016December 31,
2015
Unwarranted subordinated debentures 6.20 2011.08.18 2017.02.18 \ 10,100,000 \ 10,100,000Unwarranted subordinated debentures 5.44 2012.06.28 2017.12.28 30,000,000 30,000,000Unwarranted subordinated debentures 5.74 2012.06.28 2019.06.28 70,000,000 70,000,000Unwarranted subordinated debentures 4.26 2013.03.29 2018.09.29 40,000,000 40,000,000Unwarranted subordinated debentures 4.66 2013.03.29 2020.03.29 50,000,000 50,000,000Unwarranted subordinated debentures 4.02 2014.11.25 2020.05.25 80,000,000 80,000,000Discount on debenture issued (143,580) (201,400)
\ 279,956,420 \ 279,898,600
20. Provisions
Provisions as of December 31, 2016 and 2015 are as follows (Korean won in thousands):
December 31,2016
December 31,2015
Reserve for rehabilitation \ 1,364,582 \ 1,040,217Provision for possible losses from lawsuits 8,821,677 5,825,349
\ 10,186,259 \ 6,865,566
Changes in provision for the years ended December 31, 2016 and 2015 are as follows (Korean won inthousands):
Year ended December 31, 2016Beginningbalance Addition (*1)
Provision(Reversal) Use Transfer
Endingbalance
Reserve for rehabilitation \ 1,040,217 \ 372,701 \ 10,282 \ (58,618) \ - \ 1,364,582Provision for possible losses from lawsuits 5,825,349 - 3,711,332 (715,004) - 8,821,677
\ 6,865,566 \ 372,701 \ 3,721,614 \ (773,622) \ - \ 10,186,259
Year ended December 31, 2015Beginningbalance Addition (*1)
Provision(Reversal) Use Transfer (*2)
Endingbalance
Reserve for rehabilitation \ 654,514 \ 390,304 \ 20,970 \ (25,571) \ - \ 1,040,217Provision for possible
losses from lawsuits 6,634,366 - (199,193) (94,000) (515,824) 5,825,349\ 7,288,880 \ 390,304 \ (178,223) \ (119,571) \ (515,824) \ 6,865,566
(*1) This is the amount for tangible assets based on the recognition of provision for restoration cost.(*2) Transfers to allowance for advance for customers in allowance for possible loan losses.
21. Defined benefit liabilities
Defined benefit liabilities as of December 31, 2016 and 2015 are as follows (Korean won in thousands):
December 31,2016
December 31,2015
Present value of defined benefit liabilities \ 13,103,654 \ 10,660,762Fair value of plan assets (10,475,505) (9,154,133)
Defined benefit obligation \ 2,628,149 \ 1,506,629

Meritz Securities Co., Ltd. and its subsidiariesNotes to the consolidated financial statementsDecember 31, 2016 and 2015
48
21. Defined benefit liabilities (cont’d)
Changes in defined benefit liabilities for the years ended December 31, 2016 and 2015 are as follows (Koreanwon in thousands):
Year endedDecember 31,
2016
Year endedDecember 31,
2015
Beginning balance \ 10,660,762 \ 10,009,524Current service cost 4,347,293 4,211,341Loss on merger - 237,547Interest expense 229,454 169,443Re-measurement:Experience adjustments (81,152) 118,101Actuarial changes arising fromchanges in demographic assumptions 4,092 259,543
Actuarial changes arising from changes in financial assumptions 76,285 26,551
Payment (2,133,080) (4,385,921)Other - 14,633
Ending balance \ 13,103,654 \ 10,660,762
Changes in plan assets for the years ended December 31, 2016 and 2015 are as follows (Korean won inthousands):
Year endedDecember 31,
2016
Year endedDecember 31,
2015
Beginning balance \ 9,154,133 \ 5,633,608Expected return on plan assets 194,180 108,001Re-measurement: Interest income from plan assets (49,504) 782(Excluding the amount included in theinterest income above)Contributions by employer 3,502,939 4,655,481Payment (2,326,243) (1,258,372)Other - 14,633
Ending balance \ 10,475,505 \ 9,154,133
Changes in remeasured element of defined benefit liabilities for the years ended December 31, 2016 and2015 are as follows (Korean won in thousands):
Year endedDecember 31,
2016
Year endedDecember 31,
2015
Beginning balance \ (626,265) \ (284,582)Re-measurement on defined benefit liabilities 775 (404,195)Re-measurement on plan assets (49,504) 782Income tax effect 11,729 109,481Non-controlling interest - (47,751)
Ending balance \ (663,265) \ (626,265)

Meritz Securities Co., Ltd. and its subsidiariesNotes to the consolidated financial statementsDecember 31, 2016 and 2015
49
21. Defined benefit liabilities (cont’d)
The details of defined benefit liabilities for the years ended December 31, 2016 and 2015 are as follows(Korean won in thousands):
Year endedDecember 31,
2016
Year endedDecember 31,
2015
Current service cost \ 4,347,293 \ 4,448,888Interest expense, net 35,274 61,442
Defined benefit of severance payment \ 4,382,567 \ 4,510,330
The principal actuarial assumptions as of December 31, 2016 and 2015 are as follows :
December 31,2016
December 31,2015
Discount rate 2.25% 2.36%Expected return ratio on plan assets 2.25% 2.36%
Future ratio of salary increase 2.00% 2.00%Mortality rate 0.004% ~ 0.067% 0.002% ~ 0.067%
Sensitivity analysis for actuarial assumptions in defined benefit liabilities as of December 31, 2015 is asfollows (Korean won in thousands):
December 31,2016 1% Increase 1% Decrease
Fluctuation of future salary \ 13,103,654 13,840,779 12,429,185
Fluctuation of discount rate \ 13,103,654 12,438,297 13,844,723
The details of plan assets as of December 31, 2016 and 2015 are as follows (Korean won in thousands):
December 31,2016
December 31,2015
Deposits, etc. \ 3,842,081 \ 2,981,187Equity 7,266 4,595Bonds 1,749,906 2,070,500Collective investment securities 132,427 3,765,541Financial assets in foreign currency 271,930 65,061Others 4,471,895 267,249
\ 10,475,505 \ 9,154,133
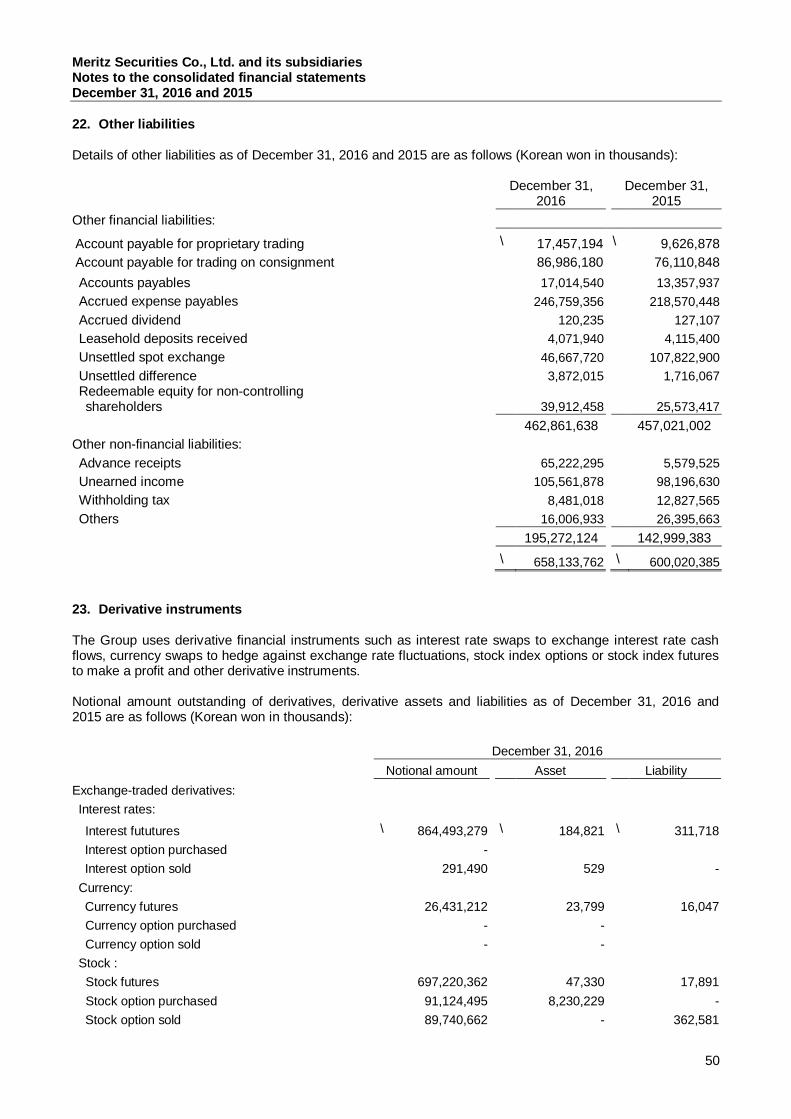
Meritz Securities Co., Ltd. and its subsidiariesNotes to the consolidated financial statementsDecember 31, 2016 and 2015
50
22. Other liabilities
Details of other liabilities as of December 31, 2016 and 2015 are as follows (Korean won in thousands):
December 31,2016
December 31,2015
Other financial liabilities:
Account payable for proprietary trading \ 17,457,194 \ 9,626,878 Account payable for trading on consignment 86,986,180 76,110,848Accounts payables 17,014,540 13,357,937Accrued expense payables 246,759,356 218,570,448Accrued dividend 120,235 127,107Leasehold deposits received 4,071,940 4,115,400Unsettled spot exchange 46,667,720 107,822,900Unsettled difference 3,872,015 1,716,067Redeemable equity for non-controllingshareholders 39,912,458 25,573,417
462,861,638 457,021,002Other non-financial liabilities:Advance receipts 65,222,295 5,579,525Unearned income 105,561,878 98,196,630Withholding tax 8,481,018 12,827,565Others 16,006,933 26,395,663
195,272,124 142,999,383\ 658,133,762 \ 600,020,385
23. Derivative instruments
The Group uses derivative financial instruments such as interest rate swaps to exchange interest rate cashflows, currency swaps to hedge against exchange rate fluctuations, stock index options or stock index futuresto make a profit and other derivative instruments.
Notional amount outstanding of derivatives, derivative assets and liabilities as of December 31, 2016 and2015 are as follows (Korean won in thousands):
December 31, 2016Notional amount Asset Liability
Exchange-traded derivatives: Interest rates:
Interest fututures \ 864,493,279 \ 184,821 \ 311,718Interest option purchased -Interest option sold 291,490 529 -
Currency:Currency futures 26,431,212 23,799 16,047Currency option purchased - -Currency option sold - -
Stock :Stock futures 697,220,362 47,330 17,891Stock option purchased 91,124,495 8,230,229 -Stock option sold 89,740,662 - 362,581

Meritz Securities Co., Ltd. and its subsidiariesNotes to the consolidated financial statementsDecember 31, 2016 and 2015
51
23. Derivative instruments (cont’d)
December 31, 2016
Notional amount Asset LiabilityExchange-traded derivatives:
Commodity:
Commodity futures \ 20,269,656 \ 432,288 \ 1,128,684Commodity option purchased 21,978,361 1,034,826 -Commodity option sold 740,968,088 - 783,773
2,552,517,605 9,953,822 2,620,694Over-the-counter derivatives: Interest rates: -
Interest rate swap 100,132,959,000 73,330,260 56,115,575 Interest rate option sold 10,000,000 - 1,371,265 Currency: Currency forward 798,406,400 50,124,794 30,677,657
Currency swap - - -Currency option - - -
Stock: Options purchased 99,563,915 21,167,403 -
Options sold 93,047,611 - 8,928,811Stock swap 1,418,161 - 38,472
Credit:CDS 60,000,000 912,259 -
Others:Other swap 497,474,569 1,793,165 3,404,025Options purchased 4,000,000 91,013 -Options sold -
101,696,869,656 147,418,894 100,535,805
\ 104,249,387,261 \ 157,372,716 \ 103,156,499
December 31, 2015Notional amount Asset Liability
Exchange-traded derivatives: Interest rates:
Interest futures \ 2,201,214,177 \ 274,102 \ 167,340Interest option purchased - - -Interest option sold - - -
Currency:Currency futures 16,256,701 17,653 996Currency option purchased - - -Currency option sold - - -
Stock :Stock futures 253,455,348 - 733Stock option purchased 56,895,124 6,248,877 -Stock option sold 132,059,103 - 54,276

Meritz Securities Co., Ltd. and its subsidiariesNotes to the consolidated financial statementsDecember 31, 2016 and 2015
52
23. Derivative instruments (cont’d)
December 31, 2015Notional amount Asset Liability
Exchange-traded derivatives:Commodity:
Commodity futures \ 9,305,716 \ 144,039 \ 220,819Commodity option purchased 4,341,088 7,032 -Commodity option sold 79,876,019 - 1,154,420
2,753,403,276 6,691,703 1,598,584Over-the-counter derivatives: Interest rates:
Interest rate swap 75,812,383,000 111,906,732 113,354,688 Interest rate option sold 10,000,000 - 1,271,169 Currency: Currency forward 943,534,631 31,181,516 13,312,350
Currency swap - - -Currency option - - -
Stock: Options purchased 32,814,879 3,595,325 -
Options sold 4,281,009 - 2,102,368Stock swap 305,844 - 26,896
Credit:CDS 60,000,000 2,756,709 -
Others:Other swap 70,548,389 5,732,111 2,645,167Options purchased 24,721,000 119,914 -Options sold 5,000,000 - 26,140
76,963,588,752 155,292,307 132,738,778\ 79,716,992,028 \ 161,984,010 \ 134,337,362
Gain (loss) on valuation of trading derivative financial instruments for the years ended December 31, 2016and 2015 are as follows (Korean won in thousands):
Year endedDecember 31, 2016
Year endedDecember 31, 2015
Exchange-traded derivatives:
Interest rates \ (769,013) \ (2,486,630) Currency (395,491) 68,330 Stock 192,507 735,685 Stock index (7,456,394) 913,113 Others 3,845,419 (282,715)
(4,582,972) (1,052,217)Over-the-counter derivatives: Interest rates 15,159,898 2,168,908 Currency (2,754,849) 17,947,113 Stock 12,330,904 (4,216,881) Credit (684,905) (330,812)
Others (1,296,795) 5,772,337
22,754,253 21,340,665\ 18,171,281 \ 20,288,448

Meritz Securities Co., Ltd. and its subsidiariesNotes to the consolidated financial statementsDecember 31, 2016 and 2015
53
24. Capital stock
The Group is authorized to issue 1,000,000,000 shares of common stock and has 496,638,534 shares issuedand outstanding in the amount of \496,638,534 thousand as of December 31, 2015.
Changes in capital stock for the years ended December 31, 2016 and 2015 are as follows (Korean won inthousands, thousand stocks):
Year ended December 31, 2016 Issued shares Capital stock
January 1, 2016 496,638,534 \ 496,638,534Rights issued - -Issuance of stock upon merger - -
Issuance of capital stock - -
December 31, 2016 496,638,534 \ 496,638,534
Year ended December 31, 2015 Issued shares Capital stock
January 1, 2015 311,782,377 \ 311,782,377Rights issued 50,000 50,000Issuance of stock upon merger 66,811,951 66,811,951Issuance of capital stock 117,994,206 117,994,206
December 31, 2015 496,638,534 \ 496,638,534
25. Other capital
Other capital as of December 31, 2016 and 2015 consist of the following (Korean won in thousands):
December 31,2016
December 31,2015
Paid in capital in excess of par value \ 556,127,022 \ 556,127,022Gain on disposal of treasury stock 3,456,342 3,456,342Others (*) 1,961,311 1,961,311Treasury stock (9,711,997) (9,711,997)Stock options (*) 1,318,796 583,499
\ 553,151,474 \ 552,416,177
(*) See share-based payment transaction (Note 26)

Meritz Securities Co., Ltd. and its subsidiariesNotes to the consolidated financial statementsDecember 31, 2016 and 2015
54
25. Other capital (cont’d)
Changes in other capital for the years ended December 31, 2016 and 2015 are as follows (Korean won inthousands):
Year endedDecember 31,
2016
Year endedDecember 31,
2015
Beginning balance \ 552,416,177 \ 111,625,897Acquisition of treasury stock - (3,744)Allocated expense of share based payment 735,297 583,499Increase of stock issued upon merger - 144,828,870Issuance of capital stock - 295,366,946Executed stock options:Stock options - (20,591)Issued capital in excess of par value - 36,091Costs of the issue - (791)
\ 553,151,474 \ 552,416,177
26. Share-based payment transaction
The Group granted stock options based on general meeting’s special decision. in accordance with commerciallaw and relative laws.
The details of stock options granted by the Group as of December 31, 2016 are summarized as follows(Korean won and number of shares):
Stock options granted 4,900,000 2,900,000Settlement date 2005.12.01 2015.03.20Settlement method (*1) (*1)
Exercise price (*5) ₩ 1,310 ₩ 4,380Exercisable period (*2) (*3)Forfeiture period (*4) (*4)
(*1) Option holder can select either cash-settled method or equity-settled method at the time of exercise.(*2) Exercisable within 10 years after the settlement date.(*3) Exercisable within 4 years after the settlement date.(*4) Stock options will be forfeited, if not exercised, within the execercisable period.(*5) The exercise price of stock option granted in this year was adjusted from ₩4,710 due to issuance of
capital stock.
Changes in stock options granted during the years ended December 31, 2016 and 2015 are summarized asfollows (number of shares in units):
Number of stockoptions
January 1, 2016 2,900,000Number of options granted -Number of options decreased -December 31, 2016 2,900,000
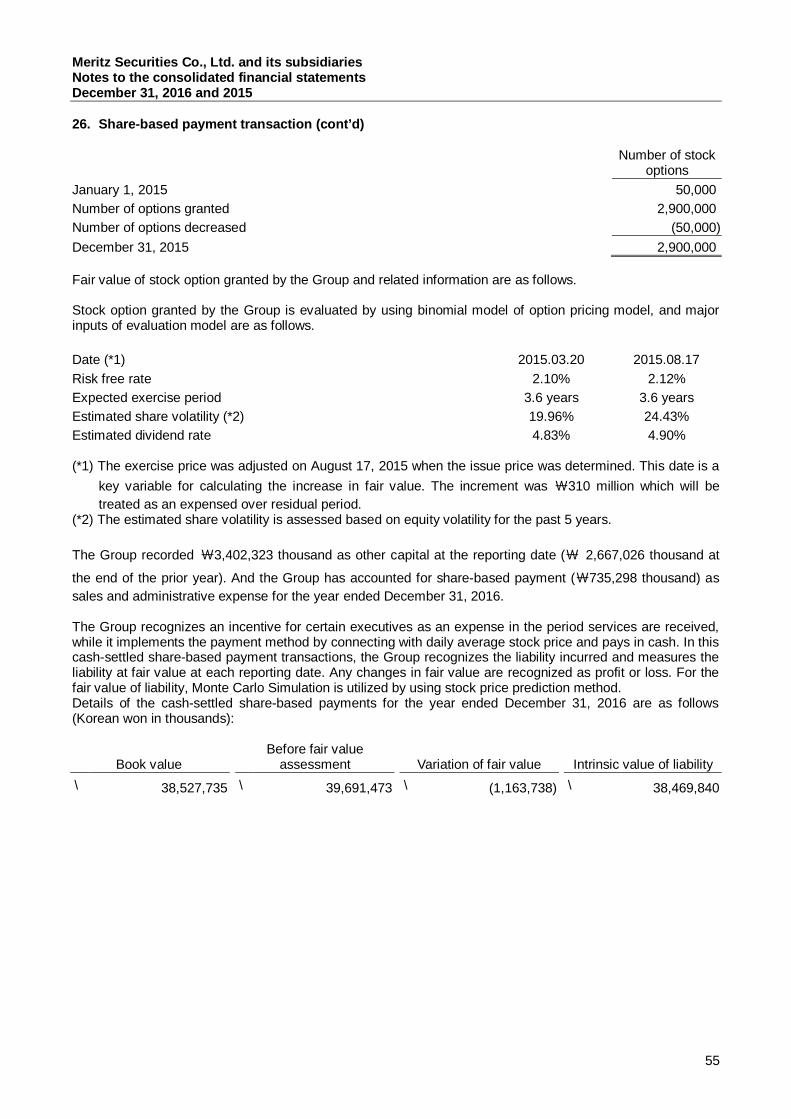
Meritz Securities Co., Ltd. and its subsidiariesNotes to the consolidated financial statementsDecember 31, 2016 and 2015
55
26. Share-based payment transaction (cont’d)
Number of stockoptions
January 1, 2015 50,000Number of options granted 2,900,000Number of options decreased (50,000)December 31, 2015 2,900,000
Fair value of stock option granted by the Group and related information are as follows.
Stock option granted by the Group is evaluated by using binomial model of option pricing model, and majorinputs of evaluation model are as follows.
Date (*1) 2015.03.20 2015.08.17Risk free rate 2.10% 2.12%Expected exercise period 3.6 years 3.6 yearsEstimated share volatility (*2) 19.96% 24.43%Estimated dividend rate 4.83% 4.90%
(*1) The exercise price was adjusted on August 17, 2015 when the issue price was determined. This date is akey variable for calculating the increase in fair value. The increment was ₩310 million which will betreated as an expensed over residual period.
(*2) The estimated share volatility is assessed based on equity volatility for the past 5 years.
The Group recorded ₩3,402,323 thousand as other capital at the reporting date (₩ 2,667,026 thousand at
the end of the prior year). And the Group has accounted for share-based payment (₩735,298 thousand) assales and administrative expense for the year ended December 31, 2016.
The Group recognizes an incentive for certain executives as an expense in the period services are received,while it implements the payment method by connecting with daily average stock price and pays in cash. In thiscash-settled share-based payment transactions, the Group recognizes the liability incurred and measures theliability at fair value at each reporting date. Any changes in fair value are recognized as profit or loss. For thefair value of liability, Monte Carlo Simulation is utilized by using stock price prediction method.Details of the cash-settled share-based payments for the year ended December 31, 2016 are as follows(Korean won in thousands):
Book valueBefore fair value
assessment Variation of fair value Intrinsic value of liability\ 38,527,735 \ 39,691,473 \ (1,163,738) \ 38,469,840

Meritz Securities Co., Ltd. and its subsidiariesNotes to the consolidated financial statementsDecember 31, 2016 and 2015
56
27. Accumulated other comprehensive income
Accumulated other comprehensive income as of December 31, 2016 and 2015 consist of the following(Korean won in thousands):
December 31,2016
December 31,2015
Gain on valuation ofavailable-for-sale financial assets:
Stock \ 100,108,534 \ 84,456,201 Bonds 8,024,308 4,817,402Collective investment securities (5,334,018) 2,326,431Commercial paper 212,718 15,332Foreign currency securities 381,840 -Income tax effect (24,903,648) (22,096,409)
78,489,734 69,518,957Capital change in equity method Capital change in equity method 718,852 - Income tax effect (173,028) -
545,824 -Gain (loss) on effect of foreign currencytranslationGain (loss) on effect of foreign currencytranslation - 13,877
Income tax effect - (3,335)- 10,542
Remeasurement of the defined benefit liability:Actuarial loss (825,788) (777,060)Income tax effect 210,276 198,547
(615,512) (578,513)Non-controlling interest (587,609) (587,222)
\ 79,007,655 \ 69,538,208
28. Retained earnings
Retained earnings as of December 31, 2016 and 2015 consist of the following (Korean won in thousands):
December 31,2016
December 31,2015
Legal reserve \ 36,979,394 \ 26,048,847Reserve for possible loan losses 12,276,239 17,742,597Voluntary reserves 42,466,457 42,466,457Unappropriated retained earnings 657,790,477 513,713,429
\ 749,512,567 \ 599,971,330
Changes in unappropriated retained earnings for the years ended December 31, 2016 and 2015 are asfollows (Korean won in thousands):

Meritz Securities Co., Ltd. and its subsidiariesNotes to the consolidated financial statementsDecember 31, 2016 and 2015
57
28. Retained earnings (cont’d)
December 31,2016
December 31,2015
Beginning balance \ 513,713,429 \ 268,203,020Reserve for possible loan losses 5,466,358 (1,886,205)Cash dividends (104,305,466) (44,309,444)Reserve of legal reserve (10,930,547) (4,430,944)Net income of non-controlling interests 253,846,703 296,137,002
Ending balance \ 657,790,477 \ 513,713,429
In case total sum of allowance for possible loan losses does not meet the amount prescribed in theRegulations 3-8 on Financial Investment Business, the Group is required to compensate the difference, if any,at the reporting date as a regulatory reserve for possible loan losses. In case the amount of existing regulatoryreserve for possible loan losses exceeds the amount needed to be laid aside as at the current period, thedifference, if any, shall be reversed. If there is an undisposed deficit, the Group can accumulate reserves forpossible loan losses after disposing the deficit.
Changes in regulatory reserve for possible loan losses the years ended December 31, 2016 and 2015 are asfollows (Korean won in thousands):
December 31,2016
December 31,2015
Appropriated regulatory reserve for possible loan losses \ 12,276,239 \ 17,742,597Planned provision of regulatory reservefor possible loan losses 11,399,590 (5,466,358)
Ending of regulatory reserve for possible loan losses \ 23,675,829 \ 12,276,239
Provision of regulatory reserve for possible loan losses and adjusting income after the provision of regulatoryreserve for possible loan losses for the years ended December 31, 2016 and 2015 are as follows (Koreanwon in thousands):
Year endedDecember 31,
2016
Year endedDecember 31,
2015
Net income \ 253,846,703 \ 287,336,735Planned provision of regulatory reserve
for possible loan losses (11,399,590) 5,466,358Adjusted income after provision of
regulatory reserve for possible loan losses (*) \ 242,447,113 \ 292,803,093Earnings per share 535 803
(*) Adjusted income after provision of regulatory reserve for possible loan losses is hypothetical amount notaccorded with KIFRS. The amount was calculated by adding (deducting) provision from net income.

Meritz Securities Co., Ltd. and its subsidiariesNotes to the consolidated financial statementsDecember 31, 2016 and 2015
58
29. Net fees and commission income
Net fees and commission income for the years ended December 31, 2016 and 2015 are as follows (Koreanwon in thousands):
Year endedDecember 31,
2016
Year endedDecember 31,
2015Fees and commission income:
Brokerage commissions \ 72,990,925 \ 93,233,704Underwriting commissions 26,514,261 24,851,328Brokerage commissions on collective investment securities 4,580,330 4,940,264Management fees on wrap account and asset management 1,357,714 1,634,154Finance commissions 135,102,720 157,460,226Fees on trust accounts 3,116,893 4,517,970Commissions on CMA 107,901 130,577Others 99,503,096 59,972,719
343,273,840 346,740,942Fees and commission expense:Trading commissions (5,742,417) (6,960,931)
Lending and borrowing transaction commissions (10,365,901) (6,736,742)Others (13,584,703) (7,594,728)
(29,693,021) (21,292,401)\ 313,580,819 \ 325,448,541
30. Gain (loss) on financial assets and liabilities
Gain (loss) on financial assets does not include interest income and dividends income. Interest income anddividends income are disclosed separately in Notes 31 and 33, respectively
Gain (loss) on financial assets and liabilities held-for-trading for the years ended December 31, 2016 and2015 are as follows (Korean won in thousands):
Year ended December 31, 2016
Gain on disposalLoss ondisposal Gain on valuation Loss on valuation
Net gain(loss)
Financial assetsheld-for-trading:
Stock \ 70,566,564 \ (68,273,756) \ 6,222,958 \ (3,855,013) \ 4,660,753 Bonds 138,940,350 (182,919,134) 10,340,680 (39,172,280) (72,810,384) Collective investment
securities 63,461,085 (62,438,398) 3,726,265 (2,309,550) 2,439,402Commercial paper 25,845,397 (1,635,064) 450,432 (95,352) 24,565,413Asset backedshort-term bonds 13,751,541 (81,152) 78,198 - 13,748,587
312,564,937 (315,347,504) 20,818,533 (45,432,195) (27,396,229)Financial liabilities held-for-trading: Securities sold 49,925,948 (56,596,008) 5,393,119 (2,794,032) (4,070,973)
Bonds sold 80,110,205 (44,768,525) 3,441,434 (2,635,957) 36,147,157 Collective investment securities sold 98,026 (57,064) - (12,133) 28,829
130,134,179 (101,421,597) 8,834,553 (5,442,122) 32,105,013\ 442,699,116 \ (416,769,101) \ 29,653,086 \ (50,874,317) \ 4,708,784

Meritz Securities Co., Ltd. and its subsidiariesNotes to the consolidated financial statementsDecember 31, 2016 and 2015
59
30. Gain (loss) on financial assets and liabilities (cont’d)
Year ended December 31, 2015
Gain on disposalLoss ondisposal Gain on valuation Loss on valuation
Net gain(loss)
Financial assetsheld-for-trading:
Stock \ 64,945,746 \ (45,306,762) \ 3,526,076 \ (5,402,113) \ 17,762,947 Bonds 120,448,364 (100,920,000) 3,691,372 (4,264,163) 18,955,573 Collective investment
securities 54,505,050 (48,802,472) 1,855,580 (2,059,669) 5,498,489Commercial paper 28,891,633 (1,300,463) 924,380 (57,778) 28,457,772Asset backedshort-term bonds 10,158,526 (70,771) 36,864 - 10,124,619
278,949,319 (196,400,468) 10,034,272 (11,783,723) 80,799,400Financial liabilities held-for-trading: Securities sold 76,682,509 (45,509,360) 3,729,924 (2,424,488) 32,478,585
Bonds sold 19,648,245 (43,985,175) 28,166 (2,535,415) (26,844,179) Collective investment securities sold 138,121 (1,142) 26,819 - 163,798
96,468,875 (89,495,677) 3,784,909 (4,959,903) 5,798,204\ 375,418,194 \ (285,896,145) \ 13,819,181 \ (16,743,626) \ 86,597,604
Gain (loss) on financial assets and liabilities designated at fair value through profit or loss for the years endedDecember 31, 2016 and 2015 are as follows (Korean won in thousands):
Year ended December 31, 2016Gain ondisposal
Loss onDisposal
Gain onvaluation
Loss onvaluation
Net gain(loss)
Financial assetsdesignated at fairvalue through profit orloss:
Equity linked securities \ 35,388 \ (201) \ 616,795 \ - \ 651,982 Derivatives linked securities 40,268 (1,688) - - 38,580
Reserve for claims of customers’ deposits (trust) - - 4,602,561 - 4,602,561 Others 1,177,584 - 466,679 (6,397,183) (4,752,920)
1,253,240 (1,889) 5,686,035 (6,397,183) 540,203Financial assets
designated at fairvalue through profit orloss:
Equity linked securities sold 26,195 (1,230,853) 13,014 (1,186,711) (2,378,355)
Derivative linked securities sold 3,219 (5,193,876) 509,257 (6,821,513) (11,502,913)
Others - - - (601,635) (601,635)29,414 (6,424,729) 522,271 (8,609,859) (14,482,903)
\ 1,282,654 \ (6,426,618) \ 6,208,306 \ (15,007,042) \ (13,942,700)

Meritz Securities Co., Ltd. and its subsidiariesNotes to the consolidated financial statementsDecember 31, 2016 and 2015
60
30. Gain (loss) on financial assets and liabilities (cont’d)
Gain (loss) on available-for-sale financial assets for the years ended December 31, 2016 and 2015 are asfollows (Korean won in thousands):
Year ended December 31, 2016Gain ondisposal
Loss ondisposal
Impairmentloss
Net gain(loss)
Stock \ 4,981,670 \ (9,777,396) \ (1,405,897) \ (6,201,623)Bonds 7,763,618 (1,247,976) - 6,515,642Collective investment securities 5,928,751 (904,483) (293) 5,023,975Others 24,537 - - 24,537
\ 18,698,576 \ (11,929,855) \ (1,406,190) \ 5,362,531
Year ended December 31, 2015Gain ondisposal
Loss ondisposal
Impairmentloss
Net gain(loss)
Stock \ 68,616,066 \ (131,808) \ (666,096) \ 67,818,162Bonds 107,094 - (509,518) (402,424)Collective investment securities 1,262,495 (1,063,602) (21) 198,872Others 3,228,844 (253,487) - 2,975,357
\ 73,214,499 \ (1,448,897) \ (1,175,635) \ 70,589,967
Year ended December 31, 2015Gain ondisposal
Loss ondisposal
Gain onvaluation
Loss onvaluation
Net gain(loss)
Financial assetsdesignated at fairvalue through profit orloss:
Equity linked securities \ 75,736 \ - \ 7,852 \ (571,828) \ (488,240) Derivatives linked securities 71,796 (5,910) 5,724 (218,873) (147,263)
Reserve for claims of customers’ deposits (trust) - - 4,304,673 - 4,304,673 Others - (66,692) 2,639,864 (9,930) 2,563,242
147,532 (72,602) 6,958,113 (800,631) 6,232,412 Financial assets
designated at fairvalue through profit orloss:
Equity linked securities sold 10,299 (989,399) 1,025,198 (486,154) (440,056)
Derivative linked securities sold 82,084 (4,999,802) 717,848 (1,664,353) (5,864,223)
92,383 (5,989,201) 1,743,046 (2,150,507) (6,304,279)\ 239,915 \ (6,061,803) \ 8,701,159 \ (2,951,138) \ (71,867)

Meritz Securities Co., Ltd. and its subsidiariesNotes to the consolidated financial statementsDecember 31, 2016 and 2015
61
30. Gain (loss) on financial assets and liabilities (cont’d)
Gain (loss) on other financial liabilities for the years ended December 31, 2016 and 2015 are as follows(Korean won in thousands):
Gain (loss) on financial derivatives for the years ended December 31, 2016 and 2015 are as follows (Koreanwon in thousands):
Year ended December 31, 2016Gain on disposal/
redemptionLoss on disposal/
redemption Gain on valuation Loss on valuationNet gain
(loss)Exchange-traded derivatives:
Futures \ 295,217,058 \ (255,870,255) \ 2,398,898 \ (11,289,735) \ 30,455,966Option 27,508,549 (31,083,585) 5,098,526 (790,661) 732,829Over-the-counter
derivatives: 2,141,711,299 (2,133,241,583) 88,230,467 (65,476,214) 31,223,969
\ 2,464,436,906 \ (2,420,195,423) \ 95,727,891 \ (77,556,610) \ 62,412,764
Year ended December 31, 2015Gain on disposal/
redemptionLoss on disposal/
redemption Gain on valuation Loss on valuationNet gain
(loss)Exchange-traded derivatives:
Futures \ 200,630,593 \ (202,422,591) \ 3,864,725 \ (4,972,108) \ (2,899,381)Option 120,130,674 (112,716,023) 673,693 (618,525) 7,469,819Over-the-counter
derivatives:Stock warrant securities 728,443 - - - 728,443Others 1,181,939,868 (1,197,571,556) 49,531,958 (28,191,293) 5,708,977
\ 1,503,429,578 \ (1,512,710,170) \ 54,070,376 \ (33,781,926) \ 11,007,858
Year ended December 31, 2016Loss on
redemptionGain onvaluation
Loss onvaluation Net gain (loss)
Debentures \ - \ - \ - \ -Other financial liabilities - 6,023 (6) 6,017
\ - \ 6,023 \ (6) \ 6,017
Year ended December 31, 2015Loss on
redemptionGain onvaluation
Loss onvaluation Net gain (loss)
Debentures \ - \ - \ - \ -Other financial liabilities - 7 - 7
\ - \ 7 \ - \ 7

Meritz Securities Co., Ltd. and its subsidiariesNotes to the consolidated financial statementsDecember 31, 2016 and 2015
62
31. Net interest income
Net interest income for the years ended December 31, 2016 and 2015 are as follows (Korean won inthousands):
Year endedDecember 31, 2016
Year endedDecember 31, 2015
Interest income:
Cash and due from banks \ 10,244,916 \ 13,527,494Held-for-trading financial assets 177,297,346 174,130,157Available-for-sale financial assets 13,828,936 6,776,604
Loans, etc. 261,808,390 226,503,550CMA 1,144,551 1,568,572Others 14,055,617 16,389,948
478,379,756 438,896,325Interest expense:Deposits (46,037,985) (59,394,153)Borrowings (162,331,157) (118,931,096)Bonds (13,705,247) (13,565,703)Others (20,816,815) (31,248,398)
(242,891,204) (223,139,350)\ 235,488,552 \ 215,756,975
32. Selling and administrative expense
Selling and administrative expenses for the years ended December 31, 2016 and 2015 are as follows (Koreanwon in thousands):
Year endedDecember 31,
2016
Year endedDecember 31,
2015Payroll expenses:
Salary expenses \ 193,998,949 \ 267,492,891 Post-employment benefits (DB) 4,382,567 4,510,330 Post-employment benefits (DC) 3,224,102 2,880,284 Early retirement benefits 2,873,139 7,952,981 Compensation Expenses Associated with
Stock Option 735,298 583,499205,214,055 283,419,985
General and administrative expenses:Employee benefits 25,601,303 21,751,682Electronic data processing expenses 8,153,227 10,888,701
Rental expense 7,213,848 6,517,858Commission expense 20,014,832 16,056,755Entertainment expenses 8,139,706 8,855,464Advertising expense 1,330,825 1,117,098Depreciation 5,891,509 5,956,023Training expenses 128,897 166,567Amortization 7,109,290 7,188,060Taxes and dues 17,947,584 20,352,952

Meritz Securities Co., Ltd. and its subsidiariesNotes to the consolidated financial statementsDecember 31, 2016 and 2015
63
32. Selling and administrative expense (cont’d)
Year endedDecember 31,
2016
Year endedDecember 31,
2015General and administrative expenses:
Others \ 12,898,647 \ 12,951,111114,429,668 111,802,271
\ 319,643,723 \ 395,222,256
33. Other operating income (expense)
Other operating income (expense) for the years ended December 31, 2016 and 2015 are as follows (Koreanwon in thousands):
Year endedDecember 31,
2016
Year endedDecember 31,
2015Other operating income:
Dividends on financial assets held for trading \ 4,799,610 \ 8,194,022Dividends on available-for-sale financial assets 8,675,092 11,367,536Reversal of impairment loss - 1,671Reversal of other provisions 18,088 199,193
Reversal of credit risk adjustments 214,981 -Reversal of deferred day 1 profit or loss adjustments 5,806,488 37,979,319Others 1,537,198 11,872,098
21,051,457 69,613,839Other operating expenses:
Provision for other doubtful accounts (197,500) (20,677)Provision for other provisions (3,711,332) -Provision for credit risk adjustments (143,671) (354,032)Amortization of deferred day 1 profit or loss adjustments (1,284,265) (1,157,295)Others (35,644) (8,780,625)
(5,372,412) (10,312,629)\ 15,679,045 \ 59,301,210

Meritz Securities Co., Ltd. and its subsidiariesNotes to the consolidated financial statementsDecember 31, 2016 and 2015
64
34. Non-operating income (expense)
Non-operating income (expense) for the years ended December 31, 2016 and 2015 are as follows (Koreanwon in thousands):
Year endedDecember 31,
2016
Year endedDecember 31,
2015Non-operating income:
Gain on disposal property and equipment \ 64,988 \ -Rental fee income 1,525,158 1,480,426Gain on disposal subsidiaries and associates 973,201 1,296,676Share of earnings from investments in associatesand joint ventures 4,250,794 -Recovery of impairment loss on investments insubsidiaries and associates, joint ventures 47,965 -Others (*) 1,768,409 1,456,487
8,630,515 4,233,589Non-operating expense:Loss on disposal property and equipment (300,236) (24,638)Loss on disposal investment properties (85,597) -
Loss on disposal intangible assets (124,100) -Impairment losses on intangible assets - (2,068)Share of losses from investments in associates andJoint ventures (1,797,774) -Loss on disposal subsidiaries and associates (97,785) (34,243)Impairment losses on subsidiaries and associates (13,303) (2,565,669)Others (464,834) (238,489)
(2,883,629) (2,865,107)\ 5,746,886 \ 1,368,482
35. Income taxes
The major components of income tax expense for the years ended December 31, 2016 and 2015 are asfollows (Korean won in thousands):
Year endedDecember 31,
2016
Year endedDecember 31,
2015
Current income taxes ₩ 84,989,417 ₩ 151,109,937Adjustments of prior year’s income tax (2,107,434) 389,310Changes in deferred income taxes
due to temporary differences (1,160,515) (50,715,598)Current and deferred income taxes recognized
directly to equity :Gain (loss) on valuation of available‑for‑salefinancial assets (2,807,239) 18,262,116
Equity method capital change (173,028)Actuarial gain - -Loss (gain) on effect of foreign currency translation 3,226 (3,344)Capital surplus & adjustments 11,729 109,481
Income tax expense ₩ 78,756,156 ₩ 119,151,902

Meritz Securities Co., Ltd. and its subsidiariesNotes to the consolidated financial statementsDecember 31, 2016 and 2015
65
35. Income taxes (cont’d)
Details of the relationship between income tax expense and income before income taxes for the years endedDecember 31, 2016 and 2015 are as follows (Korean won in thousands):
Year ended December 31,
2016
Year endedDecember 31,
2015
Income before income taxes ₩ 332,602,859 ₩ 406,488,637Income taxes at statutory tax rate (*1) 80,027,892 97,908,250
Adjustments:Non-deductible expenses and others (*2) 1,879,610 24,589,457Non-taxable income and others (*2) (166,926) (7,889,652)Income tax on undistributed corporate earnings (1,232,644) 4,510,910Adjustments of prior year’s income tax (2,107,434) 389,310Others 355,658 (356,373)
Income tax expense ₩ 78,756,156 ₩ 119,151,902Effective income tax rate 23.68% 29.31%
(*1) Income tax rate of 11% is applied for income below ₩200 million and 22% for income above ₩200 millionand below ₩20 billion and 24.2% for income above ₩20 billion for the years ended December 31, 2016and 2015.
(*2) Income tax on capital gains of IM Investment & Securities Co., Ltd., the acquiree as a result of the mergerof the Company and IM Investment & Securities Co., Ltd., and the effect of exclusion from taxable income forfictitional dividend of the acquiree’s shareholders are reflected on non-deductible expenses and non-taxableincome in the adjustments of 2015.
The details of tax liabilities as of December 31, 2016 and 2015 are as follows (Korean won in thousands):Year ended
December 31,2016
Year endedDecember 31,
2015
Deferred income tax assets ₩ 65,029,381 ₩ 45,992,366Income tax assets 65,029,381 45,992,366Current income tax liabilities 14,966,779 76,054,817Income tax liabilities 14,966,779 76,054,817
Temporary differences and deferred income tax assets (liabilities) as of December 31, 2016 and 2015 are asfollows (Korean won in thousands):
December 31,2016
December 31,2015
Finance lease receivables ₩ (1,064,695) ₩ (2,905,021)Gain on valuation of financial liabilities held-for-trading (816,558) 283,173
Gain (loss) on valuation of financial assets held-for-trading 5,922,405 462,414
Gain (loss) on valuation of financial assets designated at fair value
through profit or loss 1,414,051 (584,755)Gain on valuation of derivatives-combined securities sold 1,446,002 (127,760)
Gain (loss) on valuation of derivatives-combined securities (18,533) 327,899
Gain on valuation of derivative instruments (11,454,651) (3,154,585)

Meritz Securities Co., Ltd. and its subsidiariesNotes to the consolidated financial statementsDecember 31, 2016 and 2015
66
35. Income taxes (cont’d)
December 31,2016
December 31,2015
Deferred loan fee ₩ 3,388,951 ₩ 2,529,583Deferred day 1 profit or loss 522,253 (193,378)Gain (loss) on foreign transactions (554,313) (89,870)Allowance for loan losses 272,728 586,997Lease - 5,481Withdrawal of sales transaction (196,765) (197,010)Available-for-sale financial assets (17,733,810) (16,859,377)Accrued income (5,589,979) (4,610,844)Accrued expenses 23,974,317 9,143,653Credit risk-adjusted (82,858) (65,776)Property and equipment, intangible assets (7,657,616) (6,952,934)Subsidiaries and associates 4,420,396 5,053,812Allowance accounts 2,451,832 1,660,735Retirement pension premium (2,521,454) (1,971,574)Defined benefit liabilities 3,154,049 2,465,477Treasury stock 60,277,411 60,352,539Others 5,476,218 833,487
65,029,381 45,992,366
Deferred income tax assets ₩ 112,720,613 ₩ 83,705,250
Deferred income tax liabilities ₩ (47,691,232) ₩ (37,712,884)
Changes in the temporary differences and deferred income tax assets (liabilities) for the years endedDecember 31, 2016 and 2015 are as follows (Korean won in thousands):
Year ended December 31, 2016Beginningbalance (*) Changes Ending balance
Financial lease receivables ₩ (12,054,027) ₩ 7,630,700 ₩ (4,423,327)Gain (loss) on valuation of financial liabilities held-for-trading 1,174,993 (4,567,423) (3,392,430)Gain (loss) on valuation of financial assets held-for-trading 1,918,730 22,686,195 24,604,925Gain (loss) on valuation of financial assets designated atfair value through profit or loss (2,699,630) 8,574,376 5,874,746
Gain (loss) on valuation of derivatives-combinedsecurities sold (530,126) 6,537,613 6,007,487
Gain (loss) on valuation of derivatives-combined securities 1,360,577 (1,437,573) (76,996)Gain (loss) on valuation of derivative instruments (13,089,566) (34,499,347) (47,588,913)Deferred loan fee 10,496,193 3,583,371 14,079,564Deferred day 1 profit or loss (802,398) 2,972,123 2,169,725Gain (loss) on foreign transactions (285,403) (2,017,519) (2,302,922)Allowance for loan losses 2,435,671 (1,302,610) 1,133,061Lease 22,742 (22,742) -Withdrawal of sales transaction (817,468) - (817,468)Available-for-sale financial assets (67,784,890) (5,891,084) (73,675,974)Accrued income (19,132,134) (4,091,708) (23,223,842)Accrued expenses 110,847,814 (11,245,336) 99,602,478Credit risk-adjusted (272,928) (71,309) (344,237)Property and equipment,intangible assets (29,538,586) (2,275,356) (31,813,942)

Meritz Securities Co., Ltd. and its subsidiariesNotes to the consolidated financial statementsDecember 31, 2016 and 2015
67
35. Income taxes (cont’d)
Year ended December 31, 2016Beginningbalance (*) Changes Ending balance
Subsidiaries and associates ₩ 20,968,559 ₩ (2,603,805) ₩ 18,364,754Allowance accounts 6,865,566 3,320,692 10,186,258Retirement pension premium (8,180,804) (2,294,701) (10,475,505)Defined benefit liabilities 10,230,193 2,873,461 13,103,654Treasury stock 250,425,472 - 250,425,472Others 3,457,506 19,293,706 22,751,212
₩ 265,016,056 ₩ 5,151,724 ₩ 270,167,780
Deferred income tax liabilities ₩ 63,868,867 ₩ 1,160,514 ₩ 65,029,381
Year ended December 31, 2015Beginningbalance (*) Changes Ending balance
Financial lease receivables ₩ (17,963,986) ₩ 5,909,959 ₩ (12,054,027)Gain (loss) on valuation of financial liabilities held-for-trading 1,263,872 (88,879) 1,174,993Gain (loss) on valuation of financial assets held-for-trading (6,161,818) 8,080,548 1,918,730Gain (loss) on valuation of financial assets designated atfair value through profit or loss (6,059) (2,420,310) (2,426,369)
Gain (loss) on valuation of derivatives-combinedsecurities sold 641,545 (1,171,671) (530,126)
Gain (loss) on valuation of derivatives-combined securities 785,239 575,338 1,360,577Gain (loss) on valuation of derivative instruments 7,805,593 (20,895,159) (13,089,566)Deferred loan fee 5,038,624 5,457,569 10,496,193Deferred day 1 profit or loss (694,617) (107,781) (802,398)Gain (loss) on foreign transactions (96,959) (275,944) (372,903)Allowance for loan losses 3,060,444 (624,773) 2,435,671Lease 31,125 (8,383) 22,742Withdrawal of sales transaction (816,162) (1,306) (817,468)Available-for-sale financial assets (221,798,375) 151,842,452 (69,955,923)Accrued income (26,080,405) 6,948,271 (19,132,134)Accrued expenses 35,775,383 2,165,087 37,940,470Credit risk-adjusted (626,960) 354,032 (272,928)Property and equipment,intangible assets (42,724,690) 13,874,342 (28,850,348)
Subsidiaries and associates 24,888,451 (3,918,263) 20,970,188Allowance accounts 7,314,332 (423,313) 6,891,019Retirement pension premium (5,019,350) (3,161,454) (8,180,804)Defined benefit liabilities 10,953,149 (722,956) 10,230,193Treasury stock 185,964,125 64,461,347 250,425,472Others 18,483,167 (15,024,716) 3,458,451
₩ (19,984,332) ₩ 210,824,037 ₩ 190,839,705
Deferred income tax liabilities ₩ (4,723,232) ₩ 50,715,598 ₩ 45,992,366(*) Beginning temporary difference and deferred income taxes and calculated reflecting the changes in thefinal income tax return, merger, etc.

Meritz Securities Co., Ltd. and its subsidiariesNotes to the consolidated financial statementsDecember 31, 2016 and 2015
68
35. Income taxes (cont’d)
Deferred income tax assets (liabilities) are measured at the average tax rates that are expected to apply in theyear when the related temporary differences are expected to reverse, based on tax rates (and tax laws) thathave been enacted at the reporting date.
36. Earnings per share
The Group presents basic earnings per share attributable to its common stock holders in the statement ofcomprehensive income. Basic earnings per share amounts are calculated by dividing the net profit for theperiod attributable to common stock holders of the parent by the weighted average number of common sharesoutstanding during the period.
The Group presents basic earnings per share attributable to its common stock holders in the statement ofcomprehensive income. Basic earnings per share amounts are calculated by dividing the net profit for theperiod attributable to common stock holders of the parent by the weighted average number of common sharesoutstanding during the period.
Basic earnings per share amounts for the years ended December 31, 2016 and 2015 are as follows (Koreanwon and shares):
Year ended December 31, 2016
Year ended December 31, 2015
Net income attributable to the common stockholder of the parent ₩ 253,846,703,366 ₩ 296,137,002,455
Weighted average number of common stockoutstanding (*) 453,502,028 364,583,142
Basic earnings per share 560 812
(*) Weighted average number of common stock outstanding is calculated by deducting treasury stock fromtotal issued stock.
Diluted earnings per share amounts for the years ended December 31, 2016 and 2015 are as follows (Koreanwon):
Year ended December 31, 2016
Year ended December 31, 2015
Net income attributable to common stock holders ₩ 253,846,703,366 ₩ 296,137,002,455Diluted net income attributable to common stock holders 253,846,703,366 296,137,002,455Weighted average number of common stock
outstanding (*) 453,502,028 364,602,520Diluted earnings per share 560 812
(*) The amount is calculated by reflecting the dilution effect. The number of potential common stock of thecurrent and prior period which has dilution effect is 19,378 and 26,963 shares for the years endedDecember 31, 2016 and 2015, respectively.

Meritz Securities Co., Ltd. and its subsidiariesNotes to the consolidated financial statementsDecember 31, 2016 and 2015
69
37. Assets and liabilities denominated in foreign currencies
Significant assets and liabilities denominated in foreign currencies as of December 31, 2016 and 2015 are asfollows (Korean won in thousands or USD, JPY, EUR, HKD, NOK, CNH, AUD, GBP, CAD, MYR, BRL):
December 31, 2016
CurrencyAmount in foreigncurrency in unit
Korean wonequivalent
Assets in foreign currencies:
Cash and due from banks USD 26,402,834 ₩ 31,907,825EUR 624,756 791,941HKD 349,417 54,450JPY 224,410,840 2,326,714GBP 252,191 373,286CNH 9,189 1,592AUD 35,675 31,110NOK 2 1CAD 44,655 39,954MYR 21,300 5,741BRL 21,577 8,013
Financial assets at fair valuethrough profit or loss USD 95,886,924 115,879,348
JPY 100,000,000 1,036,810Available-for-sale financial assets USD 8,880,000 10,731,480Investments in associates USD - -Other assets USD 44,729,089 54,055,104
JPY 168,329 1,745₩ 217,245,114
Liabilities in foreign currency:
Deposits USD 5,395,809 ₩ 6,520,836Financial liabilities at fair valuethrough profit or loss USD 48,454,106 58,556,787
Other liabilities USD 19,600,000 23,686,600₩ 88,764,223
December 31, 2015
CurrencyAmount in foreigncurrency in unit
Korean wonequivalent
Assets in foreign currencies:
Cash and due from banks USD 11,438,296 ₩ 13,405,683EUR 280,215 358,824HKD 331,649 50,149JPY 1,714,130 16,662GBP 133 231CNH 549 98AUD 75 64NOK 2 1
Financial assets at fair valuethrough profit or loss USD 831,200 974,166

Meritz Securities Co., Ltd. and its subsidiariesNotes to the consolidated financial statementsDecember 31, 2016 and 2015
70
37. Assets and liabilities denominated in foreign currencies (cont’d)
Investments in associates USD 158,839 186,159Other assets USD 56,000,000 65,632,000
₩ 80,624,037Liabilities in foreign currency:
Deposits USD 91,399 ₩ 107,120Other liabilities USD 36,004,126 42,196,835
₩ 42,303,955
38. Pledged assets
Restricted balances in due from banks as of December 31, 2016 and 2015 are summarized as follows(Korean won in thousands):
CounterpartyOthers
informationDecember 31,
2016December 31,
2015Cash and Deposits:
Restricted due from financialinstitutions KB Bank and
others
Deposits forcheckingaccounts \ 174,500 \ 129,000
Long-term deposits Woori Bank andothers
Pledged forsettlement 2,000,000 2,000,000
Reserve for claims ofcustomers’ deposits
Korea SecuritiesFinanceCorporation(“KSFC”) (*) 38,410,380 37,000,000
Guarantee deposits for loantransaction
Korea SecuritiesDepository andothers 62,101,200 9,059,110
Guarantee deposits fortrading futures and options(brokerage) KRX 37,100,000 38,723,763
Financial asset at fair valuethrough profit or loss:
Reserve for claims ofcustomers’ deposits(Trust) KSFC (*) 270,866,951 295,920,714
Available-for-sale financialassets:
Collective fund for default loss KRX 8,314,005 6,262,079\ 418,967,036 \ 389,094,666
(*) Pursuant to the Law on Capital Market and Financial Investment Services and related regulations, theGroup is required to place a deposit after daily calculation in Korea Securities Finance Corporation(“KSFC”) as a reserve against customers’ deposits for the trading of stocks, derivatives and for otherpurposes. These deposits should exceed the amount which is calculated by deducting cash commissionguarantee from total customers’ deposit.
Details of securities pledged as collateral for operating activities including derivative transactions, loantransactions and borrowings as of the reporting date are as follows (Korean won in thousands):

Meritz Securities Co., Ltd. and its subsidiariesNotes to the consolidated financial statementsDecember 31, 2016 and 2015
71
38. Pledged assets (cont’d)
December 31, 2016
Pledged toDescription ofpledged asset Pledged amount(*) Pledged for
KRX Bonds ₩ 66,616,598Derivativetransaction
KSD & KSFCETF beneficiarycertificate, Stocks,CP, Bonds 2,537,054,577
Lending andborrowingtransactions
KSD and others Bonds 5,639,142,725
Bondsunder repurchaseagreements
KSD Stocks, Bonds 139,087,588Collateral ofborrowings
KSFC and others Bonds 27,274,899 Payment fundRREEF SPEZIAL INVEST GmbH Bonds 1,899,642 Withholdings
₩ 8,411,076,029December 31, 2015
Pledged toDescription ofpledged asset Pledged amount(*) Pledged for
KRX Bonds ₩ 50,546,133Derivativetransaction
KSD & KSFCETF beneficiarycertificate, Stocks,CP, Bonds 950,549,189
Lending andborrowingtransactions
KSD and others Bonds 5,599,768,082
Bondsunder repurchaseagreements
KSFC and others Bonds 25,736,717 Payment fundRREEF SPEZIAL INVEST GmbH Bonds 1,884,010 Withholdings
₩ 6,628,484,131
(*) The amount excludes restricted balances and beneficial interest in trust, calculated from the closing priceof collateral or based on External Credit Assessment Institution’s valuation. The collateral is included inborrowing securities.
39. Guarantees and commitments
Credit line facilitiesThe Group has the following agreements with several banks as of December 31, 2015 (Korean won inthousands, USD):
Agreement Bank Currency Maximum limit Maturity dateIntraday overdraft Woori Bank KRW 10,000,000 2017.09.07
Woori Bank KRW 50,000,000 2017.09.07Hana Bank KRW 10,000,000 2017.10.27
Shinhan Bank KRW 20,000,000 2017.09.05KB Bank KRW 10,000,000 2017.11.24
Overdraft KB Bank KRW 5,000,000 2017.07.07Daegoo Bank KRW 5,000,000 2017.06.29
Note discounted KSFC KRW 170,000,000 2019.10.31
Note discounted KSFC -
Subscriptionamountwithin the limits 2019.10.31
Agency operating funds KSFC KRW 200,000,000 2020.03.02
Agency operating funds (trust) KSFC -Deposit within
operational limits 2020.03.02Financial capital distribution KSFC KRW 150,000,000 2017.03.29Mortgage financing KSFC KRW 400,000,000 2020.04.30

Meritz Securities Co., Ltd. and its subsidiariesNotes to the consolidated financial statementsDecember 31, 2016 and 2015
72
39. Guarantees and commitments (cont’d)
Agreement Bank Currency Maximum limit Maturity dateCall half the day KSFC KRW 200,000,000 2020.03.03Financial bond dealer KSFC KRW 500,000,000 2020.03.31
LawsuitThe Group is involved in 14 lawsuits (plaintiff: 11 cases, defendant: 3 cases) with total claim amounting\29,154 million. The Group provided provisions estimated from previous experience in similar lawsuits
(balance of provisions: \5,825 million) as of December 31, 2015 (Note 20).
Purchase AgreementThe Group’s purchase agreements as of December 31, 2016 and 2015 are as follows (Korean won inthousands):
December 31, 2016Maximum limit Balance
ABCP purchase commitment (*1) \ 294,370,000 \ 294,370,000Conditional loan commitment - -Loan commitment 1,078,990,000 687,723,645Mortgage loan commitment (*2) 1,985,868,000 1,985,868,000
\ 3,359,228,000 \ 2,967,961,645
December 31, 2015Maximum limit Balance
ABCP purchase commitment (*1) \ 116,059,600 \ 116,059,600Conditional loan commitment 72,000,000 72,000,000Loan commitment 802,332,263 517,929,921Mortgage loan commitment (*2) 2,603,859,784 2,603,859,784
\ 3,594,251,647 \ 3,309,849,305(*1) The Group purchased residual commercial papers that are issued but not sold through liquidity-providing
commitments. Liquidity-providing commitment can be exercised when the credit ratings of underlyingassets of commercial papers and financial institute are not below the required rating.
(*2) It is contractual amounts of secured loans executed by the Group according to mortgage loancommitment as of December 31, 2016 and 2015 and mortgage loan commitment between consolidatedentities is excluded.
Details of the Group’s Details of agreement as of December 31, 2016 are as follows (Korean won inthousands):
December 31, 2016Opponent Maximum limit Balance
ABCP purchase commitment
SINCHON BEST 1ST INC.SINCHON BEST 2ND INC.SINCHON BEST 4TH INC. 130,000,000 130,000,000
ILD UP 19TH Co., Ltd. 36,000,000 36,000,000Swallow One Co., Ltd 30,570,000 30,570,000MEEGEREN5 Co., Ltd 22,400,000 22,400,000MS PREMIUM 1ST Co., Ltd. 20,400,000 20,400,000M FUTURE RIO 1ST Co., Ltd. 55,000,000 55,000,000
294,370,000 294,370,000Limit loan Nike, INC 36,500,000 36,500,000
Yoon Jeong-Kyu 31,190,000 14,760,000Oriental Press AssociationCo., Ltd 30,500,000 2,000,000
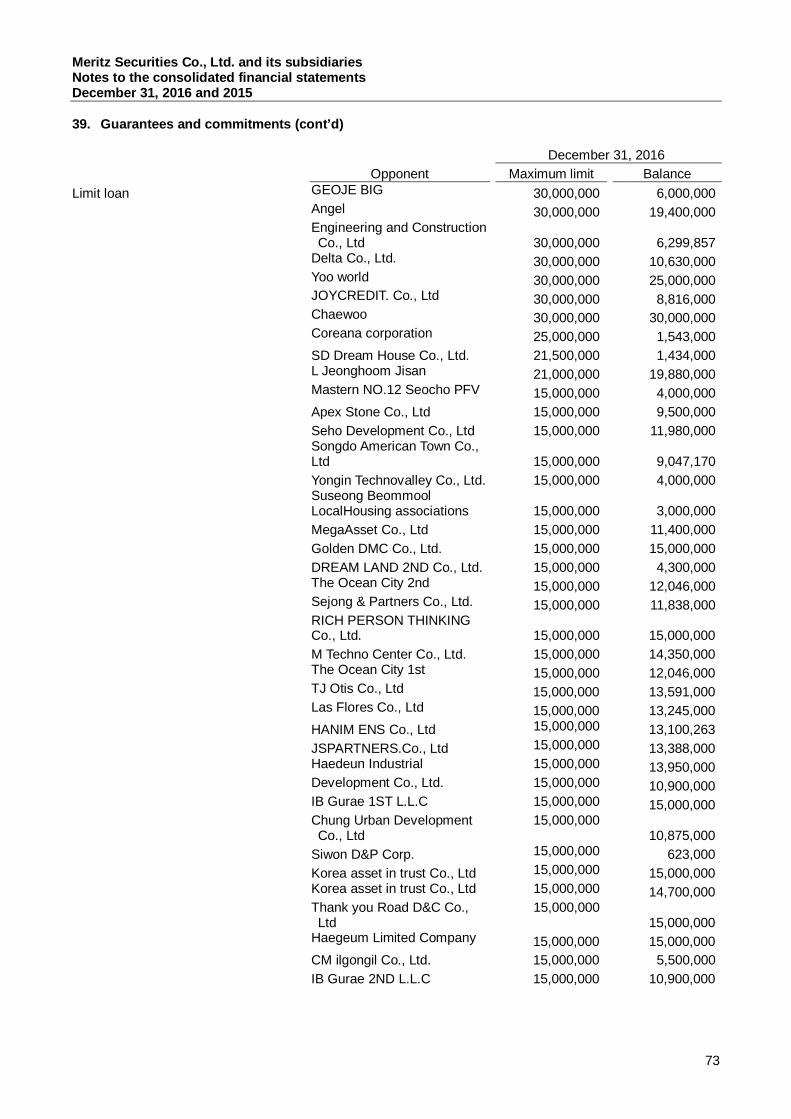
Meritz Securities Co., Ltd. and its subsidiariesNotes to the consolidated financial statementsDecember 31, 2016 and 2015
73
39. Guarantees and commitments (cont’d)
December 31, 2016Opponent Maximum limit Balance
Limit loan GEOJE BIG 30,000,000 6,000,000Angel 30,000,000 19,400,000Engineering and ConstructionCo., Ltd 30,000,000 6,299,857
Delta Co., Ltd. 30,000,000 10,630,000Yoo world 30,000,000 25,000,000JOYCREDIT. Co., Ltd 30,000,000 8,816,000Chaewoo 30,000,000 30,000,000Coreana corporation 25,000,000 1,543,000SD Dream House Co., Ltd. 21,500,000 1,434,000L Jeonghoom Jisan 21,000,000 19,880,000Mastern NO.12 Seocho PFV 15,000,000 4,000,000Apex Stone Co., Ltd 15,000,000 9,500,000Seho Development Co., Ltd 15,000,000 11,980,000Songdo American Town Co.,Ltd 15,000,000 9,047,170Yongin Technovalley Co., Ltd. 15,000,000 4,000,000Suseong BeommoolLocalHousing associations 15,000,000 3,000,000MegaAsset Co., Ltd 15,000,000 11,400,000Golden DMC Co., Ltd. 15,000,000 15,000,000DREAM LAND 2ND Co., Ltd. 15,000,000 4,300,000The Ocean City 2nd 15,000,000 12,046,000Sejong & Partners Co., Ltd. 15,000,000 11,838,000RICH PERSON THINKINGCo., Ltd. 15,000,000 15,000,000M Techno Center Co., Ltd. 15,000,000 14,350,000The Ocean City 1st 15,000,000 12,046,000TJ Otis Co., Ltd 15,000,000 13,591,000Las Flores Co., Ltd 15,000,000 13,245,000HANIM ENS Co., Ltd 15,000,000 13,100,263JSPARTNERS.Co., Ltd 15,000,000 13,388,000Haedeun Industrial 15,000,000 13,950,000Development Co., Ltd. 15,000,000 10,900,000IB Gurae 1ST L.L.C 15,000,000 15,000,000Chung Urban DevelopmentCo., Ltd
15,000,00010,875,000
Siwon D&P Corp. 15,000,000 623,000Korea asset in trust Co., Ltd 15,000,000 15,000,000Korea asset in trust Co., Ltd 15,000,000 14,700,000Thank you Road D&C Co.,Ltd
15,000,00015,000,000
Haegeum Limited Company 15,000,000 15,000,000CM ilgongil Co., Ltd. 15,000,000 5,500,000IB Gurae 2ND L.L.C 15,000,000 10,900,000

Meritz Securities Co., Ltd. and its subsidiariesNotes to the consolidated financial statementsDecember 31, 2016 and 2015
74
39. Guarantees and commitments (cont’d)
December 31, 2016Opponent Maximum limit Balance
Limit loan A1capital 15,000,000 10,000,000WingBridge I&D 14,000,000 9,887,000STOBA C & D Co., Ltd 13,000,000 11,300,000BIFC Hotel Project Co., Ltd. 12,500,000 7,500,000Segora Dikal Co., Ltd. 11,400,000 11,400,000Sungwoon Co., Ltd. 10,000,000 3,100,000Into Industrial 10,000,000 10,000,000M Square PFV Co., Ltd 10,000,000 1,000,000AJU HOTEL SEOKYO 10,000,000 7,453,515WIBESEUTEUPYEONGDONG 1ST INC. 10,000,000 10,000,000
Yeongtong Project Co., Ltd. 10,000,000 5,900,000Hyundai Private Real EstateInvestment Trust 20 10,000,000 10,000,000Ilbeongi building Co., Ltd 9,200,000 6,270,000
HOUSE PAN Co., Ltd. 9,000,000 15,000,000M-Square Gwacheon 3th.Co.,Ltd 9,000,000 1,000,000
UB HOLDING Co., Ltd 9,000,000 9,000,000LHN
8,000,000 4,400,000Kimhae Mugye 2nd Inc.
7,500,000 5,502,000
SEYEONG DREAM 1ST INC. 7,500,000 6,000,000Kimhae Mugye 1st Inc.
7,500,000 5,502,000SIP 1st Inc.
7,500,000 2,800,000
KIMPO M 1ST INC. 7,500,000 4,000,000
SEYEONG DREAM 1ST INC. 7,500,000 6,000,000Wonju Bangok 2nd Inc.
7,500,000 7,067,000Wonju Bangok 1st Inc. 7,500,000 7,067,000LSH 1st 7,500,000 2,800,000Seoil development 5,800,000 1,375,840HAEJIN ASSET LOAN INC. 5,000,000 5,000,000E.M Consulting Co., Ltd 5,000,000 2,387,000BIZ FORE Co., Ltd. 4,900,000 4,020,000YUNIAE LOAN INC. 4,000,000 1,000,000MyungDong Tower Co., Ltd 2,500,000 1,000,000GL-MUNJEONG PFV Co.,Ltd. 2,500,000 2,500,000EOS ASSET MANAGEMENT1ST LOAN INC. 2,500,000 2,500,000AGE DEVELOPMENT KIMPOCo., Ltd. 2,000,000 2,000,000Deokeun City DevelopmentCo., Ltd 1,500,000 450,000
1,078,990,000 687,723,645

Meritz Securities Co., Ltd. and its subsidiariesNotes to the consolidated financial statementsDecember 31, 2016 and 2015
75
39. Guarantees and commitments (cont’d)
December 31, 2016Opponent Maximum limit Balance
Commitment on loan LCT PFV Co., Ltd. 170,000,000 170,000,000Jinseong Housing Company 160,000,000 160,000,000GEUMYANGDIAENDI Co.,Ltd. 111,241,000 111,241,000
M-Square GwaCheon 4th Co.,Ltd 100,500,000 100,500,000
Seyoung KNI Co., Ltd. 100,000,000 100,000,000SAMJUNG Co., Ltd. 90,000,000 90,000,000Las Flores Co., Ltd. 74,172,000 74,172,000Yoo world 66,482,000 66,482,000Green NARAE.INC 66,000,000 66,000,000Haegeum Limited Company 60,500,000 60,500,000M Square PFV Co., Ltd. 60,000,000 60,000,000Seho Development Co,. Ltd. 58,871,000 58,871,000HD 5TH Co., Ltd. 56,300,000 56,300,000UNJEONG CONSTRUCTIONCo., Ltd. 54,100,000 54,100,000Yongin Technovalley Co., Ltd. 50,050,000 50,050,000Angel Engineering andConstruction Co., Ltd. 49,460,000 49,460,000
Gachang Logistics CenterPFV, Inc. 45,500,000 45,500,000
Chungdam enc Co., Ltd 40,174,000 40,174,000Chaewoo coreana corporation 37,800,000 37,800,000EMSEQUEOHYEONGOKCo., Ltd. 36,168,000 36,168,000
CM ilgongil Co., Ltd. 35,000,000 35,000,000SAEHAN Co., Ltd. 35,000,000 35,000,000Samin Co., Ltd 35,000,000 35,000,000EMSQUARE HIGS 1ST Co.,Ltd. 30,000,000 30,000,000
Smart Green Co., Ltd 30,000,000 30,000,000Daim D&C 26,000,000 26,000,000HANIM ENS Co., Ltd. 25,053,000 25,053,000Songdo American Town Co.,Ltd 25,000,000 25,000,000
GOLDEN GRANDHOLDINGS Co., Ltd 23,697,000 23,697,000
HILSEUWAELMISA INC. 23,300,000 23,300,000Misodnc Ltd 22,700,000 22,700,000JESE CONSTRUCTION 21,113,000 21,113,000Moodong 1st area residenceassociation 20,400,000 20,400,000
JOONGHYUN CNC & SPC 20,000,000 20,000,000CityGalaxy 18,600,000 18,600,000E.M Consulting. Co., Ltd 17,387,000 17,387,000SGCA 16,900,000 16,900,000

Meritz Securities Co., Ltd. and its subsidiariesNotes to the consolidated financial statementsDecember 31, 2016 and 2015
76
39. Guarantees and commitments (cont’d)
December 31, 2016Opponent Maximum limit Balance
Commitment on loan J&C Partners. Co., Ltd. 15,000,000 15,000,000M-Square Base 1st Inc. 15,000,000 15,000,000CK Corporation 11,500,000 11,500,000TRINY M 9,000,000 9,000,000Sewon InvestmentDevelopment Co., Ltd 8,400,000 8,400,000
DongsanC&D Co., Ltd 8,000,000 8,000,000SAMIN Co., Ltd 6,500,000 6,500,000
1,985,868,000 1,985,868,000\ 3,359,228,000 \ 2,967,961,645
The Group’s securities received as deposit held on behalf of clients as of December 31, 2016 and 2015 are asfollows (Korean won in thousands):
December 31,2016
December 31,2015
Securities received as deposit:
Consigner \ 12,948,098,272 \ 11,856,776,779Savers 4,063,541 4,653,084Beneficiary 4,724,960,895 4,380,497,873
\ 17,677,122,708 \ 16,241,927,736
Securities loaned:
Stock \ 78,548,118 \ 5,406,774Securities borrowed: Stock 138,825,063 67,833,269 Government & local bonds 322,328,457 99,510,751
\ 461,153,520 \ 167,344,020
Written-off loan \ 107,813,882 \ 48,624,141
Endorsed bills \ 135,000,000 \ 80,000,000
40. Related party disclosures
Significant related parties for the year ended December 31, 2016 are as follows.Company
Parent company Meritz Financial Group Inc.Subsidiaries Eugene Separate Taxation High-Yield PE No. 2
Eugene Separate Taxation High-Yield PE No. 7Kiwoom Separate Taxation High-Yield No. 2Daishin Separate Taxation High-Yield Private Investment Trust No. 2Sparx Separate Taxation High-Yield No. 1Capstone Private Mbs Real Estate Investment Trust No. 2Capstone Private Mbs Real Estate Investment Trust No. 3Smart-S 6th Securitization SpecialtySmart-S 8th Securitization SpecialtySmart-S 10th Securitization SpecialtyMeritz Securitization Specialty Co., Ltd.

Meritz Securities Co., Ltd. and its subsidiariesNotes to the consolidated financial statementsDecember 31, 2016 and 2015
77
40. Related party disclosures (cont’d)
CompanySubsidiaries M Square Gyeyang 1st
M Square Gyeyang 2nd
M Square Sungsu 1st
M Square Pyeongchon 1st
M Square Dongcheon 1st
MJD 1st
Daegu SGNew Commons 1st
Haeundae Project 1st
Haeundae Project 2nd
M Square Shihung 1st
Sungbok 1st
M Square Osan 1st
DM 1st
M Square Sangbong 2nd
M Square Woodong 1st
M Square DadamM Square Yangsan 1st
Sanbon Master plaza 1st
M Square Jochon1st
M Square Gunsan 1st
Yongin Sungbok 2nd
Aberlour 1st
Smart Lake 1st
Dongdaemun H 1st
Nice Penta 1st
MDS 1st
AM 1st
SMK 1st
SMK 2nd
Smart R&D 1st
UPS 1st
Highest Ocean 1st
M Square Sagik 1st
M Square Chungju 1st
M Square Base 1st
Smart Dongcheon 1st
Smart Penta 1st
Real BenefitM Square Mia 2nd
Smart Sanghyun 1st
Yongin Sungbok 1st
Smartup 1st
Smartup 2nd
Smartup 3rd
CD Two 1st

Meritz Securities Co., Ltd. and its subsidiariesNotes to the consolidated financial statementsDecember 31, 2016 and 2015
78
40. Related party disclosures (cont’d)
CompanySubsidiaries SLT 1st
Genius 1st
Msquare Mia third, Co., Ltd. (*1)Msquare Mia fourth, Co., Ltd. (*1)B Lake First Co., Ltd. (*1)MJ Sangmi First Co., Ltd. (*1)Apple SG Co., Ltd. (*1)DSM 3rd Co., Ltd. (*1)Yongjuksg Co., Ltd. (*1)AM3 Co., Ltd. (*1)Yongin Seongbok 4th Co., Ltd. (*1)Dujeong SG Co., Ltd. (*1)SL The Ocean 1st Co., Ltd. (*1)Haeundae SG Co., Ltd. (*1)Msquare Mia the first, Co., Ltd. (*1)H Society 3rd Inc. (*1)WE BEST Cheongdam 1st Co., Ltd. (*1)N.H.M.A 1 Co., Ltd. (*1)Doojung H.S 1 Co., Ltd. (*1)MSM 1ST (*1)Genius 2th Co., Ltd. (*1)Msquare Myungji Co., Ltd. (*1)Yeksam Trinity 1st Co., Ltd. (*1)M SQUARE SONGJEONG (*1)SMART CHUNGDAM 1ST Co., Ltd. (*1)MBR Co., Ltd. (*1)AM 4TH INC. (*1)Yongin Sungbok 7th (*1)BK AGE Inc. (*1)Chams Fild Oh Kid Co., Ltd. (*1)M QUEENS 1ST Inc. (*1)TH 1st Co., Ltd. (*1)H SOCIETY M (*1)SLT MISA (*1)WONJU SG (*1)MDMA 1ST Co., Ltd. (*1)My Best 1st (*1)Msquare Shihung 1st Co., Ltd. (*1)M square Sujeong (*1)RREEF SPEZIAL INVEST GmbH trust of securities
contractG New Jump Short-Term Bond Investment Trust 1

Meritz Securities Co., Ltd. and its subsidiariesNotes to the consolidated financial statementsDecember 31, 2016 and 2015
79
40. Related party disclosures (cont’d)
Company
Associates Saengbo Wootoo Shinyoung Housing CR-Reit Co., Ltd. II (*2)
Globalone Private IPO Investment Trust #1 (*4)MPLUS Private Real Estate Investment Trust #4 (*4)Pureun Partners Fund (*4)Csquared Merry Private Investment Trust 1st (*4)Bros IPO Investment Private Trust 1st (*4)Human Investment Trust (*4)Aion Private Investment Trust 1st (*4)Kiwoom Milestone Europe Professional Private Real EstateInvestment Trust3 (*4)
Bestars Samo Property No.8 Investment Inc.(*4)Platform Partners active mezzanine private equityinvestment trust No.2 (*4)
Airplane fund 5 (*4)Airplane fund 6 (*4)High Yield Plus Investment Trust 3rd (*4)High Yield Plus Investment Trust 4th (*4)East Spring High Yield 2nd (*4)
Other related parties (*3) Meritz Fire & Marine Insurance Co., Ltd.Meritz Asset Management Co., Ltd.Meritz Financial Information Service Co., Ltd.Meritz Business Service Co., Ltd.Meritz Capital Co., Ltd.Meritz Real Estate Asset Management Co., Ltd.Mertiz Vietnam Security Investment TrustEugene High Yield Private Investment Trust 1stMeritz DM Investment Trust on Special Asset 1st
PT.MERITZ KORINDO INSURANCEMeritz Private Offering Property 6th
Meritz Korea Security Investment Trust CIMeritz Korea Investment Trust on BondBNK High Yield Investment 1stHyundai High-Yield Private Trust 11th
Meritz Korea smallcap Securities Investment trusts CIMeritz Korea Private Investment Trust 6thMeritz Global Healthcare High-Yield Trust on Securities 1st (CI)Meritz Auto 1st Securitization Specialty Co., Ltd.Meritz Auto 2nd Securitization Specialty Co., Ltd.Meritz Auto 3rd Securitization Specialty Co., Ltd.Meritz Auto Fourth Securitization Specialty CompanyMeritz Auto Fifth Securitization Specialty CompanyMeritz Asia Frontier Private InvestmentMeritz China Security Investment CI

Meritz Securities Co., Ltd. and its subsidiariesNotes to the consolidated financial statementsDecember 31, 2016 and 2015
80
40. Related party disclosures (cont’d)
(*1) The entities are additional subsidiaries for the year ended December 31, 2016. Meanwhile, during thisyear, MGS 1st and four others (liquidation), Gold digger equity MMT (trust termination), China AsiaInvestment & Consulting Ltd. (sale), Eugene Separate Taxation High-Yield PE No.1 (decline in ratio ofshareholding) were excluded from subsidiaries.
(*2) Related parties with shares in subsidiaries.(*3) By selling shares of China Asia Investment & Consulting Ltd., Cabiroth Investment Consulting (Shanghai)Co., Ltd. owned by this subsidiary was excluded from affiliated companies.(*4) Classified as joint enterprise due to consent of the participants of the company’s important decision-making body(*5) Meritz Financial Group’s subsidiary entities.
Significant transactions with related parties for the years ended December 31, 2016 and 2015 aresummarized as follows (Korean won in thousands):
Year ended December 31, 2016 Year ended December 31, 2015Company Income Expense Income Expense
Parentcompany Meritz Financial Group \ 5,147 \ 8,496,841 \ 5,725 \ 4,653,767
OthersMeritz Fire & Marine insurance Co., Ltd. 2,771,534 10,773,184 6,471,889 18,360,779Meritz AssetManagement - 2,221 - -
BNK High YieldInvestment 1st 1,005,402 - - 126,027
Meritz Financial Information ServiceCo., Ltd.(before RitzPartners) - 23,480 - 39,362
Meritz BusinessService Co., Ltd. - 1,657,399 - 1,420,794
Meritz Capital Co., Ltd. 184,919 2,512,374 213,933 2,452,340Meritz Real EstateAsset ManagementCo., Ltd. 52,920 - - -
Eugene High YieldPrivate
Investment Trust 1st 110,267 - - -Hyundai High-YieldPrivate Trust 11th 29,740 - - -
Hyundai High YieldPrivate Trust 3th 98,474 - - -
\ 4,258,403 \ 23,465,499 \ 6,691,547 \ 27,053,069

Meritz Securities Co., Ltd. and its subsidiariesNotes to the consolidated financial statementsDecember 31, 2016 and 2015
81
40. Related party disclosures (cont’d)
Outstanding balances with related parties as of December 31, 2016 and 2015 are as follows (Korean won inthousands):
Year ended December 31, 2016 Year ended December 31, 2015
Company Assets Liabilities Assets LiabilitiesParent company Meritz Financial Group \ 41,917 \ 21,999,850 \ 63,365 \ 22,707,120
Others Meritz fire & marine insurance Co., Ltd. 231,689 320,461,753 456,703 176,977,433Meritz Financial InformationService Co., Ltd. (formerlyRitz Partners) - 2,080,429 - 1,534,387
Meritz Business Service Co.,Ltd. - 1,784,733 - 1,519,917
Meritz Capital Co., Ltd. 15,044,334 29,554,811 34,169,178 27,764,647Meritz Real Estate AssetManagement Co., Ltd. - 36,540 - -Mertiz VietnamSecurity Investment Trust 7,824,313 - - -Meritz Korea SecurityInvestment Trust 1st 23,618,964 - - -BNK High Yield Investment1st 31,312,232 - - -Eugene High Yield PrivateInvestment Trust 1st 23,907,815 - - -Bros IPO InvestmentPrivate Trust 1st 3,196,028 - - -Csquared MerryPrivate Investment Trust 5,315,107 - - -Aion Private Investment Trust1st 3,210,962 - - -East Spring High Yield 2nd 4,889,120 - - -Pureun Partners Fund 3,257,172 - - -High Yield Plus InvestmentTrust 3rd 399,572 - - -High Yield Plus InvestmentTrust 4th 599,096 - - -Hyundai High-Yield PrivateTrust 11th 999,860 - - -Human Investment Trust 3,260,015 - - -
\ 127,108,196 \ 375,918,116 \ 34,689,246 \ 230,503,504
Details of compensation paid to key management personnel are shown below. The key managementpersonnel is composed of registered directors and non- registered directors who have the authority andresponsibilities of corporate activities (Korean won in thousands):
Year endedDecember 31,
2016
Year endedDecember 31,
2015
Short-term salary \ 27,819,741 \ 32,956,593Severance payment 835,078 1,367,709
\ 28,654,819 \ 34,324,302
41. Statements of cash flows
Cash and cash equivalents in the statements of cash flows as of December 31, 2016 and 2015 aresummarized as follows (Korean won in thousands):
December 31,2016
December 31,2015
Cash \ - \ -
Cash equivalents 657,187,591 546,225,923
\ 657,187,591 \ 546,225,923

Meritz Securities Co., Ltd. and its subsidiariesNotes to the consolidated financial statementsDecember 31, 2016 and 2015
82
41. Statements of cash flows (cont’d)
Significant non-cash transactions for the years ended December 31, 2016 and 2015 are as follows (Koreanwon in thousands):
Year endedDecember 31,
2016
Year endedDecember 31,
2015Gain (loss) on valuation of available-for-sale financial assets \ 11,778,016 \ (77,124,678)Actuarial valuation of the net defined benefit liabilities (48,728) (403,413)Present value discount of loans - 114,281Present value discount of other assets 92,281 173,558Present value discount of withholdings 1,608,671 8,002,619Initial recognition of provisions for restoration costs 372,701 390,304Transferred between advanced payments and intangible assets 429,672 432,110Transferred between available-for-sale financial assets and loans 344,967 -Transferred between RCPS and common stock 2,272,944 -Transferred between provision and allowance for possible loan losses - 515,824Transferred between investment property and tangible assets (156,277) 2,822,078Repayment of borrowing securities - (5,909,288)Transferred between financial lease and property - 95,944
Transferred between priority paid and collective fund for default loss (57) (11,482)Bad debts written off 59,189,741 -Increase in redeemable equity of non-controlling shareholders 1,472,488 3,327,534Increase in non-controlling interests - (9,387,489)Increase in loss on foreign currency transactions (13,381) 13,877Increase(decrease) in equity method capital fluctuation 718,852 -Separation of conversion rights from convertible redeemable preferredstock (664,085) -
Issuance of stock upon merger - 211,996,500Decrease in non-controlling interest by merger - (167,726,608)
Net cash flow in accordance with disposal of subsidiaries for the years ended December 31, 2016 and 2015 isas follows (Korean won in thousands):
Year endedDecember 31,
2016
Year endedDecember31,2015
Proceed from disposal \ 120,000 \ -
Cash and cash equivalent in subsidiaries (427,945) (28,158,040)
Net cash flow \ (307,945) \ (28,158,040)
42. Trust accounts
The Group engages in the investment trust services and separately maintains the books of accounts andfinancial statements in connection with the trust operations (the trust accounts) from those of the Groupaccounts in accordance with the Financial Investment Services and Capital Market Act.
Details of the financial information in relation to trust accounts as of December 31, 2016 are as follows(Korean won in thousands):

Meritz Securities Co., Ltd. and its subsidiariesNotes to the consolidated financial statementsDecember 31, 2016 and 2015
83
42. Trust accounts (cont’d)
Specific moneytrust Property trust Total
Cash and due from banks \ 122,492,024 \ - \ 122,492,024
Negotiable instruments 726,878,874 1,106 726,879,980Monetary claims 20,000,000 1,410,356,345 1,430,356,345Real property - - -Other assets 4,483,331 - 4,483,331
\ 873,854,229 \ 1,410,357,451 \ 2,284,211,680
Other liabilities 10,897,432 - 10,897,432Trust and the original 862,956,797 1,410,357,451 2,273,314,248
\ 873,854,229 \ 1,410,357,451 \ 2,284,211,680
Details of transactions with trust accounts as of December 31, 2016 and 2015 are as follows (Korean won inthousands):
December 31,2016
December 31,2015
Fees on trust accounts \ 3,116,893 \ 4,517,970
Accrued fees on trust accounts 1,444,983 1,337,368
43. Classification of financial assets and liabilities
Classification of financial assets and liabilities as of December 31, 2016 and 2015 is as follows (Korean wonin thousands):
December 31, 2016
Financial assetsor liabilities held-
for-trading
Financial assetsor liabilities
designated at fairvalue throughprofit or loss
Available-for-salefinancial assets or
liabilities
Amortized cost ofa financial assets
or liabilities TotalFinancial assets:
Cash and due from banks \ - \ - \ - \ 816,956,145 \ 816,956,145Financial assets held-for-trading 7,468,895,113 - - - 7,468,895,113
Derivative assets 157,372,714 - - - 157,372,714Financial assetsdesignated at fair valuethrough profit or loss
- 425,026,918- -
425,026,918
Available-for-salefinancial assets - - 1,574,562,095 - 1,574,562,095
Loans - - - 5,477,539,160 5,477,539,160CMA - - - 28,009,548 28,009,548Lease - - - 260,006,034 260,006,034Other financial assets - - - 486,515,402 486,515,402
\ 7,626,267,827 \ 425,026,918 \ 1,574,562,095 \ 7,069,026,289 \ 16,694,883,129Financial liabilities:Deposits - - - 3,102,818,820 3,102,818,820Financial liabilities held-for-trading 1,868,617,761 - - - 1,868,617,761
Derivative liabilities 103,156,500 - - - 103,156,500

Meritz Securities Co., Ltd. and its subsidiariesNotes to the consolidated financial statementsDecember 31, 2016 and 2015
84
43. Classification of financial assets and liabilities (cont’d)
December 31, 2016
Financial assetsor liabilities held-
for-trading
Financial assetsor liabilities
designated at fairvalue throughprofit or loss
Available-for-salefinancial assets or
liabilities
Amortized cost ofa financial assets
or liabilities TotalFinancial liabilitiesdesignated at fair valuethrough profit or loss
- 654,429,685- -
654,429,685
Borrowings - - - 8,694,608,873 8,694,608,873Bonds - - - 279,956,420 279,956,420Other financial liabilities - - - 462,861,638 462,861,638
\ 1,971,774,261 \ 654,429,685 \ - \ 12,540,245,751 \ 15,166,449,697Financial assets:
Cash and due from banks \ - \ - \ - \ 646,068,281 \ 646,068,281Financial assets held-for-trading 6,973,250,157 - - - 6,973,250,157
Derivative assets 161,984,010 - - - 161,984,010Financial assets
designated at fair valuethrough profit or loss
- 335,500,669 - - 335,500,669
Available-for-salefinancial assets - - 733,421,016 - 733,421,016
Loans - - - 4,449,846,185 4,449,846,185CMA - - - 54,820,249 54,820,249Lease - - - 471,534,869 471,534,869Other financial assets - - - 304,854,846 304,854,846
\ 7,135,234,167 \ 335,500,669 \ 733,421,016 \ 5,927,124,430 \ 14,131,280,282Financial liabilities:Deposits - - - 3,463,870,841 3,463,870,841Financial liabilities held-for-trading 571,699,111 - - - 571,699,111
Derivative liabilities 134,337,362 - - - 134,337,362Financial liabilitiesdesignated at fair valuethrough profit or loss
- 490,792,826 - - 490,792,826
Borrowings - - - 7,085,058,245 7,085,058,245Bonds - - - 279,898,600 279,898,600Other financial liabilities - - - 457,021,002 457,021,002
\ 706,036,473 \ 490,792,826 \ - \ 11,285,848,688 \ 12,482,677,987
44. Fair value of financial assets and liabilities
Fair value means a price that a market participant receives by selling an asset or pays by transferring aliability in an ordinary transaction on the date of transaction. Fair value measurement estimates the price inthe ordinary transaction between the market participants, who sell the asset and transfer the liability, at anactive market on the date of transaction. The Group calculates the fair values of assets/liabilities by makingthe best use of market values and making the least use of inputs that are not based on the observable marketdata.
Fair values classification:The Group classifies fair value measurements of financial assets or liabilities by reference to the source ofinputs used to derive the fair values. The classification is as follows:

Meritz Securities Co., Ltd. and its subsidiariesNotes to the consolidated financial statementsDecember 31, 2016 and 2015
85
44. Fair value of financial assets and liabilities (cont’d)
Details(Level 1) In case assets or liabilities are measured by quoted prices (unadjusted) in active markets,
fair value of the assets or liabilities is classified as Level 1. The assets of liabilities classified as Level 1 include stock transacted in KRX, ETF, listed option, stock warrant, stock transacted in foreign, etc.
(Level 2) In case assets or liabilities are measured by valuation techniques and all significant inputsare based on the observable market data, fair value of the assets or liabilities is classifiedas Level 2. The assets of liabilities classified as Level 2 include bond, interest rate swap,foreign exchange forward, etc.
(Level 3) In case assets or liabilities are measured by valuation techniques and all significant inputsare based on the no observable market data, fair value of the assets or liabilities isclassified as Level 3. The assets of liabilities classified as Level 3 include unlisted stock,option related over-the-counter securities, DLS, separate deposit from investors, etc.
The Group calculates the fair values of assets/liabilities by using an internal valuation model or receives fairmarket values assessed by independent external appraisers.
Details of the carrying amount and fair value of financial instruments as of December 31, 2016 and 2015 areas follows (Korean won in thousands):
December 31, 2016Fair value
Level 1 Level 2 Level 3 TotalFinancial assets:Financial assets held-for-trading:
Equity securities \ 344,855,784 \ - \ - \ 344,855,784 Debt securities - 6,936,012,372 - 6,936,012,372 Others 188,026,959 - - 188,026,959Derivative assets 9,953,821 123,455,053 23,963,840 157,372,714Financial assets designated
at fair value through profitor loss - 144,498,917 280,528,001 425,026,918
Available-for-sale financialassets:
Equity securities 5,843,940 - 238,645,625 244,489,565 Debt securities - 1,223,771,001 - 1,223,771,001 Others - - 106,301,531 106,301,531
\ 548,680,504 \ 8,427,737,343 \ 649,438,997 \ 9,625,856,844Financial liabilities:Financial liabilities held-for-trading:
Equity securities 190,198,715 - - 190,198,715 Debt securities - 1,677,590,111 - 1,677,590,111 Others 828,935 - - 828,935Derivative liabilities 2,659,166 88,164,497 12,332,836 103,156,499Financial liabilitiesdesignated at fair valuethrough profit or loss - - 654,429,685 654,429,685
\ 193,686,816 \ 1,765,754,608 \ 666,762,521 \ 2,626,203,945(*1) There was no transfer between level 1 and level 2 in 2016 and 2015. The Group recognizes a transfer atthe end of the reporting period when an event or circumstance causing the transfer among fair value levels isincurred.

Meritz Securities Co., Ltd. and its subsidiariesNotes to the consolidated financial statementsDecember 31, 2016 and 2015
86
44. Fair value of financial assets and liabilities (cont’d)
(*2) Because there was no posted price of the same financial product in an active market or fair value couldnot be reliably estimated, the balance of financial instruments measured at cost is \27,803,668 thousand(excluding joint compensation fund for loss incurred from contravention of contracts). Of the financialinstruments measured at cost for the year ended December 31, 2016, \7,515,429 thousand of book
value was eliminated, and in regard to the elimination, \1,482,109 thousand was recognized as a gain orloss on disposal.
December 31, 2015Fair value
Level 1 Level 2 Level 3 TotalFinancial assets:Financial assets held-for-trading:
Equity securities \ 279,550,141 \ - \ - \ 279,550,141 Debt securities - 6,605,762,262 - 6,605,762,262 Others 87,937,755 - - 87,937,755Derivative assets 6,691,703 143,088,248 12,204,059 161,984,010Financial assets designated
at fair value through profitor loss 4,281,009 30,509,447 300,710,213 335,500,669
Available-for-sale financialassets:
Equity securities 51,917,331 - 200,156,068 252,073,399 Debt securities - 390,374,823 - 390,374,823 Others - - 90,972,795 90,972,795
\ 430,377,939 \ 7,169,734,780 \ 604,043,135 \ 8,204,155,854Financial liabilities:Financial liabilities held-for-trading:
Equity securities 79,764,851 - - 79,764,851 Debt securities - 490,643,123 - 490,643,123 Others 1,291,137 - - 1,291,137Derivative liabilities 1,625,479 127,938,207 4,773,675 134,337,361Financial liabilitiesdesignated at fair valuethrough profit or loss - - 490,792,826 490,792,826
\ 82,681,467 \ 618,581,330 \ 495,566,501 \ 1,196,829,298
(*1) There was no transfer between level 1 and level 2 in 2016 and 2015. The Group recognizes a transfer atthe end of the reporting period when an event or circumstance causing the transfer among fair valuelevels is incurred.
(*2) Because there was no posted price of the same financial product in an active market or fair value couldnot be reliably estimated, the balance of financial instruments measured at cost is \10,811,445 thousand(excluding joint compensation fund for loss incurred from contravention of contracts). Of the financialinstruments measured at cost for the year ended December 31, 2015, \13,790,408 thousand of book
value was eliminated, and in regard to the elimination, \6,048,762 thousand was recognized as a gain orloss on disposal.
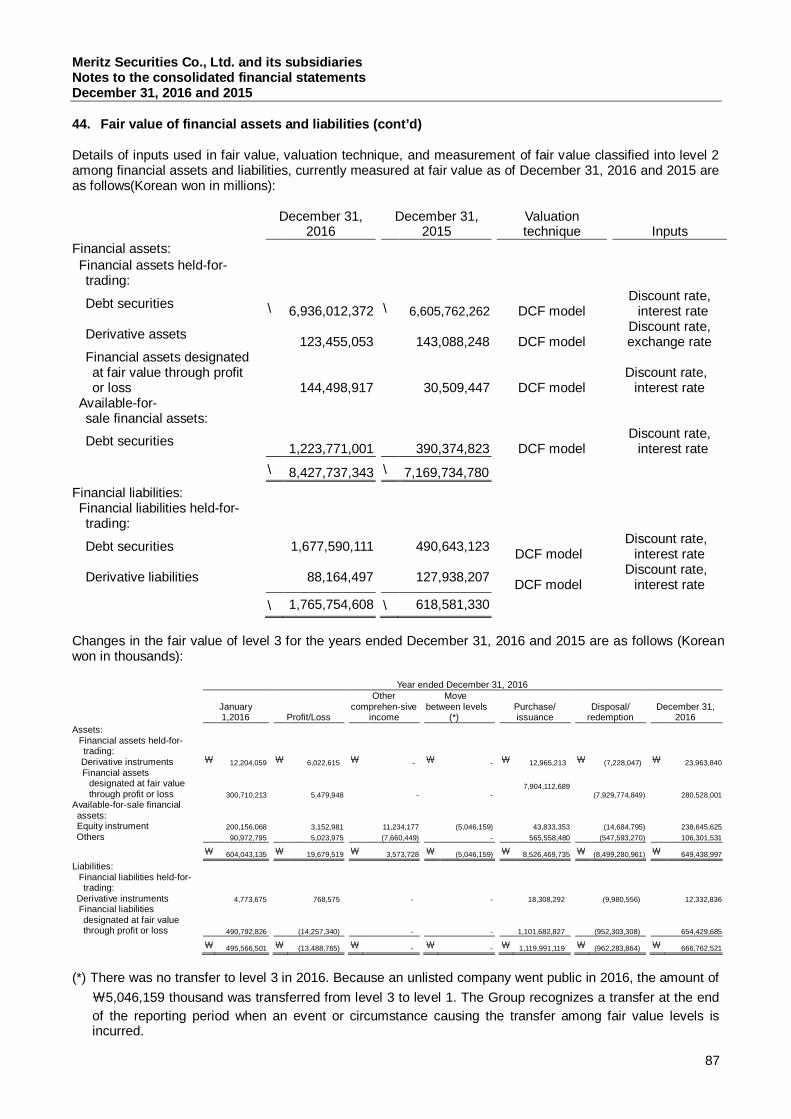
Meritz Securities Co., Ltd. and its subsidiariesNotes to the consolidated financial statementsDecember 31, 2016 and 2015
87
44. Fair value of financial assets and liabilities (cont’d)
Details of inputs used in fair value, valuation technique, and measurement of fair value classified into level 2among financial assets and liabilities, currently measured at fair value as of December 31, 2016 and 2015 areas follows(Korean won in millions):
December 31,2016
December 31,2015
Valuationtechnique Inputs
Financial assets:Financial assets held-for-trading:
Debt securities \ 6,936,012,372 \ 6,605,762,262 DCF modelDiscount rate, interest rate
Derivative assets 123,455,053 143,088,248 DCF modelDiscount rate,exchange rate
Financial assets designatedat fair value through profitor loss 144,498,917 30,509,447 DCF model
Discount rate,interest rate
Available-for-sale financial assets:
Debt securities 1,223,771,001 390,374,823 DCF modelDiscount rate, interest rate
\ 8,427,737,343 \ 7,169,734,780Financial liabilities:Financial liabilities held-for-trading:
Debt securities 1,677,590,111 490,643,123 DCF modelDiscount rate,
interest rate
Derivative liabilities 88,164,497 127,938,207 DCF modelDiscount rate,
interest rate\ 1,765,754,608 \ 618,581,330
Changes in the fair value of level 3 for the years ended December 31, 2016 and 2015 are as follows (Koreanwon in thousands):
Year ended December 31, 2016
January1,2016 Profit/Loss
Othercomprehen-sive
income
Movebetween levels
(*)Purchase/issuance
Disposal/redemption
December 31,2016
Assets:Financial assets held-for-trading:
Derivative instruments ₩ 12,204,059 ₩ 6,022,615 ₩ - ₩ - ₩ 12,965,213 ₩ (7,228,047) ₩ 23,963,840Financial assets
designated at fair valuethrough profit or loss 300,710,213 5,479,948 - -
7,904,112,689(7,929,774,849) 280,528,001
Available-for-sale financialassets:Equity instrument 200,156,068 3,152,981 11,234,177 (5,046,159) 43,833,353 (14,684,795) 238,645,625
Others 90,972,795 5,023,975 (7,660,449) - 565,558,480 (547,593,270) 106,301,531
₩ 604,043,135 ₩ 19,679,519 ₩ 3,573,728 ₩ (5,046,159) ₩ 8,526,469,735 ₩ (8,499,280,961) ₩ 649,438,997
Liabilities:Financial liabilities held-for-trading:
Derivative instruments 4,773,675 768,575 - - 18,308,292 (9,980,556) 12,332,836Financial liabilitiesdesignated at fair valuethrough profit or loss 490,792,826 (14,257,340) - - 1,101,682,827 (952,303,308) 654,429,685
₩ 495,566,501 ₩ (13,488,765) ₩ - ₩ - ₩ 1,119,991,119 ₩ (962,283,864) ₩ 666,762,521
(*) There was no transfer to level 3 in 2016. Because an unlisted company went public in 2016, the amount of₩5,046,159 thousand was transferred from level 3 to level 1. The Group recognizes a transfer at the endof the reporting period when an event or circumstance causing the transfer among fair value levels isincurred.

Meritz Securities Co., Ltd. and its subsidiariesNotes to the consolidated financial statementsDecember 31, 2016 and 2015
88
44. Fair value of financial assets and liabilities (cont’d)
Year ended December 31, 2015
January 1,2015 Profit/LossOther comprehen-
sive income Purchase/issuanceDisposal/
redemptionDecember 31,
2015Assets:
Financial assets held-for-trading:
Derivative instruments ₩ 4,890,269 ₩ 4,870,824 ₩ - ₩ 8,997,488 ₩ (6,554,522) ₩ 12,204,059Financial assets
designated at fair valuethrough profit or loss 154,013,123 3,609,512 - 8,116,334,446 (7,973,246,868) 300,710,213
Available-for-sale financialassets:Equity instrument 261,872,604 8,808,362 652,932 25,720,921 (96,898,751) 200,156,068
Others 72,520,064 198,872 (131,808) 99,664,799 (81,279,132) 90,972,795₩ 493,296,060 ₩ 17,487,570 ₩ 521,124 ₩ 8,250,717,654 ₩ (8,157,979,273) ₩ 604,043,135
Liabilities:Financial liabilities held-for-trading:
Derivative instruments 2,117,002 (1,890,405) - 2,900,097 (2,133,829) 4,773,675Financial liabilitiesdesignated at fair valuethrough profit or loss 320,323,756 (6,463,822) - 813,937,168 (649,931,920) 490,792,826
₩ 322,440,758 ₩ (8,354,227) ₩ - ₩ 816,837,265 ₩ (652,065,749) ₩ 495,566,501
(*) There was no transfer to level 3 and from level 3 to level 1 in 2015. The Group recognizes a transfer at theend of the reporting period when an event or circumstance causing the transfer among fair value levels isincurred.
Of the changes in the fair value of the financial assets that were measured at fair value and classified as level3 in fair value hierarchy, current profits or losses in 2016 and 2015 were recognized as follows (Korean won inthousands):
December 31,2016 December 31, 2015Profit and loss forthe current term
Gain and losson valuation
Profit and loss forthe current term
Gain and loss onvaluation
Assets:Financial assets held-for-trading:Derivative instruments ₩ 6,022,615 ₩ 8,638,965 ₩ 4,870,824 ₩ 2,914,797Financial assets designatedat fair value through profit orloss
5,479,948 1,650,136 3,609,512 143,588
Available-for-sale financialassets:
Equity instruments 3,152,981 (344,967) 8,808,362 - Others 5,023,975 (293) 198,872 (21)
19,679,519 9,943,841 17,487,570 3,058,364Liabilities:
Financial liabilities held-for-trading:Derivative instruments 768,575 1,748,711 (1,890,405) (1,870,881)
Financial liabilities designatedat fair value through profit orloss
(14,257,340) (8,087,588) (6,463,822) (407,462)
(13,488,765) (6,338,877) (8,354,227) (2,278,343)₩ 6,190,754 ₩ 3,604,964 ₩ 9,133,343 ₩ 780,021

Meritz Securities Co., Ltd. and its subsidiariesNotes to the consolidated financial statementsDecember 31, 2016 and 2015
89
44. Fair value of financial assets and liabilities (cont’d)
Details of fair value, valuation technique, and inputs used to develop those measurements classified into level3 assets and liabilities disclosure but not measured at fair value as at December 31, 2016 are as follows(Korean won in millions):
December 31, 2015
Fair value Valuation technique InputsSignificant
unobservable inputs RangeSensitivity of theinput to fair value
Financial assets:
Financial assetsheld for-trading ₩ 23,963,840
FDM,Binomial model,
Black Scholes model,Monte-CarloSimulation
Reduced Form Model
Risk free rate,dividend rate,discount rate,
volatility,probability default
Recovery rateVolatility
0%~100% 3.24% ~50.00%
Fair value increaseddue to theincrease in recovery rateFair value increaseddue to the increasein volatility.
Financial assetsdesignated atfair valuethrough profitor loss
280,528,001
Monte-CarloSimulation,
Cox,Ross and Rubinstein
Model
Risk free rate,dividend ratediscount ratestock price
VolatilityCorrelation
17.44% ~ 29.48% 0.27 ~ 0.70
Fair value decreaseddue to the increase involatilityFair value decreaseddue to the increase incorrelation
Available-for-sale financialassets
344,947,155
DCF, Past deal method,
Cost method -
Growth rateDiscount rate
0% ~ 1% 4.94% ~ 18.01%
Fair value increaseddue to the increase in growth rateFair value decreaseddue to the increase indiscount rate
₩ 649,438,996
Financial liabilities:
Financialliabilities held-for-trading
12,332,836
Binomial modelMonte-CarloSimulation,
Hull&White 1 factor
Risk free rate,dividend rate,discount rate, stock price
Volatility8.97% ~ 50.00%
Fair valuedecreased due to theincrease involatility
Financialliabilitiesdesignated atfair valuethrough profit orloss
654,429,685
Monte-Carlo Simulation, Re
duced form,Hull&White 1 zfactorBlack-Scholes Model
Risk free rate,dividend ratediscount rate,
probability default,
Recovery rateVolatility
Correlation
0% ~ 100% 11.98% ~ 41.21%
0.27 ~ 0.9472
Fair value increaseddue to the increase i
n recovery rateFair value increased
or decreased due tothe increase incorrelationFair value increaseddue to the increasedin correlation
₩ 666,762,521

Meritz Securities Co., Ltd. and its subsidiariesNotes to the consolidated financial statementsDecember 31, 2016 and 2015
90
44. Fair value of financial assets and liabilities (cont’d)
Based on changes in fair values of financial assets according to changes in unobservable input variables byusing statistics method, the sensitivity analysis of financial assets is conducted by dividing into favorablechanges and unfavorable changes. If fair value is influenced by more than 2 input variables, the fair value iscalculated on the basis of the most favorable or the most unfavorable amount. As of December 31, 2016, theresult of sensitivity analysis according to changes in input variables by financial asset is as follows (Koreanwon in thousands):
Computation effect of volatility Favorable
changeUnfavorable
changeAssets:Financial assets held for-trading
Adjustment of 10% in unobservableinputs (volatility, recovery rate) ₩ 4,122,942 ₩ (2,757,331)
Financial assets designated atfair value through profit or loss
Adjustment of 10% in unobservableinputs (volatility, recovery rate) 221,793 (281,093)
Available-for-sale financialassets
Adjustment 1% of growth rate,discount rate 31,490,759 (12,654,976)
35,835,494 (15,693,400)Liabilities:
Derivative instruments Adjustment of 10% in unobservableinputs (volatility, recovery rate) 262,632 (238,308)
Financial liabilities designatedat fair value through profit orloss
Adjustment of 10% in unobservableinputs (volatility, recovery rate) 1,638,166 (1,580,003)
1,900,798 (1,818,311)₩ 37,736,292 ₩ (17,511,711)
The hierarchical fair values of the financial assets, which were not measured at fair value but of which the fairvalues were disclosed, in the statements of financial position as of December 31, 2016 are as follows (Koreanwon in thousands):
December 31, 2016
Book valueFair value
Level 1 Level 2 Level 3 TotalFinancial assets:
Cash and due from banks(*) \ 816,956,145 \
-\ 816,956,145 \ - \ 816,956,145
Loans receivable 5,477,539,160 - - 5,511,969,128 5,511,969,128CMA (*) 28,009,548 - - 28,009,548 28,009,548Lease 260,006,034 - - 269,207,468 269,207,468Other financial assets (*) 486,515,402 - - 486,515,402 486,515,402
\ 7,069,026,289 \ - \ 816,956,145 \ 6,295,701,546 \ 7,112,657,691Financial liabilities:
Deposits (*) \ 3,102,818,820 \ - \ 3,102,818,820 \ - \ 3,102,818,820
Borrowings (*) 8,694,608,873 - 8,694,608,873 - 8,694,608,873Bonds 279,956,420 - 291,508,242 - 291,508,242Other financial liabilities (*) 462,861,638 - - 462,861,638 462,861,638
\ 12,540,245,751 \ - \ 12,088,935,935 \ 462,861,638 \ 12,551,797,573

Meritz Securities Co., Ltd. and its subsidiariesNotes to the consolidated financial statementsDecember 31, 2016 and 2015
91
44. Fair value of financial assets and liabilities (cont’d)
The hierarchical fair values of the financial assets, which were not measured at fair value but of which the fairvalues were disclosed, in the statements of financial position as of December 31, 2015 are as follows (Koreanwon in thousands):
December 31, 2015
Book valueFair value
Level 1 Level 2 Level 3 TotalFinancial assets:
Cash and due from banks(*) \ 646,068,281 \ - \ 646,068,281 \ - \ 646,068,281
Loans receivable 4,449,846,185 - - 4,506,142,642 4,506,142,642CMA (*) 54,820,249 - - 54,820,249 54,820,249Lease 471,534,869 - - 495,303,504 495,303,504Other financial assets (*) 304,854,846 - - 304,854,846 304,854,846
\ 5,927,124,430 \ - \ 646,068,281 \ 5,361,121,241 \ 6,007,189,522Financial liabilities:
Deposits (*) \ 3,463,870,841 \ - \ 3,463,870,841 \ - \ 3,463,870,841Borrowings (*) 7,085,058,245 - 7,085,058,245 - 7,085,058,245Bonds 279,898,600 - 296,360,098 - 296,360,098Other financial liabilities (*) 457,021,002 - - 457,021,002 457,021,002
\ 11,285,848,688 \ - \ 10,845,289,184 \ 457,021,002 \ 11,302,310,186
(*) Because book value was considered to be a reasonable proxy to fair value, book value was disclosed asfair value.
The following valuation methods and input variables were applied to the financial assets classified as level 2of the financial assets, which were not measured at fair value but of which the fair values were disclosed, inthe statements of financial position as of December 31, 2015 (Korean won in thousands).
December 31,2016
December 31,2016
Valuationmethod Input variables
Financial liabilities:Debentures (*) ₩ 291,508,242 ₩ 296,360,098 DCF method Discount rate
(*) If book value is deemed a reasonable proxy to fair value, book value is disclosed as fair value. Therefore,valuation methods or input variables are not disclosed.
The following valuation methods, input variables and unobservable input were applied to the financial assetsclassified as level 3 of the financial assets, which were not measured at fair value but of which the fair valueswere disclosed, in the statements of financial position as of December 31, 2016 (Korean won in thousands).
December 31,2016
December 31,2015
Valuationmethod Input variable
Unobservableinput variable
Financial assets (*):
Loans ₩ 5,511,969,128 ₩ 4,506,142,642 DCF method Discount rate Credit riskLease assets 269,207,468 495,303,504 DCF method Discount rate Credit risk
₩ 5,781,176,596 ₩ 5,001,446,146
(*) If book value is deemed a reasonable proxy to fair value, book value is disclosed as fair value. Therefore,valuation methods or input variables are not disclosed.

Meritz Securities Co., Ltd. and its subsidiariesNotes to the consolidated financial statementsDecember 31, 2016 and 2015
92
45. Offsetting of financial assets and liabilities
Details of financial assets subject to offsetting, enforceable master netting arrangements and similaragreements as of December 31, 2016 and 2015 are as follows (Korean won in thousands):
December 31, 2016
Gross amounts ofrecognized
financialinstruments
Gross amounts ofrecognized
financialinstruments set offin the statement offinancial position
Net amounts offinancial assetspresented in the
statement offinancial position
Related amounts not set off in thestatement of financial position (*)
Enforceable masternetting
arrangementCash collateral
received Net amountAssets:
Derivatives ₩ 159,835,362 ₩ - ₩ 159,835,362 ₩ (77,808,067) ₩ - ₩ 82,027,295 Loans Repurchase agreement 745,000,000 - 745,000,000 - (745,000,000) -
Other assetsReceivable spotexchange 46,659,606 - 46,659,606 (46,650,520) - 9,086
Difference of uncollected 14,354,596 (13,493,185) 861,411 - - 861,411Receivable from
proprietary trading 326,630,084 (86,372,416) 240,257,668 - - 240,257,668Receivable from trading
on consignment 283,620,195 (195,697,357) 87,922,838 - - 87,922,838₩ 1,576,099,843 ₩ (295,562,958) ₩ 1,280,536,885 ₩ (124,458,587) ₩ (745,000,000) ₩ 411,078,298
Liabilities:Derivatives ₩ 103,204,882 ₩ - ₩ 103,204,882 ₩ (77,808,067) ₩ (10,009,021) ₩ 15,387,794Securities sold 1,868,617,761 - 1,868,617,761 - (1,868,617,761) -
BorrowingsRepurchase agreement 5,351,618,732 - 5,351,618,732 - (5,351,618,732) -
Other liabilities Payable spot exchange 46,667,720 - 46,667,720 (46,650,520) - 17,200 Difference of unsettled 17,365,199 (13,493,185) 3,872,014 - - 3,872,014
Accounts payable forproprietary trading 103,829,610 (86,372,416) 17,457,194 - - 17,457,194
Accounts payable fortrading on consignment 282,683,538 (195,697,357) 86,986,181 - - 86,986,181
₩ 7,773,987,442 ₩ (295,562,958) ₩ 7,478,424,484 ₩ (124,458,587) ₩ (7,230,245,514) ₩ 123,720,383
December 31, 2015
Gross amounts ofrecognized
financialinstruments
Gross amounts ofrecognized
financialinstruments set offin the statement offinancial position
Net amounts offinancial assetspresented in the
statement offinancial position
Related amounts not set off in thestatement of financial position (*)
Enforceable masternetting
arrangementCash collateral
received Net amountAssets:
Derivatives ₩ 161,586,455 ₩ - ₩ 161,586,455 ₩ (112,591,726) ₩ - ₩ 48,994,729 Loans Repurchase agreement 432,200,000 - 432,200,000 - (432,200,000) -
Other assetsReceivable spotexchange 107,821,400 - 107,821,400 (107,806,800) - 14,600
Difference of uncollected 14,655,475 (12,250,921) 2,404,554 - - 2,404,554Receivable on proprietary
trading 88,831,167 (60,643,043) 28,188,124 - - 28,188,124Receivable on trading on
consignment 252,344,857 (174,683,442) 77,661,415 - - 77,661,415₩ 1,057,439,354 ₩ (247,577,406) ₩ 809,861,948 ₩ (220,398,526) ₩ (432,200,000) ₩ 157,263,422
Liabilities:Derivatives ₩ 134,504,017 ₩ - ₩ 134,504,017 ₩ (112,591,726) ₩ (11,230,135) ₩ 10,682,156Securities sold 571,699,111 - 571,699,111 - (571,699,111) -
BorrowingsRepurchase agreement 5,324,808,245 - 5,324,808,245 - (5,324,808,245) -
Other liabilities Payable spot exchange 107,822,900 - 107,822,900 (107,806,800) - 16,100 Difference of unsettled 13,966,988 (12,250,921) 1,716,067 - - 1,716,067
Accounts payable forproprietary trading 70,269,921 (60,643,043) 9,626,878 - - 9,626,878
Accounts payable fortrading on consignment 250,794,290 (174,683,442) 76,110,848 - - 76,110,848
₩ 6,473,865,472 ₩ (247,577,406) ₩ 6,226,288,066 ₩ (220,398,526) ₩ (5,907,737,491) ₩ 98,152,049
(*) The rights to offset exist only in case of default and others. Accordingly, the amounts are not offset in thestatement of financial position as they do not meet the criteria for offsetting.

Meritz Securities Co., Ltd. and its subsidiariesNotes to the consolidated financial statementsDecember 31, 2016 and 2015
93
46. Deferred day 1 profit or loss
Changes in deferred day 1 profit or loss, for the years ended December 31, 2016 and 2015 are as follows(Korean won in millions):
Year ended December 31, 2016 Year ended December 31, 2015Assets Liabilities Assets Liabilities
Beginning \ (693,715) \ (21,685) \ (665,276) \ (29,343)Increase 2,466,790 429,894 221,693 (55,927)Decrease 126,102 (5,317) (250,132) 63,585
Ending \ 1,899,177 \ 402,892 \ (693,715) \ (21,685)
47. Risk management
The Group is exposed to credit risk, liquidity risk, market risk and operational risk of its financial instruments.Risk management is the basic activities to effectively use the Group’s limited capital under the rapidlychanging financial circumstances. The ultimate goal of risk management is to maximize the Group’sshareholder value while minimizing the sudden fluctuation of its income through a proper balance betweenrisks and returns.
The basic policies for managing risk are as follows:
(i) Set the limits and comply with them for each risk, and strike a balance between risk and return.(ii) When a conflict exists between risk and return, the Group should seek to increase return without-
exceeding the risk limits.(iii) Spread the risks to prevent them from being concentrated in specific areas.(iv) Analyze the effect of various market fluctuations on parts of or entire portfolio on a regular basis.(v) Separate risk management segment, operating segment, and segment that deals with trade-
confirmation and payments to maintain independence from one another.
Risk management committee is responsible for setting maximum permissible limits for each risk, and the riskmanagement conference is responsible for checking compliance with the limit and the risk levels.
Risk management committee is the top decision-making body within the Board of Directors for riskmanagement. Through risk management committee, the Group establishes the control system of riskmanagement from top management to operating segment. However, risk management conference is asubordinate committee for risk management and practices risk management by business unit in detail.
Risk management center consists of risk management team and credit risk analysis team. Risk managementteam manages market risk, liquidity risk, operational risk and capital and credit risk analysis team to performcredit risk analysis of counterparties and assessment on loan contracts. Risk management center deals withmonitoring of risk position, risk measurement, identification of assets exposed to risk and forecasting changeof risk position.
Credit riskCredit risk is the risk that the Group will incur a loss because its customers or counterparties fail to dischargetheir contractual obligations. Credit risk arises from on-balance and off-balance accounts including loans,financial guarantees, securities and derivatives. The purpose to manage the credit risk is to control therelevant losses upon the counterparties’ default, for a certain period, within the allowable range.
Credit risk management is performed by the risk management committee and judging committee, riskmanagement conference and credit risk management department which is a subordinate organization of therisk management center.
Risk management committee establishes risk management strategy through the periodical report on assetmanagement and portfolio construction. Judging committee is delegated to deal with all the matters. Creditrisk management department, which is separated from operating segments, manages the overall credit risk ofthe Group and operates the credit risk management system.

Meritz Securities Co., Ltd. and its subsidiariesNotes to the consolidated financial statementsDecember 31, 2016 and 2015
94
47. Risk management (cont’d)
Credit risk management
LoansPerforming comprehensive analysis on economic environments and changes, the Group reduces creditconcentration by setting credit limits on same counterparties to ensure asset quality.
The Group measures and manages risk indicators of each operating segment. Also, the Group regularlyexamines the counterparties whose credit ratings are likely to be degraded.
As to large credit, the Group examines the customer’s credit and adequacy of credit evaluation as part of thesubsequent management process. In addition, the Group conducts focused examinations on industries orgroups with increasing credit risks and performs sample inspections on small loans.
Debt securitiesThe Group controls credit exposure of debt securities through either the agencies’ ratings of creditworthinessor its own rating. The debt securities are held as a means of maintaining resources in order to keep high creditrating as well as to meet the demands of financing.
Risk reduction policy
CollateralThe Group manages various policies and practices so as to reduce credit risks. Acquisition of collateral onloans is conventional method to reduce credit, and collaterals for secured loans are mainly deposits andfinancial instruments such as debt securities or equity securities. Collaterals on financial assets other thanloans are decided by the attributes of the financial instruments. Debt securities are usually unsecured; assetbacked securities or other similar instruments are secured by financial instrument portfolio.
DerivativesConsidering the notional exposure, the amount exposed to credit risk remains within small limits. Creditexposure is managed and controlled through limiting the counterparty risks such as latent exposure to marketfluctuations.
Master netting arrangementThe Group limits credit exposure by entering into a ‘master netting agreement’ with the counterparties in thehigh volume trading. Generally such an agreement is settled by gross, and therefore assets and liabilitiesrelated to it are not offset in the financial statements of position. However, in case the remaining contracts aresettled net at the end because default occurs, credit risk related to profitable contracts decreases. Due to theimpact of individual trades, total credit exposure can vary substantially in the short term.

Meritz Securities Co., Ltd. and its subsidiariesNotes to the consolidated financial statementsDecember 31, 2016 and 2015
95
47. Risk management (cont’d)
Maximum exposure to credit riskThe maximum exposure to credit risk as of December 31, 2016 and 2015 is as follows. The Group does notconsider risk reduction obtained by collaterals or other. Equity securities in the trading financial assets andavailable-for-sale financial assets are excluded. (Korean won in thousands):
December 31,2016
December 31,2015
On balance accounts:
Cash and due from banks ₩ 816,956,144 ₩ 646,068,280
Financial assets held-for-trading 6,936,012,372 6,605,762,262 Derivative instruments 128,206,238 146,196,291 Financial assets designated at fair value
through profit or loss 149,044,902 35,499,839
Available-for-sale financial assets 1,223,771,001 390,374,823 Loans 5,560,775,858 4,594,570,403 CMA management assets 28,100,000 55,000,000 Lease assets 264,854,951 477,850,702 Other financial assets 490,370,676 309,878,256
₩ 15,598,092,142 ₩13,261,200,856
Off balance accounts:
Commitments on loans ₩ 2,673,591,645 ₩ 3,261,264,354
ABCP Purchase agreement 294,370,000 116,059,600
₩ 2,967,961,645 ₩ 3,377,323,954
Impaired or neither past due nor impaired loans among loans, cash management account assets, financelease assets and other financial assets as of December 31, 2016 and 2015 are as follow (Korean won inthousands):
December 31, 2016Neither past due
nor impairedPast due but not
impaired Impaired TotalLoans:
Call loans ₩ 60 ₩ - ₩ - ₩ 60
Repurchase agreement 745,000,000 - - 745,000,000Granting of credit 605,566,566 96,841 - 605,663,407Loans to employees 2,875,974 - 68,673 2,944,647
Loans 3,744,716,533 3,211,509 96,019,974 3,843,948,016
Short-term note trading 72,300,000 - - 72,300,000
Loans purchased 118,170,349 - 52,364,954 170,535,303
Privately-placed bonds 114,326,636 - 1,658,000 115,984,636
Advance for customers 33,793 - 4,365,996 4,399,789Allowance for possible loan
losses (22,323,657) (53,612) (46,731,814) (69,109,083)
5,380,666,254 3,254,738 107,745,783 5,491,666,775CMA management assets:
Notes discounted 28,100,000 - - 28,100,000Allowance for possible loan
losses (90,452) - - (90,452)
28,009,548 - - 28,009,548

Meritz Securities Co., Ltd. and its subsidiariesNotes to the consolidated financial statementsDecember 31, 2016 and 2015
96
47. Risk management (cont’d)
December 31, 2016Neither past due
nor impairedPast due but not
impaired Impaired TotalLease assets:
Financial lease receivables 241,253,435 19,601,256 4,000,260 264,854,951Allowance for possible loan
losses (2,331,053) (205,827) (2,312,037) (4,848,917)
238,922,382 19,395,429 1,688,223 260,006,034
Other financial assets (*):Other financial assets 486,828,921 - 3,541,755 490,370,676Allowance for possible loan
losses (125,275) - (3,428,250) (3,553,525)
486,703,646 - 113,505 486,817,151₩ 6,134,301,830 ₩ 22,650,167 ₩ 109,547,511 ₩ 6,266,499,508
December 31, 2015Neither past due
nor impairedPast due but not
impaired Impaired TotalLoans:
Call loans ₩ 1,424,923 ₩ - ₩ - ₩ 1,424,923
Repurchase agreement 432,200,000 - - 432,200,000Granting of credit 438,078,848 164,626 - 438,243,474Loans to employees 3,078,501 - 69,746 3,148,247
Loans 3,275,871,114 9,847,763 161,200,549 3,446,919,426
Short-term note trading 178,300,000 - - 178,300,000
Loans purchased 24,924,809 - 11,672,273 36,597,082
Privately-placed bonds 48,673,997 - 1,752,000 50,425,997
Advance for customers 44,693 - 7,266,561 7,311,254Allowance for possible loan
losses(22,417,148) (171,971) (111,590,143) (134,179,262)
4,380,179,737 9,840,418 70,370,986 4,460,391,141CMA management assets:
Notes discounted 55,000,000 - - 55,000,000Allowance for possible loan
losses (179,751) - - (179,751)
54,820,249 - - 54,820,249
Lease assets:Financial lease receivables 460,460,159 13,215,143 4,175,400 477,850,702
Allowance for possible loanlosses (4,756,787) (200,746) (1,358,300) (6,315,833)
₩ 455,703,372 13,014,397 2,817,100 471,534,869
Other financial assets (*):Other financial assets 305,044,531 - 4,833,726 309,878,257
Allowance for possible loanlosses (151,138) - (4,545,534) (4,696,672)
304,893,393 - 288,192 305,181,585
₩ 5,195,596,751 ₩ 22,854,815 ₩ 73,476,278 ₩ 5,291,927,844
(*) Items that do not meet the definition of loans and receivables were excluded from other assets.

Meritz Securities Co., Ltd. and its subsidiariesNotes to the consolidated financial statementsDecember 31, 2016 and 2015
97
47. Risk management (cont’d)
Loans that are past due but not impaired as of December 31, 2016 and 2015 consist of the following (Koreanwon in thousands):
December 31,2016
December 31,2015
Less than 30 days ₩ 19,888,411 ₩ 12,919,53630 to 60 days 2,030,460 3,143,73560 to 90 days 990,735 7,164,261
Impaired loansThe details of impaired loans as of December 31, 2016 and 2015 are as follow (Korean won in thousands) :
December 31, 2016 December 31, 2015
Loans
Allowance forpossible loan
losses Loans
Allowance forpossible loan
lossesLoans:
Loans to employees ₩ 68,673 ₩ 68,673 ₩ 69,746 ₩ 69,746Loans 96,019,974 33,280,815 161,200,549 96,337,771Loans purchased 52,364,954 7,358,330 11,672,273 6,264,064Privately-placed bonds 1,658,000 1,658,000 1,752,000 1,652,000Advance for customers 4,365,996 4,365,996 7,266,561 7,266,561
154,477,597 46,731,814 181,961,129 111,590,142Lease assets 4,000,260 2,312,037 4,175,400 1,358,300Other financial assets:Receivables from trading onconsignment 628,672 628,672 1,141,295 1,141,295
Other receivables 2,329,541 2,216,036 2,703,397 2,415,206Accrued income 583,542 583,542 989,034 989,034
3,541,755 3,428,250 4,833,726 4,545,535
₩ 162,019,612 ₩ 52,472,101 ₩ 190,970,255 ₩ 117,493,977
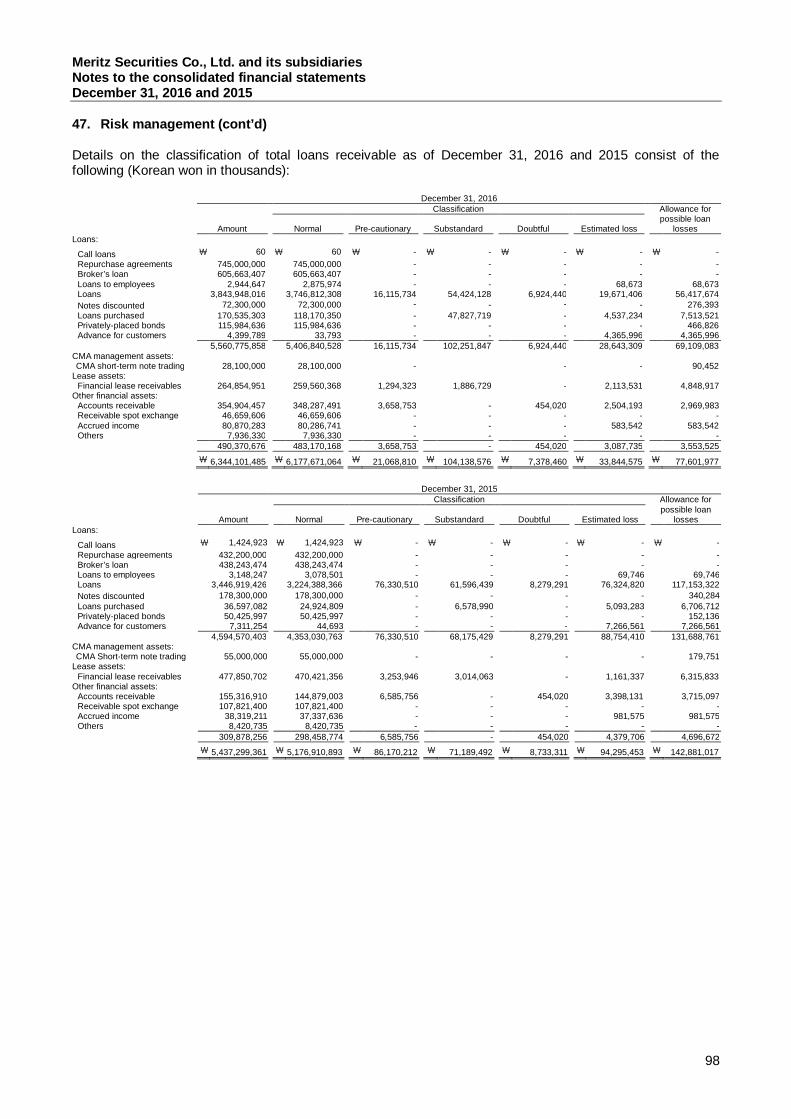
Meritz Securities Co., Ltd. and its subsidiariesNotes to the consolidated financial statementsDecember 31, 2016 and 2015
98
47. Risk management (cont’d)
Details on the classification of total loans receivable as of December 31, 2016 and 2015 consist of thefollowing (Korean won in thousands):
December 31, 2016
Amount
Classification Allowance forpossible loan
lossesNormal Pre-cautionary Substandard Doubtful Estimated lossLoans:
Call loans ₩ 60 ₩ 60 ₩ - ₩ - ₩ - ₩ - ₩ -Repurchase agreements 745,000,000 745,000,000 - - - - -Broker’s loan 605,663,407 605,663,407 - - - - -Loans to employees 2,944,647 2,875,974 - - - 68,673 68,673Loans 3,843,948,016 3,746,812,308 16,115,734 54,424,128 6,924,440 19,671,406 56,417,674Notes discounted 72,300,000 72,300,000 - - - - 276,393Loans purchased 170,535,303 118,170,350 - 47,827,719 - 4,537,234 7,513,521Privately-placed bonds 115,984,636 115,984,636 - - - - 466,826Advance for customers 4,399,789 33,793 - - - 4,365,996 4,365,996
5,560,775,858 5,406,840,528 16,115,734 102,251,847 6,924,440 28,643,309 69,109,083CMA management assets:CMA short-term note trading 28,100,000 28,100,000 - - - 90,452
Lease assets:Financial lease receivables 264,854,951 259,560,368 1,294,323 1,886,729 - 2,113,531 4,848,917
Other financial assets:Accounts receivable 354,904,457 348,287,491 3,658,753 - 454,020 2,504,193 2,969,983Receivable spot exchange 46,659,606 46,659,606 - - - - -Accrued income 80,870,283 80,286,741 - - - 583,542 583,542Others 7,936,330 7,936,330 - - - - -
490,370,676 483,170,168 3,658,753 - 454,020 3,087,735 3,553,525₩ 6,344,101,485 ₩ 6,177,671,064 ₩ 21,068,810 ₩ 104,138,576 ₩ 7,378,460 ₩ 33,844,575 ₩ 77,601,977
December 31, 2015
Amount
Classification Allowance forpossible loan
lossesNormal Pre-cautionary Substandard Doubtful Estimated lossLoans:
Call loans ₩ 1,424,923 ₩ 1,424,923 ₩ - ₩ - ₩ - ₩ - ₩ -Repurchase agreements 432,200,000 432,200,000 - - - - -Broker’s loan 438,243,474 438,243,474 - - - - -Loans to employees 3,148,247 3,078,501 - - - 69,746 69,746Loans 3,446,919,426 3,224,388,366 76,330,510 61,596,439 8,279,291 76,324,820 117,153,322Notes discounted 178,300,000 178,300,000 - - - - 340,284Loans purchased 36,597,082 24,924,809 - 6,578,990 - 5,093,283 6,706,712Privately-placed bonds 50,425,997 50,425,997 - - - - 152,136Advance for customers 7,311,254 44,693 - - - 7,266,561 7,266,561
4,594,570,403 4,353,030,763 76,330,510 68,175,429 8,279,291 88,754,410 131,688,761CMA management assets:CMA Short-term note trading 55,000,000 55,000,000 - - - - 179,751
Lease assets:Financial lease receivables 477,850,702 470,421,356 3,253,946 3,014,063 - 1,161,337 6,315,833
Other financial assets:Accounts receivable 155,316,910 144,879,003 6,585,756 - 454,020 3,398,131 3,715,097Receivable spot exchange 107,821,400 107,821,400 - - - - -Accrued income 38,319,211 37,337,636 - - - 981,575 981,575Others 8,420,735 8,420,735 - - - - -
309,878,256 298,458,774 6,585,756 - 454,020 4,379,706 4,696,672₩ 5,437,299,361 ₩ 5,176,910,893 ₩ 86,170,212 ₩ 71,189,492 ₩ 8,733,311 ₩ 94,295,453 ₩ 142,881,017

Meritz Securities Co., Ltd. and its subsidiariesNotes to the consolidated financial statementsDecember 31, 2016 and 2015
99
47. Risk management (cont’d)
Details on the classification of due from banks and debt securities on credit soundness as of December 31,2016 and 2015 consist of the following (Korean won in thousands):
December 31, 2016 December 31, 2015
Financial assetsheld-for-trading (*)
Financial assetsdesignated at fair
value through profitor loss (*)
Available-for-salefinancial assets (*)
Financial assetsheld-for-trading (*)
Financial assetsdesignated at fair
value through profitor loss (*)
Available-for-salefinancial assets (*)
Bonds:Government, public andspecific bonds \ 4,505,173,023 \ - \ 789,926,488 ₩ 4,158,346,399 \ - \ 285,785,432
AAA 1,726,957,148 - 10,053,273 1,541,074,181 - -AA- to AA+ 190,712,347 144,527,532 61,143,560 402,661,002 30,681,530 -A- to A+ 49,381,525 - 22,354,810 5,781,926 - 7,208,903Less A- 144,355,050 - 40,640,176 106,570,288 - 39,174,879Unrated - - 114,069,414 - - 37,508,187
6,616,579,093 144,527,532 1,038,187,721 6,214,433,796 30,681,530 369,677,401
CP:A1 226,648,278 - - 178,182,131 - -A2 to A3 92,785,001 - 185,126,297 213,146,335 - 20,014,696Less B - - 456,983 - - 682,726
319,433,279 - 185,583,280 391,328,466 - 20,697,422\ 6,936,012,372 \ 144,527,532 \ 1,223,771,001 \ 6,605,762,262 \ 30,681,530 \ 390,374,823
(*) The Group surveyed the credit soundness on debt securities in financial assets. In case of other financialassets, credit risk is not taken into consideration or rating of credit soundness cannot be calculated due totheir nature of business.
Details of industrial credit exposure classified by Korean Standard Industrial Classification as of December 31,2016 and 2015 consist of the following (Korean won in thousands):
December 31, 2016Finance and
insurance ManufacturingWholesale and
retailing Construction Others Total
Cash and due from banks ₩ 816,956,144 ₩ - ₩ - ₩ - ₩ - ₩ 816,956,144Financial assets held-for-
trading (*) 2,103,324,451 882,926 - 1,300,944 4,830,504,051 6,936,012,372Derivative instrumentassets (*) 128,206,238 - - - - 128,206,238
Financial assetsdesignated at fair valuethrough profit or loss (*) 4,517,369 10,005,250 - - 134,522,283 149,044,902
Available-for-sale financialassets (*) 365,830,484 31,165,474 - 8,679,569 818,095,474 1,223,771,001
Loans 1,356,461,628 74,004,977 44,682,848 819,594,164 3,266,032,241 5,560,775,858CMA 25,000,000 - - - 3,100,000 28,100,000Lease assets 33,021,499 37,598,710 29,317,004 10,488,775 154,428,963 264,854,951Other financial assets 287,778,685 - - - 202,591,991 490,370,676
₩ 5,121,096,498 ₩ 153,657,337 ₩ 73,999,852 ₩ 840,063,452 ₩ 9,409,275,003 ₩ 15,598,092,142
December 31, 2015Finance and
insurance ManufacturingWholesale and
retailing Construction Others Total
Cash and due from banks ₩ 646,068,280 ₩ - ₩ - ₩ - ₩ - ₩ 646,068,280Financial assets held-for-
trading (*) 2,005,508,994 1,423,633 - - 4,598,829,635 6,605,762,262Derivative instrumentassets (*) 146,196,291 - - - - 146,196,291
Financial assetsdesignated at fair valuethrough profit or loss (*) 4,818,308 9,971,169 - - 20,710,362 35,499,839
Available-for-sale financialassets (*) 62,956,682 - - 579,143 326,838,998 390,374,823
Loans 1,304,763,986 59,134,768 23,934,675 1,397,451,466 1,809,285,508 4,594,570,403CMA 25,000,000 15,000,000 - - 15,000,000 55,000,000Lease assets 66,097,400 70,192,553 53,668,107 22,526,054 265,366,588 477,850,702Other financial assets 138,414,078 - - - 171,500,641 309,914,719
₩ 4,399,824,019 ₩ 155,722,123 ₩ 77,602,782 ₩ 1,420,556,663 ₩ 7,207,531,732 ₩ 13,261,237,319
(*) The Group excluded financial assets below, since they had no significant credit risk.

Meritz Securities Co., Ltd. and its subsidiariesNotes to the consolidated financial statementsDecember 31, 2016 and 2015
100
47. Risk management (cont’d)
Ø Financial assets held-for-trading: Stocks and collective investment securitiesØ Financial assets designated at fair value through profit and loss: Reserve for claims of customers’
deposits (trust)Ø Financial assets available-for-sale: Stocks, collective investment securities, foreign currency securities
and othersØ Derivative financial assets: Options purchased of stock
Liquidity risk
Procedures of the liquidity risk managementThe Group defines liquidity risk as the possibility of incurring losses due to a temporary shortage in fundscaused by a maturity mismatch or an unexpected capital outlay. Liquidity risk soars when funding rates rise, orassets are sold below a normal price, or a good investment opportunity is missed. The purpose to manageliquidity risk is to early identify the potential risk factors upon raising and operating the Group’s funds and toobtain a stable revenue base maintaining an appropriate level of the Group’s liquidity by systematicallymanaging the risk.
The targets of liquidity risk management are all assets and liabilities outstanding in the Group’s statements offinancial position.
The Group’s principles of the liquidity risk management are as follows:
Ø Set up and comply with tolerable limits to liquidity risk.Ø Prepare insufficient liquidity by forecasting cash requirements regularly.Ø Establish an emergency plan against a liquidity crisis to prepare for an unexpected liquidity risk.Ø Evaluate and manage the effect of a large amount of money that is loaned out, invested, or procured on
liquidity risks.

Meritz Securities Co., Ltd. and its subsidiariesNotes to the consolidated financial statementsDecember 31, 2016 and 2015
101
47. Risk management (cont’d)
The residual maturity of non-derivative financial instruments as of December 31, 2016 and 2015 consists ofthe following (Korean won in thousands):
December 31, 2016
Within 1 week
After 1 week ~but no later than 1
month
After 1 month~but no later than 3
months
After 3 months~but no later than 6
months
After 6 months~but no later than
1 year After 1 year TotalAssets:
Cash and due from banks ₩ 757,204,065 ₩ 99,571 ₩ 56,089,000 ₩ - ₩ 848,271 ₩ 2,715,237 ₩ 816,956,144
Financial assets held-for-trading 4,776,828,867 455,582,323 57,353,520 99,800,030 162,171,821 1,384,275,811 6,936,012,372
Financial assets designatedat fair value through profitor loss 49,089,827 - - - - 99,955,075 149,044,902
Available-for-sale financialassets (*1) 807,927,467 148,016,594 10,704,175 45,034,883 228,492 211,859,390 1,223,771,001
Loans (*2) 771,609,483 198,062,370 998,760,423 360,334,129 1,133,552,709 2,098,456,744 5,560,775,858CMA - 3,100,000 15,000,000 - 10,000,000 - 28,100,000Lease assets 1,778,759 11,401,574 26,271,131 36,628,264 64,936,053 123,839,170 264,854,951Other financial assets (*3) 407,423,776 - 47,294,677 861,376 3,441,778 31,349,069 490,370,676
₩ 7,571,862,244 816,262,432 1,211,472,926 542,658,682 1,375,179,124 3,952,450,496 15,469,885,904Liabilities:
Deposits (*3) ₩ 459,256,882 35,073,968 192,208,353 215,651,604 1,184,136,365 1,023,701,940 3,110,029,112
Financial liabilities held-for-trading 155,860 383,731,816 215,425,088 17,816,884 1,106,709,388 144,778,725 1,868,617,761
Financial liabilitiesdesignated at fair valuethrough profit or loss 6,803,235 70,940,020 240,559,721 65,990,707 177,049,851 93,593,895 654,937,429
Borrowings 4,521,430,390 781,580,940 1,141,600,976 203,100,000 522,000,000 1,524,896,567 8,694,608,873Debentures - - 10,100,000 - 30,000,000 240,000,000 280,100,000Other financial liabilities 155,777,440 2,871,627 32,999,026 - 188,701,412 82,512,133 462,861,638
₩ 5,143,423,807 ₩ 1,274,198,371 ₩ 1,832,893,164 ₩ 502,559,195 ₩ 3,208,597,016 ₩ 3,109,483,260 ₩ 15,071,154,813
December 31, 2015
Within 1 week
After 1 week ~but no later than 1
month
After 1 month~but no later than 3
months
After 3 months~but no later than 6
months
After 6 months~but no later than
1 year After 1 year TotalAssets:
Cash and due from banks ₩ 643,243,132 ₩ 1,890 ₩ - ₩ - ₩ - ₩ 2,823,258 ₩ 646,068,280
Financial assets held-for-trading 4,636,725,744 440,510,942 17,634,897 145,447,286 205,889,956 1,159,553,437 6,605,762,262
Financial assets designated at fair value through profit or loss 30,681,530 779,922 410,764 - 227,091 3,400,532 35,499,839
Available-for-sale financialassets (*1) 302,189,705 - 579,143 - 29,150,920 58,455,055 390,374,823
Loans (*2) 487,348,808 188,116,684 598,839,940 547,319,354 1,090,606,717 1,682,338,900 4,594,570,403CMA - 10,000,000 15,000,000 20,000,000 10,000,000 - 55,000,000Lease assets 2,879,676 15,506,533 35,778,007 51,390,010 90,677,203 281,619,273 477,850,702Other financial assets (*3) 216,075,493 - 87,786,582 - - 6,016,181 309,878,256
₩ 6,319,144,088 ₩ 654,915,971 ₩ 756,029,333 ₩ 764,156,650 ₩ 1,426,551,887 ₩ 3,194,206,636 ₩ 13,115,004,565Liabilities:
Deposits (*3) ₩ 501,278,477 ₩ 45,993,509 ₩ 217,371,342 ₩ 288,360,754 ₩ 2,318,170,258 ₩ 107,385,614 ₩ 3,478,559,954
Financial liabilities held-for-trading 99,418 10,447,708 2,293,228 8,745,651 521,746,390 28,366,716 571,699,111
Financial liabilities designated at fair value through profit or loss 2,009,175 89,470,150 79,721,930 151,609,672 33,417,975 135,188,932 491,417,834
Borrowings 4,024,930,390 941,916,117 390,819,318 162,800,000 437,500,000 1,127,092,420 7,085,058,245Debentures - - - - - 280,100,000 280,100,000Other financial liabilities 195,276,694 - 232,055,491 - - 29,688,817 457,021,002
₩ 4,723,594,154 ₩ 1,087,827,484 ₩ 922,261,309 ₩ 611,516,077 ₩ 3,310,834,623 ₩ 1,707,822,499 ₩ 12,363,856,146
(*1) Non-marketable equity securities, collective investment securities, foreign currency securities and othersare excluded from available-for-sale financial assets.(*2) Deferred loan fees and present value discount are excluded from loans.(*3) Present value discount of other assets and due from banks are excluded.(*4) Commitments mentioned in Note 39-3 are the probable maximum exposure which the Group might
liquidate according to the contracts in the future. The Group expects that actual payment will be less thanmaximum exposure according to its past transaction experience and the characteristics of thecommitments. It is difficult for the Group to expect actual timing, amount and probability of settlement ofthe commitments.
The marketable non-derivative financial instruments are classified as within one week’s maturity and non-marketable non-derivative financial instruments are classified as contractual maturity.

Meritz Securities Co., Ltd. and its subsidiariesNotes to the consolidated financial statementsDecember 31, 2016 and 2015
102
47. Risk management (cont’d)
The residual maturity of derivative financial instruments as of December 31, 2016 and 2015 consists of thefollowing (Korean won in thousands):
December 31, 2016
Within 1 week
After 1 week~but no later than
1 month
After 1 month~but no later
than3 months
After 3 months~but no later than
6 months
After 6 months~but no later
than1 year After 1 year Total
Exchange-traded derivatives ₩ 75,182 ₩ 56,249 ₩ 332,768 ₩ (811,677) ₩ (75,821) ₩ 7,756,426 ₩ 7,333,127Over-the-counter derivatives:
Interests (204,630) (244,266) (539,343) (260,410) 1,450,121 16,072,582 16,274,054Currency (782,226) (1,549,984) (3,127,767) 1,367,413 23,406,632 168,925 19,482,993Stock - - - - (7,599,197) 20,400,139 12,800,942Credit - - 85,593 - 301,126 - 386,719Others - - 91,013 (462,741) 854,732 (130,361) 352,643
₩ (986,856) ₩ (1,794,250) ₩ (3,490,504) ₩ 644,262 ₩ 18,413,414 ₩ 36,511,285 ₩ 49,297,351₩ (911,674) ₩ (1,738,001) ₩ (3,157,736) ₩ (167,415) ₩ 18,337,593 ₩ 44,267,711 ₩ 56,630,478
December 31, 2015
Within 1 week
After 1 week~but no later than
1 month
After 1 month~but no later
than3 months
After 3 months~but no later than
6 months
After 6 months~but no later
than1 year After 1 year Total
Exchange-traded derivatives ₩ 12,296 ₩ 2,153,718 ₩ (223,642) ₩ (737,141) ₩ (221,670) ₩ 4,109,558 ₩ 5,093,119Over-the-counter derivatives:
Interests 273,257 (369,982) 30,300 (1,026,841) 1,247,509 (1,357,326) (1,203,083)Currency (1,075,600) (1,907,913) (5,687,089) 4,366,823 13,050 22,237,843 17,947,114Stock - - - 965,522 (2,108,024) 3,406,618 2,264,116Credit - - - - - 1,071,624 1,071,624Others 2,085 4,807 28,704 (713,651) 718,994 3,703,988 3,744,927
₩ (800,258) ₩ (2,273,088) ₩ (5,628,085) ₩ 3,591,853 ₩ (128,471) ₩ 29,062,747 ₩ 23,824,698₩ (787,962) ₩ (119,370) ₩ (5,851,727) ₩ 2,854,712 ₩ (350,141) ₩ 33,172,305 ₩ 28,917,817
Market riskMarket risk is the risk that the fair value or future cash flows of financial instruments will fluctuate due to thechanges in market variables such as interest rates, equity prices, and exchange ratios in the market and so on.
The purposes of market risk management are to control the tolerable loss-limit of assets and liabilities arisingfrom the changes in market variables such as interest rates, foreign exchanges and equity prices. The scopeof market risk management is marketable securities which are traded for operating the Group’s properties, netforeign exchange positions, derivatives, other assets and liabilities embedded with market risks and off-balances. Significant market risks are interest rate risk, foreign exchange risk and equity price risk as of thereporting date.
The Group manages and controls the market risk arising from the changes of market variables withinadequate level by measuring and monitoring the risk exposures on a regular basis.
Trading positionsThe trading positions include positions of interest rate, equity price, commodity and foreign exchange held fortrading purpose:
(i) Financial instruments for the purpose of acquiring the differences incurred due to held-for-trading or pricefluctuations
(ii) Financial instruments for the purpose of hedging risks(iii) Financial instruments for the purpose of acquiring arbitrages(iv) Financial instruments for the purpose of acquisition, brokerage, and market-making
The Group’s principles to manage the market risk of its trading positions are to measure its market risk statuson a regular basis and to establish and comply with the various market risk limits. The Group analyzeswhether the return against risk is appropriate by reviewing its profit and risk on a regular basis.

Meritz Securities Co., Ltd. and its subsidiariesNotes to the consolidated financial statementsDecember 31, 2016 and 2015
103
47. Risk management (cont’d)
Value at risk (VaR)Value at Risk (“VaR”) is a primary method that manages and measures the degree of market risks of thetrading portfolio subject to exposure, which estimates the potential loss of the trading portfolio that is notexpected to be exceeded if the current market risk positions were to be held unchanged for one day. TheGroup calculates VaR for a standard 10 days in the 99% confidence level. In addition, to account for themethod’s limited use, a stress test is performed in order to measure the extent of the loss in extreme cases.
The types of Market VaR as of December 31, 2016 and 2015 consist of the following (Korean won inthousands):
December 31,2016 Average Max Min
December 31,2015
Interest rates risk ₩ 5,416,615 ₩ 5,499,350 6,951,226 3,577,558 ₩ 3,190,860Stock price risk 7,653,772 10,471,240 13,491,780 7,653,772 5,355,450Foreign exchange
rates risk 1,500,180 3,088,696 7,135,087 379,448 3,519,675
Total risk ₩ 14,570,567 ₩ 12,065,985
Operational riskOperational risk is the risk of loss arising from systems failure, human error, fraud or external events. Risksrelated to strategy or damaging reputation are excluded but legal or regulatory implications are identified asoperational risks. Operational risk includes non-financial risks related to losses due to internal operationalproblems and due to externalities such as natural disasters and terrorist attacks. Operational risk does nothave a direct correlation with income and the Group needs to mitigate such risk through internal controls andinsurance. The Group measures the operational risk exposures using the approaches suitable to the FinancialInvestment Industry Regulations.
Capital ManagementThe Group evaluates the internal capital adequacy by calculating net capital ratio (“NCR”) in accordance withthe Regulation on Financial Investment Services and detailed enforcement regulations in order to haveadequate capital and comply with supervisory regulation.
NCR as of December 31, 2016 and 2015 consist of the following (Korean won in millions):
December 31,2016
December 31,2015(*1)
I. Net capital for business ₩ 1,252,346 ₩ 1,260,451Net asset amount in consolidatedfinancial statements 1,878,310 1,730,623
Deduction (751,454) (653,982)Add 125,490 183,810II. Total risk amount 323,231 215,271Market risk amount 198,691 130,656Credit risk amount 44,871 24,926Operating risk amount 79,669 59,689III. Surplus capital(I - II) 929,115 1,045,180IV. Regulatory capital required (*2) 134,610 134,610V. NCR(III/IV) 690.23% 776.45%
(*1) As of December 31, 2016, the new regulation was enacted to calculate net capital ratio of theconsolidated financial statements. The net capital ratio as of December 31, 2015, presented for a comparativepurpose was recalculated based on the operating net capital ratios (I/II*100) disclosed in the separatefinancial statements as of December 31, 2015.(*2) Own capital required is calculated as 70% of legal capital (₩192.3 billion).

Meritz Securities Co., Ltd. and its subsidiariesNotes to the consolidated financial statementsDecember 31, 2016 and 2015
104
48. Comprehensive share exchange
By the resolution of the Board of Directors on November 16, 2016, the Company entered into acomprehensive share exchange agreement with Meritz Capital Co., Ltd., where the Company gains 100%ownership in Meritz Capital Co., Ltd. The objective of the comprehensive share exchange is to promoteefficiency and unity of management thereby create synergy effect. This may also enhance corporate valueachievement as well as continuous growth. The resolution on the comprehensive share exchange from theshareholders’ meeting is scheduled on March 24, 2017.
The comprehensive share exchange is a business combination under common control where Meritz CapitalCo., Ltd., the subsidiary of Meritz Financial Group Inc., the controlling company, becomes a wholly-ownedsubsidiary of the Company. Accordingly, the Company plans to account for the comprehensive shareexchange by using book values of assets and liabilities of Meritz Capital Co., Ltd. in the consolidated financialstatements of Meritz Financial Group Inc. The Company also plans to adjust the difference in the book valuesof assets and liabilities and issued share consideration in other components of capital.
49. Approval of the financial statements
The 2016 consolidated financial statements were approved by the Board of Directors on February 8, 2017.