merkus utwente; why, what, etc - universiteit twente · · 2010-10-11• size measurement is...
TRANSCRIPT

1
Particle characterization
WHY – WHAT – HOW – WHERE ?
Henk G. Merkus
Why? (cf. Stonehenge)

2
Why PSD characterization?
• RELATION WITH PRODUCT PROPERTIES
• PROCESS MONITORING/CONTROL
• SIZE MEASUREMENT IS EASIER
RELATION WITH PRODUCT/
PROCESS PROPERTIES
Particle size, um
Geldart fluidization diagram

3
RELATION WITH PRODUCT/
PROCESS PROPERTIES
Typical grade efficiency curves
RELATION WITH PRODUCT
PROPERTIES
Dissolution rate phenacetin
Size fractions
upper to lower
curve:
0.11-0.15 mm
0.15-0.21 mm
0.21-0.30 mm
0.30-0.50 mm
0.50-0.71 mm
4
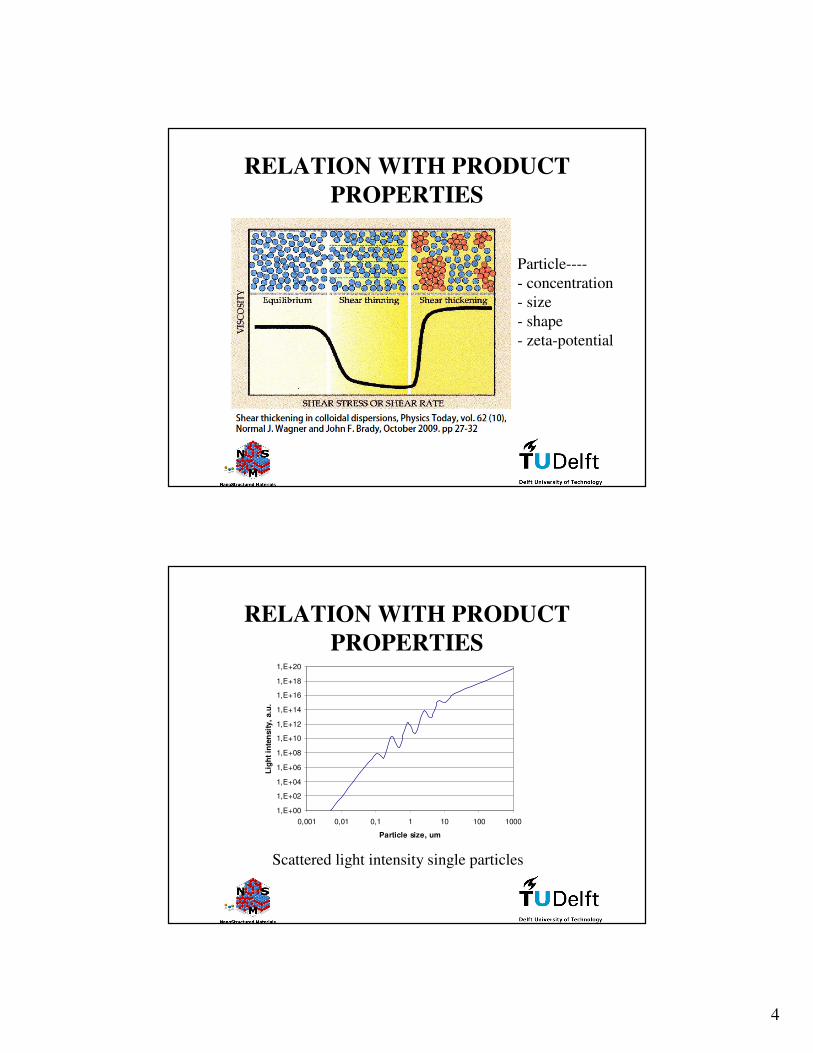
RELATION WITH PRODUCT
PROPERTIES
Particle----
- concentration
- size
- shape
- zeta-potential
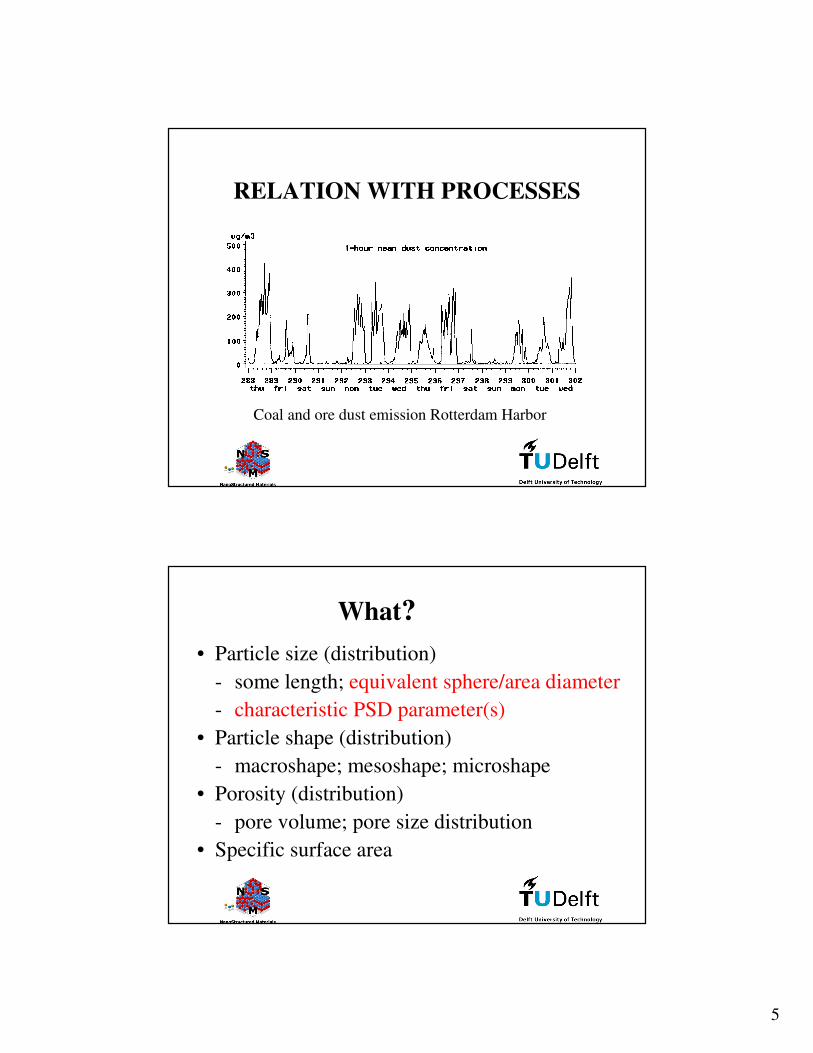
RELATION WITH PRODUCT
PROPERTIES
1,E+00
1,E+02
1,E+04
1,E+06
1,E+08
1,E+10
1,E+12
1,E+14
1,E+16
1,E+18
1,E+20
0,001 0,01 0,1 1 10 100 1000
Particle size, um
Lig
ht
inte
nsit
y,
a.u
.
Scattered light intensity single particles
5
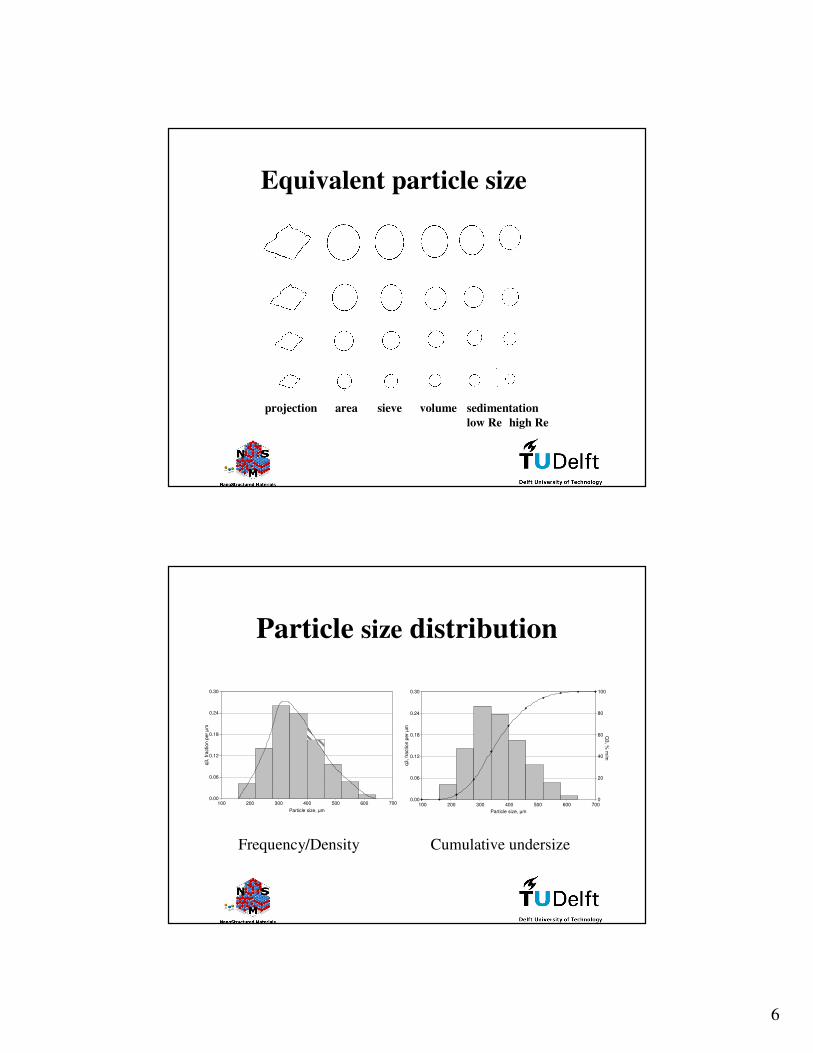
RELATION WITH PROCESSES
Coal and ore dust emission Rotterdam Harbor
What?
• Particle size (distribution)
- some length; equivalent sphere/area diameter
- characteristic PSD parameter(s)
• Particle shape (distribution)
- macroshape; mesoshape; microshape
• Porosity (distribution)
- pore volume; pore size distribution
• Specific surface area
6
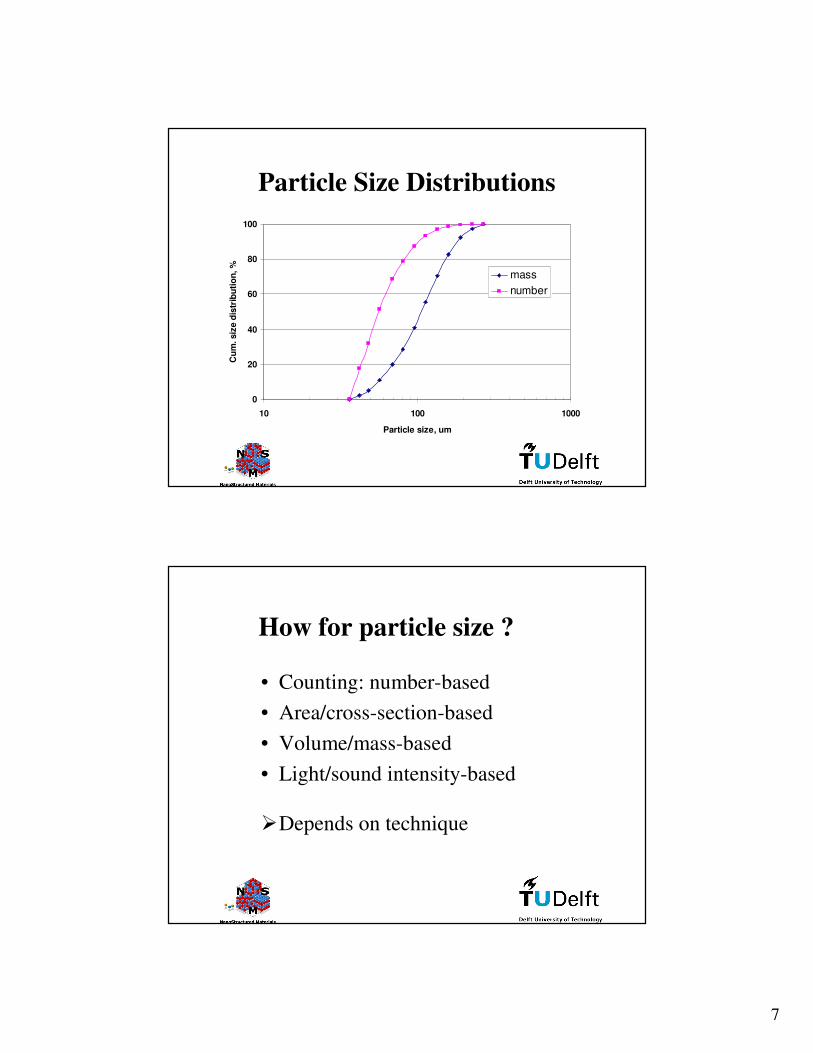
Equivalent particle size
projection area sieve volume sedimentation
low Re high Re
Particle size distribution
Particle size, µm
100 700200 300 400 500 6000.00
0.06
0.12
0.18
0.24
0.30
q3
, fr
actio
n p
er µ
m
Particle size, µm
100 700200 300 400 500 6000.00
0.06
0.12
0.18
0.24
0.30
q3, fr
action p
er µm
0
20
40
60
80
100
Q3, %
m/m
Frequency/Density Cumulative undersize
7
Particle Size Distributions
0
20
40
60
80
100
10 100 1000
Particle size, um
Cu
m. siz
e d
istr
ibu
tio
n, %
mass
number
How for particle size ?
• Counting: number-based
• Area/cross-section-based
• Volume/mass-based
• Light/sound intensity-based
�Depends on technique

8
How for particle size ?
• Fingerprint techniques
• Separation techniques
• Particle ensemble techniques
• Various techniques
Fingerprint techniques
• Microscopy (optical, SEM, TEM)
• Image analysis
• Chord length
• Electrical sensing zone
• Flow cytometry
• Optical particle counters
• Phase Doppler anemometry
• Time of flight

9
Separation techniques
• Air classification
• Electrical mobility analysis
• Hydrodynamic chromatography
• Impaction
• Sedimentation (gravity; centrifugal; FFF)
• Sieving
• Size exclusion
Particle ensemble techniques
• Dynamic light scattering
• Electro-acoustic
• Laser diffraction
• Ultrasound extinction
• Nuclear magnetic resonance
• Small-angle X-ray scattering

10
Various techniques
• Hegman gauge
• Permeability of packed column
Microscopy/Image analysisInterpretation of magnified images

11
Microscopy/Image analysis
• What do you want to measure?
• Select sufficient magnification (size, shape)
• Problems with overlapping particles
• Visualisation: good qualitative check on
particle shape and dispersion quality
Microscopy: visualisation
12
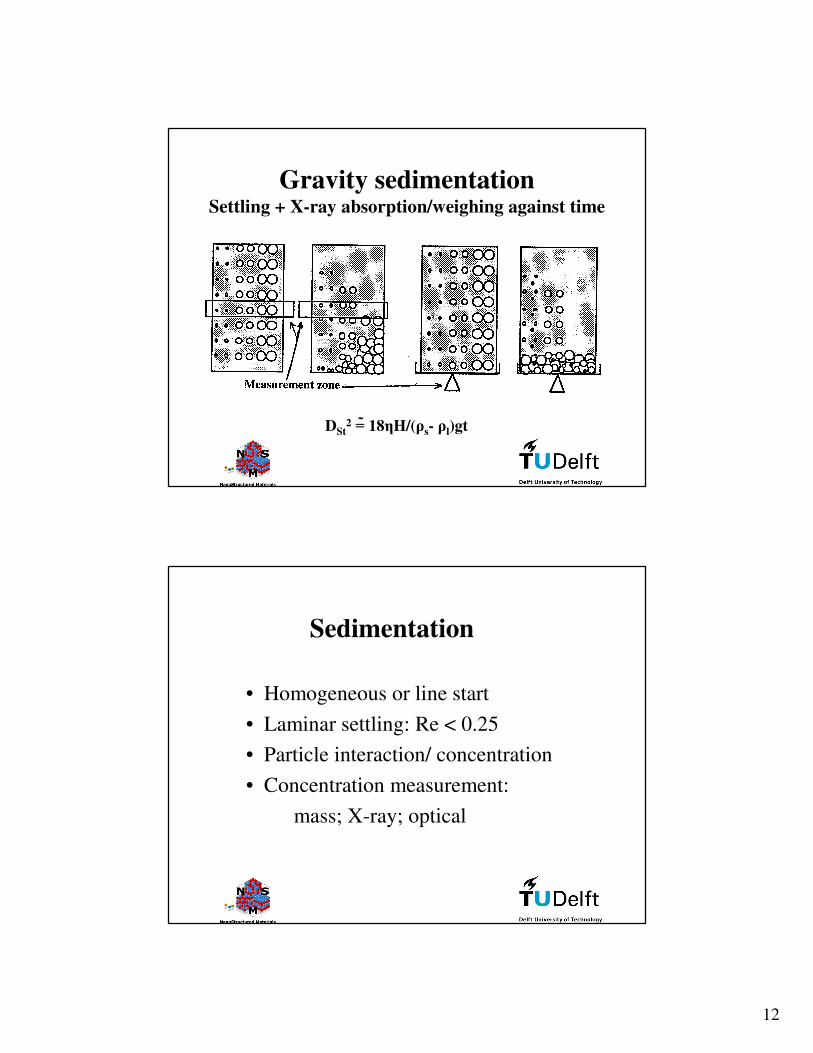
Gravity sedimentationSettling + X-ray absorption/weighing against time
DSt2 =� 18ηH/(ρs- ρl)gt
Sedimentation
• Homogeneous or line start
• Laminar settling: Re < 0.25
• Particle interaction/ concentration
• Concentration measurement:
mass; X-ray; optical
13
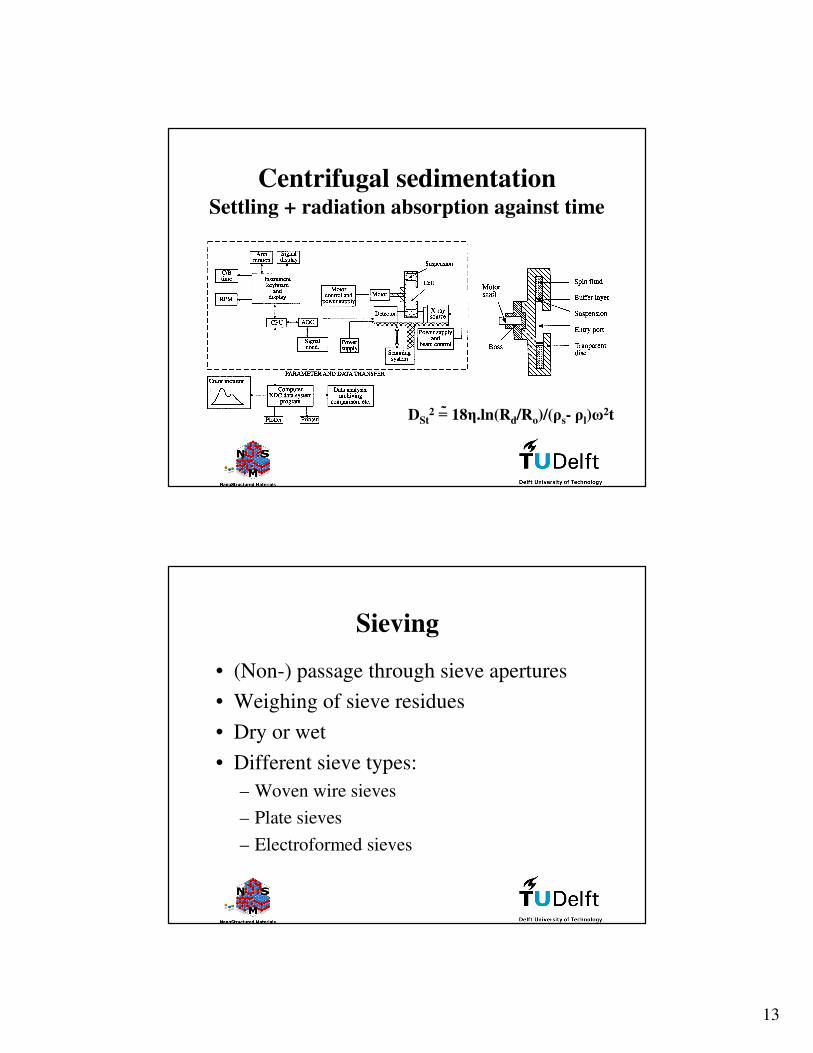
Centrifugal sedimentationSettling + radiation absorption against time
DSt2 =� 18η.ln(Rd/Ro)/(ρs- ρl)ω
2t
Sieving
• (Non-) passage through sieve apertures
• Weighing of sieve residues
• Dry or wet
• Different sieve types:
– Woven wire sieves
– Plate sieves
– Electroformed sieves
14
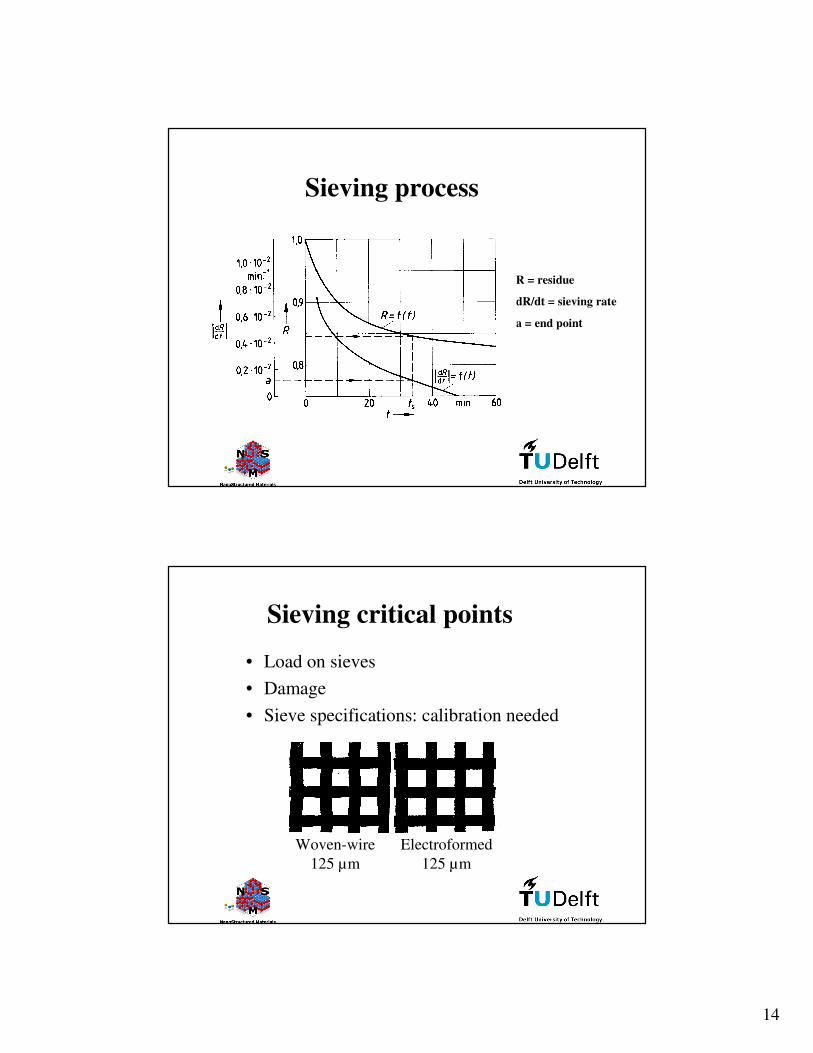
Sieving process
R = residue
dR/dt = sieving rate
a = end point
Sieving critical points
• Load on sieves
• Damage
• Sieve specifications: calibration needed
Woven-wire
125 µm
Electroformed
125 µm
15
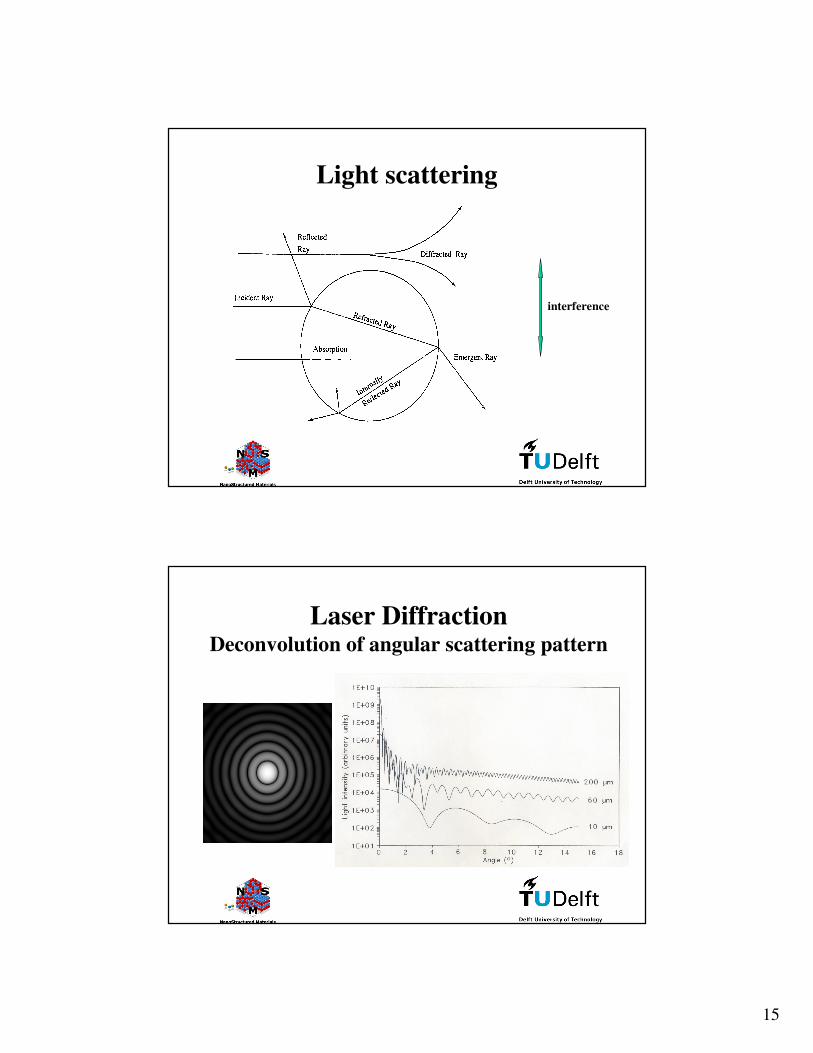
Light scattering
interference
Laser DiffractionDeconvolution of angular scattering pattern

16
Scattering patternslognormal PSD around 10 um; m = 1.22
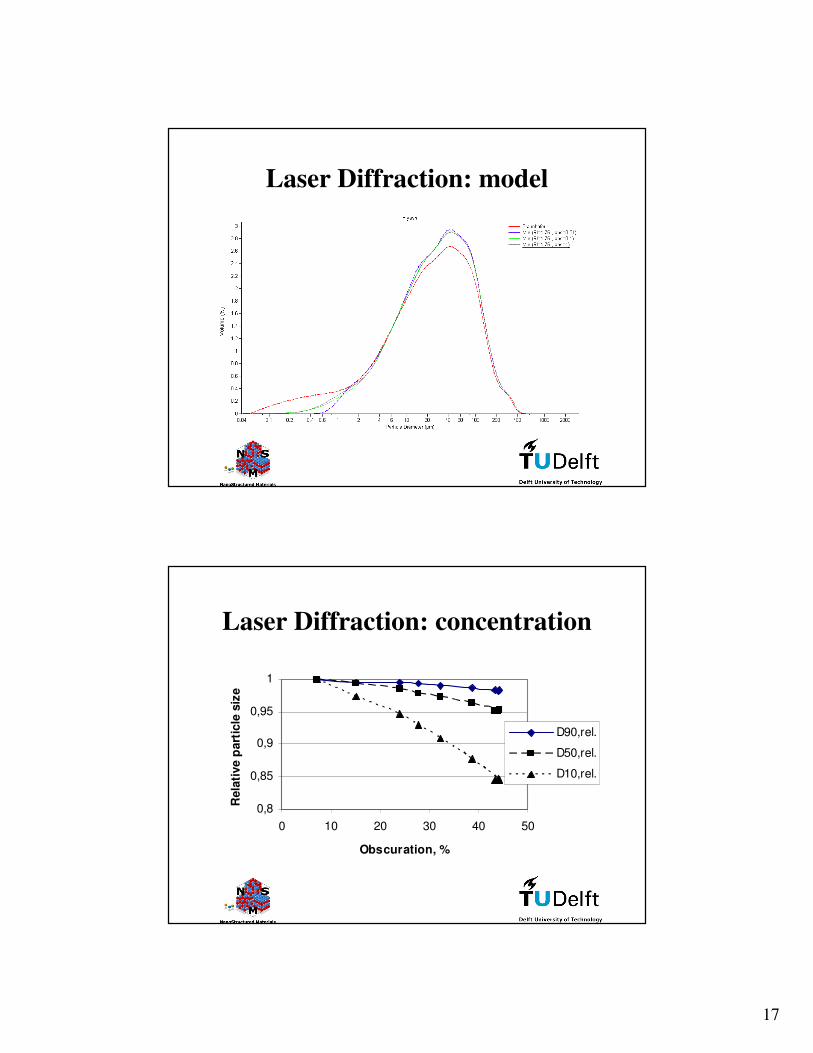
Laser Diffraction
• Model: Mie or Fraunhofer (or Rayleigh)
• Concentration: single/multiple scattering
• Detector type
CCD; CMOS
17
Laser Diffraction: model
Laser Diffraction: concentration
0,8
0,85
0,9
0,95
1
0 10 20 30 40 50
Obscuration, %
Rela
tive p
art
icle
siz
e
D90,rel.
D50,rel.
D10,rel.
18
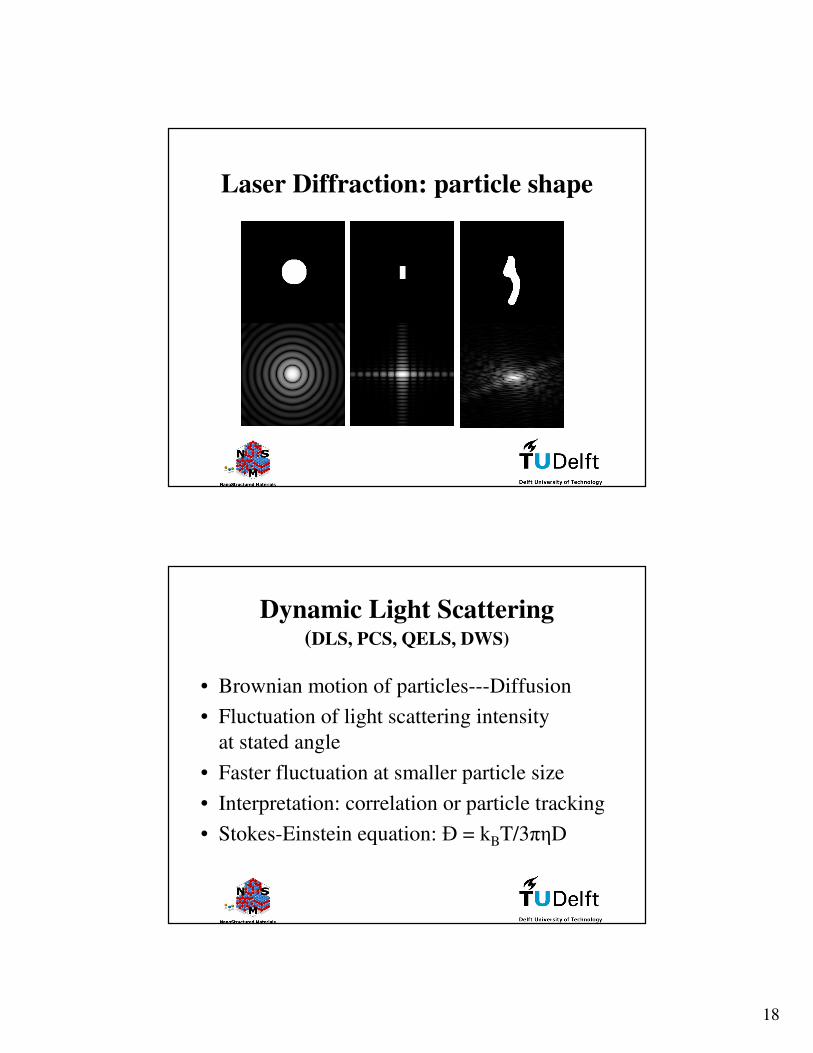
Laser Diffraction: particle shape
Dynamic Light Scattering(DLS, PCS, QELS, DWS)
• Brownian motion of particles---Diffusion
• Fluctuation of light scattering intensity
at stated angle
• Faster fluctuation at smaller particle size
• Interpretation: correlation or particle tracking
• Stokes-Einstein equation: ð = kBT/3πηD
19
How: size quality aspects
• Choice of relevant PSD parameter(s)
• PSD range allowed (in instrument)
• Concentration range allowed (in instrument)
• Total analysis time (incl. sample preparation)
• Stability of measurement (noise; drift)
• Costs (investment; operation; personnel)
Size quality aspects instruments
• Precision: repeatability; reproducibility
• Bias
• Accuracy
• Resolution
• Sensitivity (detection/determination limit)
• Traceability
• Quality of reporting and maintenance
20
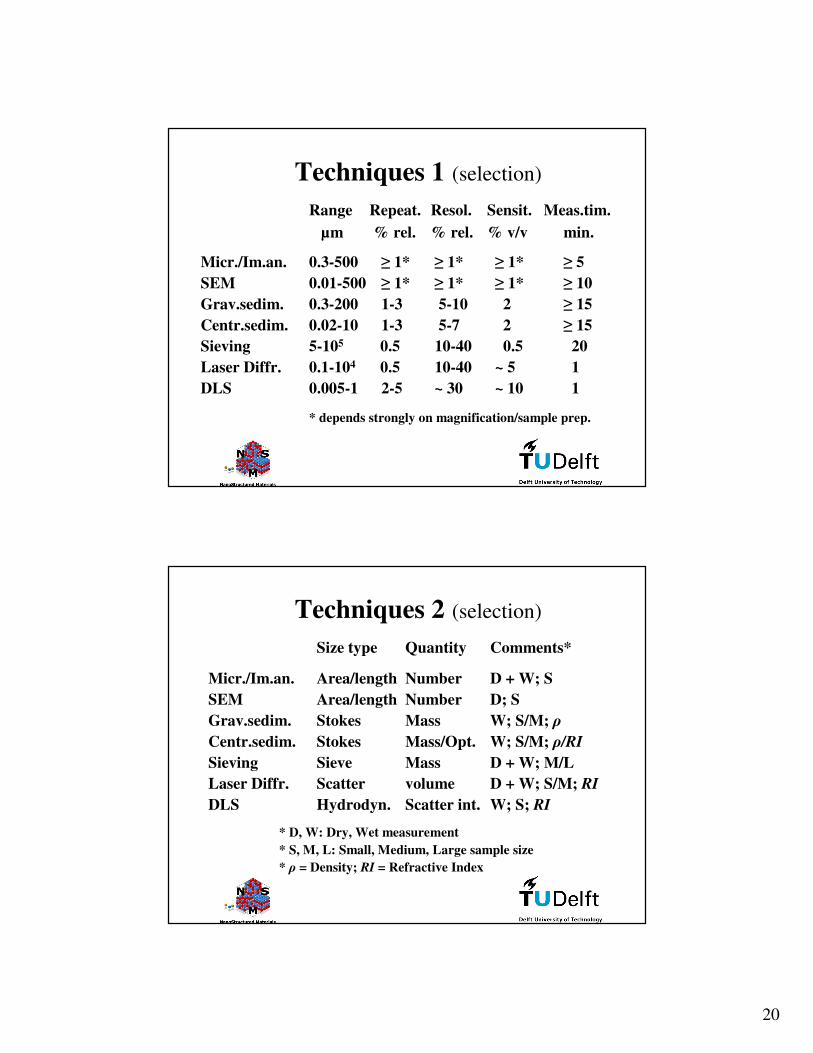
Techniques 1 (selection)
Range Repeat. Resol. Sensit. Meas.tim.
µm % rel. % rel. % v/v min.
Micr./Im.an. 0.3-500 ≥ 1* ≥ 1* ≥ 1* ≥ 5
SEM 0.01-500 ≥ 1* ≥ 1* ≥ 1* ≥ 10
Grav.sedim. 0.3-200 1-3 5-10 2 ≥ 15
Centr.sedim. 0.02-10 1-3 5-7 2 ≥ 15
Sieving 5-105 0.5 10-40 0.5 20
Laser Diffr. 0.1-104 0.5 10-40 ~ 5 1
DLS 0.005-1 2-5 ~ 30 ~ 10 1
* depends strongly on magnification/sample prep.
Techniques 2 (selection)
Size type Quantity Comments*
Micr./Im.an. Area/length Number D + W; S
SEM Area/length Number D; S
Grav.sedim. Stokes Mass W; S/M; ρ
Centr.sedim. Stokes Mass/Opt. W; S/M; ρ/RI
Sieving Sieve Mass D + W; M/L
Laser Diffr. Scatter volume D + W; S/M; RI
DLS Hydrodyn. Scatter int. W; S; RI
* D, W: Dry, Wet measurement
* S, M, L: Small, Medium, Large sample size
* ρ = Density; RI = Refractive Index
21
Method
• Method is more than technique
• Method includes:
– Sampling
– Dispersion
– Measurement
– Reporting
– Validation (instrument, operator, method)
Common error sources
• Choice of incorrect PSD parameter
• Lack of operator capability (education)
• Incorrect sample- too small; too few increments; non-representative; contamination
• Incorrect dispersion- concentration; agglomerates; dissolution; air bubbles; conditions
• No visual examination under microscope
• Using wrong technique, conditions or parameters (RI, ρ)
• Inadequate instrument calibration/validation/maintenance
• Not using written standards and instructions
• Poor reporting
22
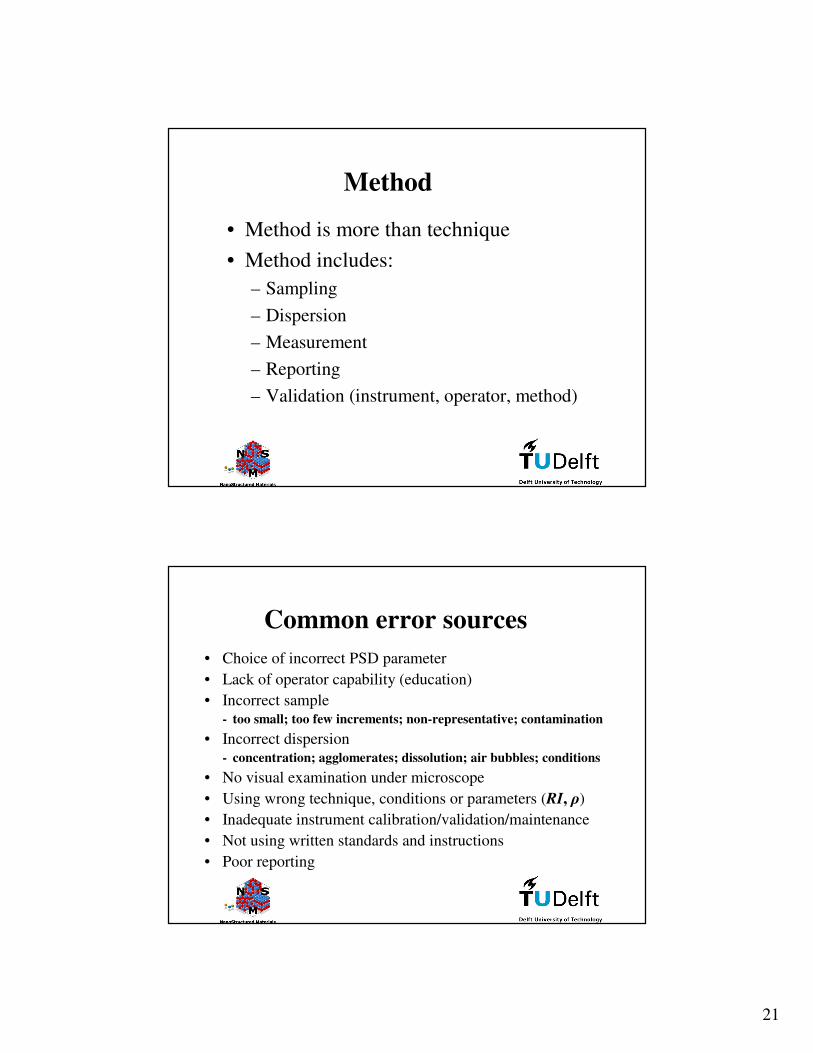
Error sources PSD measurement
0,1
1
10
100
1000
0,01 0,1 1 10 100 1000
Particle size, um
Err
or,
%
sampling
dispersion
instrument
Where?
• Off-line in laboratory
(adaptation for optimum measurement conditions;
easy tests for quality aspects; other instruments)
• At-line in laboratory near process
(as off-line measurement; often automated)
• On-line in parallel line to process
(adaptation for temperature/pressure possible)
• In-line in process line
• In-situ at specific point in reactor
23
Improve quality
• Written standards (ISO, ASTM, etc.)
• (Standard) Reference materials
• Quality control charts (instrument/operator)
• Use of statistics
• Knowledge (books, courses, journals)
• Experience (and self-criticism)
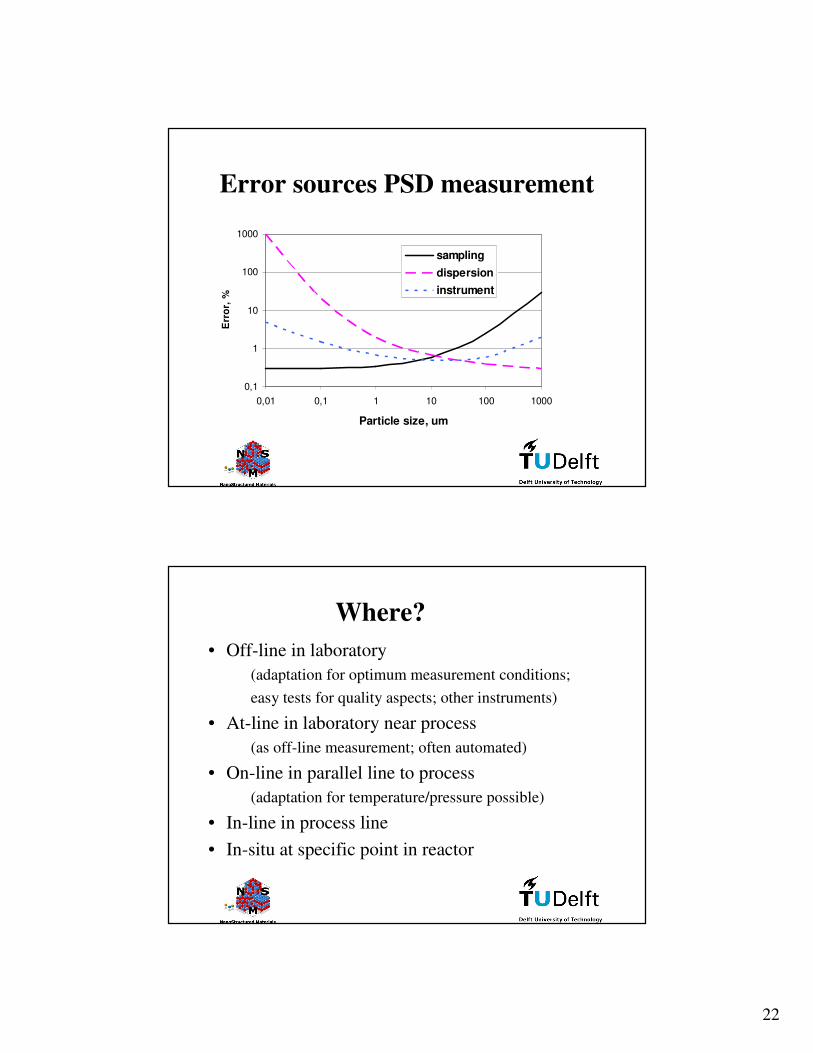
• Understand your challenge
Understand your challenge !!
24
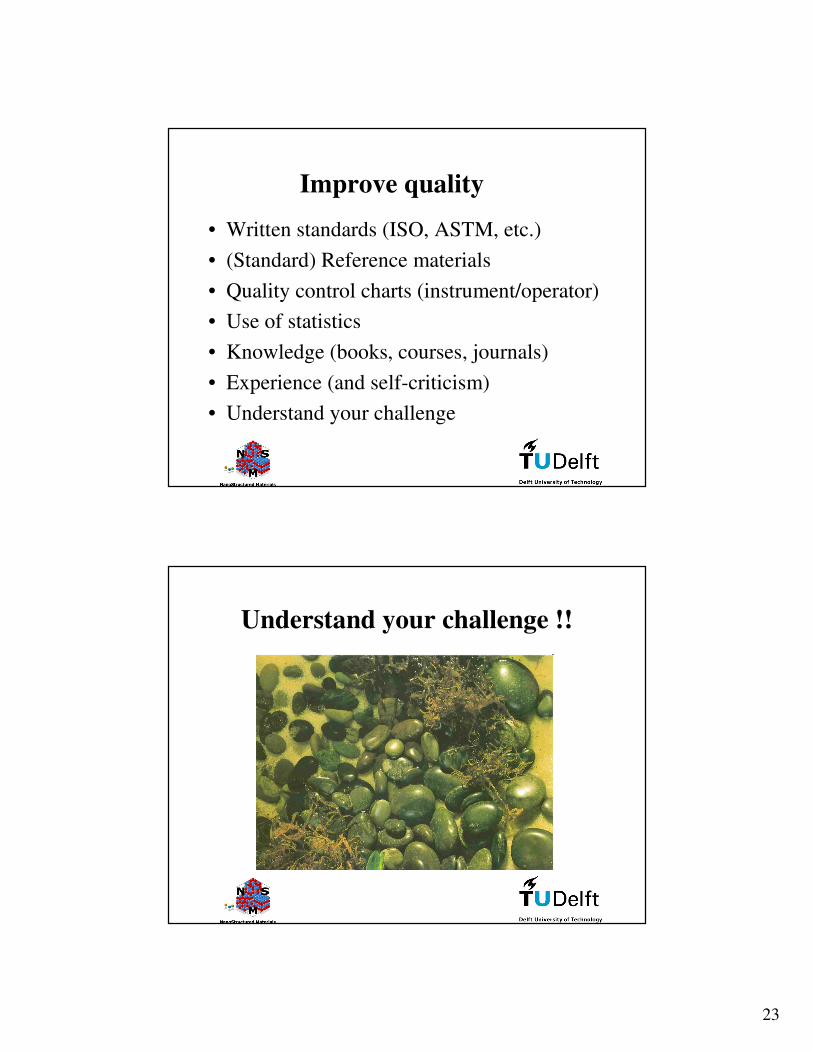
Understand your challenge 2
CONCLUSIONS
� Consider your choices on
WHY – WHAT – HOW – WHERE
carefully in relation to product requirements
and after adequate, critical investigation of quality and costs!
� Characterization is more than just size!
� Check performance regularly.
25
Literature
Henk G. Merkus
Particle Size Measurements;
Fundamentals, Practice, Quality
Springer 2009.