meru district council - merudc.go.tz · tanroads tanzania road agency tasaf tanzania social action...
TRANSCRIPT
THE UNITED REPUBLIC OF TANZANIA
PRESIDENT’S OFFICE REGIONAL ADMINISTRATION AND LOCAL GOVERNMENT
MERU DISTRICT COUNCIL
MEDIUM TERM STRATEGIC PLAN 2016/2017 – 2020/2021
DISTRICT EXECUTIVE DIRECTOR, P. O. BOX 462, USA RIVER - ARUSHA TEL: +255 254 1112 FAX: +255 254 1112 E-MAIL: [email protected] WEBSITE: merudc.go.tz
FEBRUARY, 2017
i
Table of Contents PREFACE ............................................................................................................................ iv
EXECUTIVE SUMMARY ....................................................................................................... v
CHAPTER ONE ........................................................................................................... 1
INTRODUCTION ........................................................................................................ 1
1.1 Contextual Background and Rationale ............................................................. 1
1.2 Methodology .................................................................................................... 1
1.3 Purpose of the Plan .......................................................................................... 1
1.4 Layout of the Corporate Strategic Plan ............................................................ 1
CHAPTER TWO .......................................................................................................... 3
SITUATION ANALYSIS ................................................................................................ 3
2.1 Background ....................................................................................................... 3
2.2 Establishment and area of jurisdiction of Meru District Council ..................... 3
2.3 Objectives and Functions of Meru District Council .......................................... 3
2.5 Vision in Previous MTSP ................................................................................... 4
2.6 Mission ............................................................................................................ 4
2.7 Performance Review ........................................................................................ 4
2.8 Internal Self Assessment ................................................................................ 21
2.9 Appraisal of the External Environment .......................................................... 23
2.10 Summary of Critical issues .............................................................................. 25
CHAPTER THREE ..................................................................................................... 28
THE MEDIUM TERM STRATEGIC PLAN ..................................................................... 28
3.1. Introduction ................................................................................................... 28
3.2 Vision, Mission and Core Values ................................................................... 28
3.3 Strategic Direction and Focus ......................................................................... 28
3.4 Strategic Objectives, Strategies and Targets .................................................. 29
CHAPTER FOUR ...................................................................................................... 46
RESULTS FRAMEWORK AND M&E SYSTEM .............................................................. 46
4.1 Purpose and structure .................................................................................... 46
4.2 The Goal .......................................................................................................... 46
4.3 Result Chain .................................................................................................... 46
4.4 The Result Framework Matrix ........................................................................ 46
4.5 Monitoring, Reviews and Evaluation Plan ...................................................... 50
4.6 Reporting Plan ................................................................................................ 51
CHAPTER FIVE ......................................................................................................... 53
INDICATIVE BUDGET ............................................................................................... 53
5.1 Introduction .................................................................................................... 53
5.2 Assumptions ................................................................................................... 53
5.3 Indicative Budget ............................................................................................ 53
Appendix 2 ..................................................................................................................... 54
Appendix 3 ...................................................................................................................... 70
ii
Abbreviations
AIDS Acquired Immune Deficiency Syndrome CBO Community Based Organization CHF Community Health Fund CHMT Council Health Management Term CIC Council Integrity Committee CMAC Council Multi-Sectoral Aids Committee CTC Care and Treatment Centre CSP3 Council Strategic Plan DADPS District Agriculture Development Programme DRCHC District Reproductive and Child Health Coordinator ECF East Coast Fever FBO Faith Based Organization FFS Farmers Field School FGM Female Genital Mutilation FMD Foot and Mouth Disease GCA Game Controlled Area GDS Genital Discharge Syndrome HBC Home Based Care HH House Hold HIV Human Immune Deficiency Virus HoD Head of Department HQ Headquarters IC Integrity Committee LDC Livestock Development Centers LGRP Local Government Reform Programme M&E Monitoring and Evaluation MIS Management Information System MSD Medical Stores Department MTSP Medium Term Strategic Plan NGOs Non-Governmental Organization O&OD Opportunities and Obstacles to Development OPD Out Patient Department PCCB Prevention and Combating of Corruption Bureau PLHIV People Living with HIV/AIDS PMORALG President’s Office Regional Administration and Local Government PMTCT Prevention of Mother to Child Transmission PPP Public Private Partnership RWSSP Rural Water Supply and Sanitation Program SACCOS Savings and Credits Co-operative Societies SDG Sustainable Development Goals SME Small and Medium Enterprises SWOC Strengths, Weaknesses, Opportunities and Challenges
iii
TANESCO Tanzania Electricity Supply Company TANROADS Tanzania Road Agency TASAF Tanzania Social Action Fund TTCL Tanzania Telecommunication Company Limited VCT Voluntary Counseling and Testing V-MAC Village Multi-Sectoral Aids Committee URT United Republic of Tanzania Vision 2025 Tanzania Development Vision 2025
iv
PREFACE
District Executive Director’s Statement This Medium Term Strategic Plan (MTSP) for the years 2016/2017 to 2020/2021 contains the priorities of Meru District Council in the next five years. The MTSP 2016/2017 – 2020/2021 has been aligned to the Vision 2025, Sustainable Development Goals 2030 (SDGs), the Tanzania Second Five Year Development Plan 2016 – 2021, and the CCM Election Manifesto 2015 – 2020. It is also informed by the Medium Term Strategic Plan of the PO RALG as well as that of Arusha Region.
The focus of this MTSP is to enhance access and quality of social services, economic services and infrastructure, gender and social equity, and financial sustainability of the Council. Overall, the MTSP has taken into account the best experiences of the previous plans and is designed to stimulate a new drive of empowering the community to an industrial era envisaged by the fifth Phase Government.
The plan anticipates that the departments and units will exploit the strengths and opportunities that have identified and use the available resources effectively and efficiently to improve the delivery of quality services. The roles of improving performance in the management of operations of the Council are presented in the Plan Matrix, detailing the objectives, strategies, targets and the responsible lead implementers. The key performance indicators are listed for each strategy to facilitate monitoring of the performance and assessing the achievements that are being realized.
This MTSP aims at providing its stakeholders an insight and understanding of the strengths, weaknesses, opportunities and challenges in the delivery of adequate and quality services. It also charts the Council’s broad direction forward. It is my hope that this document will provide a platform for the Council and its attendant stakeholders to contribute towards achieving its aspirations of empowering its community to a middle income society by 2025.
Mr. Christopher J. Kazeri DISTRICT EXECUTIVE DIRECTOR
v
EXECUTIVE SUMMARY
Meru District Council is responsible for maintaining and facilitating the maintenance of peace, order and good governance, promotion of social welfare and economic well-being of all persons within the Council, furtherance of social and economic development, and formulation, co-ordination and supervision of implementation of all plans for the economic, commercial, industrial and social development the District Council.
This Medium Term Strategic Plan (MTSP) has been prepared in accordance with the requirements of the government of the United Republic of Tanzania (URT) to assist Meru District Council enhance result-based management and efficiency in operations. This is the third MTSP for the Council, the second MTSP 2011/12 – 2015/16 ended June 2016. Hence, this MTSP covers the period 2016/17 to 2020/21 and it presents the Council’s Vision, Mission, core values, roles and functions.
The MTSP 2016/17 -2020/2021 begins with a situation analysis which provides a performance review of the MTSP 2011/12 – 2015/16, an assessment of institutional capacity and an analysis of the external environment. A detailed Situation Analysis of the Meru District Council showing Strengths, Weaknesses, Opportunities and Challenges (SWOC) has been presented in Chapter 2. Critical issues have been identified in the areas of service delivery, availability and quality of social services, economic service and infrastructure, governance and administration, and emergence preparedness of the Council. Overall, the challenges revolve around enhancing access and quality of services and empowering the community to work for sustainable development and propel it to a food secure, medium income society by 2025.
The Vision of the Meru District Council is “A well educated, food secure medium income community anchored on agro-based industries and eco-tourism by 2025”. The Mission of the Council is “To empower communities innovatively and sustainably use available resources to attain medium income status by 2025”.
Strategic Objectives, Strategies and Targets that aim to contribute towards realization of the Vision and Mission of Meru District Council have been developed based on the key issues that were identified in the situation analysis. The Strategic Objectives, Strategies and Targets are elaborated in Chapter three. The plan contains 8 Key Results Areas, 16 Strategic Objectives, 45 strategies and 183 targets. The strategies and targets that will be implemented by Meru District Council during the five years (2016/17 – 2020/21) are outlined under the following objectives:
1. Objective A: Services Improved and new HIV/AIDS infections reduced
vi
2. Objective B: Implementation of the national anti-corruption strategy enhanced and effectively sustained
3. Objective C1.1: Population accessing quality health care services at all levels increased to 90% by June 2021
4. Objective C2.1: Student’s pass rate in Std. VII examinations increased from 65.5% to 80% by June 2021
5. Objective C2.2: Literacy rate for adults increased from 95.8% to 98% by June 2021
6. Objective C2.3: Students enrolment in secondary schools increased from 12,736 to 18,000 by June 2021
7. Objective C2.4: Students pass rate in Form II, IV and VI increased from 82%, 77% and 89% respectively to 100% by June 2021
8. Objective C2.3: Population accessing clean and affordable water services increased from 64% in 2016 to 85% by June 2021
9. Objective D1: Food self sufficiency in Meru District Council increased from 70% to 90% by 2021
10. Objective D2: Production of livestock and fisheries increased by 2021 11. Objective D3: All roads in the District are passable throughout the year by 2021 12. Objective E1: Meru District Council’s Performance Enhanced by 2021 13. Objective E2: Financial Sustainability enhanced by June 2021 14. Objective F: Sustainable utilization of natural resources improved by 2021 15. Objective G: Social welfare, gender equality and community empowerment
improved 16. Objective H: Emergence preparedness and disaster management improved by
2021 The Monitoring and Evaluation system that will be used to measure and inform the Council on the progress being made is presented in Chapter four. The MTSP 2016/17 – 2020/21 is estimated to cost Sh. 145.8 billion.
1
CHAPTER ONE
INTRODUCTION
1.1 Contextual Background and Rationale Preparation of Medium Term Strategic Plans (MTSP) is a statutory requirement for all public entities including District Councils. An MTSP is developed as a means of enhancing result-based management and efficiency in operations. Meru District Council has been implementing this requirement since 2011/2012 and the first MTSP covered the period 2011/2012 – 2015/2016. This is the third Strategic Plan and it covers a period of five years from 2016/2017 to 2020/2021. The plan charts forward the broad direction of the Council for the coming five years. It describes the Vision, Mission, Core Values, Mandate, Strategic Objectives, Targets, Key Performance Indicators and the process used to derive them.
1.2 Methodology The Strategic Plan has been developed in accordance with the Medium Term Strategic Planning and Budgeting Manual of the United Republic of Tanzania. The plan has been prepared in a participatory manner involving the management, Councilors, stakeholders from the private sector, NGO’s and CBO’s with track record of support for the district development. Four strategic planning workshops were conducted during the preparation of the Strategic Plan. Reference was made to the Tanzania Development Vision 2025, Sustainable Development Goals (SDGs), the Tanzania’s Second Five Year Development Plan 2016/2017 – 2020/2021, CCM Election Manifesto 2015, relevant sector specific policies and programmes.
During the preparation of the strategic plan, Meru District Council carried out the following:
Review the performance of the previous MTSP 2011/2012 – 2015/2016
Analysis of the situation, specifically conduct an internal self assessment to identify MDC’s strengths and weaknesses, external environmental scan to identify opportunities and challenges, and a stakeholders’ analysis to identify their expectations.
Review its Vision and clarify on its Core Values
Review the Strategic Objectives, Strategies, Targets and key Performance Indicators
1.3 Purpose of the Plan
This strategic plan is primarily aimed at:
Providing Meru District Council with a framework for operational planning, implementation and performance review;
Setting the basis for resource allocation and targeting;
Informing MDC’s stakeholders what the District plans to do; and
Providing a blueprint that will guide all operations of the District Council
1.4 Layout of the Corporate Strategic Plan
The Medium Term Strategic Plan is divided in five chapters as follows:-
2
CHAPTER ONE: Introduction which covers background and rationale, methodology, purpose and layout of the plan.
CHAPTER TWO: Situation analysis which provides an institutional assessment, stakeholders’ analysis, and an environmental scan.
CHAPTER THREE: Contains the plan, detailing the Vision, Mission, Core Values, Strategic Objectives, Strategies and Targets.
CHAPTER FOUR: Contains the results framework, the Monitoring and Evaluation Plan.
CHAPTER FIVE: Provides the preliminary budget estimates
3
CHAPTER TWO
SITUATION ANALYSIS
2.1 Background
This chapter presents an internal appraisal of the Meru District Council and an assessment of the external environment. The internal analysis is in two parts. Part one presents a performance review in terms of achievements, challenges and way forward for each objective that is stipulated in the Five Year Strategic Plan 2011/2012 – 2015/2016. The second part presents an institutional capacity assessment. The internal analysis ends with a summary of strengthens and weaknesses of the Council. The last part presents a summary of stakeholders’ expectations and an analysis of the external environment which identifies the opportunities and potential challenges. The chapter concludes with a summary of critical issues that need to be addressed in the next plan.
2.2 Establishment and area of jurisdiction of Meru District Council
Meru District Council (MDC) is one of the seven councils which make up Arusha Region. The Council was established in 2006 by Government order No. 353 made under Section 5 of the Local Government Ordinance (The Local Government Instrument 1982). The Council effectively started operations on 1st July 2007. Meru District Council lies between Latitude 3’000 – 360 and Longitude 080 – 520 in the Eastern South of the Equator on the slopes of Mount Meru. The highest peak of Mt. Meru rises to 4,566 metres above sea level, which is the second highest in Tanzania after Kilimanjaro Mountain that rises to 5,895m above sea level. Mt. Meru is the fifth highest in Africa.
The 2012 Census results showed that Meru District Council had 268,144 growing at a rate of 2.7% per annum. It is projected that as at 2017 MDC has 306,352 people including 149,968 males and 156,384 females. Administratively, Meru District Council is composed of 3 Divisions, 26 Wards, 90 Villages, 337 Sub–villages and Usa River Township Authority with 9 Streets included as Sub –Villages of Poli Division. The Council covers an area of 1,268.2 square kilometers out of which about 813.5 kms2 (64.1% of the total) are used for agricultural activities, 163.7 kms2 (13% of the total area) are covered by forest reserves. An area of about, 37.05 kms2 (3%) is used for grazing, 15 kms2 (0.001%) for pasture/fodder, 203.7 kms2 (16%) for National Parks, 5.7kms2 (0.4%) for water bodies and the remaining area of 44.39kms2 (3.6%) of land is of settlement and unsuitable land.
Meru District Council experiences two rainfall seasons; the short rains normally fall in November to January and long rains fall between the months March to June. Annual rainfall ranges between 500m and 1,200 mm with average temperatures of about 250C (January – February) and 220C (June –August).
2.3 Objectives and Functions of Meru District Council
The Objectives and Functions of Meru District Council as stipulated in the Local Government Act. No. 7 Section 118 of 1982 includes:
4
(a) To maintain and facilitate the maintenance of peace, order and good governance within its area of jurisdiction
(b) To promote the social welfare and economic well-being of all persons within its area of jurisdiction (c) Subject to the national policy and plans for rural and urban development, to further the social and
economic development of its area of jurisdiction. (d) To make by-laws applicable throughout their areas of jurisdiction, and considering and improving
by-laws made by village councils within their areas of jurisdiction. (e) To ensure the collection and proper utilization of the revenues of the Council (f) To formulate, co-ordinate and supervise the implementation of all plans for the economic,
commercial, climate change mitigation, industrial and social development in the area of jurisdiction.
2.5 Vision in Previous MTSP The vision of Meru District Council as presented in the previous medium term strategic plan reads: “To have a Community with improved and sustainable livelihood by the year 2025”.
2.6 Mission Meru District Council’s mission as stated in the previous MTSP is: “to create conducive environment in order to provide quality socio-economic services to its community through effective and efficient use of resources and good governance for improved livelihood”.
2.7 Performance Review
The Strategic Plan 2011/2012-2015/2016 contained 13 strategic objectives but most objectives were no measurable and did not have specific targets. The objectives were also not consistent with the objectives that were used in annual plans. The review has adopted the following eight objectives that were consistently used in the annual plans and budgets:
A. Improve services and reduce HIV/AIDS infections B. Enhance, sustain and effective implementation of the national anti-corruption strategy C. Increase access, quality and equitable social Services delivery D. Increase quantity and quality of economic services and infrastructure E. Enhance Good governance and administrative services F. Management of natural resources and environment sustained G. Social welfare, gender equality and community empowerment improved H. Emergence preparedness and disaster management improved
Implementation of the strategic plan has registered satisfactory results. The main achievements from the implementation of the preceding five years plan are presented here below.
Objective A: Improve services and reduce HIV/AIDS infections The thrust was to reduce new HIV/AIDS infections and improve access and quality of services to people living with HIV/AIDS.
5
Main achievements
New HIV/AIDS infections have fallen from 2% to 0.8%
People using Anti-retroviral services increased from 1,129 to 6,101 against 8,173 people that were identified to be HIV/AIDS positive
HIV/AIDs prevalence among pregnant women (PMCT) has decreased from 3% in 2011 to 0.9% by June 2016.
Eight (8) new CTC Centres were established (2 in hospitals and 6 in HCs) by June 2016
152,500 people were trained on HIV/AIDS prevention and avoidance
About 70% of the people in the District Council are aware of how HIV/AIDS is transmitted and the methods of AIDS prevention
Challenges
High level of stigma on people living with HIV/AIDs
Lack of confidentiality amongst HIV/AIDS service providers
Inadequate CTC centres and support services
Challenges experiences in supporting HIV/AIDS groups
Declining donor support
Way Forward
Continual awareness raising and counseling
Increase financing from local sources (health partners)
Strengthen staff training on ethics about HIV/AIDS service delivery
Increase number of CTC centres and equipment
Expand mobile CTC centres Objective B: Enhance, sustain and effective implementation of the national anti-corruption strategy Main achievements
78% of people are aware of the rights, obligation and impacts of corruption
Formation of ant-corruption clubs in 57 secondary schools
Establishment of ant corruption desk in District Council Challenges
Difficult in detecting corruption
Inadequate working facilities
Bureaucracy in the provision of services Way Forward
Increase working facilities
Increase efficiency in the provision of service
6
Objective C: Increase access, quality and equitable social Services delivery
The main objective was to increase access, quality and equitable delivery of social services within Meru District Council. The main social services included education, health and water. Major achievements by sector are as follows: (a) Health Services
Health services in Meru District Council are organised through the following facilities:
Two hospitals - the District Hospital and one faith based hospital which provide comparable range of services
Nine (9) Health Centres and 51 dispensaries.
Achievements
The main achievements recorded during the last five years include:
Maternal mortality rate declined from 153/100,000 in 2011 to 24/100,000 in June 2016 (454/100000 national target)
Infant Mortality Rate (under 5) reduced from 133/100,000 in 2010 to 26/100,000 in June 2016. This rate is 5 times lower the national target of 130/100,000.
Family planning acceptance rate increased from 19% in 2010 to 59% of women of child bearing age by June 2016. This rate is lower than the national target of 75%.
Facility based delivery increased from 57% in 2011 to 80 % of women delivering at health facilities by June 2016 (which is equal to the national target of 80%).
Prevention services improved to level of attaining 100% inoculation for the four major antigens as follows: o OPV0 increased from 20% in 2011 to 100% in June 2016 o DPT-HB-Hib increased from 87% in 2011 to 100% in June 2016 o BCG increased from 90% in 2011 to 100% in June 2016 o Measles increased from 85% in 2011 to 100% in June 2016
Vitamin A supplementation and de-worming maintained at 88% in 2011 to June 2016
ARV uptake increased from 3,201 in 2011 to 6,253 in 2016
Mothers attending mother to child HIV/AIDS transmission prevention services increased from 7,960 in 2011 to 9,075 in 2016
Counselling and testing centres (CTC) increased from 3 in 2011 to 11 in 2016. These are located in the two hospitals and 6 Health Centres
Proportion of people covered under Community Health Fund increased from 8% in 2011 to 17.5% in 2016
Challenges
Shortage of staff in specialised fields
Inadequate health infrastructure (housing, incinerators, dispensaries and health centres)
Inadequate supply of water and electricity to 8 HCs and 7 dispensaries
7
Inadequate supply of medical equipment and supplies
Unreliable transport facilities
Unavailability of waste collection facilities and dumping sites
Low community awareness of Non Communicable Diseases (NCDs) Way Forward
Recruit new staff and train existing staff
Improve and expand health infrastructure
Construct and install water and electricity to 8 HCs and 7 dispensaries
Improve supply of medical equipment and supplies
Procure additional transport facilities
Construct waste collection sites and dumping sites
Raise community awareness on NCDs
(b) Education Services The main programme on education services focused on increasing access and quality of primary and secondary education.
(i) Primary Education
The key facilities available for primary and adult education include:
141 pre-primary schools (comprising 106 government and 35 private schools), 151 primary schools (including 112 government schools and 39 private), 1,011 classrooms, 52,623 desks, 841 toilet stances for boys, and 904 toilet stances for girls.
1,666 teachers with 317 teachers’ houses
Eight (8) vocational training centres
Achievements The main achievements registered in the past five years under primary and adult education are:
Student enrolment hovered at 99% of children of school going age throughout the period
Teachers’ houses increased from 294 in 2011 to 315 in June 2016
Number of teachers increased from 1,418 in 2011 to 1,666 in June 2016
Number of classrooms increased from 886 in 2011 to 1,011 in June 2016
Number of desks increased from 8,740 in 2012 to 52,623 in June 2016
Toilet stances for boys and girls increased from 697 and 722 in 2012 to 841 and 904 in 2016 respectively
11,632 people attended literacy classes by June 2016
396 people (202 male and 194 female) attended vocational training as at June 2016
Literacy rate increased from 79% in 2011 to 88% in 2016
1,252 teachers attended training in Mathematics, LANES, English and Science
Teacher students ratio improved from 1:39 in 2011 to 1:28 in 2016
Drop-out rate was steady at 0.01% from 2012 to 2016
8
Truancy in schools declined from 68 pupils in 2012 to 48 pupils in 2016
Availability of books improved 1:5 in 2012 to 1:3 in 2016
Challenges
Inadequate education infrastructure (classrooms, teachers’ houses etc)
Inadequate teaching materials
Shortage of mathematics, English and science teachers
Consistent students’ drop-out rate
Low morale amongst teachers
Low pass rate
Frequent changes in curricula with little involvement and preparation of key stakeholders Way Forward
Expand and improve education infrastructure
Improve working environment
Strengthen professional development programmes
Strengthen by-laws and application of student management systems
Improve availability of learning/teaching materials
Improve availability of education equipment and facilities
Improve quality assurance systems and school supervision (ii) Secondary education
The key facilities available for secondary education include:
57 secondary schools (including 29 government schools and 28 private schools) out of which 13 schools (three (3) government owned and 10 private owned) offer advanced secondary education.
306 classrooms, 12,276 desks, 56 laboratories, 189 toilet stances for boys, 216 toilet stances for girls, 8 dormitories with 598 beds
1,316 teachers with 96 teachers’ houses
Achievements The main achievements for the last five years are as follows:
Number of teachers in government schools increased from 380 in 2012 to 1,316 (science 154 and arts 1,162) by 2016
Number of laboratories in government schools increased from 9 in 2012 to 56 by 2016
Toilet stances for boys and girls in government schools increased from 124 and 128 in 2012 to 189 and 216 in 2016 respectively
Number of teachers’ houses increased from 68 in 2012 to 96 in 2016
Students dormitories increased from 4 in 2012 to 8 in June 2016
Libraries increased from 2 in 2012 to 6 in 2016
Student pass rate at Form IV improved from 53.76% in 2013 to 77% in 2016
Student pass rate at Form VI is consistently high ranging from 99.3% in 2014 to 93% in 2016
9
Challenges
Inadequate capitation for effective teaching and evaluation
Inadequate awareness on the application of policy on free education
Inadequate land for development of education infrastructure e.g. teachers houses and sports and games
Inadequate training equipment, supplies and chemicals supplies
Shortage of science and mathematics teachers
Weak cooperation between schools management, school committees and village governments
Shortage of education infrastructure (teachers’ houses, laboratories, dormitories, libraries etc)
Way forward
Improve availability of teaching and learning material
Improve provision for food supplies in schools to improve students’ concentration in classes.
Construct the requisite education infrastructure and facilities to improve learning environment
Recruit additional science and mathematics teachers
Strengthen professional development programmes
Strengthen by-laws and application of student management systems
Improve quality assurance systems and school supervision
Improve availability of training equipment, chemicals and supplies (c) Water services The main thrust of water services programme is to increase availability and quality of water and sanitation services. The plan specifically focused on increasing the number of people with access to clean and affordable water, and improving hygiene and sanitation practices in the District. The main sources of water in Meru District Council include rivers, Lake Duluti, springs, boreholes, shallow wells and rain water harvesting distributed as shown in Table 2.1.
Table 2.1: Shows the existing water supply schemes and their situation
Type of facility Installed Water Supply facilities
Functioning facilities
Non- Functioning facilities
Hand Pump 7 4 3
Gravity Springs 47 47 0
Borehole Pumped Schemes 24 13 11
Surface pumped Schemes 3 3 0
Rain water harvesting tanks 259 259 0
Point source Bore stances 8 8 0
Total 348 334 14
These sources supply 6,200m³/day, which amounts to 40% of water requirement of 15,500m³/day.
Achievements The achievements recorded in the past five years include:
10
Population served with clean and safe water increased from 168,930 in 2011 to 171,612 (61% of the population) in 2016 (national target 85%)
People accessing water services within 400 km increased from 28% in 2011 to 40% in rural areas and 65% in trade centers in 2016
Households with improved toilet facilities increased from 48% in 2011 to 70% in 2016
Three pumping water supply schemes (Patanumbe, Mbuguni and Majengo) with a capacity to serve 25,479 people were under construction
Four gravity water schemes (Ndoombo Nkoarisambu, Nshupu, Kwaugoro and King'ori) with a capacity to serve 53,974 people were under construction
Challenges
Shortage of staff specifically mechanical engineers and technicians
Community resistance to contribute to community water fund
Inadequate awareness on laws and by-laws governing water management and water rights
Low flow of water and destruction of water infrastructure mainly during dry season
High content of fluorine in water especially in Imbaseni and Maji ya Chai wards
Lack of sewerage and wastewater management facilities
Lack of plans for maintenance and rehabilitation of water schemes
Decrease of water volume and dryness of water sources due to effects of climate change Way Forward
Recruit new staff and train existing staff
Increase funding from Council’s own sources
Strengthen by-laws on management of community water funds
Raise community awareness on by-laws, water management and water rights
Improve water management systems
Explore new sources and improve management of water sources
Construct sewerage system and wastewater management ponds
Develop water treatment centres
Planting trees near water sources Objective D: Increase quantity and quality of economic services and infrastructure
The programme aimed at increasing quantity and quality of agricultural and cooperative management, livestock, fisheries and infrastructural facilities and services.
(a) Agriculture and Cooperatives The main objectives of the programme on agriculture and cooperatives were to increase productivity, ensure food security, and improve access and reliability of crops and livestock markets and fisheries.
Achievements The main achievements recorded during the plan period were as follows:
11
Farmers accessing agriculture extension services increased from 45,960 (2011) to 66,387 (2016)
15 Agriculture extension staff trained under professional development programme out of 20 who were in the training programme
Proportion of farmers using industrial fertilizers increased from 60% in 2011 to 80% in 2016
Two (2) value addition facilities for agricultural products have been constructed
Average Food and cash crop production increased as follows: - Maize 1.8 Tons/Ha in 2011 to 3Tons/Ha in 2016 - Beans 0.8 Tons/Ha in 2011 to 1.3Tons/Ha in 2016 - Coffee 0.4 Tons/Ha in 2011 to 0.72Tons/Ha in 2016 - Rice 4 Tons/Ha in 2011 to 5Tons/Ha in 2016
Area under irrigation increased from 12,220Ha in 2011 to 12,600 in 2016Ha
3 Warehouses were constructed out of 5 which were planned
Number of registered Cooperative Societies increased from 62 in 2011 to 74 in 2016
Number of Cooperative Society members increased from 15,534 to 18,698 and Capital from sh. 1.3 billion to sh. 3.1 billion.
Challenges
Shortage of staff and working facilities for extension services delivery
Prevalence of fake agricultural inputs
Low agro processing and rural infrastructure
Lack of qualified personnel and financing institutions for warehouse receipt system operation
Poor market information system
Climate change
Low adoption rate of technologies due to low purchasing power among small scale farmers
Low creativity and capital for effective operation of Cooperative Societies
Way forward
Recruit additional staff
Promote agro processing and Rural Industrialization
Increase availability of agricultural inputs
Strengthen agricultural and marketing information systems
Improve rural infrastructure for marketing of agricultural inputs and outputs
Promote partnership between smallholder farmers and agribusinesses
Promote agricultural mechanization
Encourage private sector involvement in auditing, supervision and provision of advisory services to Cooperative Societies
Strengthen Micro finance institutions at grass root level
(b) Livestock and fisheries Achievements
12
Milk production increased from an average of 6 liters per cow per day in 2011 to 8 liters per animal per day in 2016
Production of indigenous chicken increased from 1 to 1.5 kg in body weight and 60 to 120 eggs per bird per year.
Number of fish farmers increased form 283 in 2011 to 301 in 2016
Number of fish ponds increased from 467 in 2011 to 512 in 2016
Two (2) value addition facilities for livestock products have been constructed
Production of dairy Goats increased from 1.0 to 2 liters per goat per day.
Livestock farmers accessing livestock extension services increased from 45,025 (2011) to 53,202 (2016)
Number of livestock staff trained under professional development programmes is 11 out of 19 who were in the training programme
Challenges
Shortage of staff and working facilities for extension services delivery
Prevalence of fake livestock inputs
Low level processing of livestock products
Low livestock genetic potential resulting into low productivity
Climate change
Shortage of pastures and grazing land
Lack of reliable supply of good quality fish seed and fish feeds
Lack of support on effective utilization of Lake Duluti
Poor market information system Way forward
Recruit additional staff
Promote processing of diary and animal products
Improve availability of livestock inputs
Improve Marketing information systems
Promote partnership between smallholder livestock keepers and agribusiness
Promote destocking and zero grazing system
Strengthen artificial insemination services
Improve supply of quality fish seeds
Conduct fish stock assessment at Lake Duluti and protect it against illegal fishing
Improve pasture management systems and practices
Promote investment in Aquaculture
(c) Economic Infrastructure
(i) Works / Roads Services
Meru District Council maintains 686.5 kms of road network composed of Tarmac road 5.5 kms, gravel roads 245 kms and earth roads 436 kms.
13
Achievements The main achievements for the last five years include:
435 kms of the roads received routine maintenance
340 kms of roads got spot maintenance
78 kms of road were under periodic maintenance
5 bridges were constructed (Kikatiti, Uhuru, Olukung’wado and Siera bridges)
18.5 kms of new road were under construction (Malula – Nkoansio – King’ori)
(ii) Buildings
Construction of operating theatre at District hospital
Construction of Meru District Council Headquarter
Construction of 6 secondary Schools’ infrastructure
(iii) Other Transportation Infrastructure and Communication Services Available
Cellular network is available throughout the District Council
There is an airstrip and the District is located just half an hour drive to two airports – KIA and Arusha Airports.
Challenges
Shortage of supporting staff i.e. land surveyor, draughtsman, and quantity surveyor
Ineffective professional development plan
Non- compliance with construction standards e.g. schools and hospitals
Low community participation in road construction and expansion
Existence of unplanned settlements
Lack of M&E services - maintenance of Council’s plants are delayed
Way forward
Strengthen plant and equipment committee
Improve capacity on enforcing compliance with construction standards
Sensitize community on the importance of expansion of roads
Recruit additional staff
Establish an independent unit for road sector
(iv) ICT Achievements
ICT infrastructure and facilities installed in most Offices at District Council Headquarters
The District Council is connected to National Fiber Optic Cable for internet
Data submission rate improved to 65% through the use of Local Government Monitoring Database (LGMD)
One information centre established at Ngarenanyuki for effective information sharing.
Meru District Council website developed and hosted for online dissemination and sharing of information
14
Challenges
Local Government Monitoring Database (LGMD) not installed at lower level organs of the Council
Council staff have little knowledge on the use of ICT technology
Council website not updated regularly
Lack of Intercom system for easy communication within the Council building
LAN not fully developed
Inadequate ICT infrastructure such as Servers, Routers, computers, low bandwidth etc.
Shortage of staff
Way forward
Extend LGMD to lower level organs of the Council
Train all staff on effective use of ICT technology
Recruit new staff
Install Intercom system for easy communication within the Council building
Build LAN for the Meru District Council to facilitate E-Government
Strengthen ICT infrastructure
Objective E: Enhance Good governance and administrative services
The programme on enhancing good governance and administrative skills is organized through the departments of human resource and administration, finance and planning .During the plan period the achievements under each department are as follows:
(a) Human Resources and Administration
Achievements The Council had 3,857 employees against an approved establishment of 4,461 in 2016
Human capital Management Information System was installed and is functional
Management of personnel records have been improved through the Human capital Management Information System (LAWSON)
Cases reported to the courts declined from 10 in 2011/2012 to 3 in 2015/2016. The District Council won 2 cases out of 3 that were decided in 2015/2016
Six (6) departments that were under acting heads of departments were filled with substantive Heads of Departments
Challenges
Weak Management Information systems in the Council Registry e.g. misplacement of files
Lack of training programme
Unreliable infrastructure e.g. electricity and internet connections
Shortage of staff in specific fields
Lack of induction and orientation programme
15
Delays in approving recruitment permits
Low awareness on the use of OPRAS
Low awareness of rules and regulations by staff
Lack of succession plan
Way forward
Strengthen manpower planning including succession plan
Install alternative/standby power supply
Strengthen Management Information System – Registry
Improve staff awareness and capacity on the use of OPRAS
Develop and implement a training programme
Raise staff awareness on rules and regulations
(b) Finance
The programme under finance focused on improving financial management systems, strengthening internal control systems, and building financial sustainability of Meru District Council.
Achievements
Collection of own source revenue improved from 70% in 2011/2012 to 97% in 2015/2016
Installation of EPICOR has improved financial and budget management systems
Internal audit system improved
Council financial statements prepared and audited in time each financial year
Compliance on tax collection and remittance improved.
Challenges
Intermittent power and system cutout i.e. Epicor and LGRCIS networks
Irregular and late disbursements of funds from the central government
Shortage of staff
Inadequate working facilities
Narrow revenue base for Council’s own sources
Voluntary compliance in revenue collection not fully adopted by the public
Inadequate space/business area for SMEs development
Low awareness of user departments on procurement Act and Regulations
Way forward
Install alternative/standby power supply
Improve Epicor and LGRCIS systems performance
Deepen and expand own sources of revenue
Recruit new employees and train existing staff for effective application of installed MIS
Improve availability of working tools
16
Raise awareness of user departments on procurement Act and Regulation
Strengthen revenue collection bylaws
(c) Planning
The programme under planning focused on improving coordination of policy preparation, review, data collection and analysis, and plan and budget preparation. The plan also aimed at improving resources mobilization for increased own source financing of District Council’s development plans.
Achievements
Mandatory plans for the Council were prepared and submitted to relevant organs in time
90% of projects implemented in District Council were monitored and evaluated each year
M&E reports for all evaluated projects were prepared and submitted to relevant organs in time
Quarterly and Annual Implementation reports were prepared and submitted in time
Annual plans at community level were prepared and submitted on time
Two policies i.e. Disaster management policy and environmental management policy were prepared
36 projects proposals were prepared and submitted to funding institutions out of which 17 projects were funded.
Challenges
Shortage of staff in specific fields
Shortage of working tools
Low awareness of PlanRep system by most staff in the Council
O&OD system not functioning
Weak M&E System
Inadequate compliance to Reporting formats
Way forward
Strengthen and administer the O&OD system
Procure computers and other electronic devices for data management
Build staff capacity on data collection, analysis and their application
Establish database for the Council
Strengthen resources mobilization systems and capacity
Strengthen M&E system Objective F: Management of natural resources and environment sustained (a) Environment and Sanitation Management The core functions under environmental and sanitation management are:
Environmental management which includes:
17
o Solid waste management – facilities and capacities - cleaning of solid waste in buildings, open space and drainage channels - Solid waste storage, sorting and transportation - Sanitation disposable of solid waste and dump site management
Environmental Management - Conservation and bio-diversity - Pollution control on land, water, air and sound - Environmental impact assessment
Achievements The main achievements recorded under the programme during the plan period are as follows:
126 tons of waste out of 241 tons of waste produced daily in urban areas along Arusha – Moshi highway collected daily (60% of waste produced daily)
5% of solid waste sorted and recycled/re-used (mainly plastic and metal material)
Increased awareness on collection and storage of solid waste at household level
Environmental impact assessment conducted on 40 projects by 2016
Challenges
Inadequate waste collection equipment, storage and disposal facilities
Shortage of staff (only one staff for the whole district)
Lack of dumping site
Illegal excavation of building materials e.g. stones and sand (quarrying)
Deforestation
Encroachment of water sources
Low involvement of local area administration in EIA and EA Increasing incidences of drought, floods and hurricanes due to effects of climate change
Absence of sanitary landfill
Inadequate onsite sanitation facilities – septic tanks, VIP toilets Way Forward
Improve availability of equipment and facilities
Recruit additional staff
Construct dumping site
Develop collection sites and storage facilities
Raise community awareness on environmental management
Expand recycling and re-use of solid waste
Strengthen application of environmental conservation laws, rules and regulations
Formalise and regularise of settlements
Develop and implement climate change mitigation strategies
construction of sanitary landfill
18
(b) Lands and human settlement The programme focused on land use planning, survey, valuation and preparation of title deeds.
Achievements The main achievements for the plan period include:
20 detailed land use plans containing 11,000 plots (target 2,000 plots) were prepared by 2016
3 village land use management plans and 9 village land use plans were prepared
187 sq. Km of land Master plan was prepared
2,000 farms and plots surveyed (disaggregate)
500 title deeds were issued
1,947 customary rights of occupancy were issued Challenge
Lack of District land use plan
Long standing conflicts on village boundaries
Changes on policies and regulations (affordability of premiums and charges)
Low level of community awareness on land policies, laws, regulations and directives
Political will and political interference on land management
Inadequate equipment and staff
Changes on land uses and impact on sustainable development eg estate change to peasant or residential
Way forward
Prepare district land use plan
Expedite land use planning, surveying and issuance of title deeds
Raise awareness on land policies, laws, regulations and directives
Strengthen regulations and policies on land management
Strengthen Ward and Village Land Councils
Expedite resolution of land conflicts
Prepare village land use management plans
Prepare and develop General detailed master plan for land use in all emerging small town and town centre for sustainable development
(c) Natural Resources The thrust of the programme under natural resources were to:
Ensure sustainable production and utilization of forestry and forestry products
Conserve, establish and develop existing forests
Enhance water flow by conservation and protection of water sources
Identify, develop and promote tourism
Promote Community participation in tourism
Develop and promote bee-keeping
Conserve and protect wildlife
Protect security of human beings against dangerous wildlife
19
Achievements
142 tree nurseries each with capacity 500 to 150,000 seedlings established by 2016
Number of trees planted increased from 807,000 in 2011 to 1,336,000 in 2016.
Average plant survival rate improved from 76% in 2011 to 80% in 2016
13,222 Ha forest reserves conserved
3.8 hectors of Kalanga forest have been recovered from encroachment
Usa river spring forest covering 30 Ha. were demarcated
90 village environmental conservation committees were formed
Seven new tourist attractions were identified
Production of honey increased from 10.8 tons in 2011 to 18.1 tons in 2016
Number of beehives increased from 4,950 (traditional 3,400 and modern1,550) in 2013 to 8,065 (traditional 6,015 and modern 2,050) in 2016
Crop farms damaged by wildlife reduced from 78 Ha. in 2011 to 31.3 Ha. in 2016
Challenges
Encroachment to forest reserves and water catchment areas
Deforestation
Shortage of staff
Inadequate resources (man power, tools and equipment)
Loss of wild life habitats due to agricultural activities, grazing and deforestation
Inadequate facilities for tourist centers like hand washing facilities, tents etc.
Ineffective promotion, advertisement and tourism marketing
Death of wildlife and loss of biodiversity influenced by climate change impacts eg drought, floods, winds, storms and rise in temperatures
Way forward
Improve tourist facilities
Promote and market tourism in the District
Promote development and conservation of community forests
Promote beekeeping at farm level
Recruit additional staff
Enhanced sustainable equal tourism
Develop and promote application of alternative source of energies which are environmental friendly.
Enhanced ecosystem management Objective G: Social welfare, gender equality and community empowerment improved
Meru District Council is endowed with a young population that is full of dynamism. Women are increasingly conscious of their position and are eager to learn. Girls being enrolled in primary and secondary schools are almost at par with that of boys. Performance in secondary schools, girls for most part outperforms the boys.
20
Social welfare and gender equality are essentially cross cutting issues and best addressed when programmes and strategies come from within the community themselves. The strategies articulated in the strategic plan aimed to involve the general public to address gender gaps.
Achievements
15 women water user groups were registered and enabled women to take up leadership roles in water projects. The groups have acquired water rights.
Percentage of women participating in management of water projects increased from 32% in 2011/2012 to 40% in 2015/2016.
105 women registered groups were assisted to access District Council Loans amounting Sh. 104,400,000.
97 economic groups were registered and managed to access loans amounting Sh. 63,500,000 from the District women and youth loans fund.
Children’s committees were established in every ward and every village to monitor and overseer children’s better livelihood and rights improvement
On average 250 orphanage and vulnerable pupils supported each year
Challenges
Shortage of staff i.e. there is no staff in six wards
Inadequate working gear.
Early marriages and pregnancies at early young age
Shortage of funds for women and youth projects.
Way forward
Recruit additional staff
Improve availability of working facilities and equipment
Improve awareness on gender equality
Strengthen women and youth empowerment programmes
Objective H: Emergence preparedness and disaster management improved The main objective is to coordinate, supervise disasters activities, assess and evaluate disaster impact
when it occurs and provide early warning information to alert the community on imminent incidences
of disasters. The main achievements recorded during the plan period are as follows:
Achievements
Stakeholders have been trained on management of disasters
Disaster management plan has been developed.
15 min weather stations for weather forecast have been established
21
Challenges
Destruction of infrastructures like roads and bridges during the disasters.
Absence of safe area for building temporary settlement during the flood occurrence.
Inadequate knowledge among the communities on disaster management
Insufficient information and delays in disseminating weather and other related information on
disaster forecasts
Most of the settlements in Meru District Council are located in high and lowlands which are more
vulnerable/prone to risk and disasters impact.
Way forward
Restrict people from building in catchment areas, lowlands and very close to river to shift.
Set aside open areas for temporary settlement during the disasters.
Improve collection and dissemination of warning information.
Build capacity of community committee on the prevention, reduction and preparedness for
disaster management.
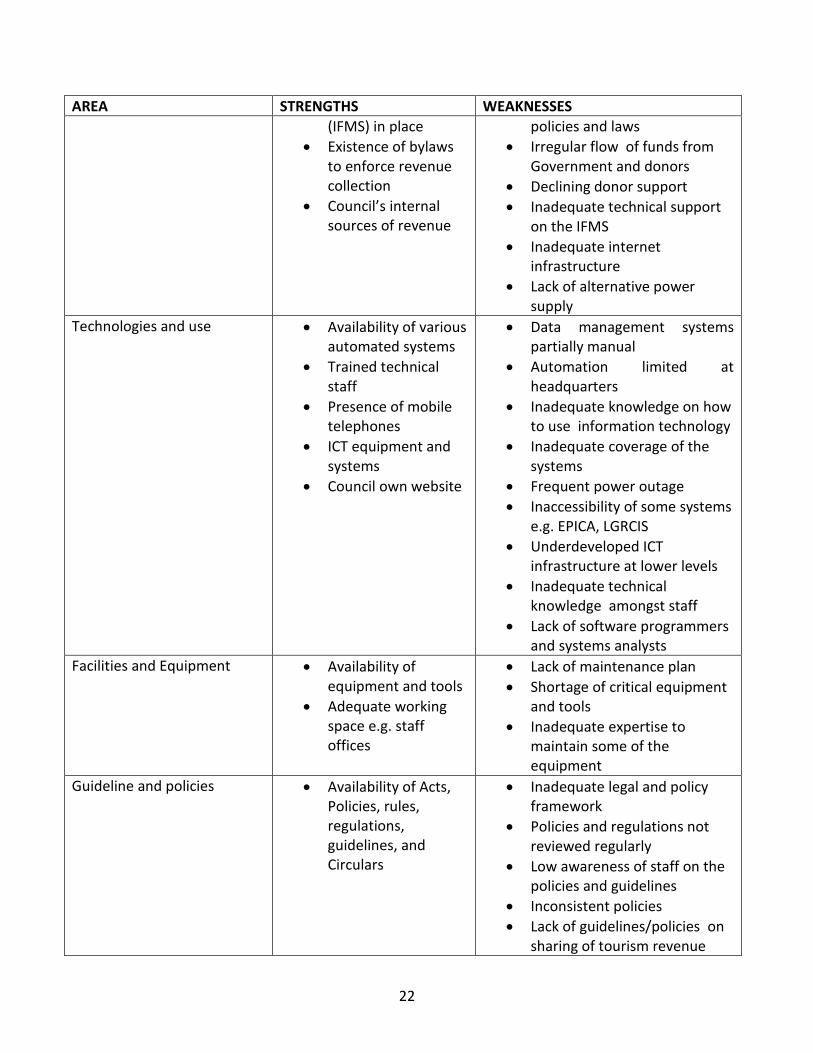
2.8 Internal Self Assessment
An internal self assessment identified areas of strengths and weaknesses of the District Council. The strengths and weaknesses (areas of improvement) that were identified are shown in Table 2.3.
Table 2.3: MDC’s Strengths and Weaknesses (Areas of Improvement)
AREA STRENGTHS WEAKNESSES
Human Resources Key staff have technical/professional skills and knowledge to perform their jobs
Transparent recruitment system
Low staff turnover
Low level of absenteeism
Government Acts, policies, regulations and procedures
Lack of staff incentive policy/scheme
Shortage of staff in specialized fields
Ineffective training programme
Performance system not based on realistic/reliable work plans
Low awareness of schemes by staff
Shortage of funds to support training
Under-utilization of staff due to lack of requisite infrastructure/facilities
Financial resources Government subvention and donor support
Integrated Financial Management System
Low revenue collection from own sources
High dependence on external financing
Low awareness of existing
22
AREA STRENGTHS WEAKNESSES
(IFMS) in place
Existence of bylaws to enforce revenue collection
Council’s internal sources of revenue
policies and laws
Irregular flow of funds from Government and donors
Declining donor support
Inadequate technical support on the IFMS
Inadequate internet infrastructure
Lack of alternative power supply
Technologies and use Availability of various automated systems
Trained technical staff
Presence of mobile telephones
ICT equipment and systems
Council own website
Data management systems partially manual
Automation limited at headquarters
Inadequate knowledge on how to use information technology
Inadequate coverage of the systems
Frequent power outage
Inaccessibility of some systems e.g. EPICA, LGRCIS
Underdeveloped ICT infrastructure at lower levels
Inadequate technical knowledge amongst staff
Lack of software programmers and systems analysts
Facilities and Equipment Availability of equipment and tools
Adequate working space e.g. staff offices
Lack of maintenance plan
Shortage of critical equipment and tools
Inadequate expertise to maintain some of the equipment
Guideline and policies Availability of Acts, Policies, rules, regulations, guidelines, and Circulars
Inadequate legal and policy framework
Policies and regulations not reviewed regularly
Low awareness of staff on the policies and guidelines
Inconsistent policies
Lack of guidelines/policies on sharing of tourism revenue
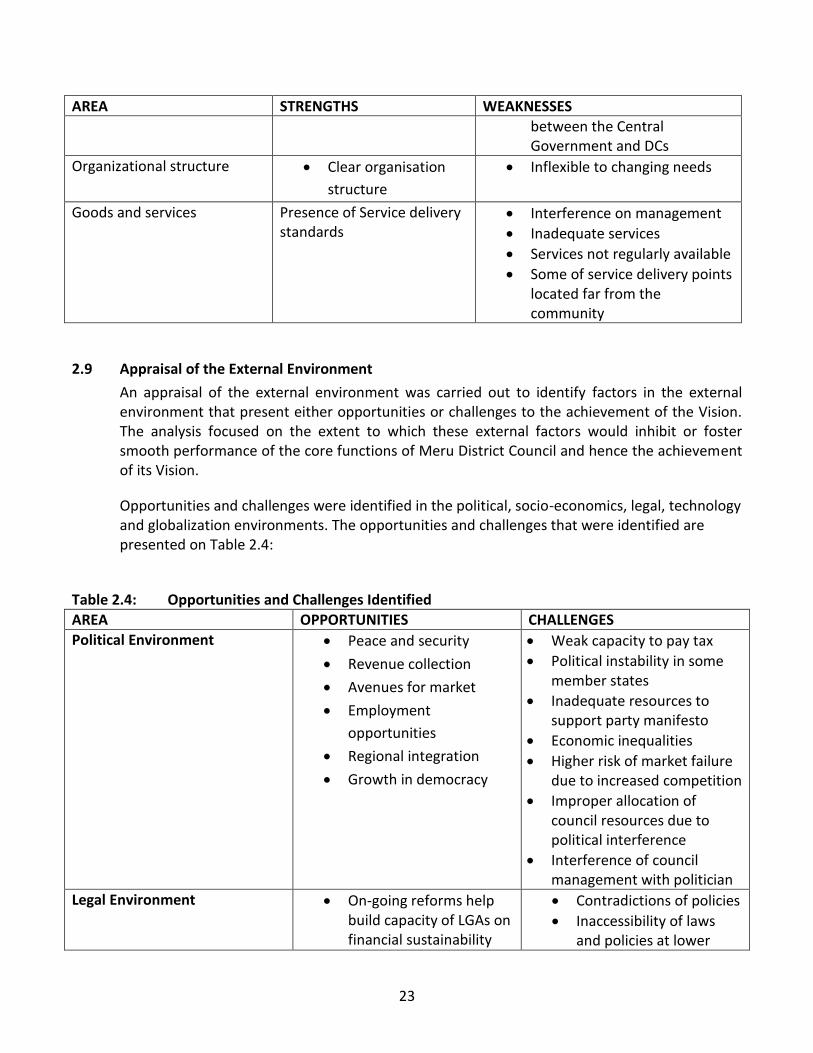
23
AREA STRENGTHS WEAKNESSES
between the Central Government and DCs
Organizational structure Clear organisation
structure
Inflexible to changing needs
Goods and services Presence of Service delivery standards
Interference on management
Inadequate services
Services not regularly available
Some of service delivery points located far from the community
2.9 Appraisal of the External Environment
An appraisal of the external environment was carried out to identify factors in the external environment that present either opportunities or challenges to the achievement of the Vision. The analysis focused on the extent to which these external factors would inhibit or foster smooth performance of the core functions of Meru District Council and hence the achievement of its Vision.
Opportunities and challenges were identified in the political, socio-economics, legal, technology and globalization environments. The opportunities and challenges that were identified are presented on Table 2.4:
Table 2.4: Opportunities and Challenges Identified
AREA OPPORTUNITIES CHALLENGES
Political Environment Peace and security
Revenue collection
Avenues for market
Employment
opportunities
Regional integration
Growth in democracy
Weak capacity to pay tax
Political instability in some member states
Inadequate resources to support party manifesto
Economic inequalities
Higher risk of market failure due to increased competition
Improper allocation of council resources due to political interference
Interference of council management with politician
Legal Environment On-going reforms help build capacity of LGAs on financial sustainability
Contradictions of policies
Inaccessibility of laws and policies at lower
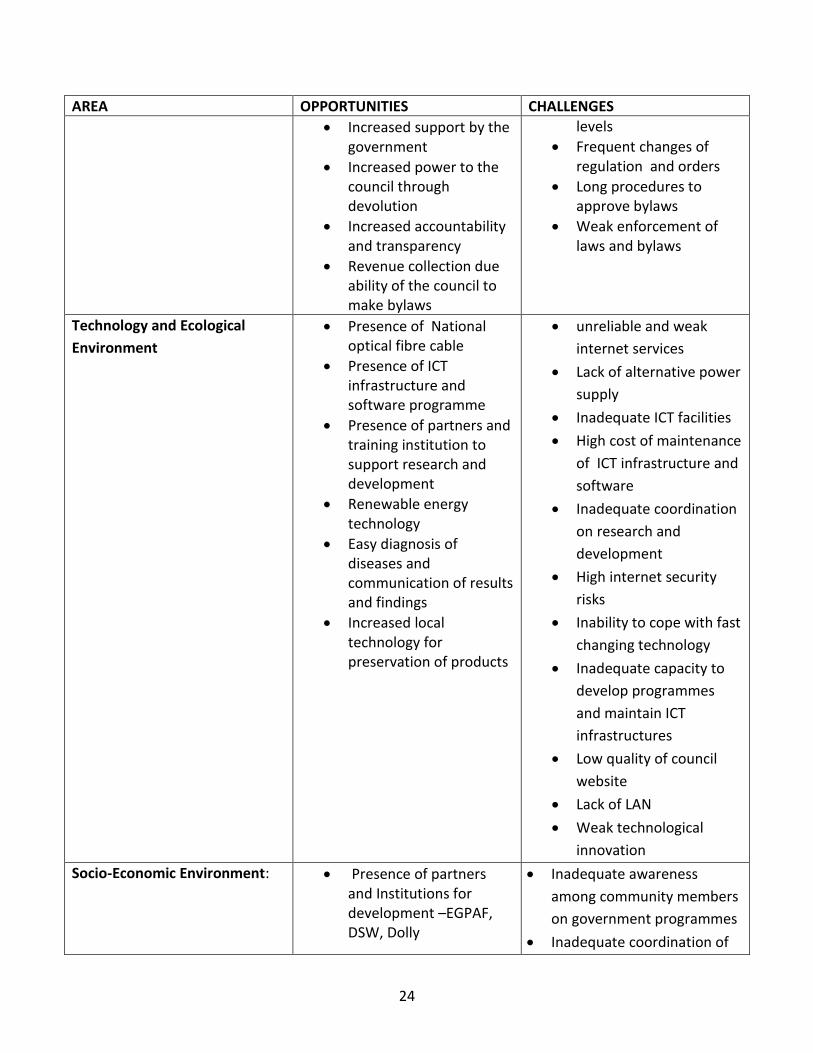
24
AREA OPPORTUNITIES CHALLENGES
Increased support by the government
Increased power to the council through devolution
Increased accountability and transparency
Revenue collection due ability of the council to make bylaws
levels
Frequent changes of regulation and orders
Long procedures to approve bylaws
Weak enforcement of laws and bylaws
Technology and Ecological
Environment
Presence of National optical fibre cable
Presence of ICT infrastructure and software programme
Presence of partners and training institution to support research and development
Renewable energy technology
Easy diagnosis of diseases and communication of results and findings
Increased local technology for preservation of products
unreliable and weak
internet services
Lack of alternative power
supply
Inadequate ICT facilities
High cost of maintenance
of ICT infrastructure and
software
Inadequate coordination
on research and
development
High internet security
risks
Inability to cope with fast
changing technology
Inadequate capacity to
develop programmes
and maintain ICT
infrastructures
Low quality of council
website
Lack of LAN
Weak technological
innovation
Socio-Economic Environment: Presence of partners and Institutions for development –EGPAF, DSW, Dolly
Inadequate awareness
among community members
on government programmes
Inadequate coordination of
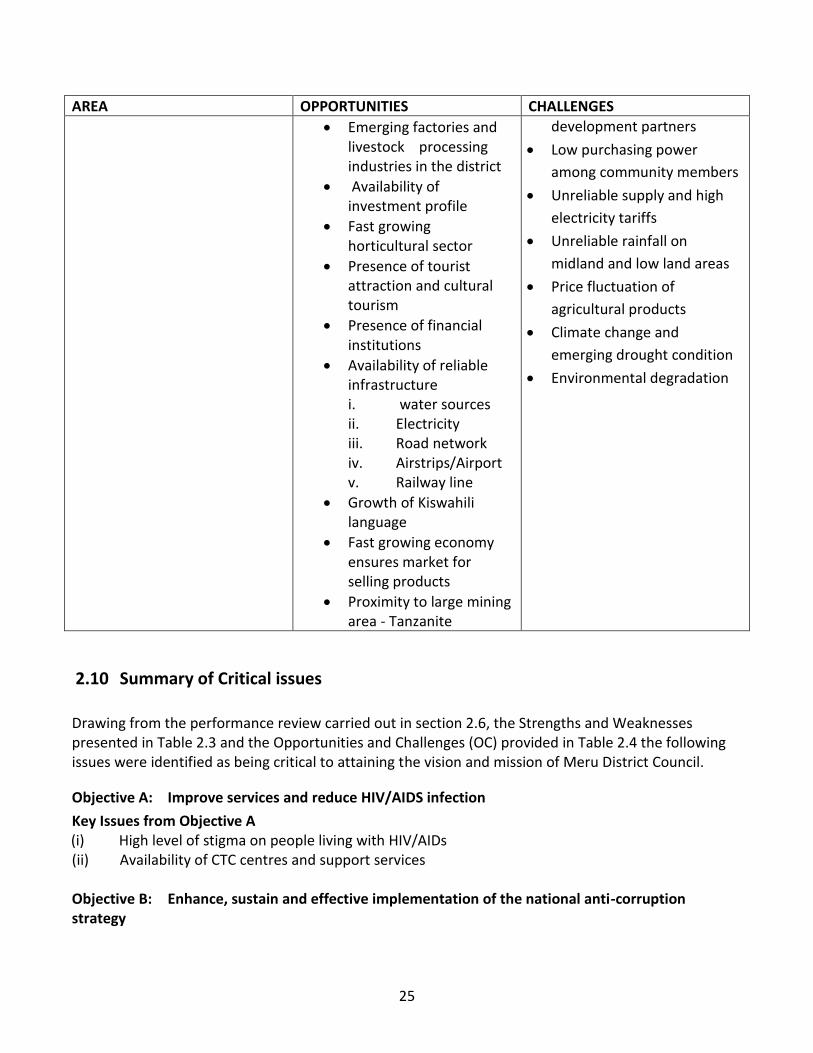
25
AREA OPPORTUNITIES CHALLENGES
Emerging factories and livestock processing industries in the district
Availability of investment profile
Fast growing horticultural sector
Presence of tourist attraction and cultural tourism
Presence of financial institutions
Availability of reliable infrastructure i. water sources ii. Electricity iii. Road network iv. Airstrips/Airport v. Railway line
Growth of Kiswahili language
Fast growing economy ensures market for selling products
Proximity to large mining area - Tanzanite
development partners
Low purchasing power
among community members
Unreliable supply and high
electricity tariffs
Unreliable rainfall on
midland and low land areas
Price fluctuation of
agricultural products
Climate change and
emerging drought condition
Environmental degradation
2.10 Summary of Critical issues
Drawing from the performance review carried out in section 2.6, the Strengths and Weaknesses presented in Table 2.3 and the Opportunities and Challenges (OC) provided in Table 2.4 the following issues were identified as being critical to attaining the vision and mission of Meru District Council.
Objective A: Improve services and reduce HIV/AIDS infection
Key Issues from Objective A (i) High level of stigma on people living with HIV/AIDs (ii) Availability of CTC centres and support services Objective B: Enhance, sustain and effective implementation of the national anti-corruption strategy
26
Key issues from Objective B (i) Ethics and good citizenship (ii) Corruption prevention and enforcement (iii) Code of conduct and compliance Objective C: Increase access, quality and equitable social Services delivery
Issues from Objective C- Health Services (i) Shortage of staff in specialised fields - number (ii) Supply of medical equipment and supplies (iii) Waste collection facilities and dumping sites (iv) Health service infrastructure Issues on Education Services (v) Education infrastructure (classrooms, teachers’ houses etc) (vi) Mathematics and science teachers (vii) Capitation for effective teaching and evaluation (viii) Land for development of education infrastructure e.g. teachers houses and sports and games (ix) Training equipment, chemicals and supplies (x) Frequent changes in curricula with little involvement and preparation of key stakeholders Issues on Water services (xi) Critical skills specifically design and structural engineers (xii) Irregular flow of funds (xiii) Destruction of water infrastructure mainly during dry season (xiv) Water with high content of fluorine especially in Imbaseni and Maji ya Chai wards (xv) Dumping site and wastewater management ponds (xvi) Drought and declined availability of water Objective D: Increase quantity and quality of economic services and infrastructure
(i) Extending LGMD to lower level organs of the Council (ii) Staff capacity and effective use of ICT technology (iii) Compliance with construction standards (iv) Community participation in infrastructure construction (v) Availability of plant and equipment (vi) Production of local area research based extension recommendations (vii) Business environment for faster industrialization (viii) Crop and livestock product markets (ix) Development of cultural and tourism in general (x) Food security and nutrition
Objective E: Enhance Good governance and administrative services
(i) Management of O&OD system (ii) Capacity of M&E system (iii) Resources mobilization systems and capacity
27
(iv) Database for effective planning and functioning (v) Financial sustainability (vi) Systems performance and reliability (vii) Intermittent power and systems cutout i.e. Epicor and LGRCIS networks (viii) Reliability of Systems and ICT infrastructure e.g. electricity and internet connections (ix) OPRAS and its application (x) Staff development and succession planning (xi) Record management system – functioning of the registry
Objective F: Management of natural resources and environment sustained Key issues
i) Waste collection equipment, storage and disposal ii) Dumping site iii) Illegal excavation of building materials e.g. stones and sand (quarrying) iv) Encroachment of water sources v) District land use plan vi) Long standing conflicts on village boundaries vii) Encroachment of forest reserves and water catchment areas
viii) Deforestation ix) Declining wild life habitats x) Promotion, advertising and tourism marketing. xi) Climate change and increasing risk of disasters
Objective G: Social welfare, gender equality and community empowerment improved
(i) Early marriages and pregnancies at early young age
(ii) Availability of working facilities and equipment
(iii) Women and youth empowerment
Objective H: Emergence preparedness and disaster management improved
(i) Safe area for temporary settlement on event of disasters
(ii) Reliable weather information and other related information for disaster forecasting
(iii) Settlements in areas prone to high risk of disaster impact
28
CHAPTER THREE
THE MEDIUM TERM STRATEGIC PLAN
3.1. Introduction The previous chapter presented the results of situation analysis, and summarized the critical issues for attaining the vision and mission of Meru District Council. This chapter presents the strategic direction and focus, strategic objectives, strategies and targets. Details of the plan including the key performance indicators and lead implementers are presented in Appendix 3.
3.2 Vision, Mission and Core Values
3.2.1 Vision
“A well educated, food secure medium income community anchored on agro-based industries and eco-tourism by 2025”
3.2.2 Mission Statement The Mission of Meru District Council is: “To empower communities innovatively and sustainably use available resources to attain medium income status by 2025” 3.2.3 Core Values
The building of a cohesive and binding organizational culture is a fundamental pre-requisite for the sustainable development of the District. The following are the core values which guides Meru District Council’s institutional culture.
Integrity: Being exemplary in our behavior and acting with honesty and impartiality in all our transactions.
Team Work: We always accomplish our mission as a team.
Transparency: Being transparent in all our work and dealings and stand ready for public scrutiny.
Accountability: Being accountable to our stakeholders and to the community for the mandate and responsibilities bestowed upon the Council.
Innovativeness: We are always curious and striving to reach out and embrace new technologies and methods of doing our work and contributing to socio-economic development
3.3 Strategic Direction and Focus
This Medium Term Strategic Plan covers the period from 2016/17 to 2020/21. The plan is aligned to Tanzania Development Vision 2025, National Second Five Year Development Plan (2016 – 2021), Arusha Region’s development strategy and strategies of relevant sectors. The plan is built on the identified opportunities and challenges arising from socio-economic, political, technological and legal frameworks, achievements and challenges experienced in implementing Council’s MTSP (2011/12 – 2015/16), as well as the
29
expectations from the stakeholders. In line with the vision and mission, the plan for the coming 20 years will focus on building vibrant agro-based industries and intensification of agriculture, livestock, forestry, tourism and book-keeping in order to transform the community living in Meru District Council into a medium income status by 2025. 3.3 Strategic Objectives, Strategies and Targets
3.3.1 Introduction
The overall goal of Meru District Council is to have a well educated, food secure medium income community anchored on agro-based industries by 2025. The plan spells out priority areas that contribute towards achieving this overall goal. The plan is anchored on creating favourable conditions for diversification and intensification of agriculture, livestock, tourism, bee-keeping and agro-based industries by taking advantage of the rich traditions and culture, a young energetic population, and the strong tradition in agriculture and dairy farming. It also takes advantage of the emerging opportunities opening in processing agricultural and livestock products. The food chain could be linked with the fast growing tourism and industrial sectors in Arusha City.
The plan also sets to enhance the internal capacity of the Council to innovate, develop and undertake flagship projects that will generate sustainable financial resources, impact on community services, and improve business and operations systems. The following sections present a description of the strategic objectives, strategies and targets that will guide the MDC for the next five years in achieving its vision and mission.
Key Issue A: Prevalence of new VVU/ HIV infection in urban and rural areas Meru District Council recorded a drastic fall in HIV prevalence from 6% in 2012 to 0.8% in 2016. But this statistic might be misleading because very few people turned up for HIV/ AIDS testing. Many do not volunteer to test because of lack of awareness, social and cultural believes. Several people in the District engage in practices that increase risk of sexual transmission of HIV before and during marriage. To ensure the community stays healthy and productive concerted measures will be taken to ensure new HIV/AIDS cases do not appear. Strategies and targets for achieving this objective are as set out in the following sections.
Strategic Objective A: Services Improved and HIV/Aids Infection Reduced Strategy A1: Enhance AIDS testing, prevention, treatment and care
Targets
A1.1: HIV/AIDS infection rate reduced from 0.8% to 0.5% by June 2021
A1.2: Number of clients in care and treatment (CTC) increased from 8,278 to 10,000 by
2021
A1.3: 90% of all dispensaries and health centres equipped with HIV testing kits by 2021
A1.4: Maternal to child HIV transmission (MTCT) eradicated by 2021
30
A1.5: 50% of MDC ward have active home-based care service providers by 2021
A1.6: 80% of orphanage and vulnerable children supported each year with effect from
July 2017
Strategy A2: Raise community awareness on HIV/AIDS transmission, prevention and testing Targets A2.1: Awareness sessions on transmissions of VVU/HIV conducted in 26 wards by 2021 A2.2: People living with HIV (PLHIV) supported to start/run income generating activities
in 90 villages by 2021 A2.3: W-MAC and V-MAC in 26 wards strengthened and supported by 2021 A2.4: Education on prevention and control of HIV introduced in all primary and
secondary schools by 2021
Key Issue B: Combating Corruption Corruption perception index produced by Transparency International indicates the level of corruption in Tanzania is high. But corruption is a dangerous disease just like cancer. No society can achieve equitable and sustainable development if it allows corruption to thrive. Likewise, corruption is clearly incompatible with the aspirations of the plan of empowering the community to attain medium income status by 2025. This plan aims to change mindsets of staff and the community in Meru District Council in order to create an ethical society, free from corrupt behavior and compliant with laws, rules, regulations and procedures. Strategies and targets for achieving this aim are as set out in the following sections.
Objective B: Implementation of the National Anticorruption Strategy effectively enhanced and sustained
Strategy B1: Scale up implementation of NACSAP and application of PCCA 2007 and PSA 2005
Targets
B1.1: Ethics Committees established and functioning at all levels of the Council up to
village level by 2021
B1.2: Code of conduct reviewed and deployed in units of the Council by 2021
B1.3: Ethics and anti-corruption studies introduced in all schools in the District
B1.4: Perception of incidences of corruption in Meru District Council reduced by 2021
31
Key Results Area C: Availability and Quality of Social Services
Availability and quality of social services have a bearing on quality of life in society. Access to quality services, particularly health, education and water are essential to improved living standards. The opposite is also true. Lack of health services for example, could result into people dying at young age, the age when they are expected to be more productive. High illiteracy rate has implications on quality of labour. An illiterate labour risks the country from being bypassed by science and technology.
The vision of a medium income society requires a healthy, literate and educated community that is able to identify opportunities and make use of science and technology to harness resources for its sustainable development. The situation analysis presented in Chapter two shows Meru District is below national standards in some of the key indicators in health, water and education. About 76% of the community in the District has access to health services, and less than 65% of the community has access to clean and affordable water. The plan sets to improve access and quality of social services so as contribute to attaining the vision of medium income society by 2025. The strategies and targets to be implemented in the next five years are set out by each sector in following sections.
C1: Health Services Access to health services is hampered by shortage of health facilities, medicines, medical supplies, and human resources. The district has two hospitals, 9 health centres and 42 dispensaries in 26 villages out of 72 villages. There are 469 Health care workers while the requirement is 802 staff. Essential medicines, medical equipments and medical supplies suffice for only 45% of the requirement. The strategies and targets for improving access and quality of health services are set out below.
Objective C1.1: Population accessing quality health care services at all levels increased to 90% by June 2021
Strategy C1.1: Improve health facilities/infrastructure Targets C1.1.1: Eight (8) new dispensaries constructed by 2021 C1.1.2: Two (2) operating theatres in 2 Health Centres established by June 2021 C1.1.3: Five (5) placenta pits and six (6) incinerators constructed at health facilities
by 2021 C1.1.4: Solar systems installed in 8 Health Facilities by June 2019 C1.1.5: Water system installed in 7 dispensaries by June 2020 C1.1.6: 10 dispensaries and 2 health centres renovated by June 2021
32
Strategy C1.2: Improve Maternal Health services
Targets C1.2.1: Maternal mortality rate reduced from 24/100,000 to 10/100,000 by June
2021 C1.2.2: Neonatal mortality rate reduced from 7/1,000 to 2/1,000 live birth by 2021 C1.2.3: Under five mortality rate reduced from 4/1,000 to 0/1,000 live birth by
2021 C1.2.4: Immunization coverage of basic antigens increased from 85% to 100% by
June 2021 Strategy 1.3: Improve referral system and supervision Targets C1.3.1: Disease case management system improved from 78% to 90% by June 2021 C1.3.2: Availability of medicines, medical equipment, Hospital supplies and
diagnostic supplies increased from 70% to 80% by June 2021 C1.3.3: Outreach/mobile clinics services increased from 17 sites to 25 sites by June
2021
Strategy C1.4: Raise community awareness on health issues
Targets C1.4.1: Health facilities and service delivery increased from 70% to 100% by 2021 C1.4.2: Households enrolled to community health fund (CHF) increased from 17%
to 30% by 2021 C1.4.3: Members from venerable groups accessing to social welfare services
increased to 50% by 2021. C1.4.4: Contraceptive protection rate increased from 59% to 80% among couples
by 2021
C2: Education Services The plan aims to improve student enrollment and performance in primary and secondary education so as to eradicate illiteracy by 2025. The factors contributing to low pass rates and student dropout from schools have been identified to include shortage of school infrastructure, working tools and equipment, human resources and strenuous learning environment. The strategies and targets aiming at addressing the challenges are set out for primary and secondary schools in the following sections.
(i) Primary Education
The plan for primary education aims to sustain provision of compulsory education and improve the quality and relevance of education. The focus is to ensure all children of school going age are enrolled in schools and stay in school until they graduate to enter secondary education. The objectives, strategies and targets for the plan period are as follows:
33
Objective C2.1: Student’s pass rate in Std. VII examinations increased from 65.5% to 80% by June 2021.
Strategy C2.1.1: Improve availability of education infrastructure
Targets
C2.1.1.1: 100 classrooms with capacity to accommodate 4,000 students constructed by June, 2021
C2.1.1.2: 475 toilet stances for boys and 634 stances for girls in 42 primary schools constructed by June, 2021
C2.1.1.3: 112 teacher’s houses (6 in one) constructed by June 2021 C2.1.1.4: 356 desks supplied to schools by June 2021 C2.1.1.5: 50 libraries constructed for 50 primary schools by 2021 C2.1.1.6: 51 schools equipped with 10 Computers each by June 2021
Strategy C2.1.2: Improve learning environment Targets C2.1.2.1: 224 reading corners for standards 1 & 2 in all 112 primary schools established
by June 2021 C2.1.2.2: All pupils in 112 primary schools served with lunch by 2021 C2.1.2.3: Requisite infrastructure for the disabled established in all primary schools by
2021 Strategy C2.1.3: Improve curriculum delivery Targets C2.1.3.1: 1,200 teachers trained in Mathematics, Science and English by June 2021 C2.1.3.2: Inclusive education system introduced in 112 primary schools by 2021 C2.1.3.3: 225 specialist teachers trained by June 2021 C2.1.3.4: Each pupil served with at least one text books for each subject by June 2020 C2.1.3.5: Quality assurance systems and supervision strengthened by June 2021 C2.1.3.6: Education and school management at all levels improved by 2021
Objective C2.2: Literacy rate for adults increased from 95.8% to 98% by June 2021
Strategy C2.2.1: Expand enrolment in COBET, ICBAE and VTCs
Targets
C2.2.1.1: Number of COBET students increased from 220 in 2016 to 350 by 2021 C2.2.1.2: Number of ICBAE learners increased from 5,549 in 2016 to 8000 by June
2021 C2.2.1.3: Number of students in Vocational Training Centres increased from 396 in
2016 to 706 by June 2021
34
C2.2.1.4: Number of trained facilitators in COBET increased from 10 in 2016 to 20 by June2021
(ii) Secondary Education
The plan focuses on expanding availability of education services and improving quality and relevance of education in general. The aim is to ensure all qualified students are enrolled in secondary schools and graduate with best results. The objectives, strategies and targets for the plan period as follows:
Objective C2.1: Students enrolment in secondary schools increased from 12,736 to 18,000 by June 2021 Strategy C2.1.1: Improve availability of education infrastructure Targets
C2.1.1.1: 65 classrooms with capacity to accommodate 2,000 students in 12 schools constructed by June, 2021
C2.1.1.2: 60 teachers’ houses constructed by June 2021 C2.1.1.3: 31 laboratories and 10 libraries constructed and retooled by June 2021 C2.1.1.4: 10 dormitories with capacity to accommodate 1,200 students constructed in
three schools by June 2021 C2.1.1.5: 138 toilet stances in 23 secondary schools for both teachers and students
constructed by June 2021 C2.1.1.6: Three schools upgraded into models schools by 2021 C2.1.1.7: All government schools equipped with requisite infrastructure for the disabled
by 2021 C2.1.1.8: 20 computer laboratories constructed by June 2021
Strategy C2.1.2: Improve learning environment
Targets
C2.1.2.1: 26 secondary school students’ provided with meals by June 2021 C2.1.2.2: 15 secondary schools provided with clean water and electricity supply by June
2021 C2.1.2.3: Students book ratio improved from 1:3 to 1:1, 10,000 books procured and
distributed to 29 schools by 2021 C2.1.2.4: Availability of laboratory chemicals and equipment in all 29 schools improved by
June 2021 C2.1.2.5: ICT infrastructure constructed and 240 computers installed in 20 schools by
2021 C2.1.2.6: Availability of transport facilities improved by June 2021
35
Objective C2.2: Students pass rate in Form II, IV and VI increased from 82%, 77% and 89% respectively to 100% by June 2021
Strategy C2.1.3: Improve curriculum delivery Targets C2.1.3.1: Business and ICT subjects introduced in 20 schools by 2021 C2.1.3.2: 1,044 teachers trained through professional development programmes by 2021 C2.1.3.3: Quality assurance systems and supervision strengthened by June 2021 C2.1.3.4: School management in all schools improved by 2021
Strategy C2.1.4: Promote sports, games and culture Targets
C2.1.4.1: Sports and games in all schools strengthened by June 2021 C2.1.4.2: District sports stadium constructed by June 2021
C2.1.4.3: One sports academy established by 2021
C2.1.4.4: 20 cultural heritage centres established by 2021
C3: Water Services Meru District is endowed with numerous sources of water, but due to climate change the quantity and quality of water from these sources is invariably diminishing. Furthermore, because of intermittent drought and increasing human and livestock population there is increased pressure to provide water for domestic and economic activities.
Available water supply schemes had focused mainly on providing clean and safe water for domestic use. There is now eminent competition for water between domestic use and water for irrigation or other economic activities. There is also completion for water between people and animals. These new developments call for innovative ways of harvesting and developing efficient water management systems. The strategies and targets for improving access and quality of water for the next five years are presented in succeeding sections. Objective C3.1: Population accessing clean and affordable water services increased from 64% in 2016 to 85% by June 2021
Strategy C3.1: Improve availability of water Targets C3.1.1: 10 water supply scheme that are under construction completed and
functioning by June 2019 C3.1.2: Five (5) water projects rehabilitated by June 2021 C3.1.3: 20 new water supply schemes under water sector Development Programme
(WSDPII) constructed and functioning by June 2021 C3.1.4: 10 rain water harvesting storage tanks with capacity of 30,000 litres each
constructed by 2020.
36
Strategy C3.2: Strengthen Management of Water Schemes Targets C3.2.1: Village by Laws reviewed and strengthened by 2021 C3.2.2: 30 COWSOs established and strengthened by 2021
Strategy C3.3: Improve hygiene and sanitation practices Targets C3.3.1: 150 toilet stances in schools rehabilitated and constructed by 2021. C3.3.2: 15 school committees and 25 sanitation clubs trained on sanitation and hygiene
by 2021 C3.3.3: Number of houses with improved toilets increased from 80% to 90% by 2021 C3.3.4: Damping site and waste water treatment ponds constructed by 2021 Strategy C3.4: Strengthen service provision capacity Targets C3.4.1: Availability of requisite working equipment and tools improved by June 2021 C3.4.2: 10 department staff trained on relevant professional skills by 2021
Key Result Area D: Quality and quantity of economic service and infrastructure
Quality economic services and infrastructure are vital for sustainable development of the District. These types of services drive the economy and provide the means of livelihoods to more than 90% of the population in Arumeru District. Economic services sector comprises agriculture, livestock, fisheries, natural resources, and tourism. The sectors that make up the economic infrastructure comprise construction and works, energy and communications.
D1: Agriculture and Cooperatives
Agriculture is the largest employer in Arumeru District. The sector employs more than 80% of the population and accounts for more than 50% of the District gross domestic product. The District is endowed with fertile soils suitable for various types of crops including perennials, legumes and horticultural crops. On average the District receives enough rain for production of most of the crops. But, increased land clearance, and unfriendly agricultural practices are denuding the soils and hence depleting its nutrients. The situation is getting worse as the effects of climate change become vivid. The south and eastern part of the District has recently started experiencing drought more frequent and flooding and strong winds are becoming a menace. These developments pose a challenge to the future of agriculture in the District.
The situation analysis conducted in the preceding chapter, identified the following key issues that addressing to improve performance of agricultural sector in the District:
Dependency on rain-fed agriculture and underdeveloped irrigation potential.
Declining natural resource base and environmental degradation
37
Low productivity
Under-developed agro-processing subsector
Unreliable markets and weak producers’ organizations
The plan sets to address these constraints as follows:
Objective D1: Food self sufficiency in Meru District Council increased from 70% to 90% by 2021 Strategy D1.1: Improve Land Management Practices Targets D1.3.1: Contour farming and terracing expanded in 6 villages by June 2021 D1.3.2: Agro-forestry farming practices intensified in 10 villages by June 2021 Strategy D1.2: Improve extension services Targets D1.2.1: Farmers accessing agricultural extension services increased from 66,387 to
102,134 by 2021 D1.2.2: Percentage of farmers using improved agricultural inputs increased from 70% to
85% by 2021 D1.2.3: 85% of farmers are using improved farming implements by 2021 D1.2.4: Post harvest losses for field and horticultural commodities reduced from 45% to
20% by 2021 Strategy D1.3: Expand land under Irrigation Targets D1.3.1: Area under irrigation increased from 12,600 ha to 15,200 ha by 2021 D1.3.2: 10 irrigation water users associations established and functioning by 2021 Strategy D1.4: Improve market information systems Targets D1.4.1: 50% of the farmers are selling their products directly final destination markets
by 2021 D1.4.2: Farmers’ sale prices for agricultural produces increased by 50% by 2021
38
Strategy D1.5: Strengthen producers’ organizations Targets D1.4.1: Network of village community banks (VICOBA) and savings and credit
cooperative societies (SACCOS) established by 2021 D1.4.2: 26 new primary cooperatives formed and registered in the district by 2021 D1.4.3: Savings and capital fund VICOBA and SACCOS increased from Sh. 3.1billion to
Sh. 10 billion by 2021 D2: Livestock and Fisheries Livestock and specifically dairy farming is an important economic activity in the district. Despite the long experience in the sector, production is still low due to inadequate livestock infrastructures such as water troughs; inadequate livestock keepers skills and knowledge; limited supply of improved livestock breeds and prevalence of zoonotic diseases like anthrax, rift valley fever, tuberculosis and rabies, and conditional diseases like east cost fever, trypernasomiasis, lumpy skin diseases, foot and mouth diseases and anaplasmosis. The emerging drought is putting pressure on availability of pasture as there is acute shortage of grazing land and water. There is therefore, increased risk of animal mortalities not in the distant future. The proposed transformation aims to reduce herds for free grazing, increase meat and milk production, improve animal feed resources, animal resources genetic improvement, animal disease control, transfer of appropriate technological packages and farmer empowerment. Furthermore, the initiative has taken into consideration livestock marketing, utilization of by-products such as hides and skins, manure for increased crop production, and biogas as a renewable source of energy.
Presently fisheries sector is not important but it has huge potential if properly propagated. The strategies and targets for improving the livestock and fisheries subsector are set out below.
Objective D2: Production of livestock and fisheries increased by 2021.
Strategy D2.1: Improve livestock extension services Targets D2.1.1: Number of livestock extension staff increased from 42 to 118 by 2021 D2.1.2: 71 extension staff trained (26 trained on improved pasture management, 10
on artificial insemination and 35 on ICT) by 2021 D2.1.3: Average production of livestock increased from 55% to 80% by 2021 D2.1.4: 90% of livestock population vaccinated against preventable diseases by 2021
39
D2.1.5: All farm animals identified, registered and traced as per Livestock Act no 12 of 2010 by 2021.
Strategy D2.2: Improve livestock and fisheries infrastructure Targets D2.2.1: Six (6) dip tanks, 3 boreholes, 26 slaughter houses and 3 primary livestock
markets rehabilitated by June 2021 D2.2.2: One fish hatchery constructed by June 2021 D2.2.3: Two (2) milk processing mini plants and 5 milk collection centred constructed
by June 2021 D2.2.4: One hides and skins processing industry established by June D2.2.5: Pasture management practices in 50 villages improved by 2021 Objective D3: All roads in the District are passable throughout the year by 2021
Strategy D3.1: Improve road network Targets D3.1.1: 5km of gravel road improved to tarmac standard by 2021 D3.1.2: Upgrade 45km of earth roads to gravel standard by 2021 D3.1.3: 276km of gravel roads receives routine, spots and periodic maintenance by
2021 D3.1.4: 3 new bridges constructed by 2021 D3.1.5: 42 bridges rehabilitated and maintained by 2021 Strategy D3.2: Ensure compliance with building standards for private and public buildings Targets D3.2.1: Compliance with by-laws and public building regulations increased by June 2021 D3.2.2: All District public and private building sites inspected before and during
construction by 2021
Key Results Area E: Good governance and administrative services
Performance of Meru District Council is constrained by shortage of qualified staff especially at lower levels of government (Ward and Villages), staff housing, office equipment and working tools. Staff morale is affected by delayed promotions, long outstanding staff claims, uncertainty in career progression due to ineffective staff development policies and training programmes. These challenges are making it hard to exploit the maximum staff commitment of time and skills or professional knowledge. The Council has deployed OPRAS in staff performance review but the system is not backed by clear and realistic work plans. Besides staff are not fully aware of how to properly fill the OPRAS forms and rank their performance. In such circumstances, it is no wonder staff performance awards are made arbitrarily.
40
On the other hand, Meru District Council has the basic ICT infrastructure but application of information and communication technology is low. There is neither local area network nor intercom facilities. Sharing of data and information within the organization and outside the organization is rather cumbersome. Most transactions are acted through papers. Requests for services or information by internal and external customers are transmitted through letters or forms and other requisitions. This process leads to delays in providing services to the public.
Besides, there is no clear ICT policy and strategy for replacement of hardware and software. This is evident in applications software that are not upgraded to keep up-to-date of the systems in place. Most of staff do not have office computers and there are no networked printers and photocopies/scanners. Likewise, computers and servers are not fitted with UPS. The Council also doesn’t have IT Security equipment like firewall or Cyberoam and there is no Internet and Intranet that would enable staff in the Council to share documents, bulletin boards and other communication facilities. The following strategies and targets will be deployed to address these challenges in order to improve the functioning of the District Council.
Objective E1: Meru District Council’s Performance Enhanced
Strategy E1.1: Improve working conditions Targets
E1.1.1: Alternative source of electricity/standby generator installed by June 2019
E1.1.2: The registry and record management system reviewed and improved by June
2020
E1.1.3: Availability of requisite working tools and equipment e.g. transport facilities,
computers, printers and photocopiers improved by June 2021
E1.1.4: Staff performance appraisal system and management of LAWSON system
improved by June 2021
Strategy E2.2: Improve staff capacity Targets E2.2.1: Staff Recruitment and Development Policies and strategies reviewed and
deployed by June 2019 E2.2.2: 604 staff recruited by June 2021 E2.2.3: Staff training programme reviewed and in use by June 2018 E2.2.4: On the job training conducted for 839 staff by June 2021 E2.1.5: Staff succession plan developed and deployed by June 2019
41
Strategy E2.3: Strengthen planning, monitoring and evaluation systems
Targets E2.3.1: Participatory planning teams revamped and functional in all villages with
effect from 2018 E2.3.2: 40 subject matter experts at District level trained on O&OD techniques and 20
staff trained on M&E skills by 2021 E2.3.4: 26 WDC committees and 90 village committees trained on O&OD techniques
by 2021 E2.2.5: M&E processes reviewed and an operating manual developed and put into use
by 2021 E2.2.6: Data base for council data collection developed and installed by 2021 Objective E2: Financial Sustainability enhanced by June 2021 Strategy E2.1: Expand and deepen revenue sources Targets E2.1.1: Own source revenue increased from Sh. 2.7 billion in 2015/16 to Sh.5.4 billion by
June 2021 E2.1.2: Bus stands established in 9 townships and equipped as revenue collection points
by 2020 E2.1.3: 20 new revenue collection points introduced by 2021
Strategy E2.2: Strengthen revenue management system
Targets
E2.2.5: Data management and recording system (LGMD) in 19 departments and sections improved by 2021
E2.2.6: Policies and strategies on Trade and business development reviewed by 2018 to facilitate growth of small and medium enterprise
E2.2.7: 30 point of sales installed and taxpayers’ database updated in LGRCIS by 2021
Strategy E2.3: Strengthen internal controls and financial management systems
Targets
E2.3.1: Risk management policy and framework reviewed by 2019
E2.3.2: MDC awarded clean audit certificate by external auditors throughout the plan period
E2.3.3: MDC fully compliant with PPRA Act 2011 and its Regulations of 2013 throughout the plan period
E2.3.4: Quality assurance systems strengthened by 2021
42
Strategy E2.4: Improve availability and application of Information and Communication Technology
Targets:
E2.4.1: ICT infrastructure and ICT application improved by 2021 E2.4.2: Display Devices installed at reception installed by 2021 E2.4.3: Intranet/portal and intercom devices installed in all Council offices by June 2021 E2.4.4: Biometric registration system established by 2019 E2.4.5: Local Area Network (LAN) infrastructure established and operational by June
2020 E2.4.6: Supply of internet bandwidth increased by June 2018 E2.4.7: CCTV Surveillance system installed to monitor incidences throughout the
Council building by June 2021 E2.4.8: LAN/WAN in 1 DH, 9 Health centres, 42 dispensaries install and connected to
LGHIS by 2021 E2.4.9: 26 PoS procured, configured and installed in 26 wards and connected to LGRCIS
by 2021
Key Results Area F: Management of natural resources and environment sustained
Meru District Council has over 13,397.8 ha of reserved forest and green belt covering 175.8 ha. But fast population growth and increased economic activities are exerting pressure of the existing forests. There already increased incidences of deforestation and bush fires. Such incidences if unchecked will deplete the forests. There is need to invent new forest management approach to save the indigenous forest and its biodiversity. The plan sets to expand forests surface and wood production (less and less for charcoal, mainly concentrating on furniture and construction industry) to allow for sustainable development. The old forests need to be safeguarded and massive new planting of trees with indigenous species should save the forests.
Currently the daily use of tree material for cooking and other economic activities is high and needs to be checked. The Council short step up efforts to promote other cooking techniques such as bio- and natural gas, solar and wind-electricity. The communities should be taught which kind of trees should be planted in the different environments to serve them for purposes like: conserving the water bodies, firewood, timber and ensuring natural vegetation in their surroundings.
The strategies and targets for improving lands and natural resources are set out by sector, namely wildlife, forest, bookkeeping, tourism and lands, on the following sections. Objective F1: Sustainable utilization of natural resources improved by 2021 Strategy F1.1: Promote tree planting throughout the District
43
Targets F1.1.1: 1,500,000 trees planted in the District each year F1.1.2: 80 on farm tree nurseries with a capacity of 500 to 150,000 seedlings
established and functioning by 2021 F1.1.3: 18,000 members of households from 90 villages trained on tree planting,
conservation and protection of natural resources by June 2021 F1.1.4: Development of technologies contributing to diversification of community
economic activities and saving on utilization of forests promoted by 2021 Strategy F1.2: Expand conservation and protection education
Targets F1.2.1: 90 Village environmental committees from trained in conservation and
protection of wildlife and trees methods by 2021 F1.2.2: Human wildlife conflicts eliminated by June 2021 F1.2.3: Environmental conservation Clubs formed in all schools by 2021 F1.2.4: Surveillance on protected forests strengthened by 2021
Strategy F2.3: Promote forestry friendly alternative uses of forests
Targets F2.3.1: Awareness on beekeeping practices increased and beekeeping adopted as a
business F2.3.2: Production of honey increased from 10.7 tons to 31 tons by June 2021 F2.3.3: Income from honey increased from Sh. 85.6 million to Sh. 248 million by
2021 Strategy F3.4: Develop and promote Tourist attractions in the District Targets F3.4.1: Profile of tourism attractions developed and propagated effective June 2021 F3.4.2: Number of tourist increased to 3,000 by June 2021 F3.4.3: Income from tourism increased to Sh. 30 million by 2021 Strategy F3.5: Improve security over land resources
Target F3.5.1: District Land Use Plan/Master Plan developed and put into use by 2021 F3.5.2: Title Deeds issued to customers increased from 3250 to 6000 by 2021 F3.5.3: People with CCRO increased from 1947 to 6947 by 2021 F3.5.4: Villages with CVL increased from 37 in 2016 to 65 by 2021 F3.5.5: Surveyed Villages increased from 40 to 65 by 2021 F3.5.6: General land use plans increased from 1 to 3 by 2021 F3.5.7: Detailed Land use plans in urban centres increased from 20 to 30 by 2021
44
F3.5.8: Villages with Land use management plans increased from 06 to 21 by 2021 F3.5.9: Number of valuated properties increased from 160 to 360 in 2021 Objective G: Social welfare, gender equality and community empowerment improved by 2021
Meru District Council is committed to ensuring equitable sustainable economic wellbeing of Meru community. Special attention is given to facilitating and empowering marginalized groups such as children, women, youth, old age, disabled and people living with HIV/AIDS. According to the results gleaned in the situation analysis the key issues have been identified to include:
(i) Early marriages and pregnancies at early young age
(ii) Availability of working facilities and equipment
(iii) Women and youth empowerment
The strategies and targets aiming to address these changes are set out below.
Strategy G1.1: Improve women and youth empowerment
Targets G1.1.1: Women participation in management and ownership of community projects
improved by 2021 G1.1.2: Household incomes increased from Sh. 2.5 million to Sh. 3.5 million by 2021 G1.1.3: 100 female circumcisers and 500 girls trained on the effects of female genital
mutilation and early marriages by 2021 G1.1.4: Average loans size for women and youth groups increased from Sh. 3 million to
Sh. 8 million by 2021 G1.1.5: 100 women groups and 100 youth groups formed and registered by 2021 Objective H: Emergence preparedness and disaster management improved
The effects of climate changes are already showing up in weather changes in Meru District Council. The south and eastern parts of the District are intermittently experiencing prolonged drought and occasional flooding. The analysis indicates the main challenges in event of a disaster happening are:
Safe area for temporary settlement on event of disasters
Reliable weather information and other related information for disaster
forecasting
Settlements in areas prone to high risk of disaster impact
The strategies and targets for building emergence preparedness and improving disaster management are as follows:
45
Strategy H1: Prevent and reduce impact of disaster incidence to the community Targets H1.1: 26 ward committees trained on disaster prevention and disaster impact
management by 2021 H1.2: Systems for collection and dissemination of weather and other related information
for disaster forecasting and early warning improved by 2021 H1.3: Disaster prone areas identified and programme to dissuade development of
community settlement in these areas developed and implemented by 2021 Strategy H2: Increase preparedness on event of disasters Targets
H2.1: Safe areas for temporary settlement during disaster s identified and protected by 2021
H2.2: Six (6) floods control dams constructed in flood prone areas by 2021 H2.3: Programme to encourage people to relocate away from disaster prone areas (the
lowlands near rivers and water ways) developed implemented by June 2021 H2.4: Min-grain reserves and requisite equipment and tools for temporary settlement
established at District level by 2021 A Plan Matrix for the Five Years Strategic Plan 2016/17 – 2020/21 is presented in Appendix 2.
46
CHAPTER FOUR
RESULTS FRAMEWORK AND M&E SYSTEM
4.1 Purpose and structure This Chapter presents the benefits that will accrue to clients and other stakeholders of Meru District Council and how these results will be measured. The results framework shows how the interventions to be undertaken will lead to achievement of the Objectives, how these interventions will be monitored, the kind of reviews that will be carried out over the plan period, the evidence based evaluation studies that will be undertaken to ascertain whether the interventions generate the intended outcomes. The framework also presents the indicators that will be used in measuring progress and how the various interventions will be reported and to relevant stakeholders.
4.2 The Goal The goal of Meru District Council as stated in the Vision is to have a well educated, food secure medium income community anchored on agro-based industries by 2025. This is goal is consistent with Tanzania Development Vision 2025 which envisions Tanzania growing into a middle income level state with a high growth rate propelled by an industrial based economy. The goal is also in line with the highest level of results envisioned by the Arusha Region’s Development Strategy, the Medium Term Strategic Plan and Development Strategy of PO RALG and other relevant sector policies. The achievement of the goal amongst others will be influenced by the level of financial resources available, investments in social, economic and development of infrastructure by PO RALG and sectoral ministries. The Council’s contribution to the realization of this objective will also be influenced by how the community innovatively takes the opportunities created in the course of implementing the plan.
4.3 Result Chain The result chain consists of outcomes, outputs, activities and inputs which broadly contribute to specific objectives and performance and targets as indicated above. A combination of the objectives and targets in the strategic plan and activities and inputs in Medium Term Expenditure Framework forms MDC’s result chain. The basic assumption is that, there is causal linkage in the various elements of the result chain. The inputs i.e. utilization of resources will lead to achievement of the activities, which will contribute to achievement of outputs. Achievement of outputs will lead to achievement of objectives. Achievements of the objectives in the medium term will .contribute to achievement of long term goals. This chain of results will justify MDC’s use of the tax payer’s money into the various interventions and thus contribute to the empowering the community to attain a medium income status by 2025.
4.4 The Result Framework Matrix This matrix contains the overall development objective of Meru District Council, objectives, intermediate outcome and indicators. It envisions how the objectives will be achieved and how the results will be measured. The indicators in the matrix will be used to track progress
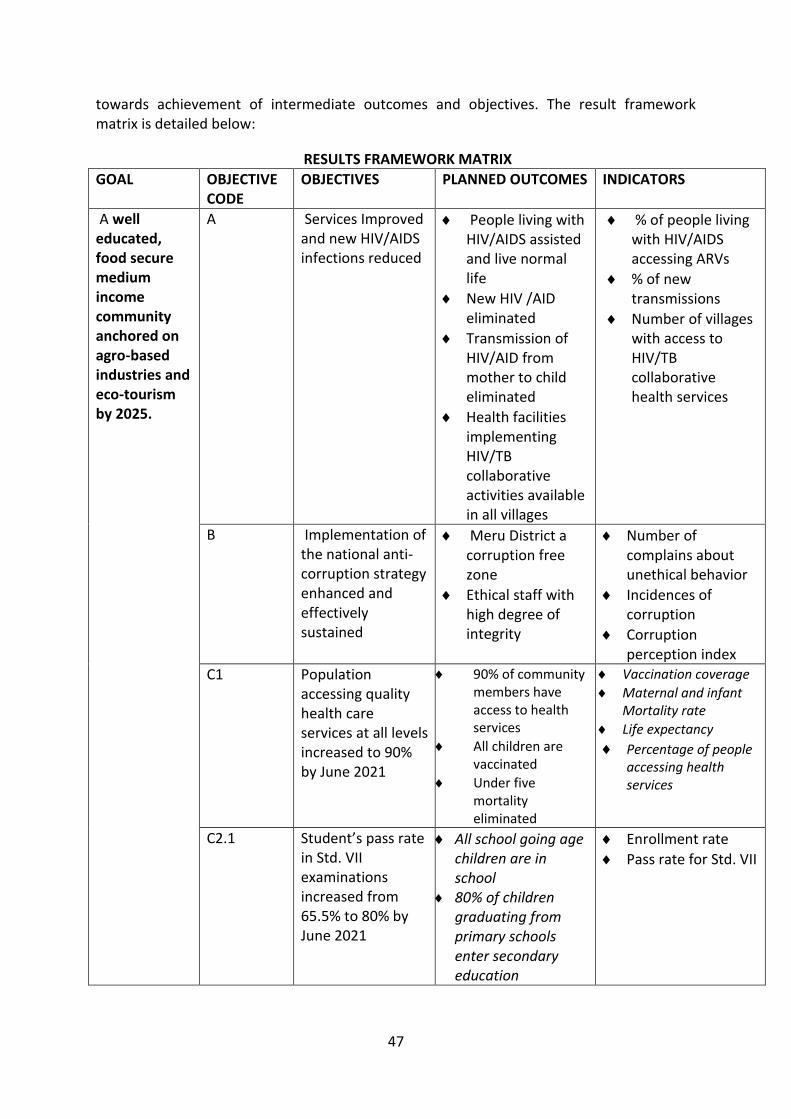
47
towards achievement of intermediate outcomes and objectives. The result framework matrix is detailed below:
RESULTS FRAMEWORK MATRIX
GOAL OBJECTIVE CODE
OBJECTIVES PLANNED OUTCOMES INDICATORS
A well educated, food secure medium income community anchored on agro-based industries and eco-tourism by 2025.
A Services Improved and new HIV/AIDS infections reduced
People living with HIV/AIDS assisted and live normal life
New HIV /AID eliminated
Transmission of HIV/AID from mother to child eliminated
Health facilities implementing HIV/TB collaborative activities available in all villages
% of people living with HIV/AIDS accessing ARVs
% of new transmissions
Number of villages with access to HIV/TB collaborative health services
B Implementation of the national anti-corruption strategy enhanced and effectively sustained
Meru District a corruption free zone
Ethical staff with high degree of integrity
Number of complains about unethical behavior
Incidences of corruption
Corruption perception index
C1 Population accessing quality health care services at all levels increased to 90% by June 2021
90% of community members have access to health services
All children are vaccinated
Under five mortality eliminated
Vaccination coverage
Maternal and infant Mortality rate
Life expectancy
Percentage of people accessing health services
C2.1 Student’s pass rate in Std. VII examinations increased from 65.5% to 80% by June 2021
All school going age children are in school
80% of children graduating from primary schools enter secondary education
Enrollment rate
Pass rate for Std. VII
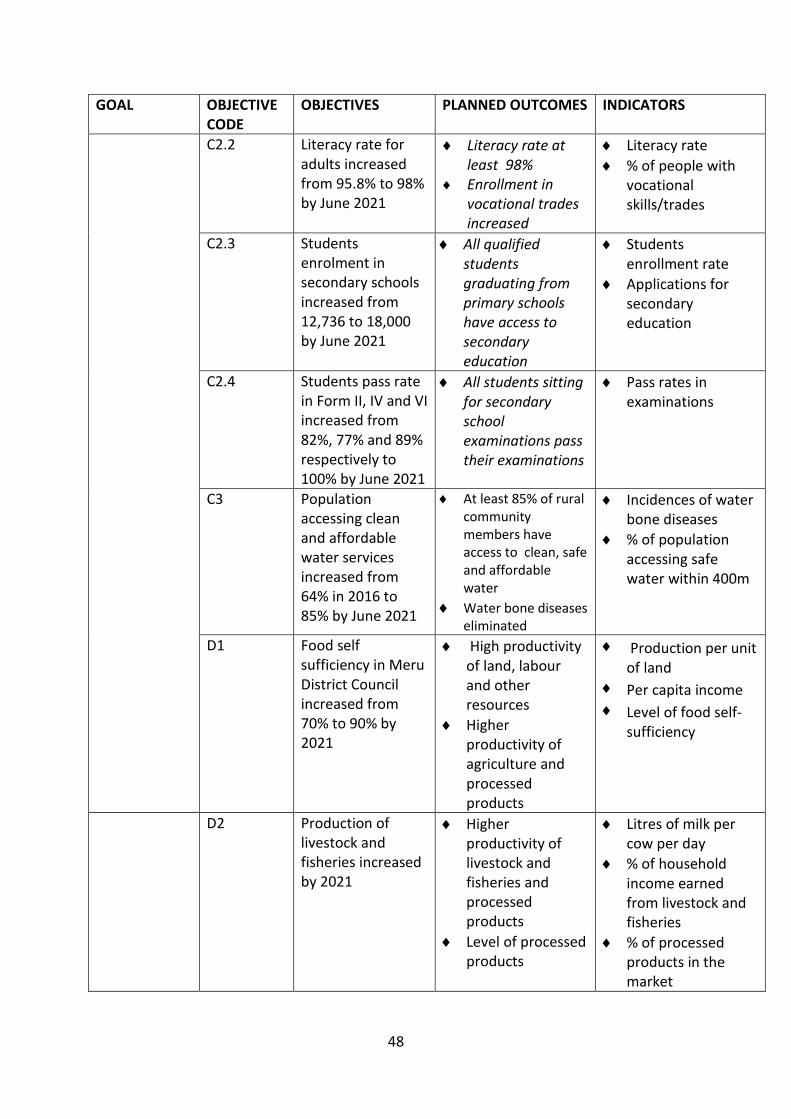
48
GOAL OBJECTIVE CODE
OBJECTIVES PLANNED OUTCOMES INDICATORS
C2.2 Literacy rate for adults increased from 95.8% to 98% by June 2021
Literacy rate at least 98%
Enrollment in vocational trades increased
Literacy rate
% of people with vocational skills/trades
C2.3 Students enrolment in secondary schools increased from 12,736 to 18,000 by June 2021
All qualified students graduating from primary schools have access to secondary education
Students enrollment rate
Applications for secondary education
C2.4 Students pass rate in Form II, IV and VI increased from 82%, 77% and 89% respectively to 100% by June 2021
All students sitting for secondary school examinations pass their examinations
Pass rates in examinations
C3 Population accessing clean and affordable water services increased from 64% in 2016 to 85% by June 2021
At least 85% of rural community members have access to clean, safe and affordable water
Water bone diseases eliminated
Incidences of water bone diseases
% of population accessing safe water within 400m
D1 Food self sufficiency in Meru District Council increased from 70% to 90% by 2021
High productivity of land, labour and other resources
Higher productivity of agriculture and processed products
Production per unit of land
Per capita income
Level of food self-sufficiency
D2 Production of livestock and fisheries increased by 2021
Higher productivity of livestock and fisheries and processed products
Level of processed products
Litres of milk per cow per day
% of household income earned from livestock and fisheries
% of processed products in the market
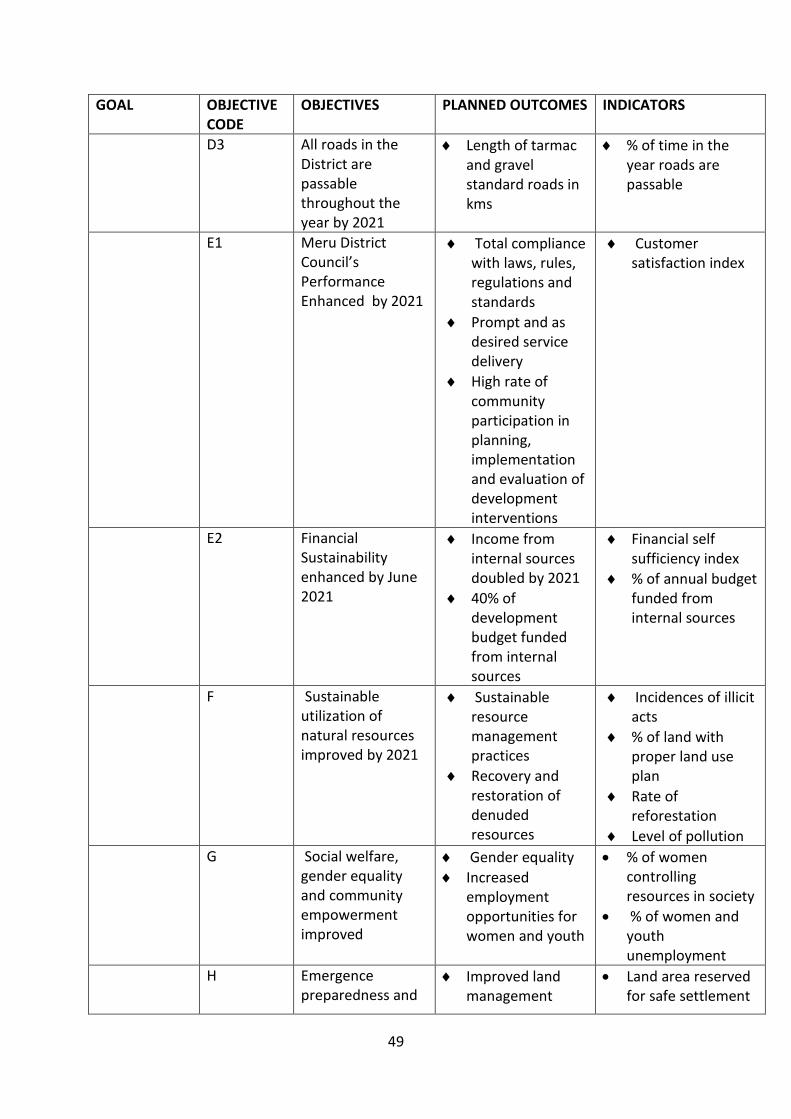
49
GOAL OBJECTIVE CODE
OBJECTIVES PLANNED OUTCOMES INDICATORS
D3 All roads in the District are passable throughout the year by 2021
Length of tarmac and gravel standard roads in kms
% of time in the year roads are passable
E1 Meru District Council’s Performance Enhanced by 2021
Total compliance with laws, rules, regulations and standards
Prompt and as desired service delivery
High rate of community participation in planning, implementation and evaluation of development interventions
Customer satisfaction index
E2 Financial Sustainability enhanced by June 2021
Income from internal sources doubled by 2021
40% of development budget funded from internal sources
Financial self sufficiency index
% of annual budget funded from internal sources
F Sustainable utilization of natural resources improved by 2021
Sustainable resource management practices
Recovery and restoration of denuded resources
Incidences of illicit acts
% of land with proper land use plan
Rate of reforestation
Level of pollution
G Social welfare, gender equality and community empowerment improved
Gender equality
Increased employment opportunities for women and youth
% of women controlling resources in society
% of women and youth unemployment
H Emergence preparedness and
Improved land management
Land area reserved for safe settlement
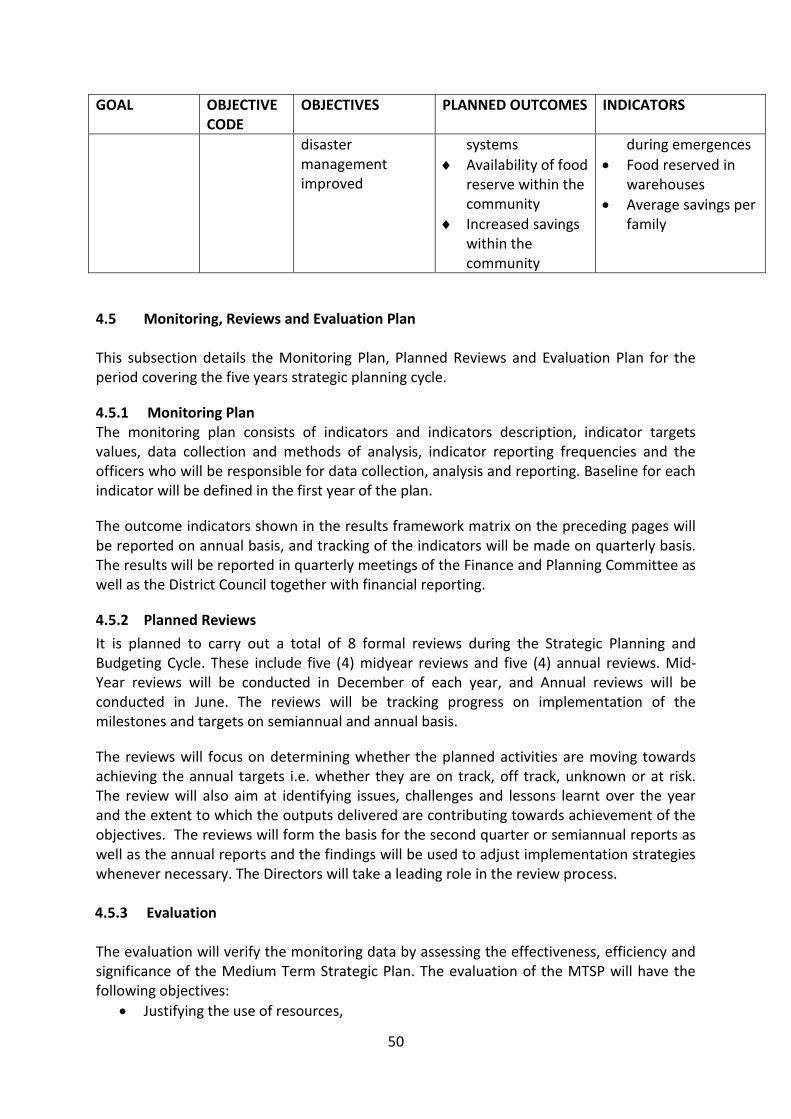
50
GOAL OBJECTIVE CODE
OBJECTIVES PLANNED OUTCOMES INDICATORS
disaster management improved
systems
Availability of food reserve within the community
Increased savings within the community
during emergences
Food reserved in warehouses
Average savings per family
4.5 Monitoring, Reviews and Evaluation Plan This subsection details the Monitoring Plan, Planned Reviews and Evaluation Plan for the period covering the five years strategic planning cycle.
4.5.1 Monitoring Plan The monitoring plan consists of indicators and indicators description, indicator targets values, data collection and methods of analysis, indicator reporting frequencies and the officers who will be responsible for data collection, analysis and reporting. Baseline for each indicator will be defined in the first year of the plan.
The outcome indicators shown in the results framework matrix on the preceding pages will be reported on annual basis, and tracking of the indicators will be made on quarterly basis. The results will be reported in quarterly meetings of the Finance and Planning Committee as well as the District Council together with financial reporting.
4.5.2 Planned Reviews
It is planned to carry out a total of 8 formal reviews during the Strategic Planning and Budgeting Cycle. These include five (4) midyear reviews and five (4) annual reviews. Mid- Year reviews will be conducted in December of each year, and Annual reviews will be conducted in June. The reviews will be tracking progress on implementation of the milestones and targets on semiannual and annual basis.
The reviews will focus on determining whether the planned activities are moving towards achieving the annual targets i.e. whether they are on track, off track, unknown or at risk. The review will also aim at identifying issues, challenges and lessons learnt over the year and the extent to which the outputs delivered are contributing towards achievement of the objectives. The reviews will form the basis for the second quarter or semiannual reports as well as the annual reports and the findings will be used to adjust implementation strategies whenever necessary. The Directors will take a leading role in the review process. 4.5.3 Evaluation
The evaluation will verify the monitoring data by assessing the effectiveness, efficiency and significance of the Medium Term Strategic Plan. The evaluation of the MTSP will have the following objectives:
Justifying the use of resources,
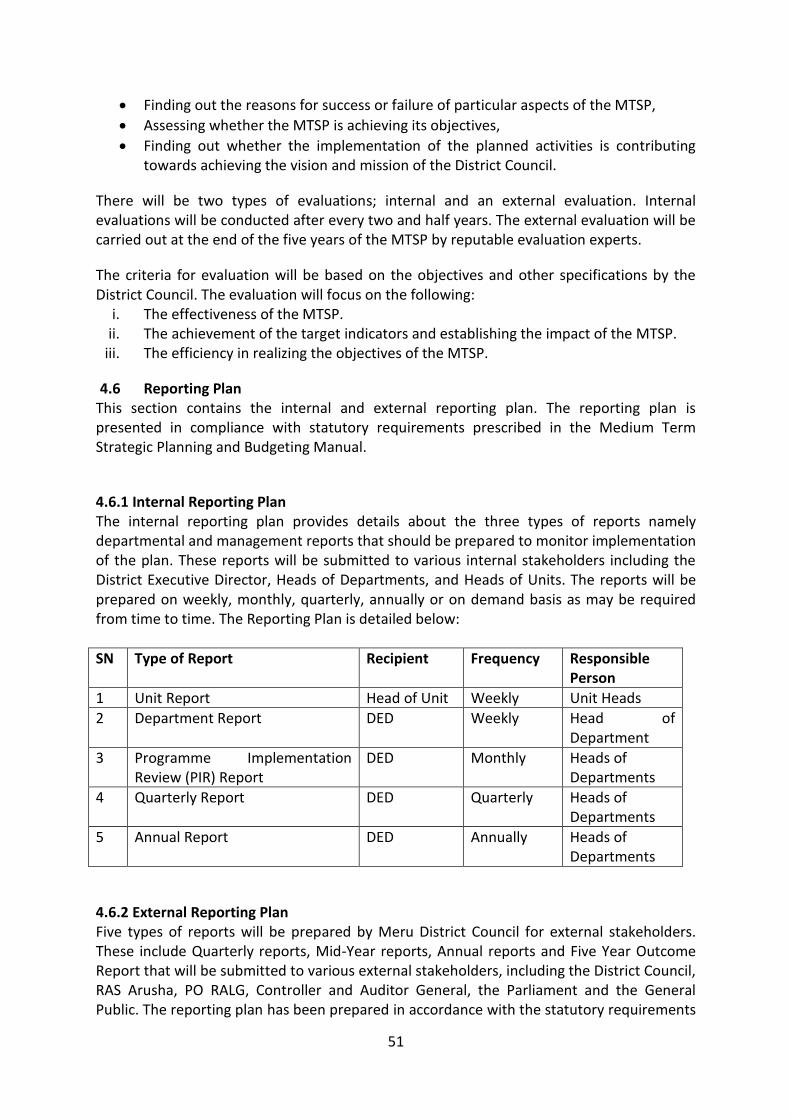
51
Finding out the reasons for success or failure of particular aspects of the MTSP,
Assessing whether the MTSP is achieving its objectives,
Finding out whether the implementation of the planned activities is contributing towards achieving the vision and mission of the District Council.
There will be two types of evaluations; internal and an external evaluation. Internal evaluations will be conducted after every two and half years. The external evaluation will be carried out at the end of the five years of the MTSP by reputable evaluation experts.
The criteria for evaluation will be based on the objectives and other specifications by the District Council. The evaluation will focus on the following:
i. The effectiveness of the MTSP. ii. The achievement of the target indicators and establishing the impact of the MTSP.
iii. The efficiency in realizing the objectives of the MTSP.
4.6 Reporting Plan This section contains the internal and external reporting plan. The reporting plan is presented in compliance with statutory requirements prescribed in the Medium Term Strategic Planning and Budgeting Manual.
4.6.1 Internal Reporting Plan The internal reporting plan provides details about the three types of reports namely departmental and management reports that should be prepared to monitor implementation of the plan. These reports will be submitted to various internal stakeholders including the District Executive Director, Heads of Departments, and Heads of Units. The reports will be prepared on weekly, monthly, quarterly, annually or on demand basis as may be required from time to time. The Reporting Plan is detailed below:
SN Type of Report Recipient Frequency Responsible Person
1 Unit Report Head of Unit Weekly Unit Heads
2 Department Report DED Weekly Head of Department
3 Programme Implementation Review (PIR) Report
DED Monthly Heads of Departments
4 Quarterly Report DED Quarterly Heads of Departments
5 Annual Report DED Annually Heads of Departments
4.6.2 External Reporting Plan Five types of reports will be prepared by Meru District Council for external stakeholders. These include Quarterly reports, Mid-Year reports, Annual reports and Five Year Outcome Report that will be submitted to various external stakeholders, including the District Council, RAS Arusha, PO RALG, Controller and Auditor General, the Parliament and the General Public. The reporting plan has been prepared in accordance with the statutory requirements
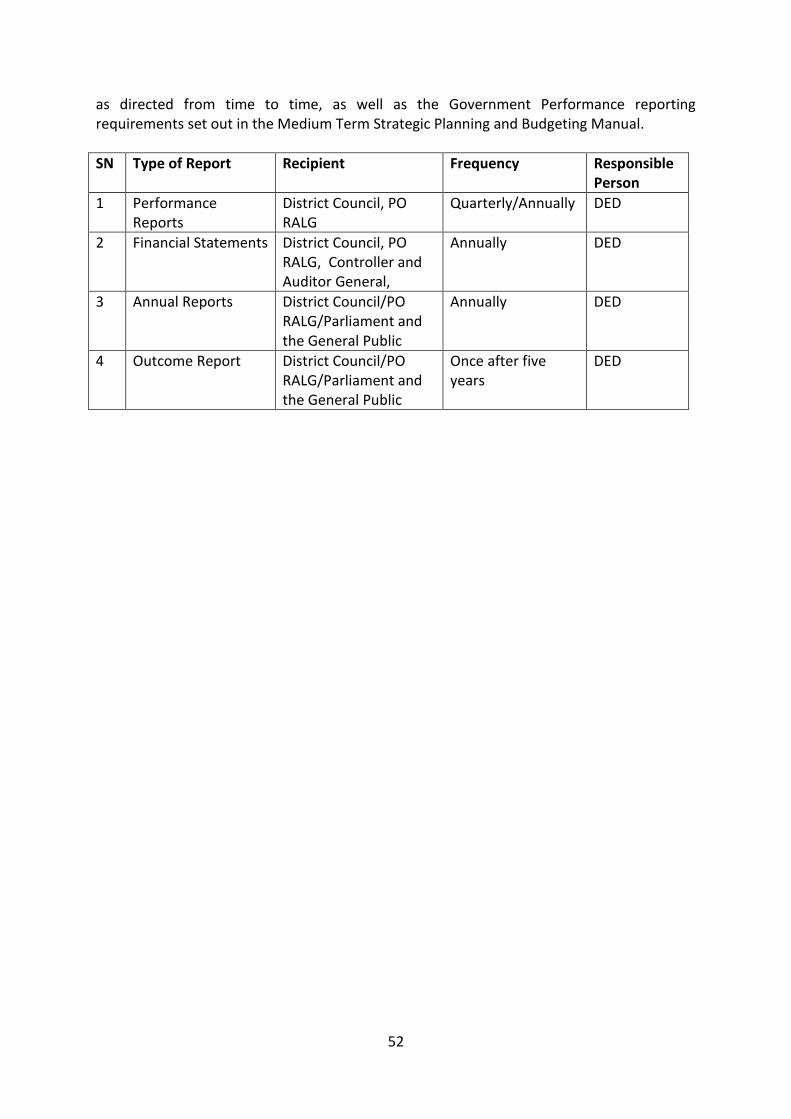
52
as directed from time to time, as well as the Government Performance reporting requirements set out in the Medium Term Strategic Planning and Budgeting Manual.
SN Type of Report Recipient Frequency Responsible Person
1 Performance Reports
District Council, PO RALG
Quarterly/Annually DED
2 Financial Statements District Council, PO RALG, Controller and Auditor General,
Annually DED
3 Annual Reports District Council/PO RALG/Parliament and the General Public
Annually DED
4 Outcome Report District Council/PO RALG/Parliament and the General Public
Once after five years
DED
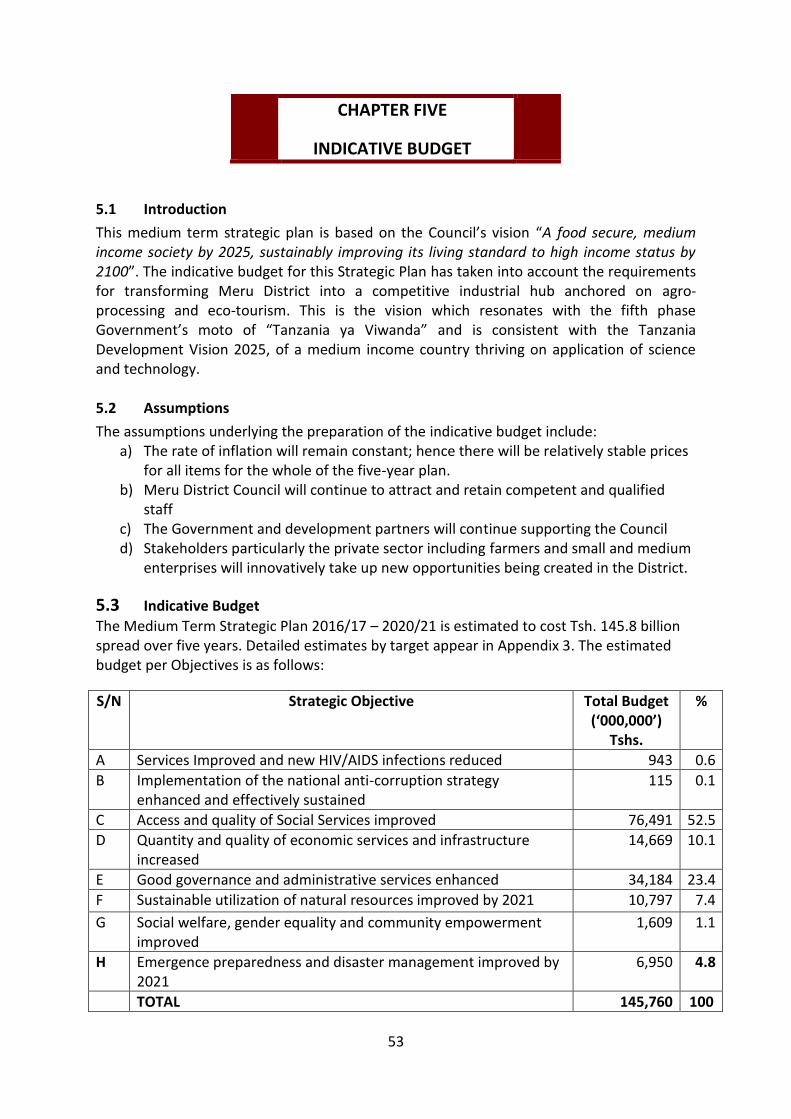
53
CHAPTER FIVE
INDICATIVE BUDGET
5.1 Introduction
This medium term strategic plan is based on the Council’s vision “A food secure, medium income society by 2025, sustainably improving its living standard to high income status by 2100”. The indicative budget for this Strategic Plan has taken into account the requirements for transforming Meru District into a competitive industrial hub anchored on agro-processing and eco-tourism. This is the vision which resonates with the fifth phase Government’s moto of “Tanzania ya Viwanda” and is consistent with the Tanzania Development Vision 2025, of a medium income country thriving on application of science and technology. 5.2 Assumptions
The assumptions underlying the preparation of the indicative budget include: a) The rate of inflation will remain constant; hence there will be relatively stable prices
for all items for the whole of the five-year plan. b) Meru District Council will continue to attract and retain competent and qualified
staff c) The Government and development partners will continue supporting the Council d) Stakeholders particularly the private sector including farmers and small and medium
enterprises will innovatively take up new opportunities being created in the District.
5.3 Indicative Budget
The Medium Term Strategic Plan 2016/17 – 2020/21 is estimated to cost Tsh. 145.8 billion spread over five years. Detailed estimates by target appear in Appendix 3. The estimated budget per Objectives is as follows:
S/N Strategic Objective Total Budget (‘000,000’)
Tshs.
%
A Services Improved and new HIV/AIDS infections reduced 943 0.6
B Implementation of the national anti-corruption strategy enhanced and effectively sustained
115 0.1
C Access and quality of Social Services improved 76,491 52.5
D Quantity and quality of economic services and infrastructure increased
14,669 10.1
E Good governance and administrative services enhanced 34,184 23.4
F Sustainable utilization of natural resources improved by 2021 10,797 7.4
G Social welfare, gender equality and community empowerment improved
1,609 1.1
H Emergence preparedness and disaster management improved by 2021
6,950 4.8
TOTAL 145,760 100
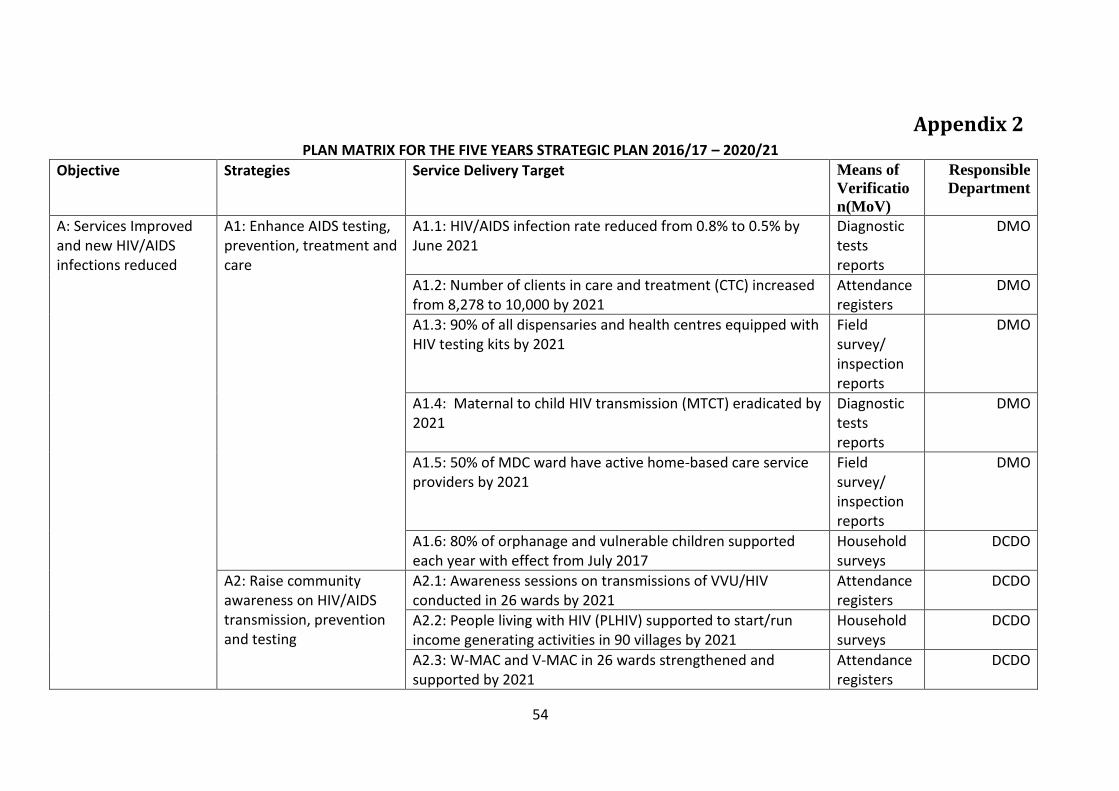
54
Appendix 2 PLAN MATRIX FOR THE FIVE YEARS STRATEGIC PLAN 2016/17 – 2020/21
Objective Strategies Service Delivery Target Means of
Verificatio
n(MoV)
Responsible
Department
A: Services Improved and new HIV/AIDS infections reduced
A1: Enhance AIDS testing, prevention, treatment and care
A1.1: HIV/AIDS infection rate reduced from 0.8% to 0.5% by June 2021
Diagnostic tests reports
DMO
A1.2: Number of clients in care and treatment (CTC) increased from 8,278 to 10,000 by 2021
Attendance registers
DMO
A1.3: 90% of all dispensaries and health centres equipped with HIV testing kits by 2021
Field survey/ inspection reports
DMO
A1.4: Maternal to child HIV transmission (MTCT) eradicated by 2021
Diagnostic tests reports
DMO
A1.5: 50% of MDC ward have active home-based care service providers by 2021
Field survey/ inspection reports
DMO
A1.6: 80% of orphanage and vulnerable children supported each year with effect from July 2017
Household surveys
DCDO
A2: Raise community awareness on HIV/AIDS transmission, prevention and testing
A2.1: Awareness sessions on transmissions of VVU/HIV conducted in 26 wards by 2021
Attendance registers
DCDO
A2.2: People living with HIV (PLHIV) supported to start/run income generating activities in 90 villages by 2021
Household surveys
DCDO
A2.3: W-MAC and V-MAC in 26 wards strengthened and supported by 2021
Attendance registers
DCDO
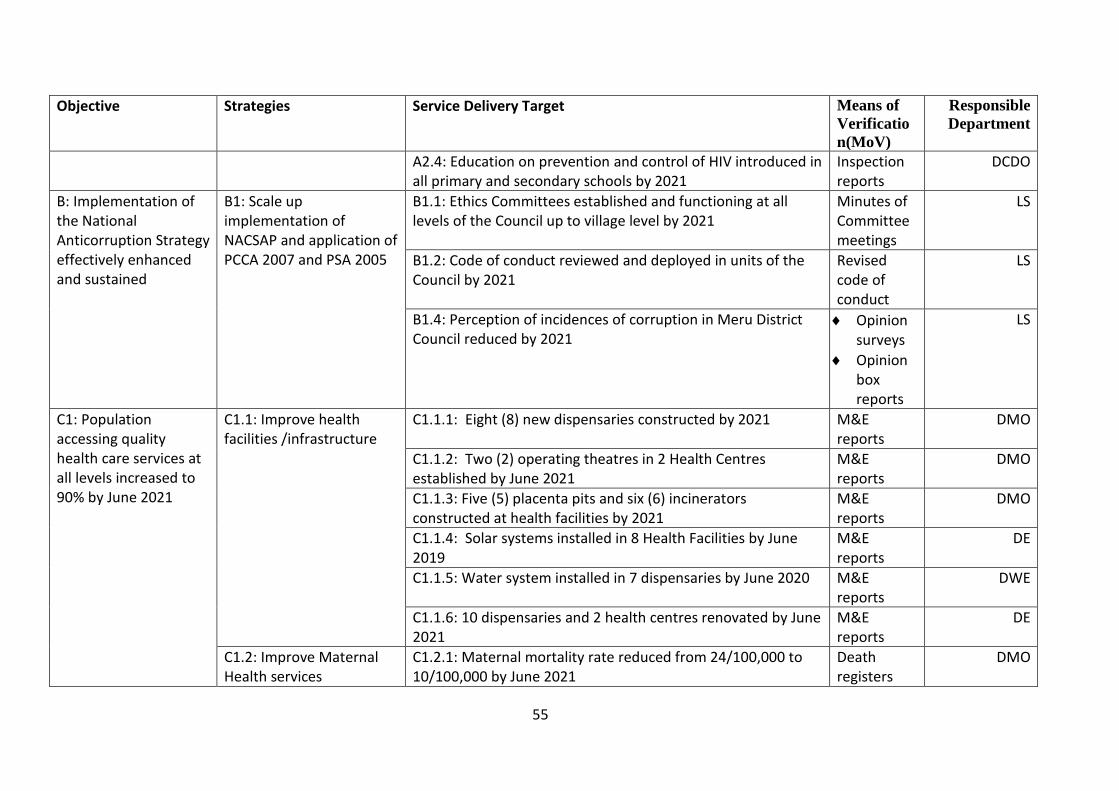
55
Objective Strategies Service Delivery Target Means of
Verificatio
n(MoV)
Responsible
Department
A2.4: Education on prevention and control of HIV introduced in all primary and secondary schools by 2021
Inspection reports
DCDO
B: Implementation of the National Anticorruption Strategy effectively enhanced and sustained
B1: Scale up implementation of NACSAP and application of PCCA 2007 and PSA 2005
B1.1: Ethics Committees established and functioning at all levels of the Council up to village level by 2021
Minutes of Committee meetings
LS
B1.2: Code of conduct reviewed and deployed in units of the Council by 2021
Revised code of conduct
LS
B1.4: Perception of incidences of corruption in Meru District Council reduced by 2021
Opinion surveys
Opinion box reports
LS
C1: Population accessing quality health care services at all levels increased to 90% by June 2021
C1.1: Improve health facilities /infrastructure
C1.1.1: Eight (8) new dispensaries constructed by 2021 M&E reports
DMO
C1.1.2: Two (2) operating theatres in 2 Health Centres established by June 2021
M&E reports
DMO
C1.1.3: Five (5) placenta pits and six (6) incinerators constructed at health facilities by 2021
M&E reports
DMO
C1.1.4: Solar systems installed in 8 Health Facilities by June 2019
M&E reports
DE
C1.1.5: Water system installed in 7 dispensaries by June 2020 M&E reports
DWE
C1.1.6: 10 dispensaries and 2 health centres renovated by June 2021
M&E reports
DE
C1.2: Improve Maternal Health services
C1.2.1: Maternal mortality rate reduced from 24/100,000 to 10/100,000 by June 2021
Death registers
DMO
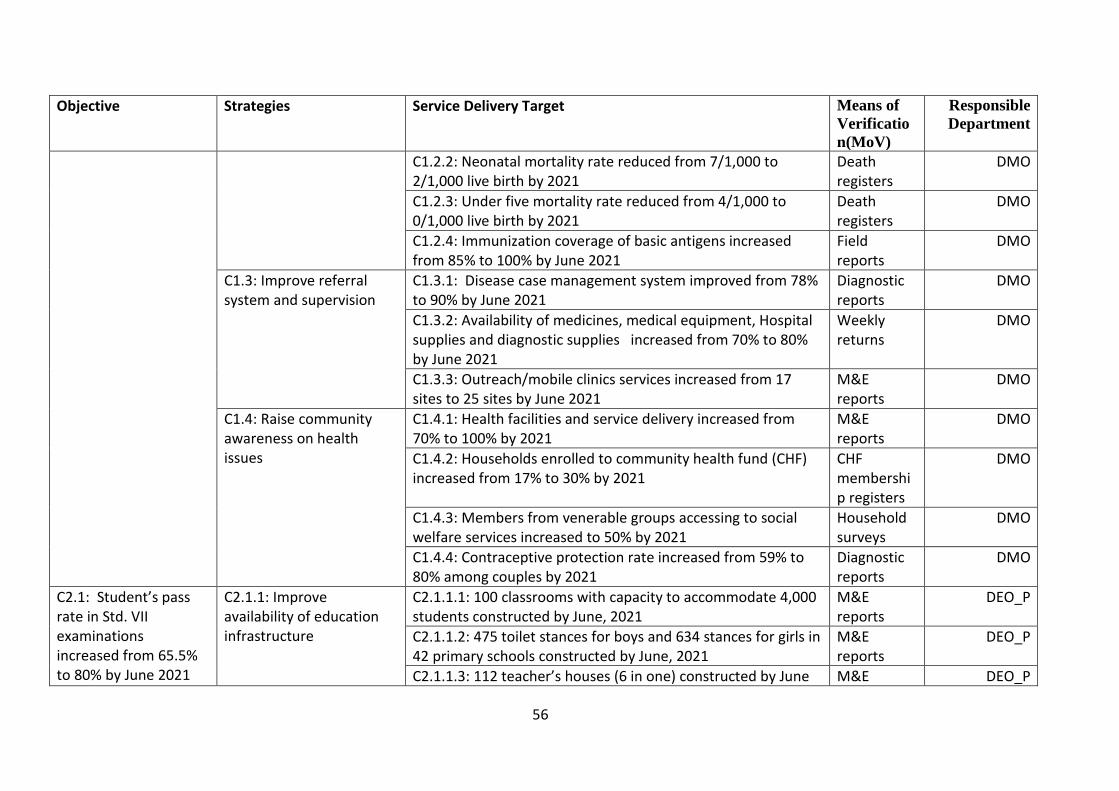
56
Objective Strategies Service Delivery Target Means of
Verificatio
n(MoV)
Responsible
Department
C1.2.2: Neonatal mortality rate reduced from 7/1,000 to 2/1,000 live birth by 2021
Death registers
DMO
C1.2.3: Under five mortality rate reduced from 4/1,000 to 0/1,000 live birth by 2021
Death registers
DMO
C1.2.4: Immunization coverage of basic antigens increased from 85% to 100% by June 2021
Field reports
DMO
C1.3: Improve referral system and supervision
C1.3.1: Disease case management system improved from 78% to 90% by June 2021
Diagnostic reports
DMO
C1.3.2: Availability of medicines, medical equipment, Hospital supplies and diagnostic supplies increased from 70% to 80% by June 2021
Weekly returns
DMO
C1.3.3: Outreach/mobile clinics services increased from 17 sites to 25 sites by June 2021
M&E reports
DMO
C1.4: Raise community awareness on health issues
C1.4.1: Health facilities and service delivery increased from 70% to 100% by 2021
M&E reports
DMO
C1.4.2: Households enrolled to community health fund (CHF) increased from 17% to 30% by 2021
CHF membership registers
DMO
C1.4.3: Members from venerable groups accessing to social welfare services increased to 50% by 2021
Household surveys
DMO
C1.4.4: Contraceptive protection rate increased from 59% to 80% among couples by 2021
Diagnostic reports
DMO
C2.1: Student’s pass rate in Std. VII examinations increased from 65.5% to 80% by June 2021
C2.1.1: Improve availability of education infrastructure
C2.1.1.1: 100 classrooms with capacity to accommodate 4,000 students constructed by June, 2021
M&E reports
DEO_P
C2.1.1.2: 475 toilet stances for boys and 634 stances for girls in 42 primary schools constructed by June, 2021
M&E reports
DEO_P
C2.1.1.3: 112 teacher’s houses (6 in one) constructed by June M&E DEO_P
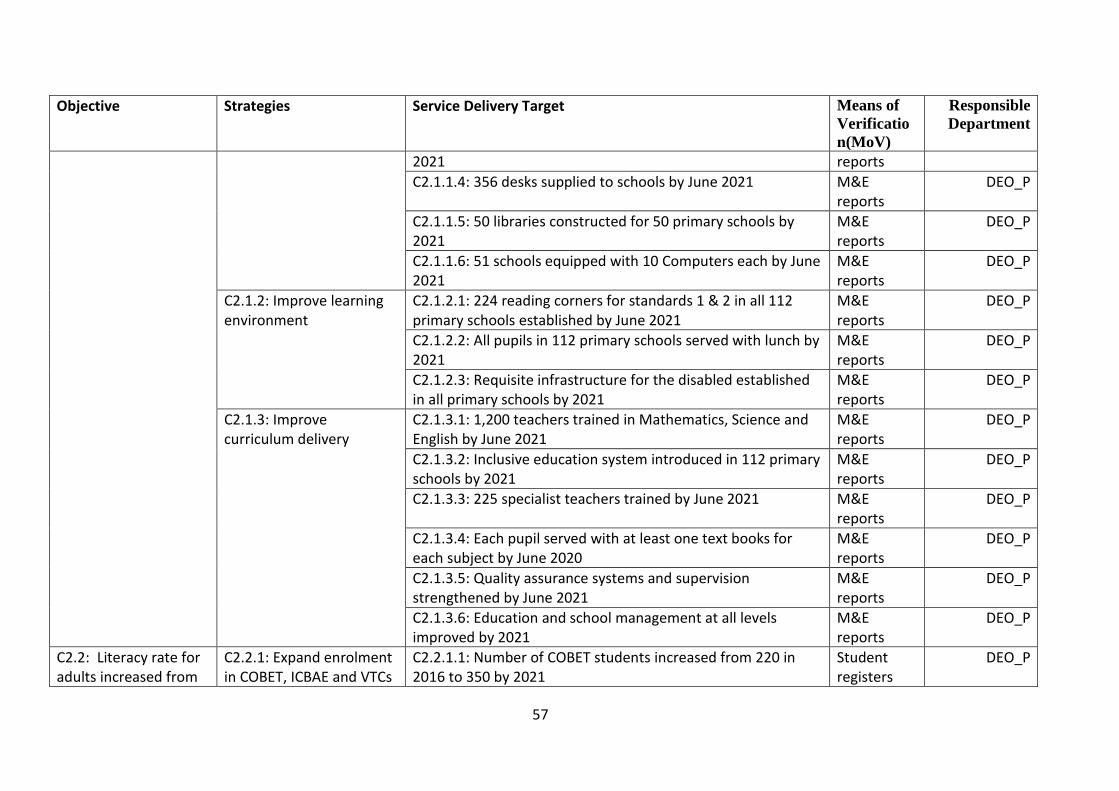
57
Objective Strategies Service Delivery Target Means of
Verificatio
n(MoV)
Responsible
Department
2021 reports
C2.1.1.4: 356 desks supplied to schools by June 2021 M&E reports
DEO_P
C2.1.1.5: 50 libraries constructed for 50 primary schools by 2021
M&E reports
DEO_P
C2.1.1.6: 51 schools equipped with 10 Computers each by June 2021
M&E reports
DEO_P
C2.1.2: Improve learning environment
C2.1.2.1: 224 reading corners for standards 1 & 2 in all 112 primary schools established by June 2021
M&E reports
DEO_P
C2.1.2.2: All pupils in 112 primary schools served with lunch by 2021
M&E reports
DEO_P
C2.1.2.3: Requisite infrastructure for the disabled established in all primary schools by 2021
M&E reports
DEO_P
C2.1.3: Improve curriculum delivery
C2.1.3.1: 1,200 teachers trained in Mathematics, Science and English by June 2021
M&E reports
DEO_P
C2.1.3.2: Inclusive education system introduced in 112 primary schools by 2021
M&E reports
DEO_P
C2.1.3.3: 225 specialist teachers trained by June 2021 M&E reports
DEO_P
C2.1.3.4: Each pupil served with at least one text books for each subject by June 2020
M&E reports
DEO_P
C2.1.3.5: Quality assurance systems and supervision strengthened by June 2021
M&E reports
DEO_P
C2.1.3.6: Education and school management at all levels improved by 2021
M&E reports
DEO_P
C2.2: Literacy rate for adults increased from
C2.2.1: Expand enrolment in COBET, ICBAE and VTCs
C2.2.1.1: Number of COBET students increased from 220 in 2016 to 350 by 2021
Student registers
DEO_P
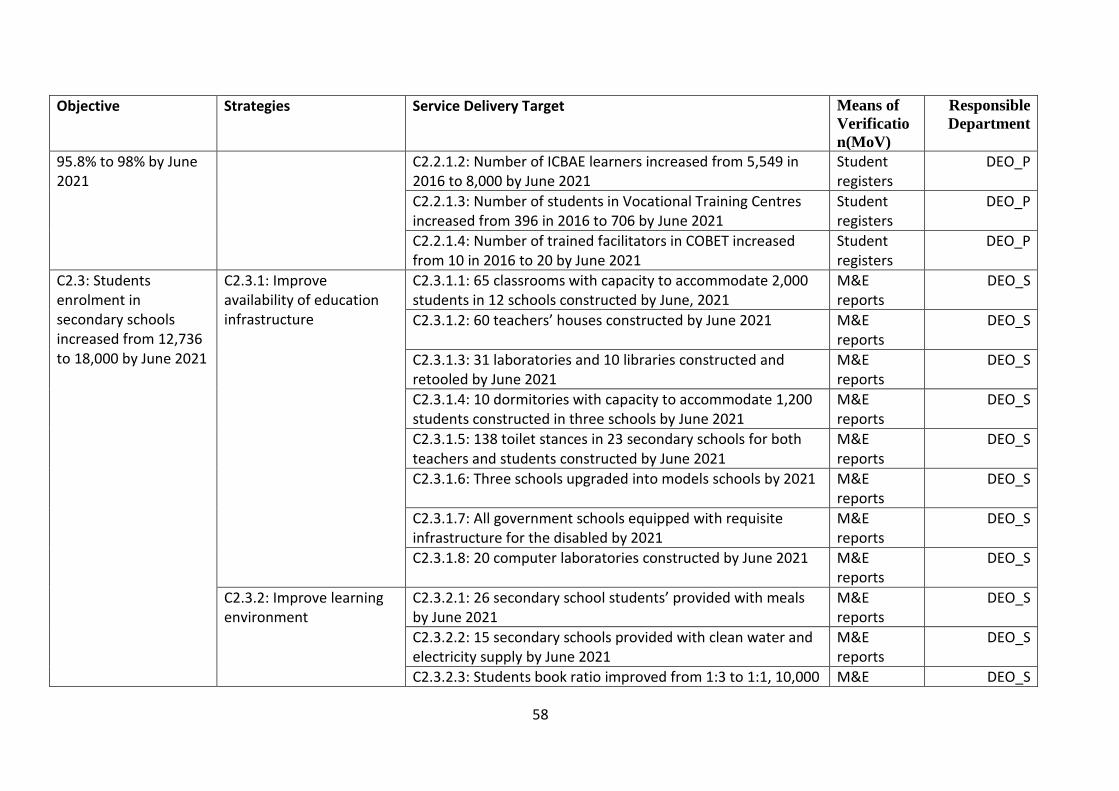
58
Objective Strategies Service Delivery Target Means of
Verificatio
n(MoV)
Responsible
Department
95.8% to 98% by June 2021
C2.2.1.2: Number of ICBAE learners increased from 5,549 in 2016 to 8,000 by June 2021
Student registers
DEO_P
C2.2.1.3: Number of students in Vocational Training Centres increased from 396 in 2016 to 706 by June 2021
Student registers
DEO_P
C2.2.1.4: Number of trained facilitators in COBET increased from 10 in 2016 to 20 by June 2021
Student registers
DEO_P
C2.3: Students enrolment in secondary schools increased from 12,736 to 18,000 by June 2021
C2.3.1: Improve availability of education infrastructure
C2.3.1.1: 65 classrooms with capacity to accommodate 2,000 students in 12 schools constructed by June, 2021
M&E reports
DEO_S
C2.3.1.2: 60 teachers’ houses constructed by June 2021 M&E reports
DEO_S
C2.3.1.3: 31 laboratories and 10 libraries constructed and retooled by June 2021
M&E reports
DEO_S
C2.3.1.4: 10 dormitories with capacity to accommodate 1,200 students constructed in three schools by June 2021
M&E reports
DEO_S
C2.3.1.5: 138 toilet stances in 23 secondary schools for both teachers and students constructed by June 2021
M&E reports
DEO_S
C2.3.1.6: Three schools upgraded into models schools by 2021 M&E reports
DEO_S
C2.3.1.7: All government schools equipped with requisite infrastructure for the disabled by 2021
M&E reports
DEO_S
C2.3.1.8: 20 computer laboratories constructed by June 2021 M&E reports
DEO_S
C2.3.2: Improve learning environment
C2.3.2.1: 26 secondary school students’ provided with meals by June 2021
M&E reports
DEO_S
C2.3.2.2: 15 secondary schools provided with clean water and electricity supply by June 2021
M&E reports
DEO_S
C2.3.2.3: Students book ratio improved from 1:3 to 1:1, 10,000 M&E DEO_S
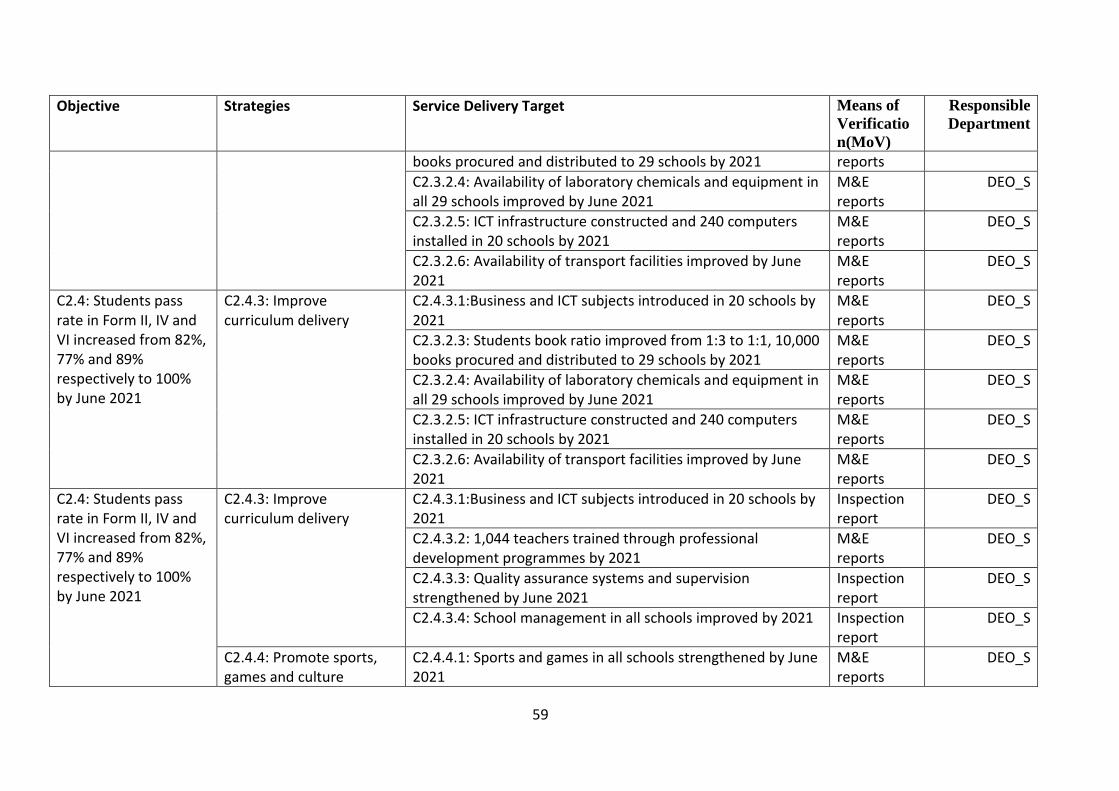
59
Objective Strategies Service Delivery Target Means of
Verificatio
n(MoV)
Responsible
Department
books procured and distributed to 29 schools by 2021 reports
C2.3.2.4: Availability of laboratory chemicals and equipment in all 29 schools improved by June 2021
M&E reports
DEO_S
C2.3.2.5: ICT infrastructure constructed and 240 computers installed in 20 schools by 2021
M&E reports
DEO_S
C2.3.2.6: Availability of transport facilities improved by June 2021
M&E reports
DEO_S
C2.4: Students pass rate in Form II, IV and VI increased from 82%, 77% and 89% respectively to 100% by June 2021
C2.4.3: Improve curriculum delivery
C2.4.3.1:Business and ICT subjects introduced in 20 schools by 2021
M&E reports
DEO_S
C2.3.2.3: Students book ratio improved from 1:3 to 1:1, 10,000 books procured and distributed to 29 schools by 2021
M&E reports
DEO_S
C2.3.2.4: Availability of laboratory chemicals and equipment in all 29 schools improved by June 2021
M&E reports
DEO_S
C2.3.2.5: ICT infrastructure constructed and 240 computers installed in 20 schools by 2021
M&E reports
DEO_S
C2.3.2.6: Availability of transport facilities improved by June 2021
M&E reports
DEO_S
C2.4: Students pass rate in Form II, IV and VI increased from 82%, 77% and 89% respectively to 100% by June 2021
C2.4.3: Improve curriculum delivery
C2.4.3.1:Business and ICT subjects introduced in 20 schools by 2021
Inspection report
DEO_S
C2.4.3.2: 1,044 teachers trained through professional development programmes by 2021
M&E reports
DEO_S
C2.4.3.3: Quality assurance systems and supervision strengthened by June 2021
Inspection report
DEO_S
C2.4.3.4: School management in all schools improved by 2021 Inspection report
DEO_S
C2.4.4: Promote sports, games and culture
C2.4.4.1: Sports and games in all schools strengthened by June 2021
M&E reports
DEO_S
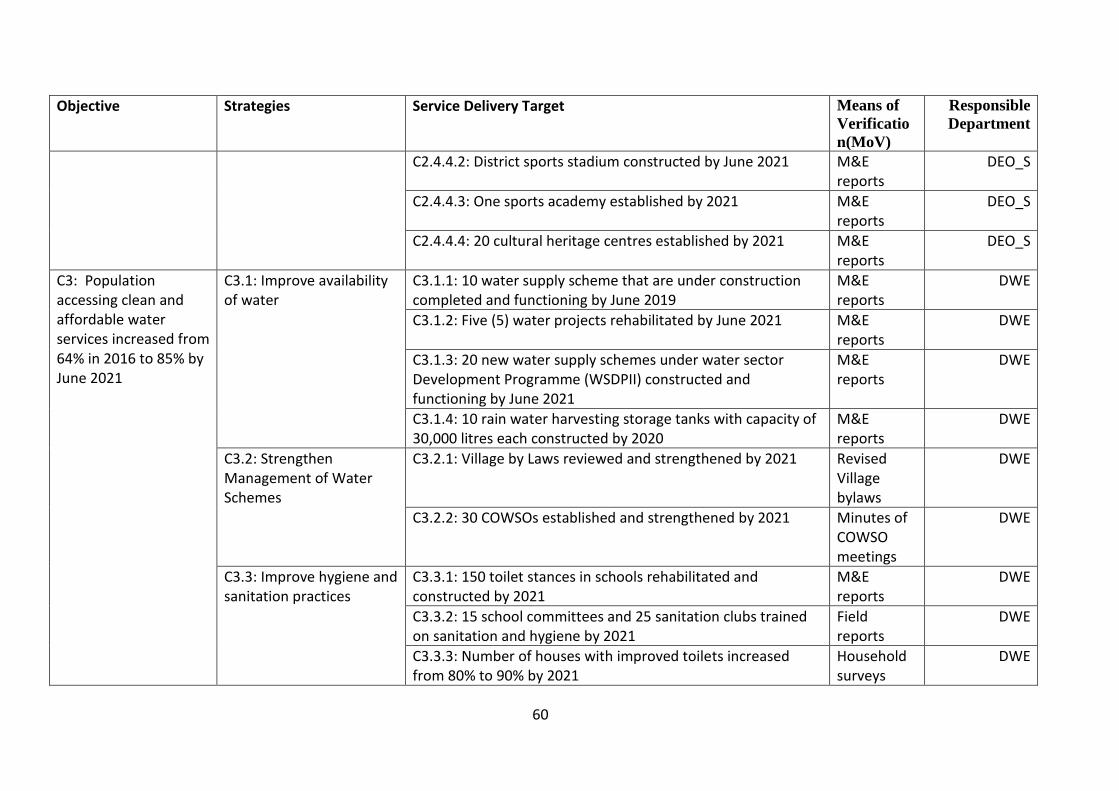
60
Objective Strategies Service Delivery Target Means of
Verificatio
n(MoV)
Responsible
Department
C2.4.4.2: District sports stadium constructed by June 2021 M&E reports
DEO_S
C2.4.4.3: One sports academy established by 2021 M&E reports
DEO_S
C2.4.4.4: 20 cultural heritage centres established by 2021 M&E reports
DEO_S
C3: Population accessing clean and affordable water services increased from 64% in 2016 to 85% by June 2021
C3.1: Improve availability of water
C3.1.1: 10 water supply scheme that are under construction completed and functioning by June 2019
M&E reports
DWE
C3.1.2: Five (5) water projects rehabilitated by June 2021 M&E reports
DWE
C3.1.3: 20 new water supply schemes under water sector Development Programme (WSDPII) constructed and functioning by June 2021
M&E reports
DWE
C3.1.4: 10 rain water harvesting storage tanks with capacity of 30,000 litres each constructed by 2020
M&E reports
DWE
C3.2: Strengthen Management of Water Schemes
C3.2.1: Village by Laws reviewed and strengthened by 2021 Revised Village bylaws
DWE
C3.2.2: 30 COWSOs established and strengthened by 2021 Minutes of COWSO meetings
DWE
C3.3: Improve hygiene and sanitation practices
C3.3.1: 150 toilet stances in schools rehabilitated and constructed by 2021
M&E reports
DWE
C3.3.2: 15 school committees and 25 sanitation clubs trained on sanitation and hygiene by 2021
Field reports
DWE
C3.3.3: Number of houses with improved toilets increased from 80% to 90% by 2021
Household surveys
DWE
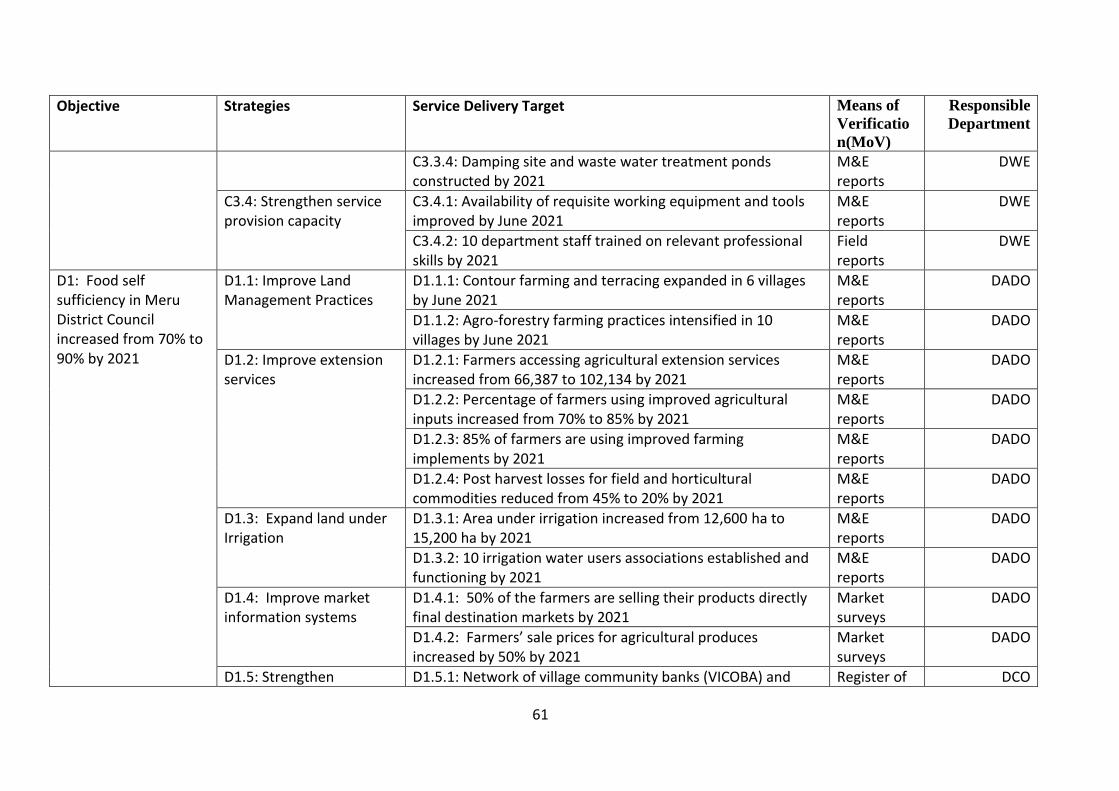
61
Objective Strategies Service Delivery Target Means of
Verificatio
n(MoV)
Responsible
Department
C3.3.4: Damping site and waste water treatment ponds constructed by 2021
M&E reports
DWE
C3.4: Strengthen service provision capacity
C3.4.1: Availability of requisite working equipment and tools improved by June 2021
M&E reports
DWE
C3.4.2: 10 department staff trained on relevant professional skills by 2021
Field reports
DWE
D1: Food self sufficiency in Meru District Council increased from 70% to 90% by 2021
D1.1: Improve Land Management Practices
D1.1.1: Contour farming and terracing expanded in 6 villages by June 2021
M&E reports
DADO
D1.1.2: Agro-forestry farming practices intensified in 10 villages by June 2021
M&E reports
DADO
D1.2: Improve extension services
D1.2.1: Farmers accessing agricultural extension services increased from 66,387 to 102,134 by 2021
M&E reports
DADO
D1.2.2: Percentage of farmers using improved agricultural inputs increased from 70% to 85% by 2021
M&E reports
DADO
D1.2.3: 85% of farmers are using improved farming implements by 2021
M&E reports
DADO
D1.2.4: Post harvest losses for field and horticultural commodities reduced from 45% to 20% by 2021
M&E reports
DADO
D1.3: Expand land under Irrigation
D1.3.1: Area under irrigation increased from 12,600 ha to 15,200 ha by 2021
M&E reports
DADO
D1.3.2: 10 irrigation water users associations established and functioning by 2021
M&E reports
DADO
D1.4: Improve market information systems
D1.4.1: 50% of the farmers are selling their products directly final destination markets by 2021
Market surveys
DADO
D1.4.2: Farmers’ sale prices for agricultural produces increased by 50% by 2021
Market surveys
DADO
D1.5: Strengthen D1.5.1: Network of village community banks (VICOBA) and Register of DCO
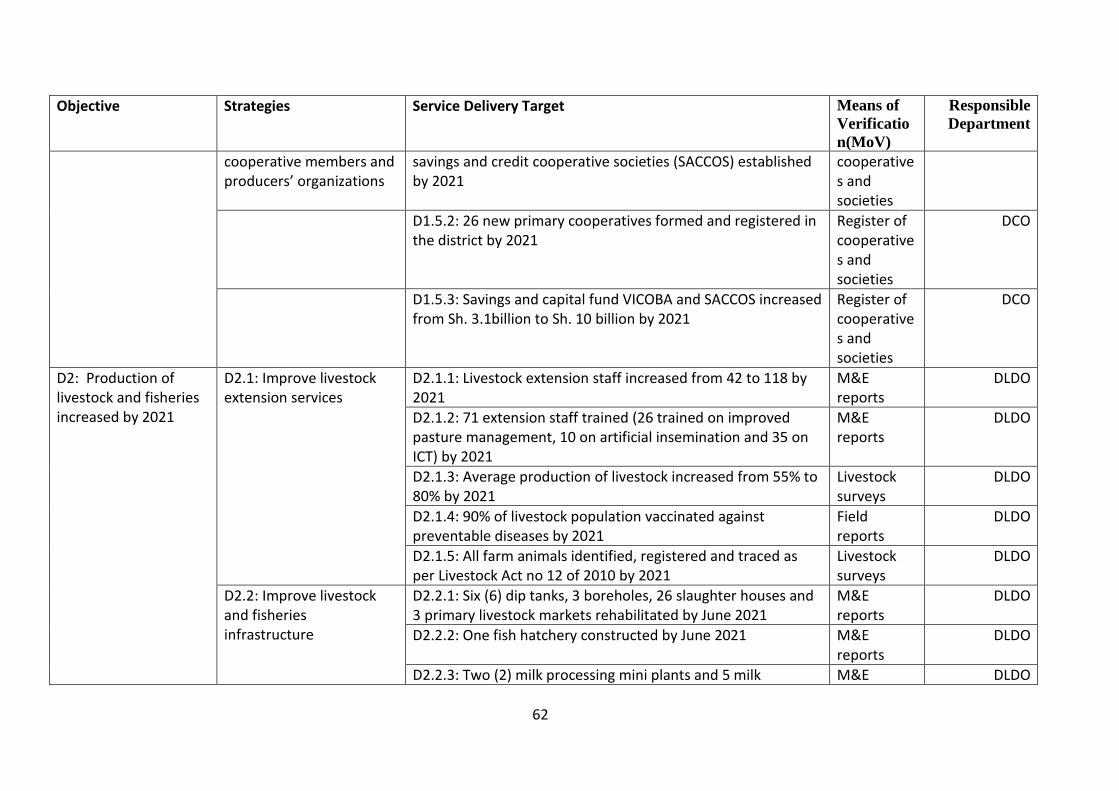
62
Objective Strategies Service Delivery Target Means of
Verificatio
n(MoV)
Responsible
Department
cooperative members and producers’ organizations
savings and credit cooperative societies (SACCOS) established by 2021
cooperatives and societies
D1.5.2: 26 new primary cooperatives formed and registered in the district by 2021
Register of cooperatives and societies
DCO
D1.5.3: Savings and capital fund VICOBA and SACCOS increased from Sh. 3.1billion to Sh. 10 billion by 2021
Register of cooperatives and societies
DCO
D2: Production of livestock and fisheries increased by 2021
D2.1: Improve livestock extension services
D2.1.1: Livestock extension staff increased from 42 to 118 by 2021
M&E reports
DLDO
D2.1.2: 71 extension staff trained (26 trained on improved pasture management, 10 on artificial insemination and 35 on ICT) by 2021
M&E reports
DLDO
D2.1.3: Average production of livestock increased from 55% to 80% by 2021
Livestock surveys
DLDO
D2.1.4: 90% of livestock population vaccinated against preventable diseases by 2021
Field reports
DLDO
D2.1.5: All farm animals identified, registered and traced as per Livestock Act no 12 of 2010 by 2021
Livestock surveys
DLDO
D2.2: Improve livestock and fisheries infrastructure
D2.2.1: Six (6) dip tanks, 3 boreholes, 26 slaughter houses and 3 primary livestock markets rehabilitated by June 2021
M&E reports
DLDO
D2.2.2: One fish hatchery constructed by June 2021 M&E reports
DLDO
D2.2.3: Two (2) milk processing mini plants and 5 milk M&E DLDO
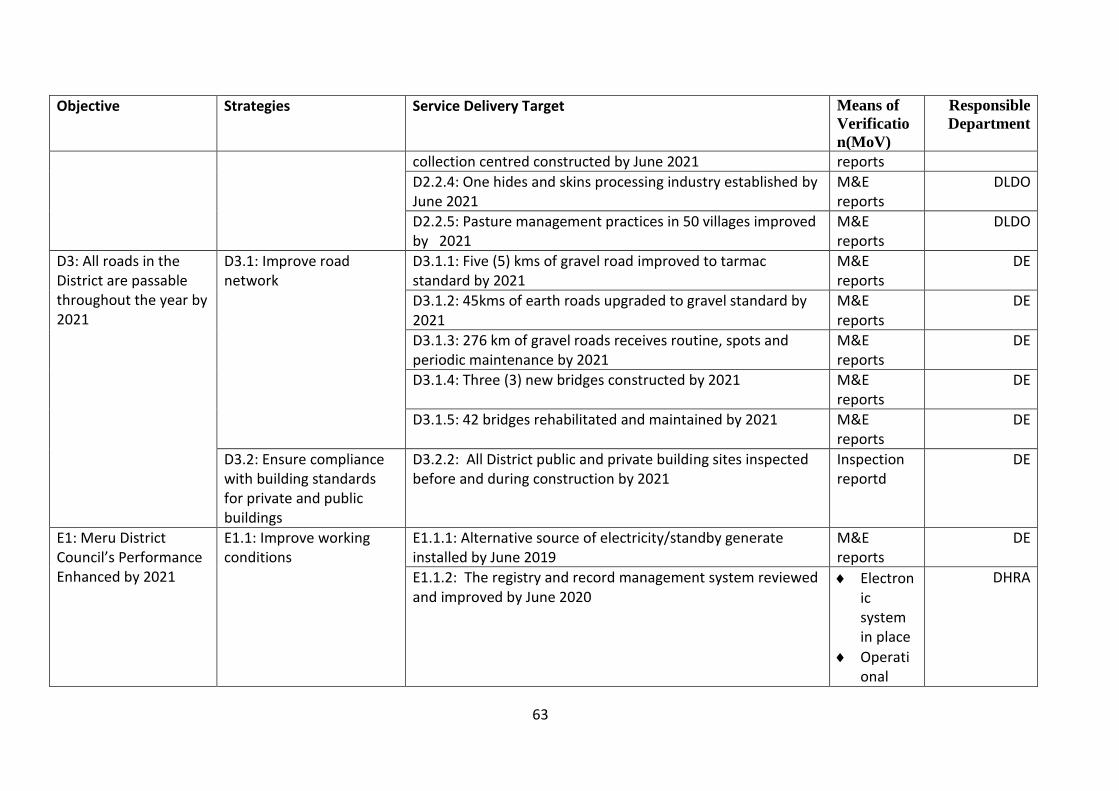
63
Objective Strategies Service Delivery Target Means of
Verificatio
n(MoV)
Responsible
Department
collection centred constructed by June 2021 reports
D2.2.4: One hides and skins processing industry established by June 2021
M&E reports
DLDO
D2.2.5: Pasture management practices in 50 villages improved by 2021
M&E reports
DLDO
D3: All roads in the District are passable throughout the year by 2021
D3.1: Improve road network
D3.1.1: Five (5) kms of gravel road improved to tarmac standard by 2021
M&E reports
DE
D3.1.2: 45kms of earth roads upgraded to gravel standard by 2021
M&E reports
DE
D3.1.3: 276 km of gravel roads receives routine, spots and periodic maintenance by 2021
M&E reports
DE
D3.1.4: Three (3) new bridges constructed by 2021 M&E reports
DE
D3.1.5: 42 bridges rehabilitated and maintained by 2021 M&E reports
DE
D3.2: Ensure compliance with building standards for private and public buildings
D3.2.2: All District public and private building sites inspected before and during construction by 2021
Inspection reportd
DE
E1: Meru District Council’s Performance Enhanced by 2021
E1.1: Improve working conditions
E1.1.1: Alternative source of electricity/standby generate installed by June 2019
M&E reports
DE
E1.1.2: The registry and record management system reviewed and improved by June 2020
Electronic system in place
Operational
DHRA
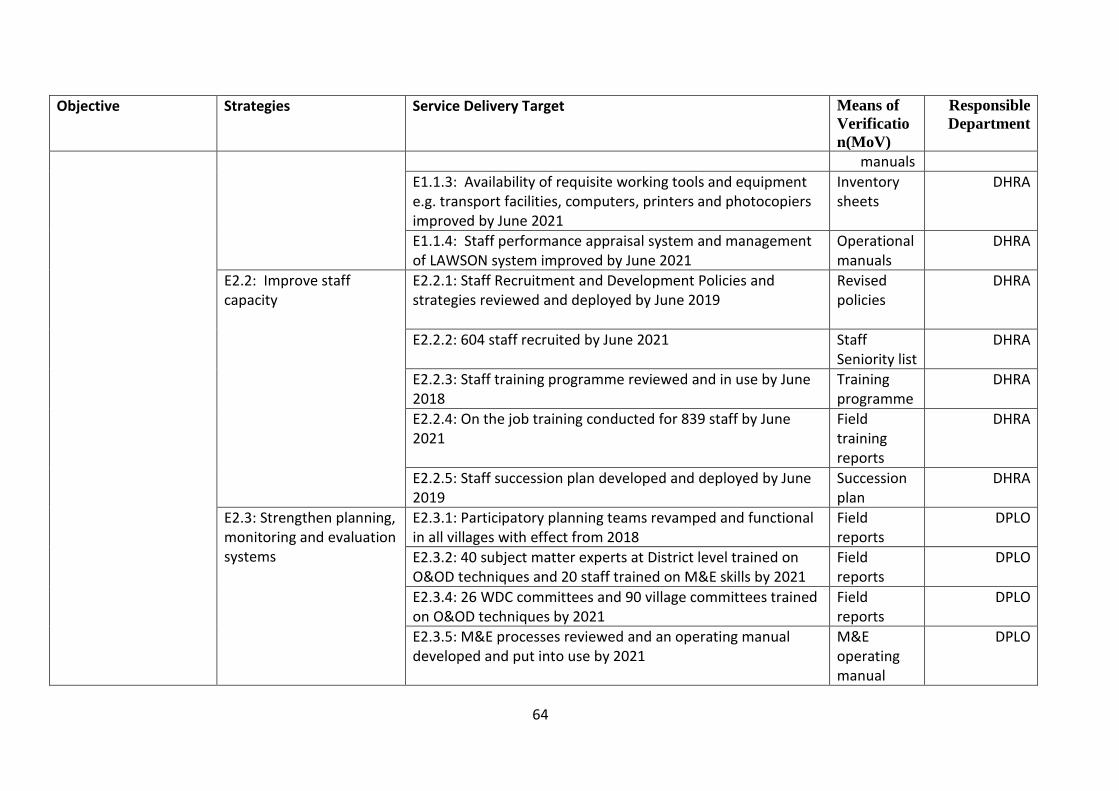
64
Objective Strategies Service Delivery Target Means of
Verificatio
n(MoV)
Responsible
Department
manuals
E1.1.3: Availability of requisite working tools and equipment e.g. transport facilities, computers, printers and photocopiers improved by June 2021
Inventory sheets
DHRA
E1.1.4: Staff performance appraisal system and management of LAWSON system improved by June 2021
Operational manuals
DHRA
E2.2: Improve staff capacity
E2.2.1: Staff Recruitment and Development Policies and strategies reviewed and deployed by June 2019
Revised policies
DHRA
E2.2.2: 604 staff recruited by June 2021 Staff Seniority list
DHRA
E2.2.3: Staff training programme reviewed and in use by June 2018
Training programme
DHRA
E2.2.4: On the job training conducted for 839 staff by June 2021
Field training reports
DHRA
E2.2.5: Staff succession plan developed and deployed by June 2019
Succession plan
DHRA
E2.3: Strengthen planning, monitoring and evaluation systems
E2.3.1: Participatory planning teams revamped and functional in all villages with effect from 2018
Field reports
DPLO
E2.3.2: 40 subject matter experts at District level trained on O&OD techniques and 20 staff trained on M&E skills by 2021
Field reports
DPLO
E2.3.4: 26 WDC committees and 90 village committees trained on O&OD techniques by 2021
Field reports
DPLO
E2.3.5: M&E processes reviewed and an operating manual developed and put into use by 2021
M&E operating manual
DPLO
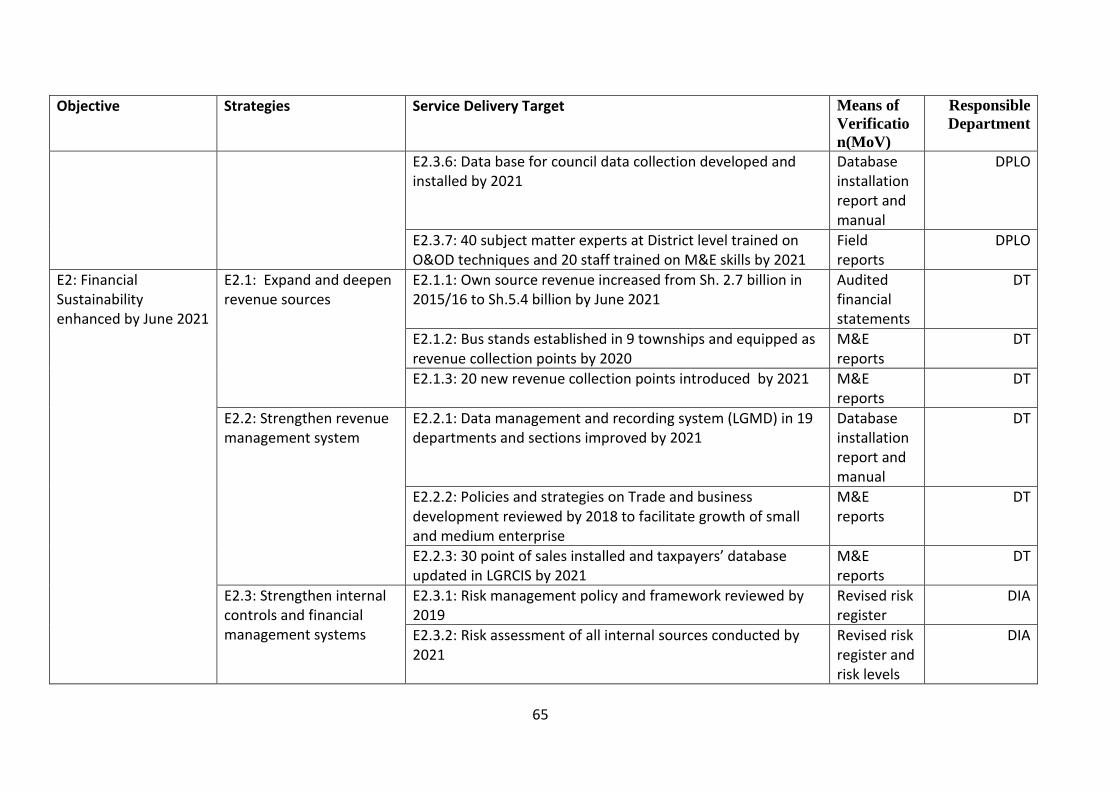
65
Objective Strategies Service Delivery Target Means of
Verificatio
n(MoV)
Responsible
Department
E2.3.6: Data base for council data collection developed and installed by 2021
Database installation report and manual
DPLO
E2.3.7: 40 subject matter experts at District level trained on O&OD techniques and 20 staff trained on M&E skills by 2021
Field reports
DPLO
E2: Financial Sustainability enhanced by June 2021
E2.1: Expand and deepen revenue sources
E2.1.1: Own source revenue increased from Sh. 2.7 billion in 2015/16 to Sh.5.4 billion by June 2021
Audited financial statements
DT
E2.1.2: Bus stands established in 9 townships and equipped as revenue collection points by 2020
M&E reports
DT
E2.1.3: 20 new revenue collection points introduced by 2021 M&E reports
DT
E2.2: Strengthen revenue management system
E2.2.1: Data management and recording system (LGMD) in 19 departments and sections improved by 2021
Database installation report and manual
DT
E2.2.2: Policies and strategies on Trade and business development reviewed by 2018 to facilitate growth of small and medium enterprise
M&E reports
DT
E2.2.3: 30 point of sales installed and taxpayers’ database updated in LGRCIS by 2021
M&E reports
DT
E2.3: Strengthen internal controls and financial management systems
E2.3.1: Risk management policy and framework reviewed by 2019
Revised risk register
DIA
E2.3.2: Risk assessment of all internal sources conducted by 2021
Revised risk register and risk levels
DIA
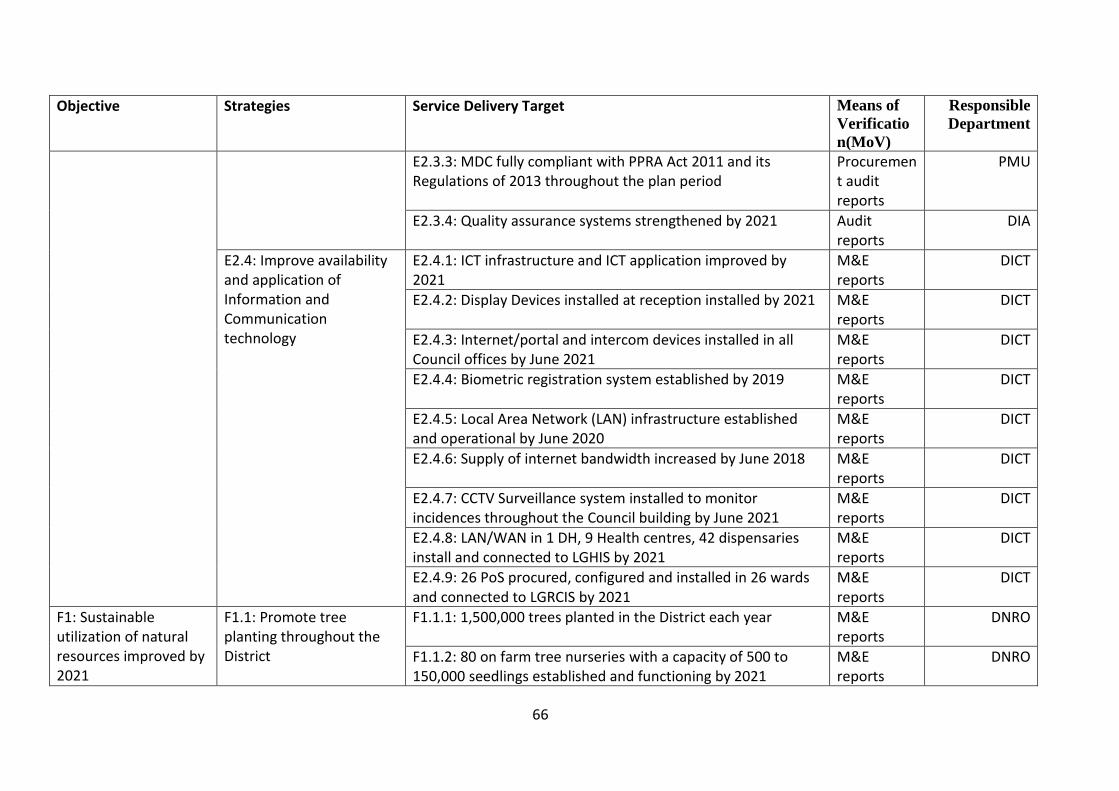
66
Objective Strategies Service Delivery Target Means of
Verificatio
n(MoV)
Responsible
Department
E2.3.3: MDC fully compliant with PPRA Act 2011 and its Regulations of 2013 throughout the plan period
Procurement audit reports
PMU
E2.3.4: Quality assurance systems strengthened by 2021 Audit reports
DIA
E2.4: Improve availability and application of Information and Communication technology
E2.4.1: ICT infrastructure and ICT application improved by 2021
M&E reports
DICT
E2.4.2: Display Devices installed at reception installed by 2021 M&E reports
DICT
E2.4.3: Internet/portal and intercom devices installed in all Council offices by June 2021
M&E reports
DICT
E2.4.4: Biometric registration system established by 2019 M&E reports
DICT
E2.4.5: Local Area Network (LAN) infrastructure established and operational by June 2020
M&E reports
DICT
E2.4.6: Supply of internet bandwidth increased by June 2018 M&E reports
DICT
E2.4.7: CCTV Surveillance system installed to monitor incidences throughout the Council building by June 2021
M&E reports
DICT
E2.4.8: LAN/WAN in 1 DH, 9 Health centres, 42 dispensaries install and connected to LGHIS by 2021
M&E reports
DICT
E2.4.9: 26 PoS procured, configured and installed in 26 wards and connected to LGRCIS by 2021
M&E reports
DICT
F1: Sustainable utilization of natural resources improved by 2021
F1.1: Promote tree planting throughout the District
F1.1.1: 1,500,000 trees planted in the District each year M&E reports
DNRO
F1.1.2: 80 on farm tree nurseries with a capacity of 500 to 150,000 seedlings established and functioning by 2021
M&E reports
DNRO
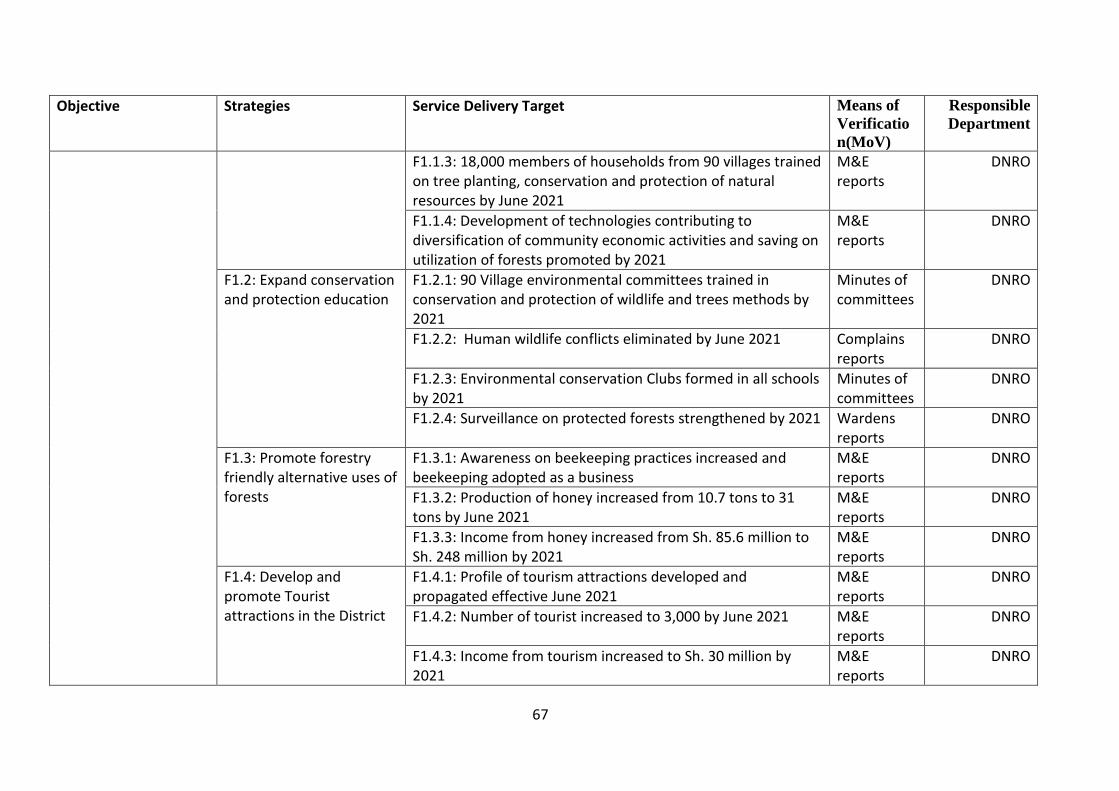
67
Objective Strategies Service Delivery Target Means of
Verificatio
n(MoV)
Responsible
Department
F1.1.3: 18,000 members of households from 90 villages trained on tree planting, conservation and protection of natural resources by June 2021
M&E reports
DNRO
F1.1.4: Development of technologies contributing to diversification of community economic activities and saving on utilization of forests promoted by 2021
M&E reports
DNRO
F1.2: Expand conservation and protection education
F1.2.1: 90 Village environmental committees trained in conservation and protection of wildlife and trees methods by 2021
Minutes of committees
DNRO
F1.2.2: Human wildlife conflicts eliminated by June 2021 Complains reports
DNRO
F1.2.3: Environmental conservation Clubs formed in all schools by 2021
Minutes of committees
DNRO
F1.2.4: Surveillance on protected forests strengthened by 2021 Wardens reports
DNRO
F1.3: Promote forestry friendly alternative uses of forests
F1.3.1: Awareness on beekeeping practices increased and beekeeping adopted as a business
M&E reports
DNRO
F1.3.2: Production of honey increased from 10.7 tons to 31 tons by June 2021
M&E reports
DNRO
F1.3.3: Income from honey increased from Sh. 85.6 million to Sh. 248 million by 2021
M&E reports
DNRO
F1.4: Develop and promote Tourist attractions in the District
F1.4.1: Profile of tourism attractions developed and propagated effective June 2021
M&E reports
DNRO
F1.4.2: Number of tourist increased to 3,000 by June 2021 M&E reports
DNRO
F1.4.3: Income from tourism increased to Sh. 30 million by 2021
M&E reports
DNRO
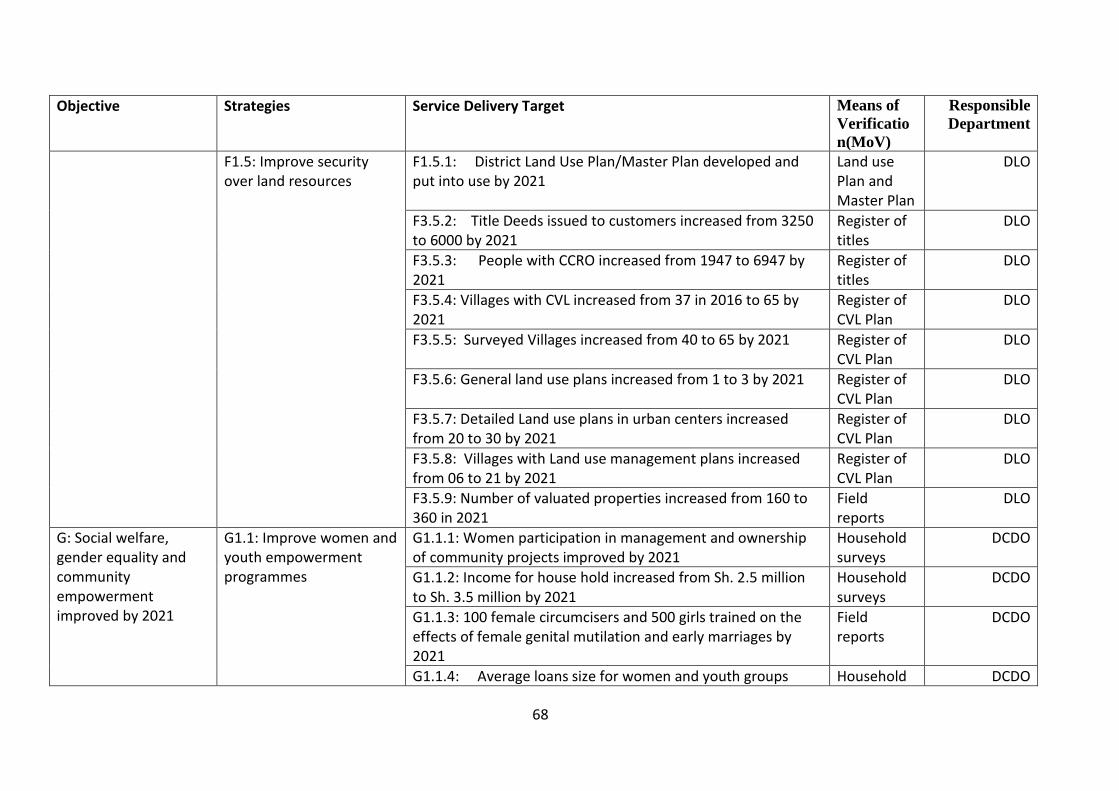
68
Objective Strategies Service Delivery Target Means of
Verificatio
n(MoV)
Responsible
Department
F1.5: Improve security over land resources
F1.5.1: District Land Use Plan/Master Plan developed and put into use by 2021
Land use Plan and Master Plan
DLO
F3.5.2: Title Deeds issued to customers increased from 3250 to 6000 by 2021
Register of titles
DLO
F3.5.3: People with CCRO increased from 1947 to 6947 by 2021
Register of titles
DLO
F3.5.4: Villages with CVL increased from 37 in 2016 to 65 by 2021
Register of CVL Plan
DLO
F3.5.5: Surveyed Villages increased from 40 to 65 by 2021 Register of CVL Plan
DLO
F3.5.6: General land use plans increased from 1 to 3 by 2021 Register of CVL Plan
DLO
F3.5.7: Detailed Land use plans in urban centers increased from 20 to 30 by 2021
Register of CVL Plan
DLO
F3.5.8: Villages with Land use management plans increased from 06 to 21 by 2021
Register of CVL Plan
DLO
F3.5.9: Number of valuated properties increased from 160 to 360 in 2021
Field reports
DLO
G: Social welfare, gender equality and community empowerment improved by 2021
G1.1: Improve women and youth empowerment programmes
G1.1.1: Women participation in management and ownership of community projects improved by 2021
Household surveys
DCDO
G1.1.2: Income for house hold increased from Sh. 2.5 million to Sh. 3.5 million by 2021
Household surveys
DCDO
G1.1.3: 100 female circumcisers and 500 girls trained on the effects of female genital mutilation and early marriages by 2021
Field reports
DCDO
G1.1.4: Average loans size for women and youth groups Household DCDO
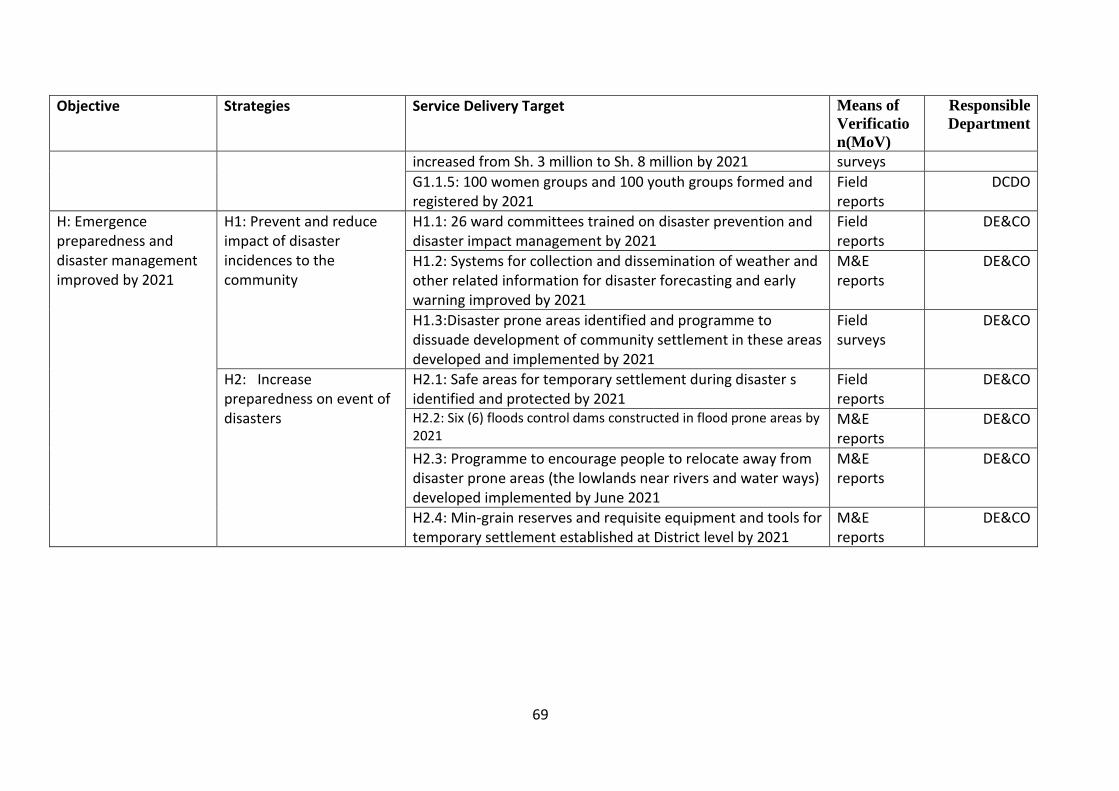
69
Objective Strategies Service Delivery Target Means of
Verificatio
n(MoV)
Responsible
Department
increased from Sh. 3 million to Sh. 8 million by 2021 surveys
G1.1.5: 100 women groups and 100 youth groups formed and registered by 2021
Field reports
DCDO
H: Emergence preparedness and disaster management improved by 2021
H1: Prevent and reduce impact of disaster incidences to the community
H1.1: 26 ward committees trained on disaster prevention and disaster impact management by 2021
Field reports
DE&CO
H1.2: Systems for collection and dissemination of weather and other related information for disaster forecasting and early warning improved by 2021
M&E reports
DE&CO
H1.3:Disaster prone areas identified and programme to dissuade development of community settlement in these areas developed and implemented by 2021
Field surveys
DE&CO
H2: Increase preparedness on event of disasters
H2.1: Safe areas for temporary settlement during disaster s identified and protected by 2021
Field reports
DE&CO
H2.2: Six (6) floods control dams constructed in flood prone areas by 2021
M&E reports
DE&CO
H2.3: Programme to encourage people to relocate away from disaster prone areas (the lowlands near rivers and water ways) developed implemented by June 2021
M&E reports
DE&CO
H2.4: Min-grain reserves and requisite equipment and tools for temporary settlement established at District level by 2021
M&E reports
DE&CO
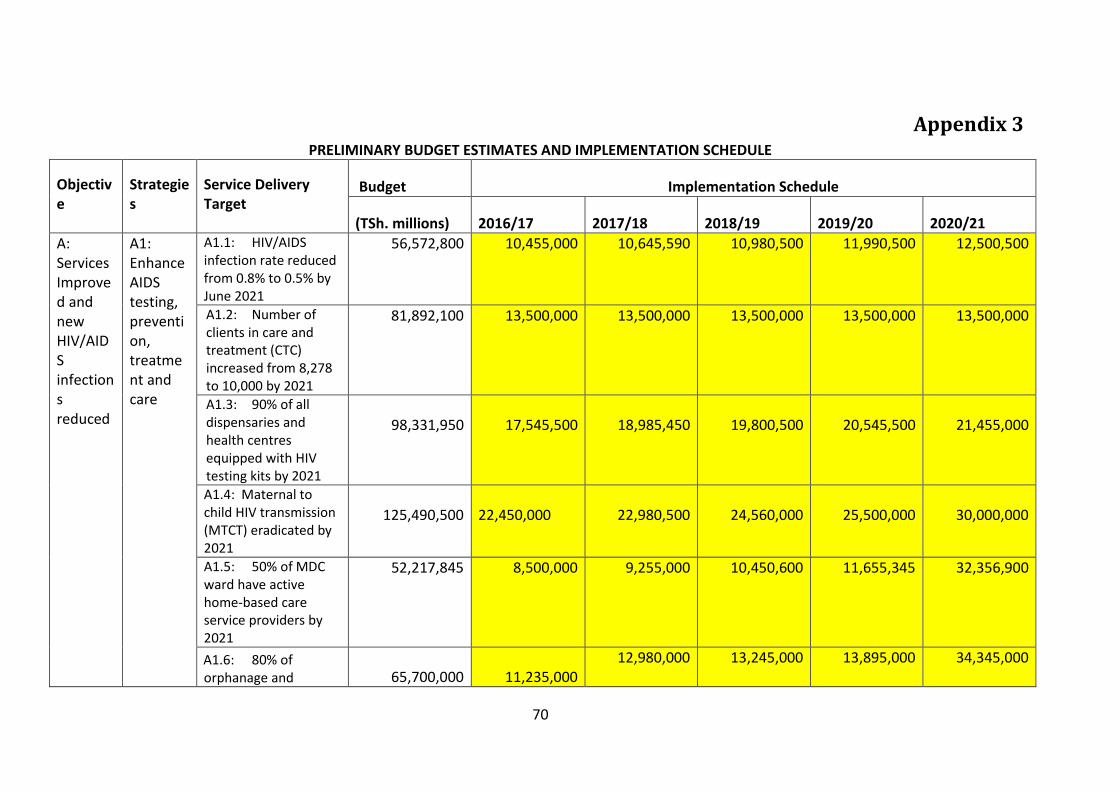
70
Appendix 3 PRELIMINARY BUDGET ESTIMATES AND IMPLEMENTATION SCHEDULE
Objective
Strategies
Service Delivery Target
Budget Implementation Schedule
(TSh. millions) 2016/17 2017/18 2018/19 2019/20 2020/21
A: Services Improved and new HIV/AIDS infections reduced
A1: Enhance AIDS testing, prevention, treatment and care
A1.1: HIV/AIDS infection rate reduced from 0.8% to 0.5% by June 2021
56,572,800 10,455,000 10,645,590 10,980,500 11,990,500 12,500,500
A1.2: Number of clients in care and treatment (CTC) increased from 8,278 to 10,000 by 2021
81,892,100
13,500,000 13,500,000 13,500,000 13,500,000 13,500,000
A1.3: 90% of all dispensaries and health centres equipped with HIV testing kits by 2021
98,331,950
17,545,500
18,985,450
19,800,500
20,545,500
21,455,000
A1.4: Maternal to child HIV transmission (MTCT) eradicated by 2021
125,490,500
22,450,000
22,980,500
24,560,000
25,500,000
30,000,000
A1.5: 50% of MDC ward have active home-based care service providers by 2021
52,217,845
8,500,000
9,255,000
10,450,600
11,655,345
32,356,900
A1.6: 80% of orphanage and
65,700,000
11,235,000
12,980,000
13,245,000
13,895,000
34,345,000
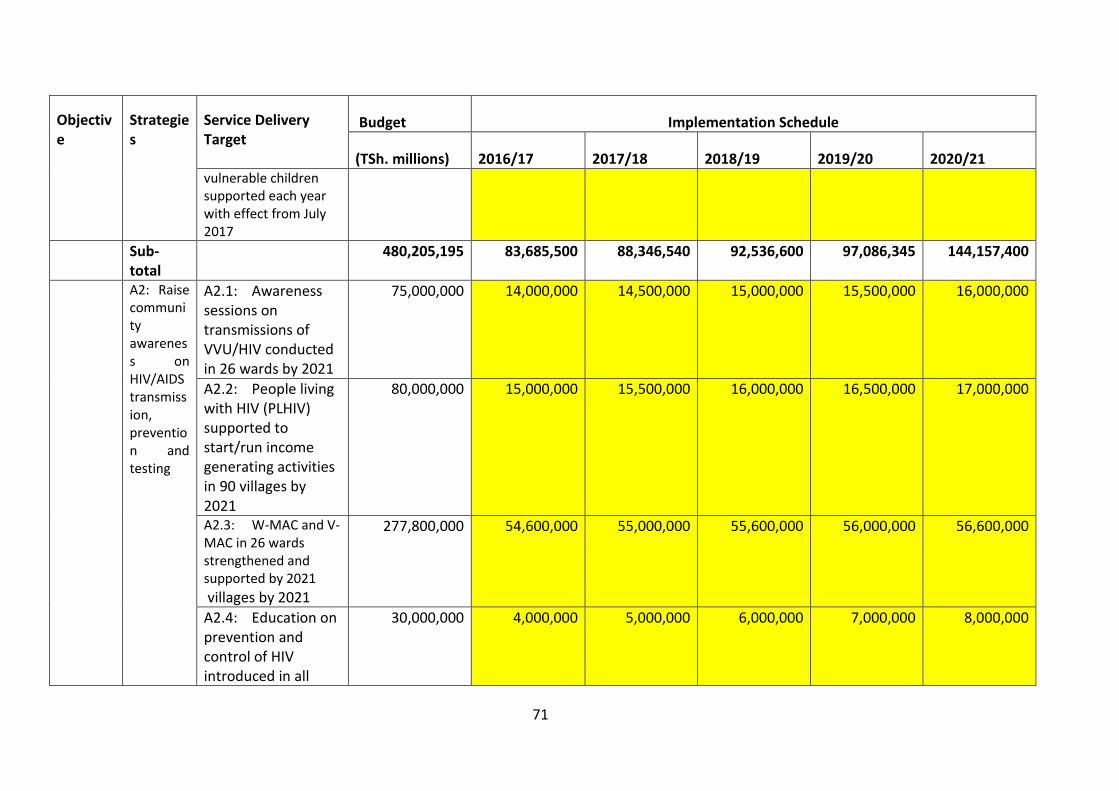
71
Objective
Strategies
Service Delivery Target
Budget Implementation Schedule
(TSh. millions) 2016/17 2017/18 2018/19 2019/20 2020/21 vulnerable children supported each year with effect from July 2017
Sub-total
480,205,195 83,685,500 88,346,540 92,536,600 97,086,345 144,157,400
A2: Raise community awareness on HIV/AIDS transmission, prevention and testing
A2.1: Awareness sessions on transmissions of VVU/HIV conducted in 26 wards by 2021
75,000,000
14,000,000 14,500,000 15,000,000 15,500,000 16,000,000
A2.2: People living with HIV (PLHIV) supported to start/run income generating activities in 90 villages by 2021
80,000,000
15,000,000 15,500,000 16,000,000 16,500,000 17,000,000
A2.3: W-MAC and V-MAC in 26 wards strengthened and supported by 2021
villages by 2021
277,800,000
54,600,000 55,000,000 55,600,000 56,000,000 56,600,000
A2.4: Education on prevention and control of HIV introduced in all
30,000,000
4,000,000 5,000,000 6,000,000 7,000,000 8,000,000
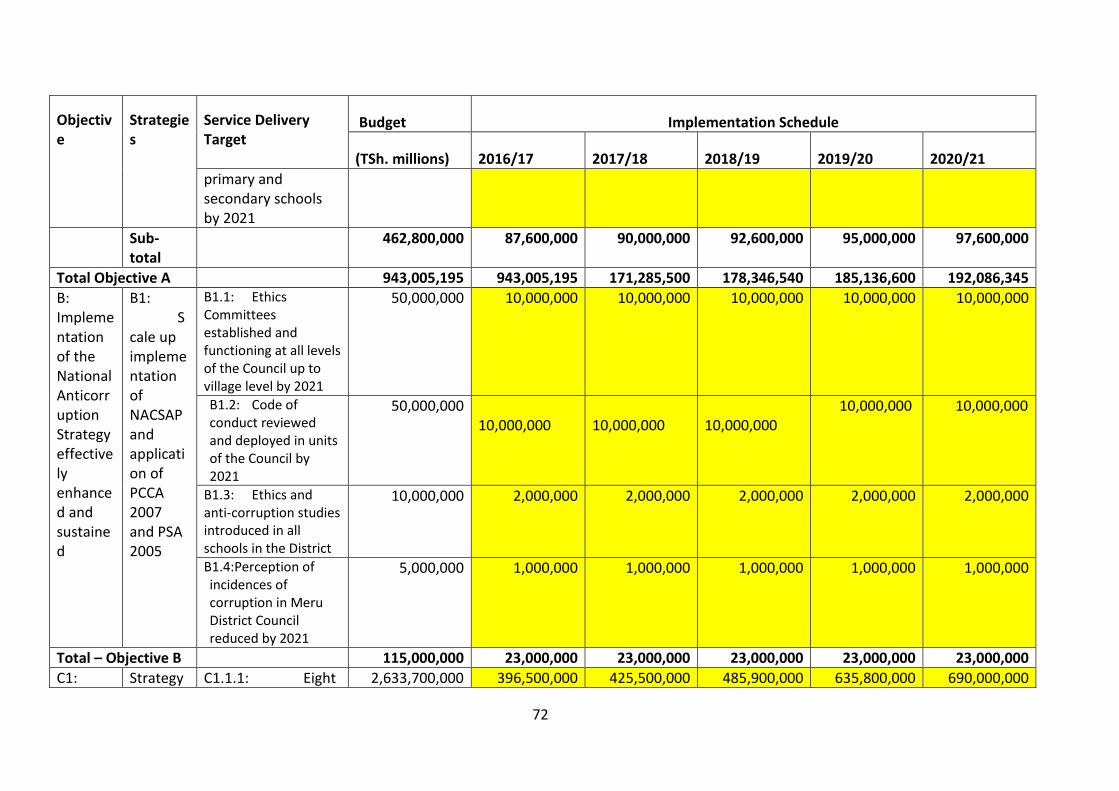
72
Objective
Strategies
Service Delivery Target
Budget Implementation Schedule
(TSh. millions) 2016/17 2017/18 2018/19 2019/20 2020/21
primary and secondary schools by 2021
Sub-total
462,800,000 87,600,000 90,000,000 92,600,000 95,000,000 97,600,000
Total Objective A 943,005,195 943,005,195 171,285,500 178,346,540 185,136,600 192,086,345
B: Implementation of the National Anticorruption Strategy effectively enhanced and sustained
B1: Scale up implementation of NACSAP and application of PCCA 2007 and PSA 2005
B1.1: Ethics Committees established and functioning at all levels of the Council up to village level by 2021
50,000,000 10,000,000 10,000,000 10,000,000 10,000,000 10,000,000
B1.2: Code of conduct reviewed and deployed in units of the Council by 2021
50,000,000 10,000,000
10,000,000
10,000,000
10,000,000 10,000,000
B1.3: Ethics and anti-corruption studies introduced in all schools in the District
10,000,000 2,000,000 2,000,000 2,000,000 2,000,000 2,000,000
B1.4:Perception of incidences of corruption in Meru District Council reduced by 2021
5,000,000 1,000,000 1,000,000 1,000,000 1,000,000 1,000,000
Total – Objective B 115,000,000 23,000,000 23,000,000 23,000,000 23,000,000 23,000,000
C1: Strategy C1.1.1: Eight 2,633,700,000 396,500,000 425,500,000 485,900,000 635,800,000 690,000,000
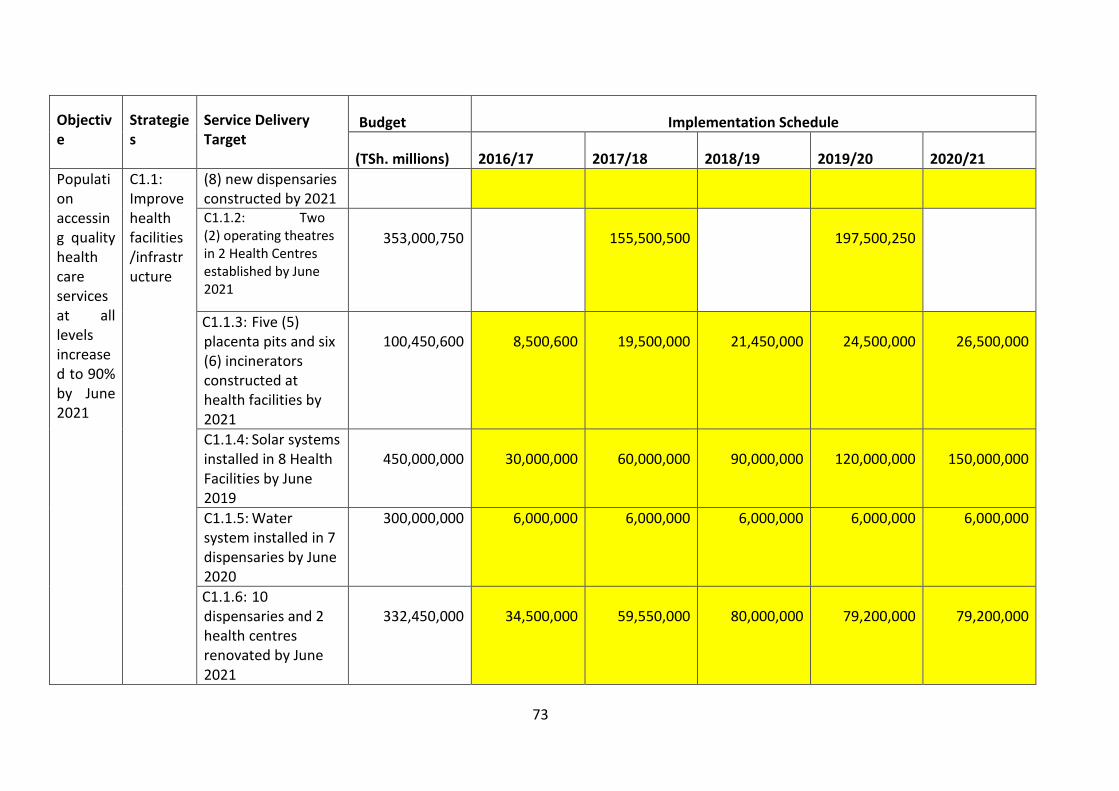
73
Objective
Strategies
Service Delivery Target
Budget Implementation Schedule
(TSh. millions) 2016/17 2017/18 2018/19 2019/20 2020/21
Population accessing quality health care services at all levels increased to 90% by June 2021
C1.1: Improve health facilities /infrastructure
(8) new dispensaries constructed by 2021 C1.1.2: Two (2) operating theatres in 2 Health Centres established by June 2021
353,000,750
155,500,500
197,500,250
C1.1.3: Five (5) placenta pits and six (6) incinerators constructed at health facilities by 2021
100,450,600
8,500,600
19,500,000
21,450,000
24,500,000
26,500,000
C1.1.4: Solar systems installed in 8 Health Facilities by June 2019
450,000,000
30,000,000
60,000,000
90,000,000
120,000,000
150,000,000
C1.1.5: Water system installed in 7 dispensaries by June 2020
300,000,000 6,000,000 6,000,000 6,000,000 6,000,000 6,000,000
C1.1.6: 10 dispensaries and 2 health centres renovated by June 2021
332,450,000
34,500,000
59,550,000
80,000,000
79,200,000
79,200,000
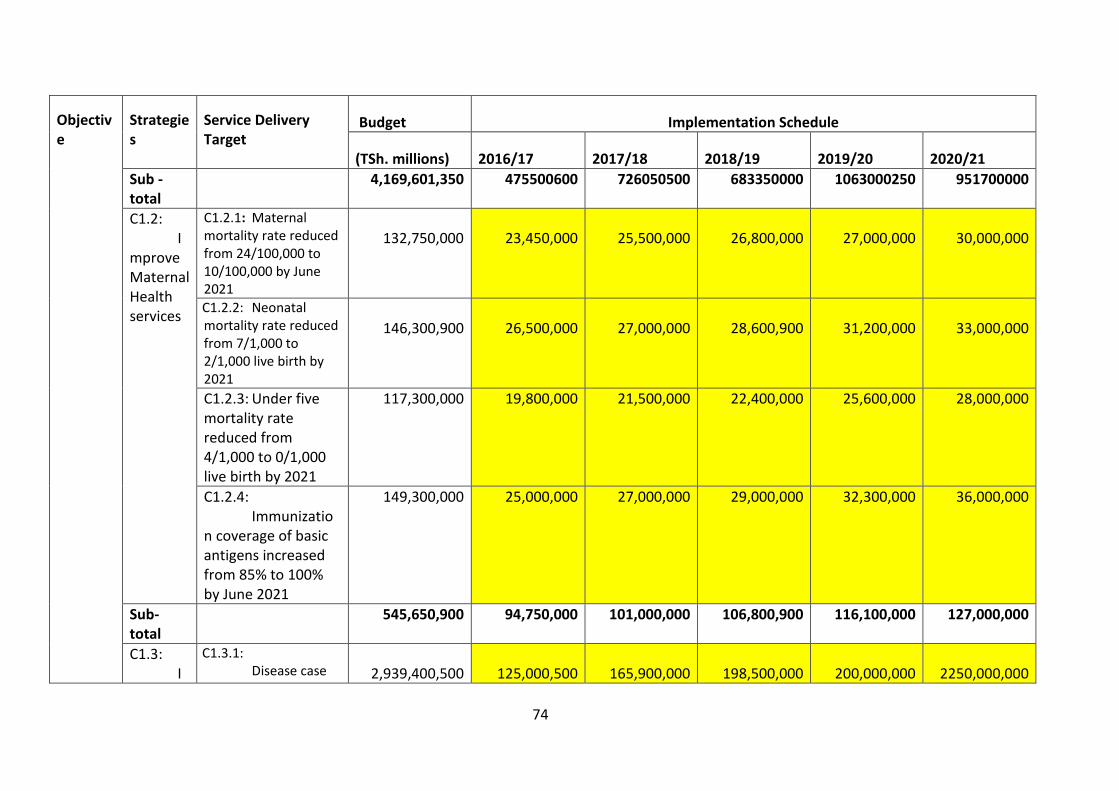
74
Objective
Strategies
Service Delivery Target
Budget Implementation Schedule
(TSh. millions) 2016/17 2017/18 2018/19 2019/20 2020/21
Sub -total
4,169,601,350 475500600 726050500 683350000 1063000250 951700000
C1.2: Improve Maternal Health services
C1.2.1: Maternal mortality rate reduced from 24/100,000 to 10/100,000 by June 2021
132,750,000
23,450,000
25,500,000
26,800,000
27,000,000
30,000,000
C1.2.2: Neonatal mortality rate reduced from 7/1,000 to 2/1,000 live birth by 2021
146,300,900
26,500,000
27,000,000
28,600,900
31,200,000
33,000,000
C1.2.3: Under five mortality rate reduced from 4/1,000 to 0/1,000 live birth by 2021
117,300,000
19,800,000 21,500,000 22,400,000 25,600,000 28,000,000
C1.2.4: Immunization coverage of basic antigens increased from 85% to 100% by June 2021
149,300,000
25,000,000 27,000,000 29,000,000 32,300,000 36,000,000
Sub-total
545,650,900 94,750,000 101,000,000 106,800,900 116,100,000 127,000,000
C1.3: I
C1.3.1: Disease case
2,939,400,500
125,000,500
165,900,000
198,500,000
200,000,000
2250,000,000
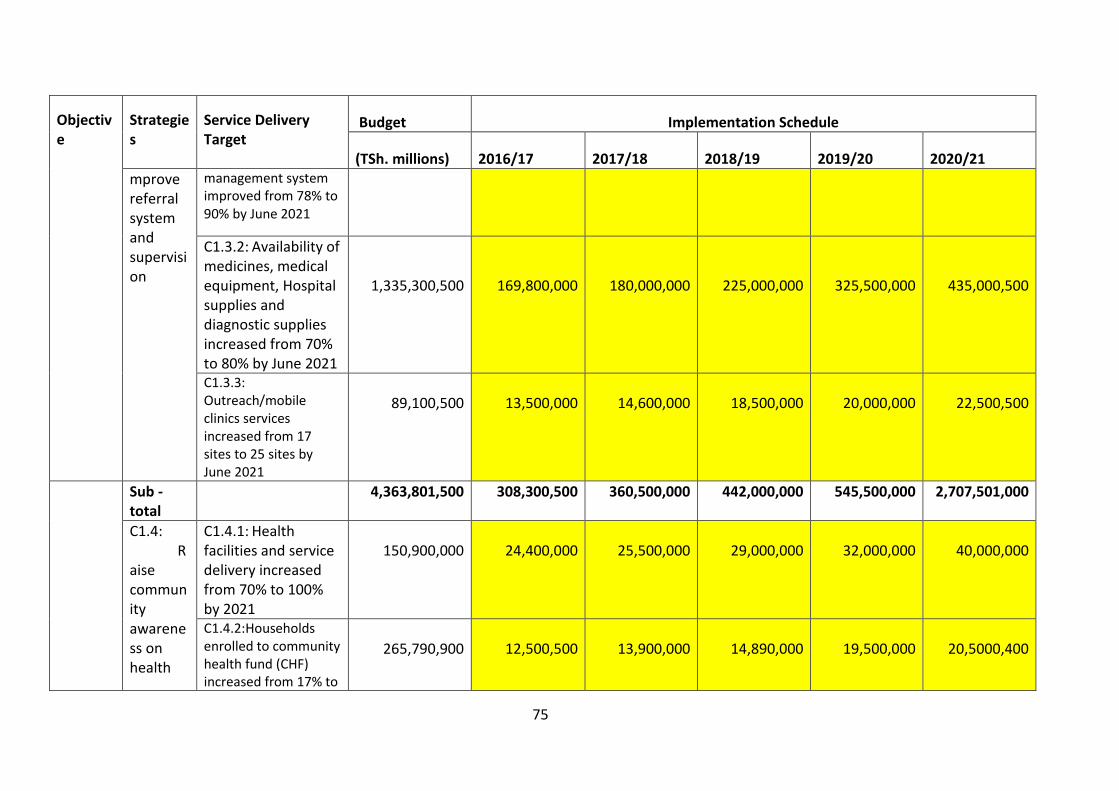
75
Objective
Strategies
Service Delivery Target
Budget Implementation Schedule
(TSh. millions) 2016/17 2017/18 2018/19 2019/20 2020/21
mprove referral system and supervision
management system improved from 78% to 90% by June 2021
C1.3.2: Availability of medicines, medical equipment, Hospital supplies and diagnostic supplies increased from 70% to 80% by June 2021
1,335,300,500
169,800,000
180,000,000
225,000,000
325,500,000
435,000,500
C1.3.3: Outreach/mobile clinics services increased from 17 sites to 25 sites by June 2021
89,100,500
13,500,000
14,600,000
18,500,000
20,000,000
22,500,500
Sub - total
4,363,801,500 308,300,500 360,500,000 442,000,000 545,500,000 2,707,501,000
C1.4: Raise community awareness on health
C1.4.1: Health facilities and service delivery increased from 70% to 100% by 2021
150,900,000
24,400,000
25,500,000
29,000,000
32,000,000
40,000,000
C1.4.2:Households enrolled to community health fund (CHF) increased from 17% to
265,790,900
12,500,500
13,900,000
14,890,000
19,500,000
20,5000,400
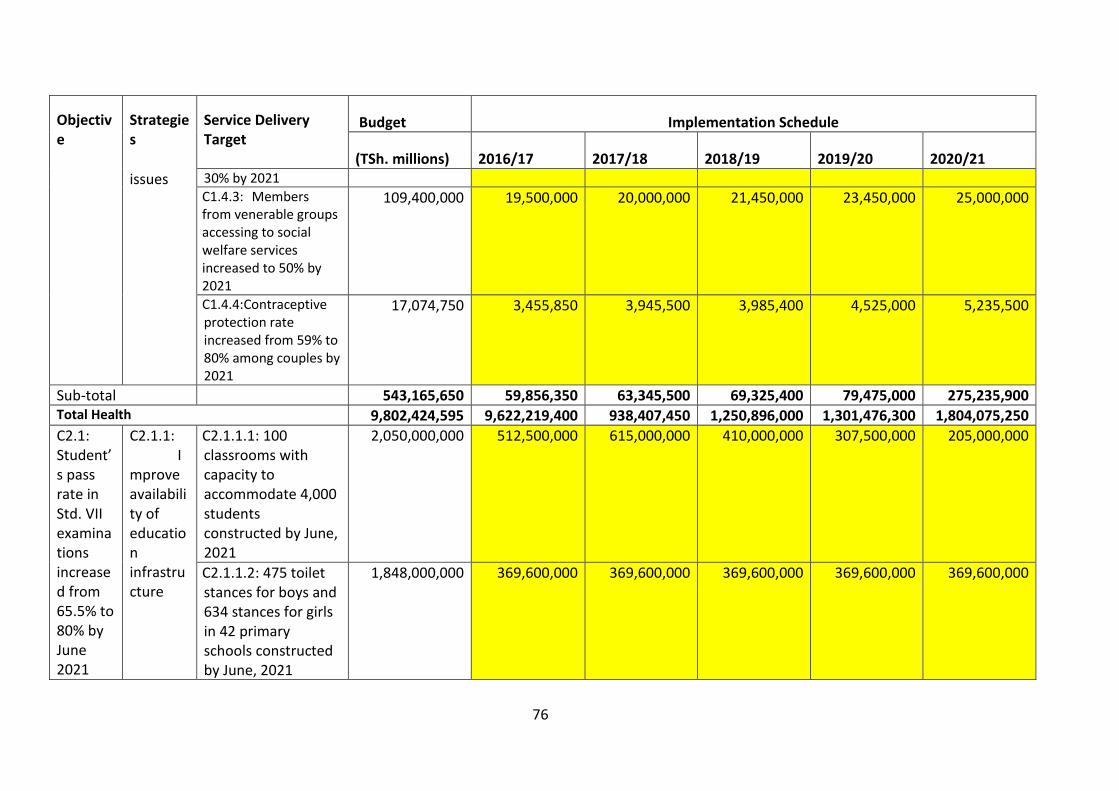
76
Objective
Strategies
Service Delivery Target
Budget Implementation Schedule
(TSh. millions) 2016/17 2017/18 2018/19 2019/20 2020/21
issues 30% by 2021
C1.4.3: Members from venerable groups accessing to social welfare services increased to 50% by 2021
109,400,000
19,500,000 20,000,000 21,450,000 23,450,000 25,000,000
C1.4.4:Contraceptive protection rate increased from 59% to 80% among couples by 2021
17,074,750 3,455,850 3,945,500 3,985,400 4,525,000 5,235,500
Sub-total 543,165,650 59,856,350 63,345,500 69,325,400 79,475,000 275,235,900 Total Health 9,802,424,595 9,622,219,400 938,407,450 1,250,896,000 1,301,476,300 1,804,075,250
C2.1: Student’s pass rate in Std. VII examinations increased from 65.5% to 80% by June 2021
C2.1.1: Improve availability of education infrastructure
C2.1.1.1: 100 classrooms with capacity to accommodate 4,000 students constructed by June, 2021
2,050,000,000 512,500,000 615,000,000 410,000,000 307,500,000 205,000,000
C2.1.1.2: 475 toilet stances for boys and 634 stances for girls in 42 primary schools constructed by June, 2021
1,848,000,000 369,600,000 369,600,000 369,600,000 369,600,000 369,600,000
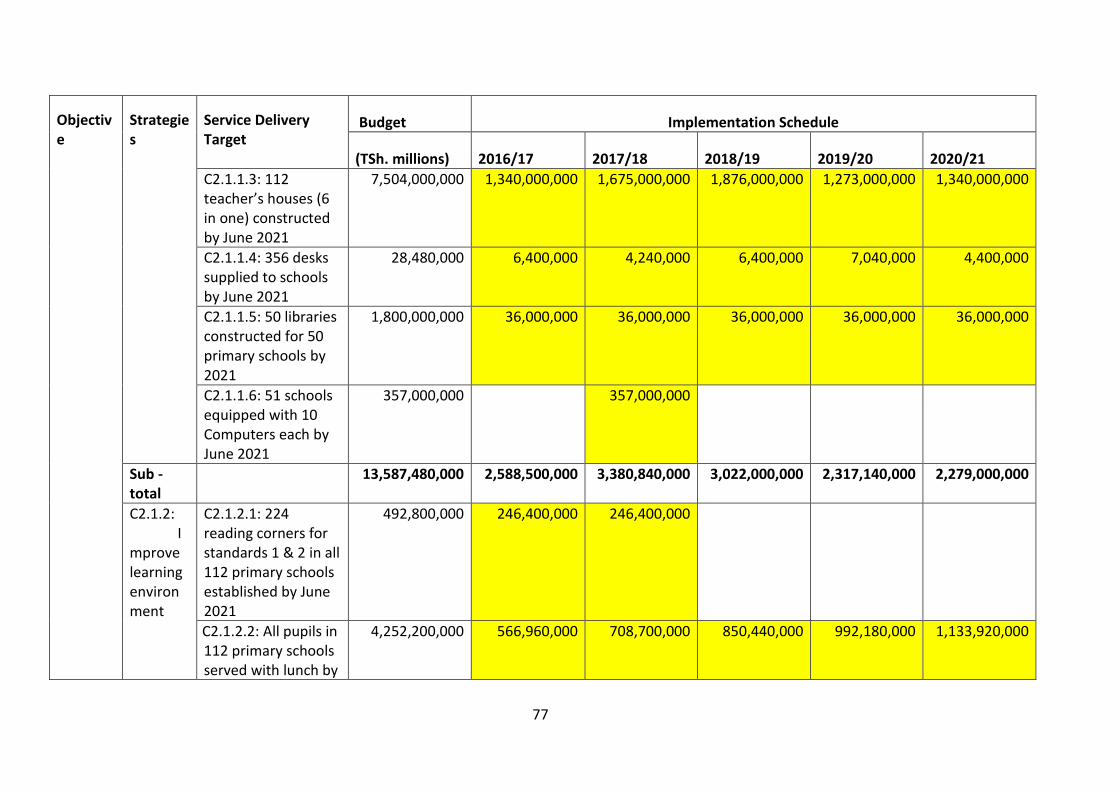
77
Objective
Strategies
Service Delivery Target
Budget Implementation Schedule
(TSh. millions) 2016/17 2017/18 2018/19 2019/20 2020/21
C2.1.1.3: 112 teacher’s houses (6 in one) constructed by June 2021
7,504,000,000 1,340,000,000 1,675,000,000 1,876,000,000 1,273,000,000 1,340,000,000
C2.1.1.4: 356 desks supplied to schools by June 2021
28,480,000 6,400,000 4,240,000 6,400,000 7,040,000 4,400,000
C2.1.1.5: 50 libraries constructed for 50 primary schools by 2021
1,800,000,000 36,000,000 36,000,000 36,000,000 36,000,000 36,000,000
C2.1.1.6: 51 schools equipped with 10 Computers each by June 2021
357,000,000 357,000,000
Sub - total
13,587,480,000 2,588,500,000 3,380,840,000 3,022,000,000 2,317,140,000 2,279,000,000
C2.1.2: Improve learning environment
C2.1.2.1: 224 reading corners for standards 1 & 2 in all 112 primary schools established by June 2021
492,800,000 246,400,000 246,400,000
C2.1.2.2: All pupils in 112 primary schools served with lunch by
4,252,200,000 566,960,000 708,700,000 850,440,000 992,180,000 1,133,920,000
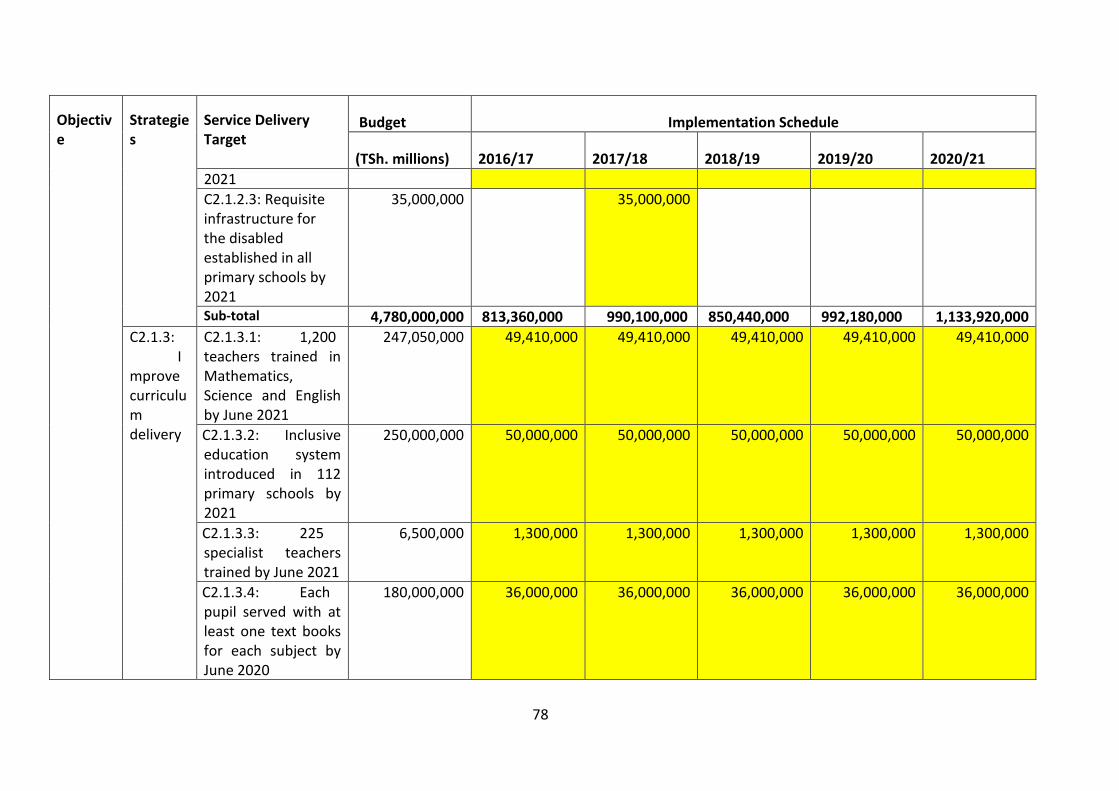
78
Objective
Strategies
Service Delivery Target
Budget Implementation Schedule
(TSh. millions) 2016/17 2017/18 2018/19 2019/20 2020/21
2021
C2.1.2.3: Requisite infrastructure for the disabled established in all primary schools by 2021
35,000,000 35,000,000
Sub-total 4,780,000,000 813,360,000 990,100,000 850,440,000 992,180,000 1,133,920,000
C2.1.3: Improve curriculum delivery
C2.1.3.1: 1,200 teachers trained in Mathematics, Science and English by June 2021
247,050,000 49,410,000 49,410,000 49,410,000 49,410,000 49,410,000
C2.1.3.2: Inclusive education system introduced in 112 primary schools by 2021
250,000,000 50,000,000 50,000,000 50,000,000 50,000,000 50,000,000
C2.1.3.3: 225 specialist teachers trained by June 2021
6,500,000 1,300,000 1,300,000 1,300,000 1,300,000 1,300,000
C2.1.3.4: Each pupil served with at least one text books for each subject by June 2020
180,000,000 36,000,000 36,000,000 36,000,000 36,000,000 36,000,000
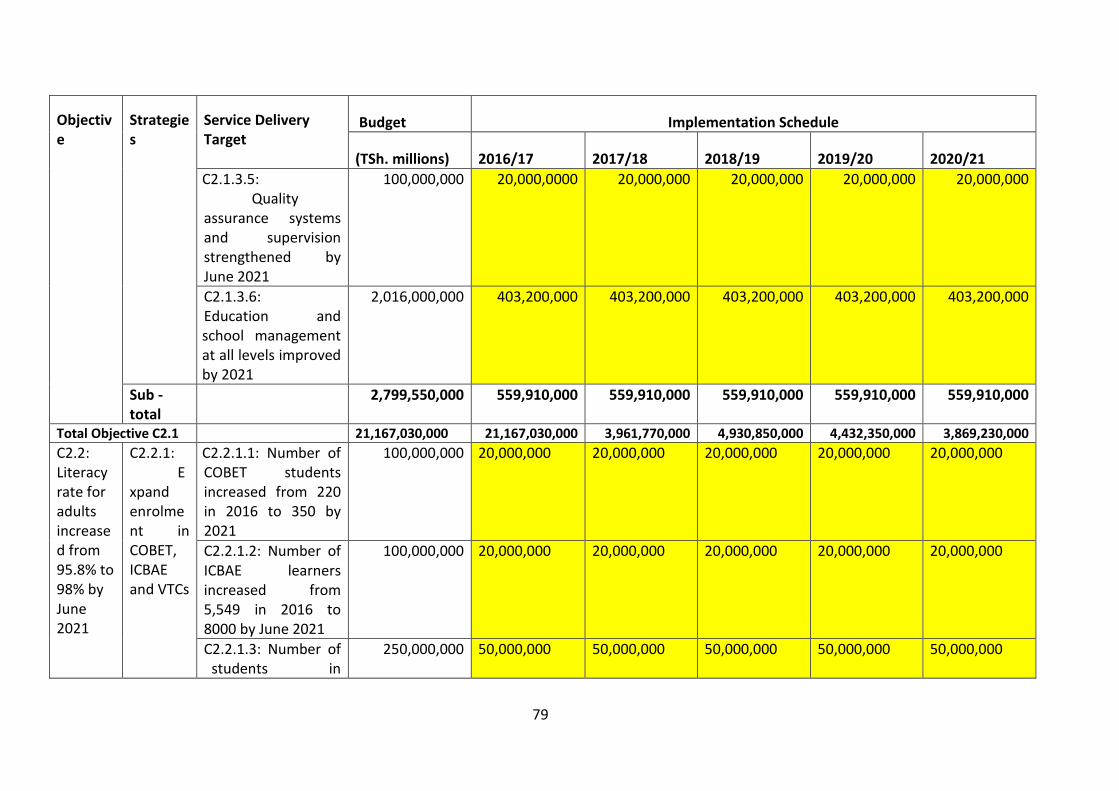
79
Objective
Strategies
Service Delivery Target
Budget Implementation Schedule
(TSh. millions) 2016/17 2017/18 2018/19 2019/20 2020/21
C2.1.3.5: Quality assurance systems and supervision strengthened by June 2021
100,000,000 20,000,0000 20,000,000 20,000,000 20,000,000 20,000,000
C2.1.3.6: Education and school management at all levels improved by 2021
2,016,000,000 403,200,000 403,200,000 403,200,000 403,200,000 403,200,000
Sub - total
2,799,550,000 559,910,000 559,910,000 559,910,000 559,910,000 559,910,000
Total Objective C2.1 21,167,030,000 21,167,030,000 3,961,770,000 4,930,850,000 4,432,350,000 3,869,230,000
C2.2: Literacy rate for adults increased from 95.8% to 98% by June 2021
C2.2.1: Expand enrolment in COBET, ICBAE and VTCs
C2.2.1.1: Number of COBET students increased from 220 in 2016 to 350 by 2021
100,000,000 20,000,000 20,000,000 20,000,000 20,000,000 20,000,000
C2.2.1.2: Number of ICBAE learners increased from 5,549 in 2016 to 8000 by June 2021
100,000,000 20,000,000 20,000,000 20,000,000 20,000,000 20,000,000
C2.2.1.3: Number of students in
250,000,000 50,000,000 50,000,000 50,000,000 50,000,000 50,000,000
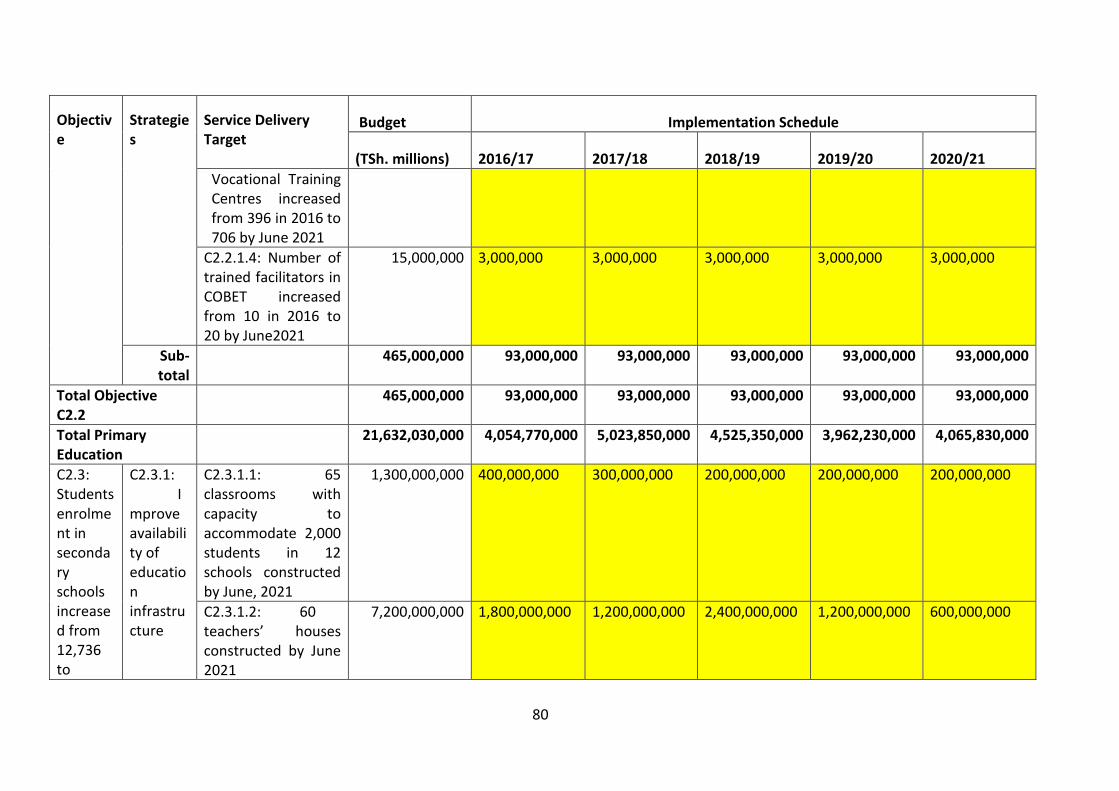
80
Objective
Strategies
Service Delivery Target
Budget Implementation Schedule
(TSh. millions) 2016/17 2017/18 2018/19 2019/20 2020/21
Vocational Training Centres increased from 396 in 2016 to 706 by June 2021
C2.2.1.4: Number of trained facilitators in COBET increased from 10 in 2016 to 20 by June2021
15,000,000 3,000,000 3,000,000 3,000,000 3,000,000 3,000,000
Sub-total
465,000,000 93,000,000 93,000,000 93,000,000 93,000,000 93,000,000
Total Objective C2.2
465,000,000 93,000,000 93,000,000 93,000,000 93,000,000 93,000,000
Total Primary Education
21,632,030,000 4,054,770,000 5,023,850,000 4,525,350,000 3,962,230,000 4,065,830,000
C2.3: Students enrolment in secondary schools increased from 12,736 to
C2.3.1: Improve availability of education infrastructure
C2.3.1.1: 65 classrooms with capacity to accommodate 2,000 students in 12 schools constructed by June, 2021
1,300,000,000 400,000,000 300,000,000 200,000,000 200,000,000 200,000,000
C2.3.1.2: 60 teachers’ houses constructed by June 2021
7,200,000,000 1,800,000,000 1,200,000,000 2,400,000,000 1,200,000,000 600,000,000
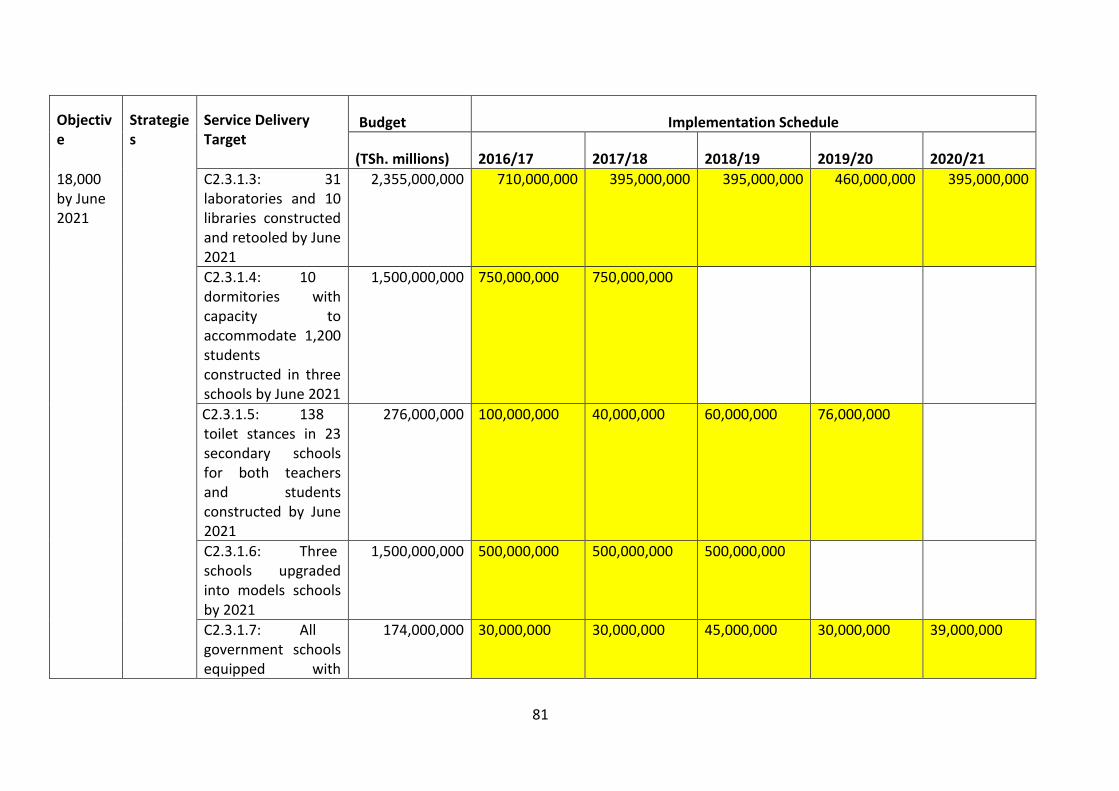
81
Objective
Strategies
Service Delivery Target
Budget Implementation Schedule
(TSh. millions) 2016/17 2017/18 2018/19 2019/20 2020/21
18,000 by June 2021
C2.3.1.3: 31 laboratories and 10 libraries constructed and retooled by June 2021
2,355,000,000 710,000,000 395,000,000 395,000,000 460,000,000 395,000,000
C2.3.1.4: 10 dormitories with capacity to accommodate 1,200 students constructed in three schools by June 2021
1,500,000,000 750,000,000 750,000,000
C2.3.1.5: 138 toilet stances in 23 secondary schools for both teachers and students constructed by June 2021
276,000,000 100,000,000 40,000,000 60,000,000 76,000,000
C2.3.1.6: Three schools upgraded into models schools by 2021
1,500,000,000 500,000,000 500,000,000 500,000,000
C2.3.1.7: All government schools equipped with
174,000,000 30,000,000 30,000,000 45,000,000 30,000,000 39,000,000
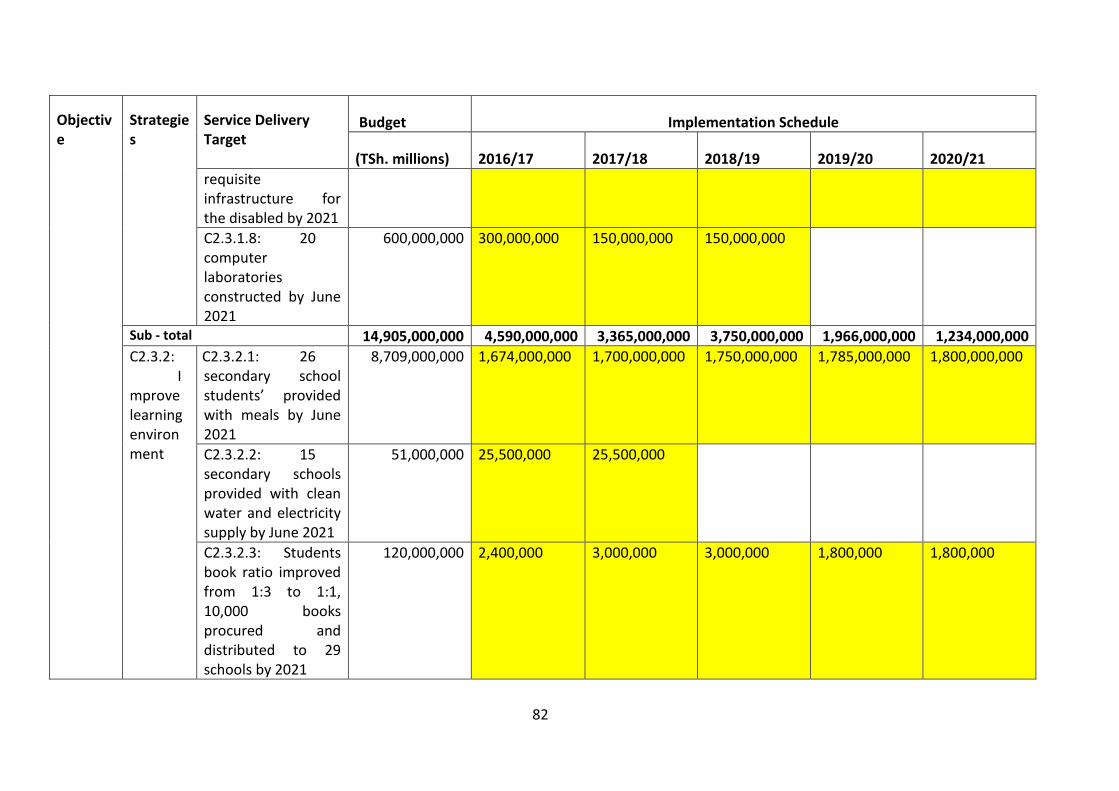
82
Objective
Strategies
Service Delivery Target
Budget Implementation Schedule
(TSh. millions) 2016/17 2017/18 2018/19 2019/20 2020/21
requisite infrastructure for the disabled by 2021
C2.3.1.8: 20 computer laboratories constructed by June 2021
600,000,000 300,000,000 150,000,000 150,000,000
Sub - total 14,905,000,000 4,590,000,000 3,365,000,000 3,750,000,000 1,966,000,000 1,234,000,000
C2.3.2: Improve learning environment
C2.3.2.1: 26 secondary school students’ provided with meals by June 2021
8,709,000,000 1,674,000,000 1,700,000,000 1,750,000,000 1,785,000,000 1,800,000,000
C2.3.2.2: 15 secondary schools provided with clean water and electricity supply by June 2021
51,000,000 25,500,000 25,500,000
C2.3.2.3: Students book ratio improved from 1:3 to 1:1, 10,000 books procured and distributed to 29 schools by 2021
120,000,000 2,400,000 3,000,000 3,000,000 1,800,000 1,800,000
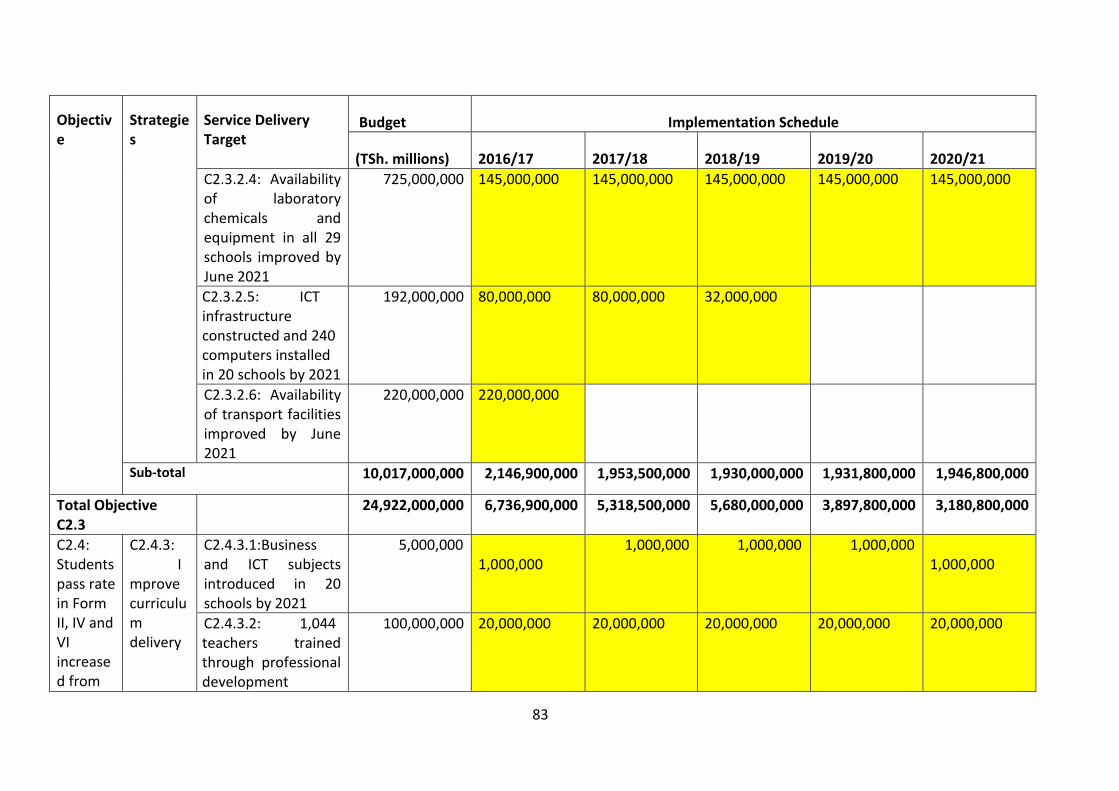
83
Objective
Strategies
Service Delivery Target
Budget Implementation Schedule
(TSh. millions) 2016/17 2017/18 2018/19 2019/20 2020/21
C2.3.2.4: Availability of laboratory chemicals and equipment in all 29 schools improved by June 2021
725,000,000 145,000,000 145,000,000 145,000,000 145,000,000 145,000,000
C2.3.2.5: ICT infrastructure constructed and 240 computers installed in 20 schools by 2021
192,000,000 80,000,000 80,000,000 32,000,000
C2.3.2.6: Availability of transport facilities improved by June 2021
220,000,000 220,000,000
Sub-total 10,017,000,000 2,146,900,000 1,953,500,000 1,930,000,000 1,931,800,000 1,946,800,000
Total Objective C2.3
24,922,000,000 6,736,900,000 5,318,500,000 5,680,000,000 3,897,800,000 3,180,800,000
C2.4: Students pass rate in Form II, IV and VI increased from
C2.4.3: Improve curriculum delivery
C2.4.3.1:Business and ICT subjects introduced in 20 schools by 2021
5,000,000 1,000,000
1,000,000 1,000,000 1,000,000 1,000,000
C2.4.3.2: 1,044 teachers trained through professional development
100,000,000 20,000,000 20,000,000 20,000,000 20,000,000 20,000,000
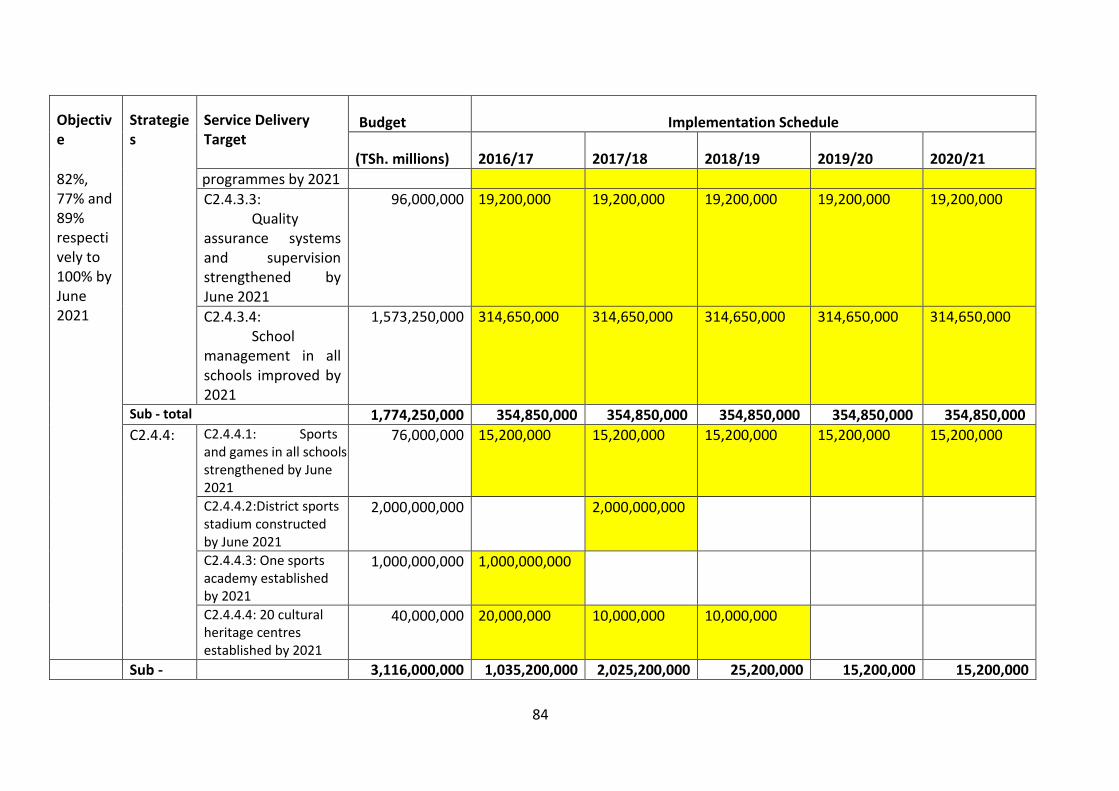
84
Objective
Strategies
Service Delivery Target
Budget Implementation Schedule
(TSh. millions) 2016/17 2017/18 2018/19 2019/20 2020/21
82%, 77% and 89% respectively to 100% by June 2021
programmes by 2021
C2.4.3.3: Quality assurance systems and supervision strengthened by June 2021
96,000,000 19,200,000 19,200,000 19,200,000 19,200,000 19,200,000
C2.4.3.4: School management in all schools improved by 2021
1,573,250,000 314,650,000 314,650,000 314,650,000 314,650,000 314,650,000
Sub - total 1,774,250,000 354,850,000 354,850,000 354,850,000 354,850,000 354,850,000
C2.4.4: Promote sports, games and culture C2.4.4.1: Sports and games in all schools strengthened by June 2021
76,000,000 15,200,000 15,200,000 15,200,000 15,200,000 15,200,000
C2.4.4.2:District sports stadium constructed by June 2021
2,000,000,000 2,000,000,000
C2.4.4.3: One sports academy established by 2021
1,000,000,000 1,000,000,000
C2.4.4.4: 20 cultural heritage centres established by 2021
40,000,000 20,000,000 10,000,000 10,000,000
Sub - 3,116,000,000 1,035,200,000 2,025,200,000 25,200,000 15,200,000 15,200,000
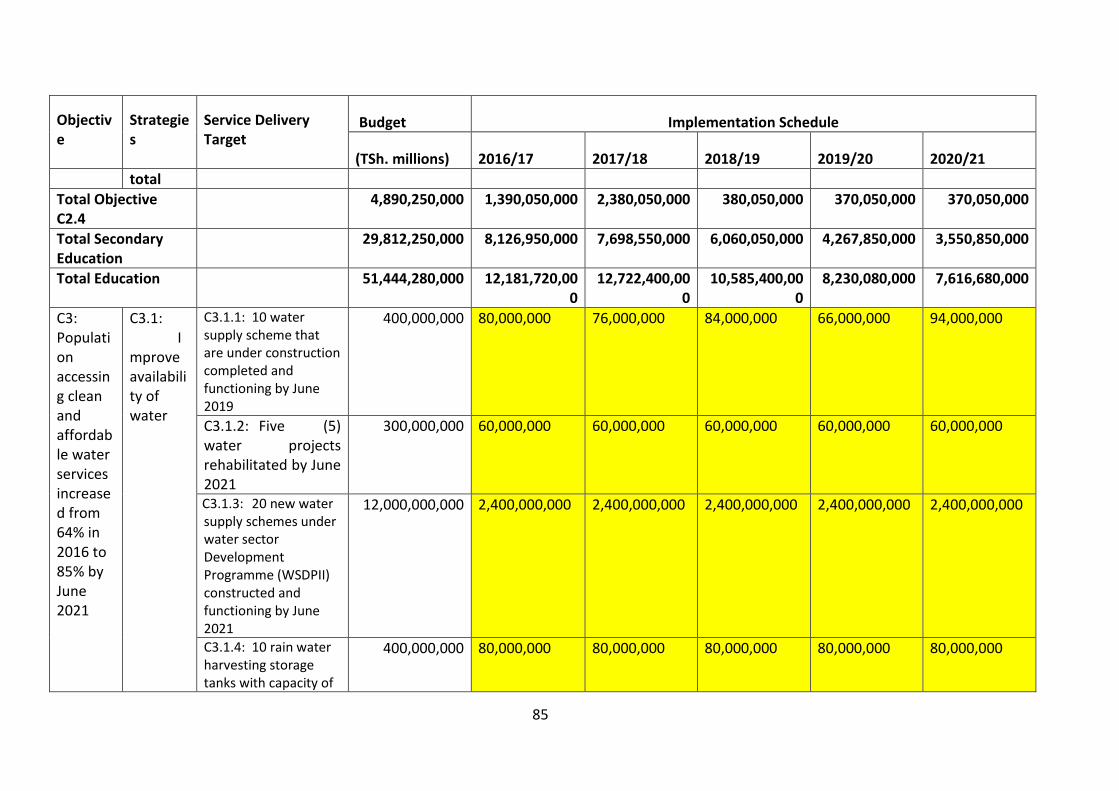
85
Objective
Strategies
Service Delivery Target
Budget Implementation Schedule
(TSh. millions) 2016/17 2017/18 2018/19 2019/20 2020/21
total
Total Objective C2.4
4,890,250,000 1,390,050,000 2,380,050,000 380,050,000 370,050,000 370,050,000
Total Secondary Education
29,812,250,000 8,126,950,000 7,698,550,000 6,060,050,000 4,267,850,000 3,550,850,000
Total Education 51,444,280,000 12,181,720,000
12,722,400,000
10,585,400,000
8,230,080,000 7,616,680,000
C3: Population accessing clean and affordable water services increased from 64% in 2016 to 85% by June 2021
C3.1: Improve availability of water
C3.1.1: 10 water supply scheme that are under construction completed and functioning by June 2019
400,000,000 80,000,000 76,000,000 84,000,000 66,000,000 94,000,000
C3.1.2: Five (5) water projects rehabilitated by June 2021
300,000,000 60,000,000 60,000,000 60,000,000 60,000,000 60,000,000
C3.1.3: 20 new water supply schemes under water sector Development Programme (WSDPII) constructed and functioning by June 2021
12,000,000,000 2,400,000,000 2,400,000,000 2,400,000,000 2,400,000,000 2,400,000,000
C3.1.4: 10 rain water harvesting storage tanks with capacity of
400,000,000 80,000,000 80,000,000 80,000,000 80,000,000 80,000,000
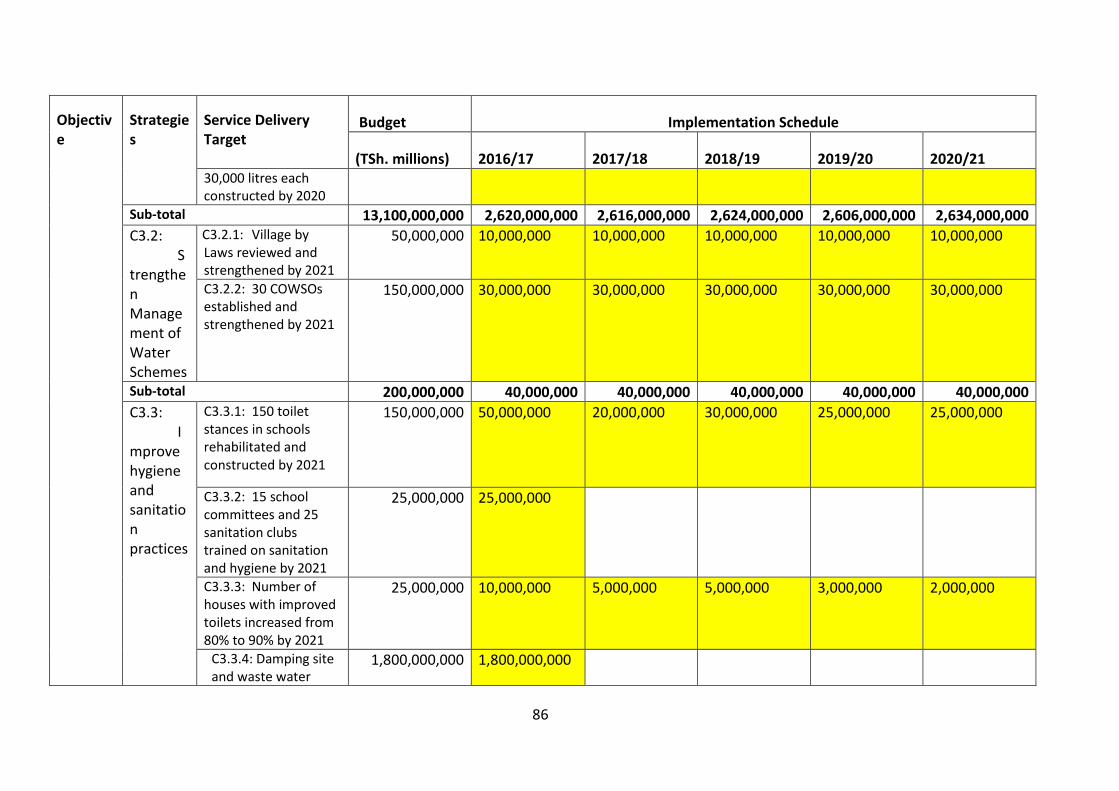
86
Objective
Strategies
Service Delivery Target
Budget Implementation Schedule
(TSh. millions) 2016/17 2017/18 2018/19 2019/20 2020/21 30,000 litres each constructed by 2020
Sub-total 13,100,000,000 2,620,000,000 2,616,000,000 2,624,000,000 2,606,000,000 2,634,000,000
C3.2: Strengthen Management of Water Schemes
C3.2.1: Village by Laws reviewed and strengthened by 2021
50,000,000 10,000,000 10,000,000 10,000,000 10,000,000 10,000,000
C3.2.2: 30 COWSOs established and strengthened by 2021
150,000,000 30,000,000 30,000,000 30,000,000 30,000,000 30,000,000
Sub-total 200,000,000 40,000,000 40,000,000 40,000,000 40,000,000 40,000,000
C3.3: Improve hygiene and sanitation practices
C3.3.1: 150 toilet stances in schools rehabilitated and constructed by 2021
150,000,000 50,000,000 20,000,000 30,000,000 25,000,000 25,000,000
C3.3.2: 15 school committees and 25 sanitation clubs trained on sanitation and hygiene by 2021
25,000,000 25,000,000
C3.3.3: Number of houses with improved toilets increased from 80% to 90% by 2021
25,000,000 10,000,000 5,000,000 5,000,000 3,000,000 2,000,000
C3.3.4: Damping site and waste water
1,800,000,000 1,800,000,000
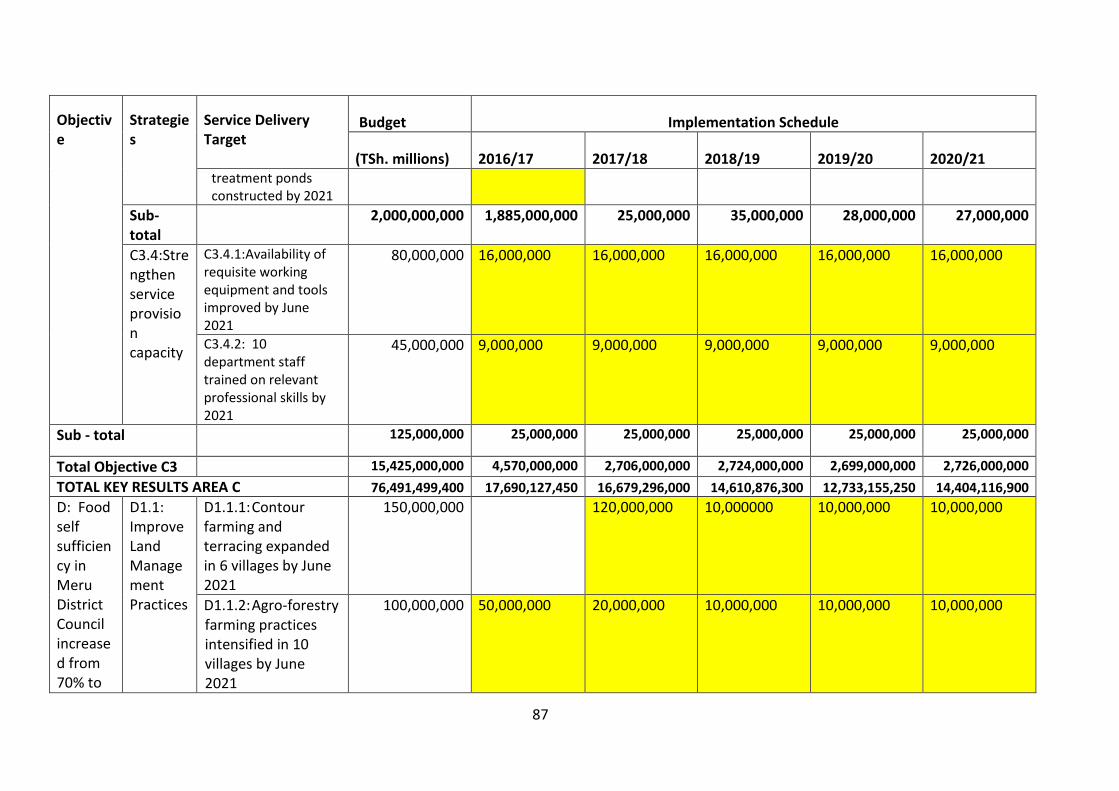
87
Objective
Strategies
Service Delivery Target
Budget Implementation Schedule
(TSh. millions) 2016/17 2017/18 2018/19 2019/20 2020/21 treatment ponds constructed by 2021
Sub-total
2,000,000,000 1,885,000,000 25,000,000 35,000,000 28,000,000 27,000,000
C3.4:Strengthen service provision capacity
C3.4.1:Availability of requisite working equipment and tools improved by June 2021
80,000,000 16,000,000 16,000,000 16,000,000 16,000,000 16,000,000
C3.4.2: 10 department staff trained on relevant professional skills by 2021
45,000,000 9,000,000 9,000,000 9,000,000 9,000,000 9,000,000
Sub - total 125,000,000 25,000,000 25,000,000 25,000,000 25,000,000 25,000,000
Total Objective C3 15,425,000,000 4,570,000,000 2,706,000,000 2,724,000,000 2,699,000,000 2,726,000,000
TOTAL KEY RESULTS AREA C 76,491,499,400 17,690,127,450 16,679,296,000 14,610,876,300 12,733,155,250 14,404,116,900
D: Food self sufficiency in Meru District Council increased from 70% to
D1.1: Improve Land Management Practices
D1.1.1: Contour farming and terracing expanded in 6 villages by June 2021
150,000,000 120,000,000 10,000000 10,000,000 10,000,000
D1.1.2: Agro-forestry farming practices intensified in 10 villages by June 2021
100,000,000 50,000,000 20,000,000 10,000,000 10,000,000 10,000,000
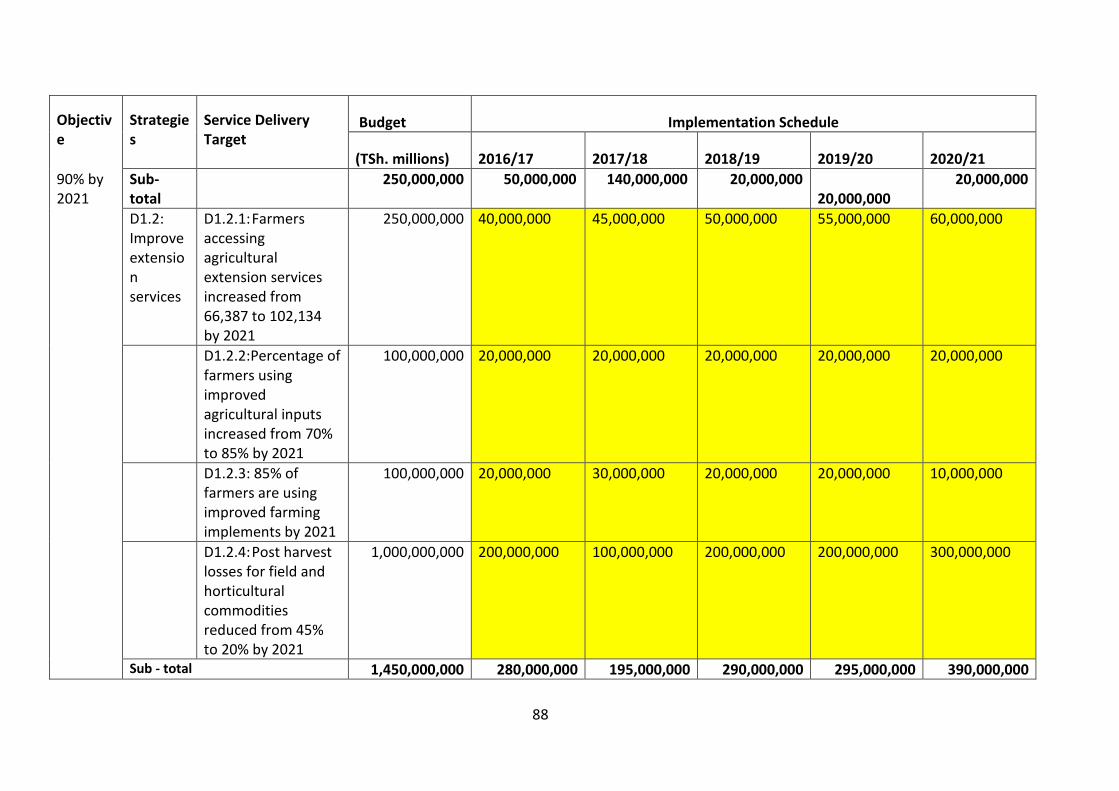
88
Objective
Strategies
Service Delivery Target
Budget Implementation Schedule
(TSh. millions) 2016/17 2017/18 2018/19 2019/20 2020/21
90% by 2021
Sub-total
250,000,000 50,000,000 140,000,000 20,000,000 20,000,000
20,000,000
D1.2: Improve extension services
D1.2.1: Farmers accessing agricultural extension services increased from 66,387 to 102,134 by 2021
250,000,000 40,000,000 45,000,000 50,000,000 55,000,000 60,000,000
D1.2.2:Percentage of farmers using improved agricultural inputs increased from 70% to 85% by 2021
100,000,000 20,000,000 20,000,000 20,000,000 20,000,000 20,000,000
D1.2.3: 85% of farmers are using improved farming implements by 2021
100,000,000 20,000,000 30,000,000 20,000,000 20,000,000 10,000,000
D1.2.4: Post harvest losses for field and horticultural commodities reduced from 45% to 20% by 2021
1,000,000,000 200,000,000 100,000,000 200,000,000 200,000,000 300,000,000
Sub - total 1,450,000,000 280,000,000 195,000,000 290,000,000 295,000,000 390,000,000
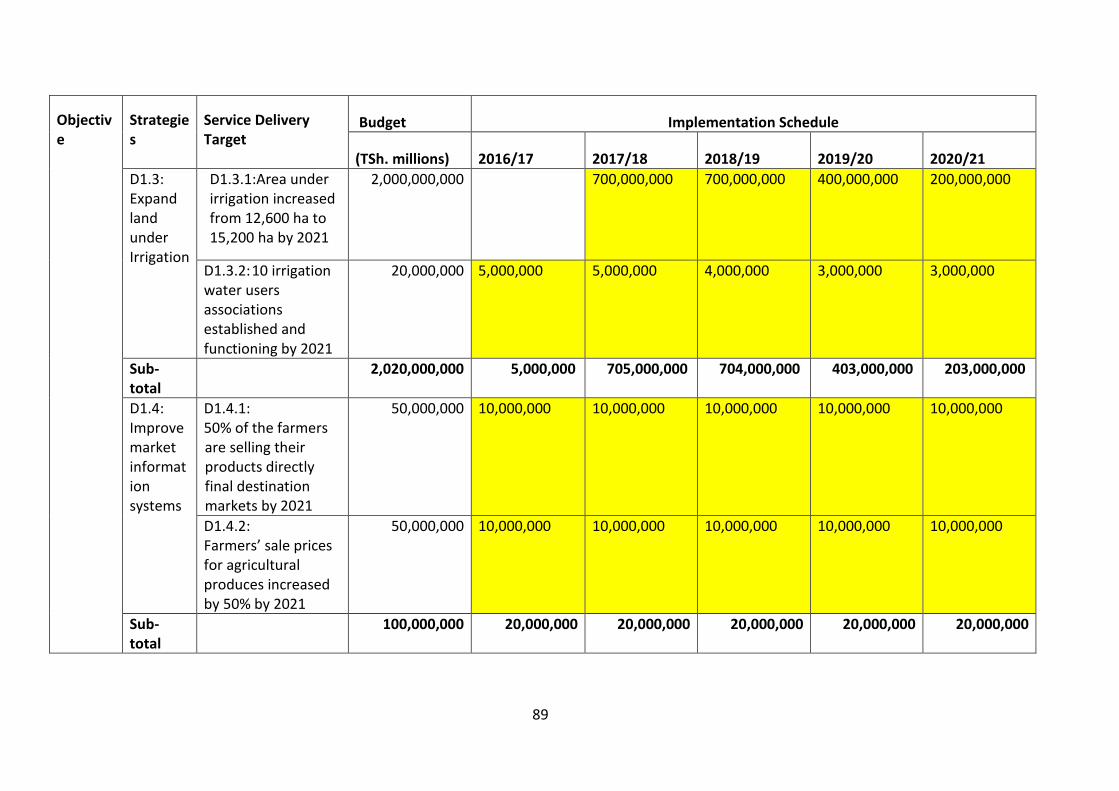
89
Objective
Strategies
Service Delivery Target
Budget Implementation Schedule
(TSh. millions) 2016/17 2017/18 2018/19 2019/20 2020/21
D1.3: Expand land under Irrigation
D1.3.1:Area under irrigation increased from 12,600 ha to 15,200 ha by 2021
2,000,000,000 700,000,000 700,000,000 400,000,000 200,000,000
D1.3.2: 10 irrigation water users associations established and functioning by 2021
20,000,000 5,000,000 5,000,000 4,000,000 3,000,000 3,000,000
Sub-total
2,020,000,000 5,000,000 705,000,000 704,000,000 403,000,000 203,000,000
D1.4: Improve market information systems
D1.4.1: 50% of the farmers are selling their products directly final destination markets by 2021
50,000,000 10,000,000 10,000,000 10,000,000 10,000,000 10,000,000
D1.4.2: Farmers’ sale prices for agricultural produces increased by 50% by 2021
50,000,000 10,000,000 10,000,000 10,000,000 10,000,000 10,000,000
Sub-total
100,000,000 20,000,000 20,000,000 20,000,000 20,000,000 20,000,000
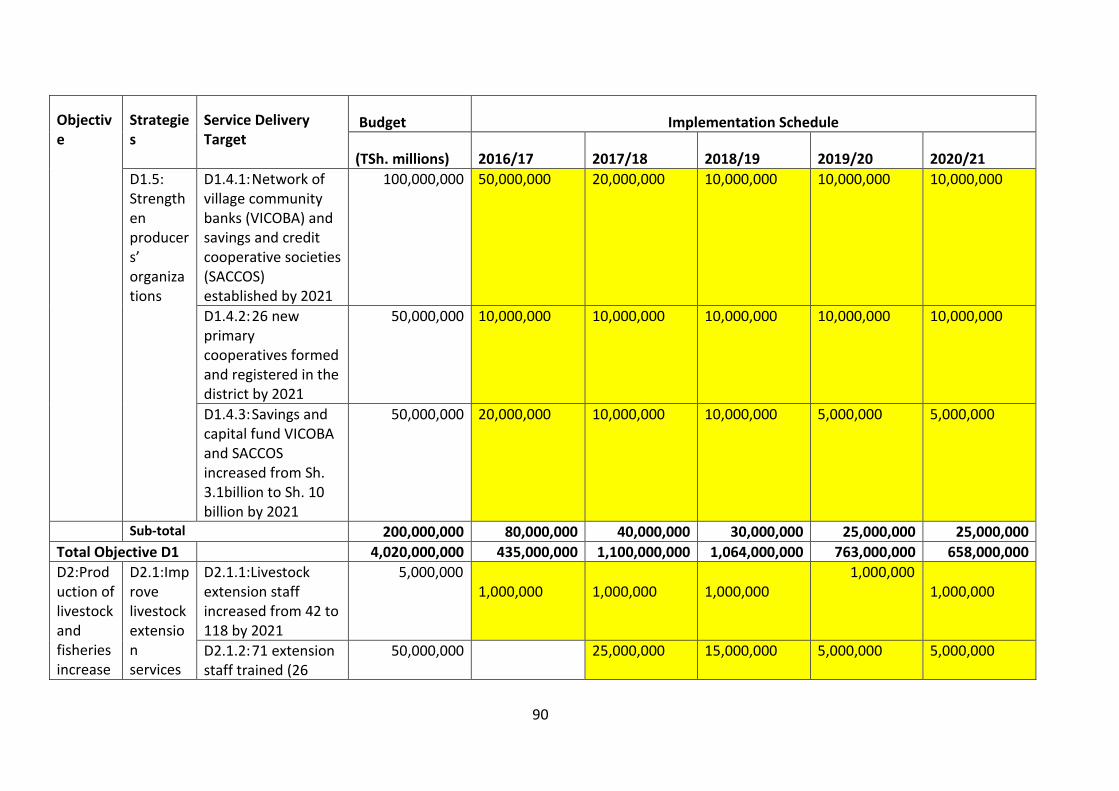
90
Objective
Strategies
Service Delivery Target
Budget Implementation Schedule
(TSh. millions) 2016/17 2017/18 2018/19 2019/20 2020/21
D1.5: Strengthen producers’ organizations
D1.4.1: Network of village community banks (VICOBA) and savings and credit cooperative societies (SACCOS) established by 2021
100,000,000 50,000,000 20,000,000 10,000,000 10,000,000 10,000,000
D1.4.2: 26 new primary cooperatives formed and registered in the district by 2021
50,000,000 10,000,000 10,000,000 10,000,000 10,000,000 10,000,000
D1.4.3: Savings and capital fund VICOBA and SACCOS increased from Sh. 3.1billion to Sh. 10 billion by 2021
50,000,000 20,000,000 10,000,000 10,000,000 5,000,000 5,000,000
Sub-total 200,000,000 80,000,000 40,000,000 30,000,000 25,000,000 25,000,000
Total Objective D1 4,020,000,000 435,000,000 1,100,000,000 1,064,000,000 763,000,000 658,000,000
D2:Production of livestock and fisheries increase
D2.1:Improve livestock extension services
D2.1.1:Livestock extension staff increased from 42 to 118 by 2021
5,000,000 1,000,000
1,000,000
1,000,000
1,000,000 1,000,000
D2.1.2: 71 extension staff trained (26
50,000,000 25,000,000 15,000,000 5,000,000 5,000,000
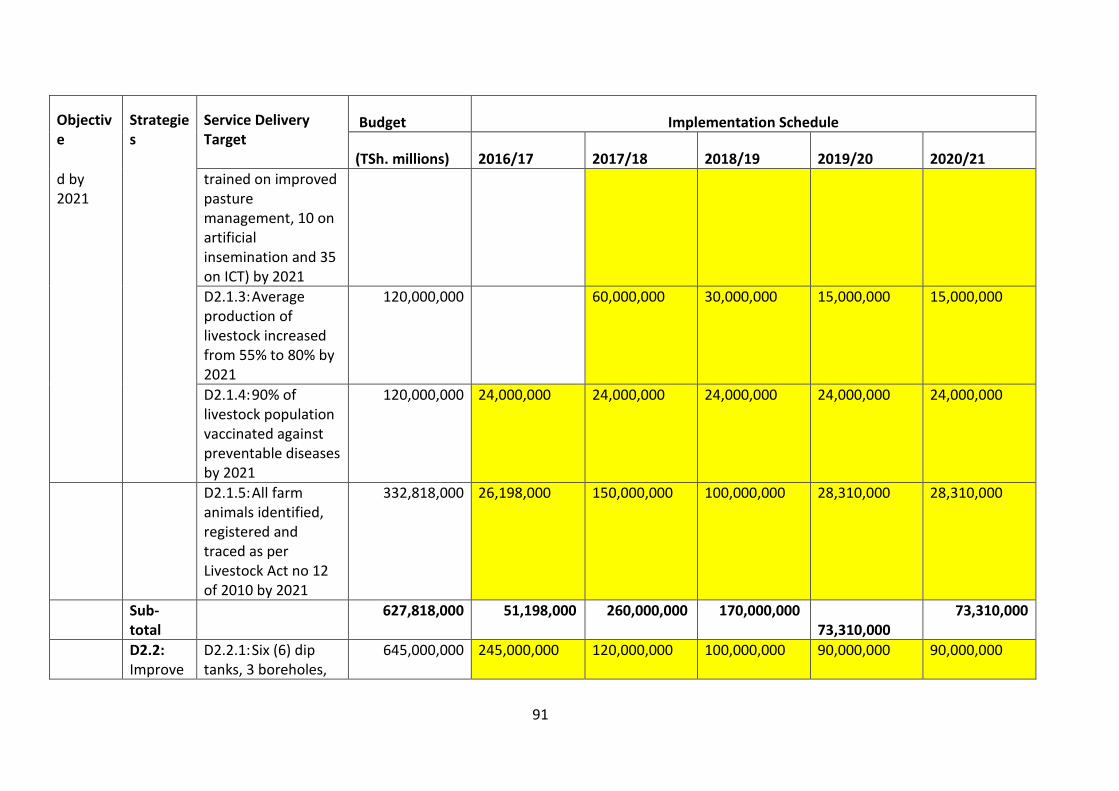
91
Objective
Strategies
Service Delivery Target
Budget Implementation Schedule
(TSh. millions) 2016/17 2017/18 2018/19 2019/20 2020/21
d by 2021
trained on improved pasture management, 10 on artificial insemination and 35 on ICT) by 2021
D2.1.3: Average production of livestock increased from 55% to 80% by 2021
120,000,000 60,000,000 30,000,000 15,000,000 15,000,000
D2.1.4: 90% of livestock population vaccinated against preventable diseases by 2021
120,000,000 24,000,000 24,000,000 24,000,000 24,000,000 24,000,000
D2.1.5: All farm animals identified, registered and traced as per Livestock Act no 12 of 2010 by 2021
332,818,000 26,198,000 150,000,000 100,000,000 28,310,000 28,310,000
Sub-total
627,818,000 51,198,000 260,000,000 170,000,000 73,310,000
73,310,000
D2.2: Improve
D2.2.1: Six (6) dip tanks, 3 boreholes,
645,000,000 245,000,000 120,000,000 100,000,000 90,000,000 90,000,000
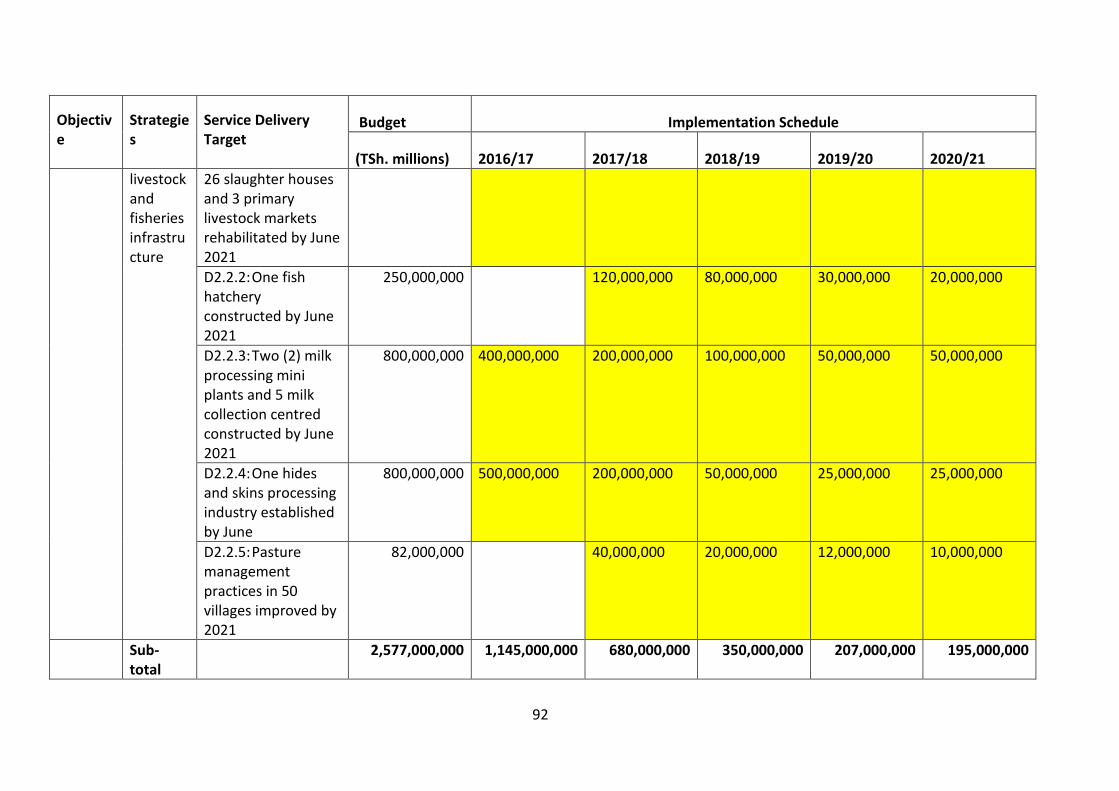
92
Objective
Strategies
Service Delivery Target
Budget Implementation Schedule
(TSh. millions) 2016/17 2017/18 2018/19 2019/20 2020/21
livestock and fisheries infrastructure
26 slaughter houses and 3 primary livestock markets rehabilitated by June 2021
D2.2.2: One fish hatchery constructed by June 2021
250,000,000 120,000,000 80,000,000 30,000,000 20,000,000
D2.2.3: Two (2) milk processing mini plants and 5 milk collection centred constructed by June 2021
800,000,000 400,000,000 200,000,000 100,000,000 50,000,000 50,000,000
D2.2.4: One hides and skins processing industry established by June
800,000,000 500,000,000 200,000,000 50,000,000 25,000,000 25,000,000
D2.2.5: Pasture management practices in 50 villages improved by 2021
82,000,000 40,000,000 20,000,000 12,000,000 10,000,000
Sub-total
2,577,000,000 1,145,000,000 680,000,000 350,000,000 207,000,000 195,000,000
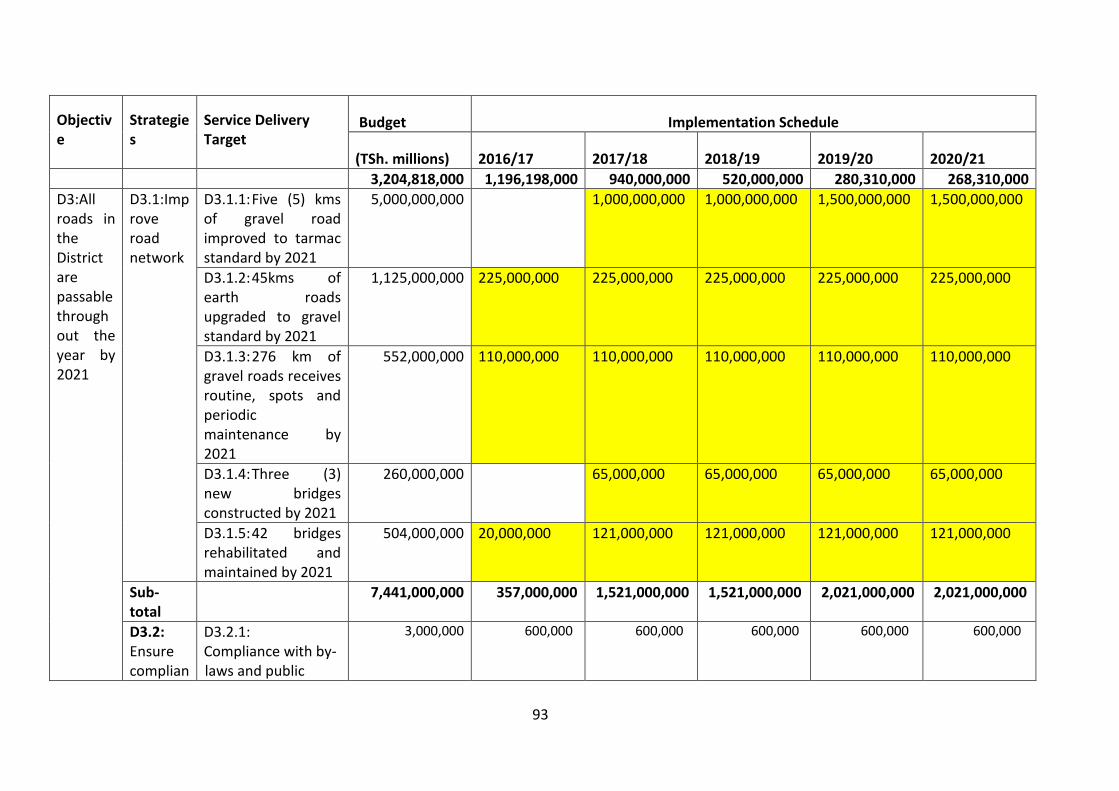
93
Objective
Strategies
Service Delivery Target
Budget Implementation Schedule
(TSh. millions) 2016/17 2017/18 2018/19 2019/20 2020/21
3,204,818,000 1,196,198,000 940,000,000 520,000,000 280,310,000 268,310,000
D3:All roads in the District are passable throughout the year by 2021
D3.1:Improve road network
D3.1.1: Five (5) kms of gravel road improved to tarmac standard by 2021
5,000,000,000 1,000,000,000 1,000,000,000 1,500,000,000 1,500,000,000
D3.1.2: 45kms of earth roads upgraded to gravel standard by 2021
1,125,000,000 225,000,000 225,000,000 225,000,000 225,000,000 225,000,000
D3.1.3: 276 km of gravel roads receives routine, spots and periodic maintenance by 2021
552,000,000 110,000,000 110,000,000 110,000,000 110,000,000 110,000,000
D3.1.4: Three (3) new bridges constructed by 2021
260,000,000 65,000,000 65,000,000 65,000,000 65,000,000
D3.1.5: 42 bridges rehabilitated and maintained by 2021
504,000,000 20,000,000 121,000,000 121,000,000 121,000,000 121,000,000
Sub-total
7,441,000,000 357,000,000 1,521,000,000 1,521,000,000 2,021,000,000 2,021,000,000
D3.2: Ensure complian
D3.2.1: Compliance with by-laws and public
3,000,000 600,000 600,000 600,000 600,000 600,000
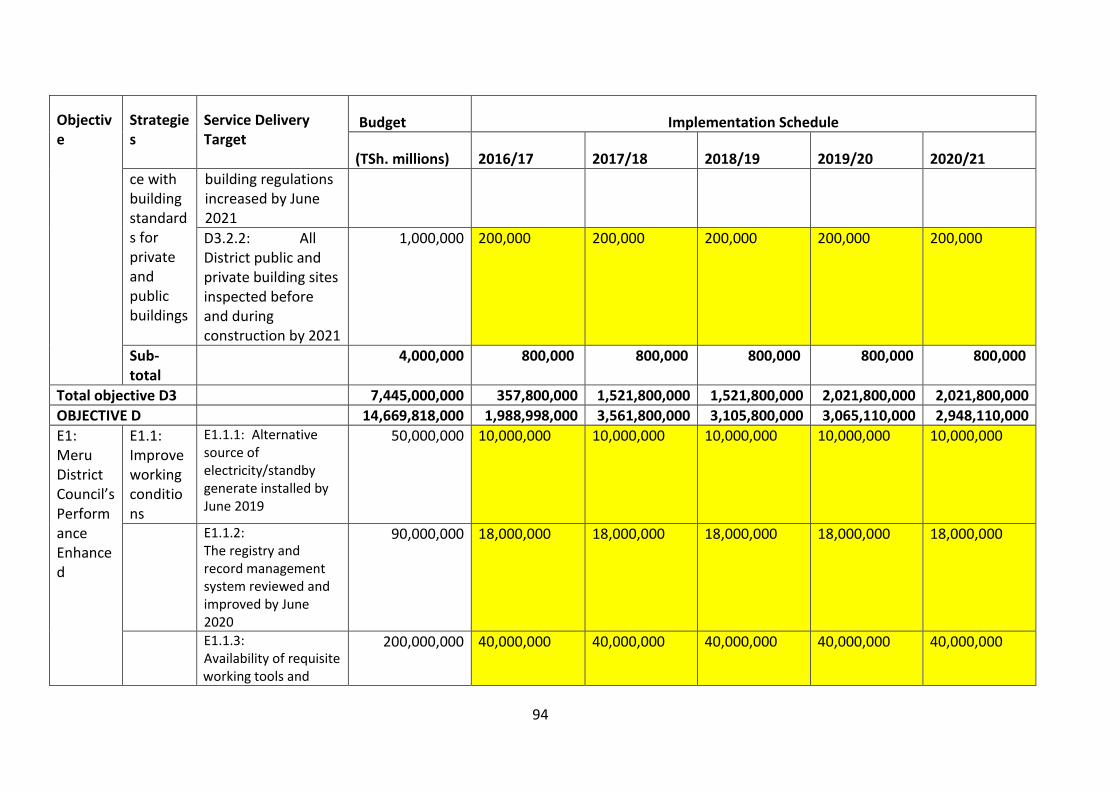
94
Objective
Strategies
Service Delivery Target
Budget Implementation Schedule
(TSh. millions) 2016/17 2017/18 2018/19 2019/20 2020/21
ce with building standards for private and public buildings
building regulations increased by June 2021
D3.2.2: All District public and private building sites inspected before and during construction by 2021
1,000,000 200,000 200,000 200,000 200,000 200,000
Sub-total
4,000,000 800,000 800,000 800,000 800,000 800,000
Total objective D3 7,445,000,000 357,800,000 1,521,800,000 1,521,800,000 2,021,800,000 2,021,800,000
OBJECTIVE D 14,669,818,000 1,988,998,000 3,561,800,000 3,105,800,000 3,065,110,000 2,948,110,000
E1: Meru District Council’s Performance Enhanced
E1.1: Improve working conditions
E1.1.1: Alternative source of electricity/standby generate installed by June 2019
50,000,000 10,000,000 10,000,000 10,000,000 10,000,000 10,000,000
E1.1.2: The registry and record management system reviewed and improved by June 2020
90,000,000 18,000,000 18,000,000 18,000,000 18,000,000 18,000,000
E1.1.3: Availability of requisite working tools and
200,000,000 40,000,000 40,000,000 40,000,000 40,000,000 40,000,000
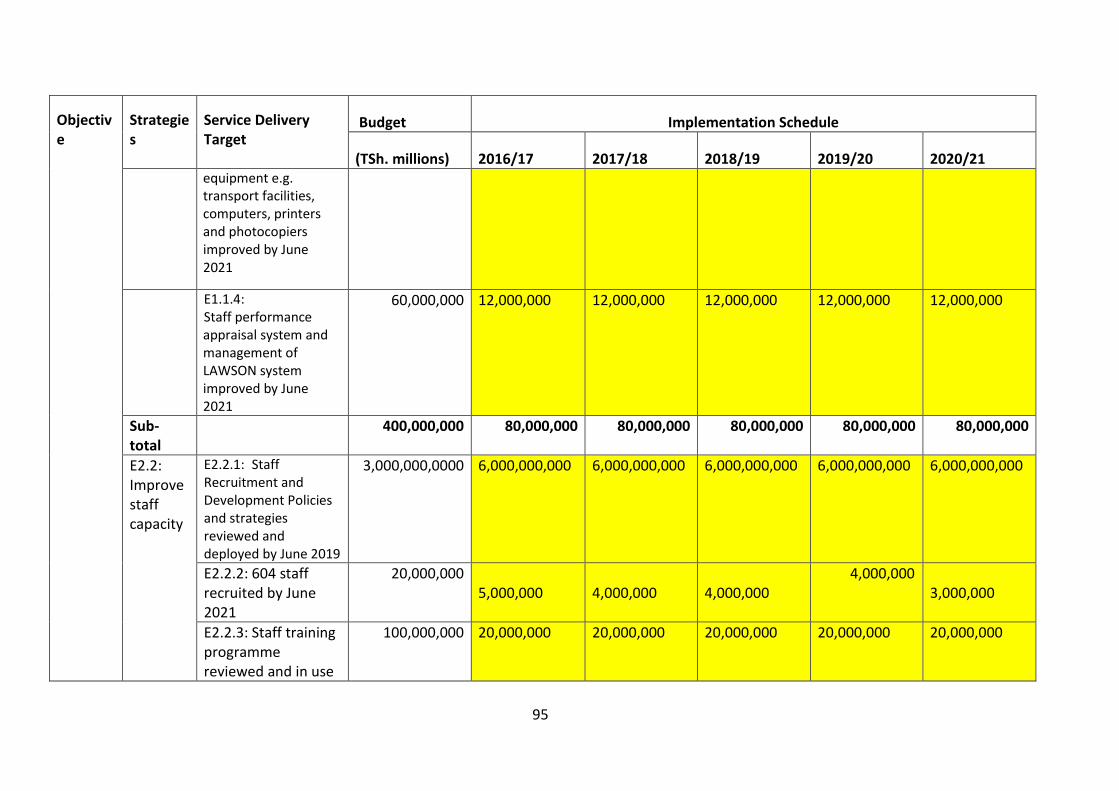
95
Objective
Strategies
Service Delivery Target
Budget Implementation Schedule
(TSh. millions) 2016/17 2017/18 2018/19 2019/20 2020/21 equipment e.g. transport facilities, computers, printers and photocopiers improved by June 2021
E1.1.4: Staff performance appraisal system and management of LAWSON system improved by June 2021
60,000,000 12,000,000 12,000,000 12,000,000 12,000,000 12,000,000
Sub-total
400,000,000 80,000,000 80,000,000 80,000,000 80,000,000 80,000,000
E2.2: Improve staff capacity
E2.2.1: Staff Recruitment and Development Policies and strategies reviewed and deployed by June 2019
3,000,000,0000 6,000,000,000 6,000,000,000 6,000,000,000 6,000,000,000 6,000,000,000
E2.2.2: 604 staff recruited by June 2021
20,000,000 5,000,000
4,000,000
4,000,000
4,000,000 3,000,000
E2.2.3: Staff training programme reviewed and in use
100,000,000 20,000,000 20,000,000 20,000,000 20,000,000 20,000,000
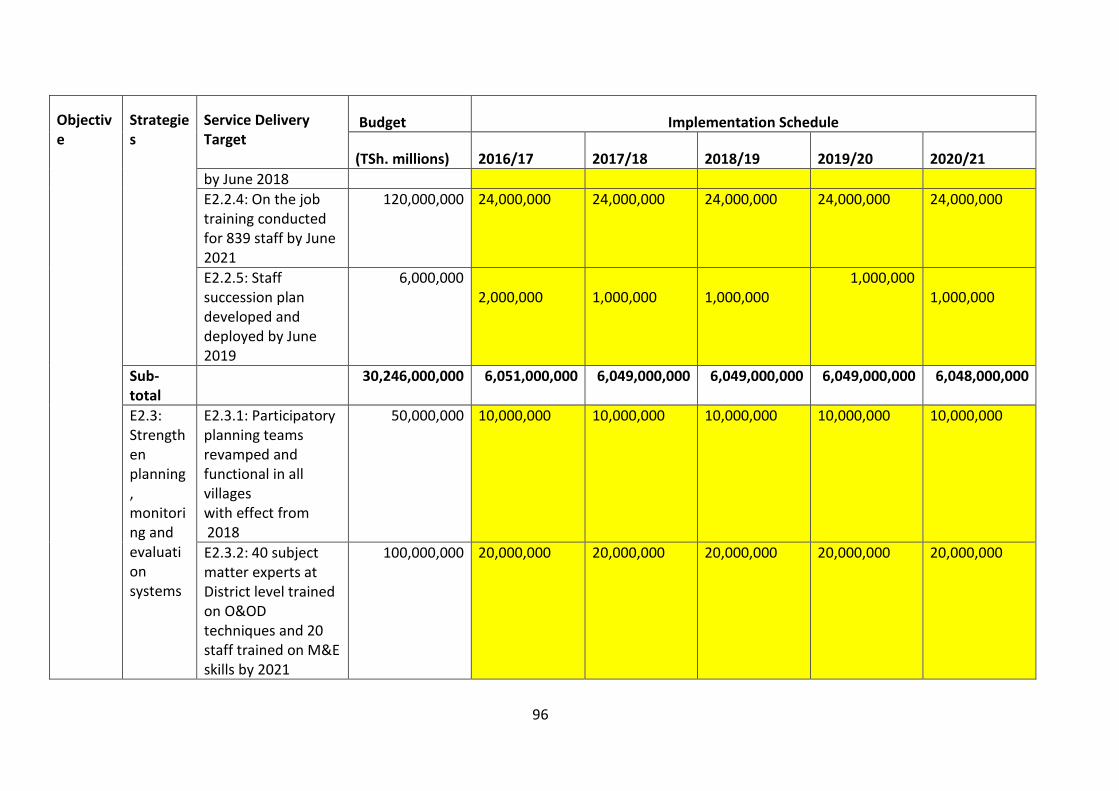
96
Objective
Strategies
Service Delivery Target
Budget Implementation Schedule
(TSh. millions) 2016/17 2017/18 2018/19 2019/20 2020/21
by June 2018
E2.2.4: On the job training conducted for 839 staff by June 2021
120,000,000 24,000,000 24,000,000 24,000,000 24,000,000 24,000,000
E2.2.5: Staff succession plan developed and deployed by June 2019
6,000,000 2,000,000
1,000,000
1,000,000
1,000,000 1,000,000
Sub- total
30,246,000,000 6,051,000,000 6,049,000,000 6,049,000,000 6,049,000,000 6,048,000,000
E2.3: Strengthen planning, monitoring and evaluation systems
E2.3.1: Participatory planning teams revamped and functional in all villages with effect from 2018
50,000,000 10,000,000 10,000,000 10,000,000 10,000,000 10,000,000
E2.3.2: 40 subject matter experts at District level trained on O&OD techniques and 20 staff trained on M&E skills by 2021
100,000,000 20,000,000 20,000,000 20,000,000 20,000,000 20,000,000
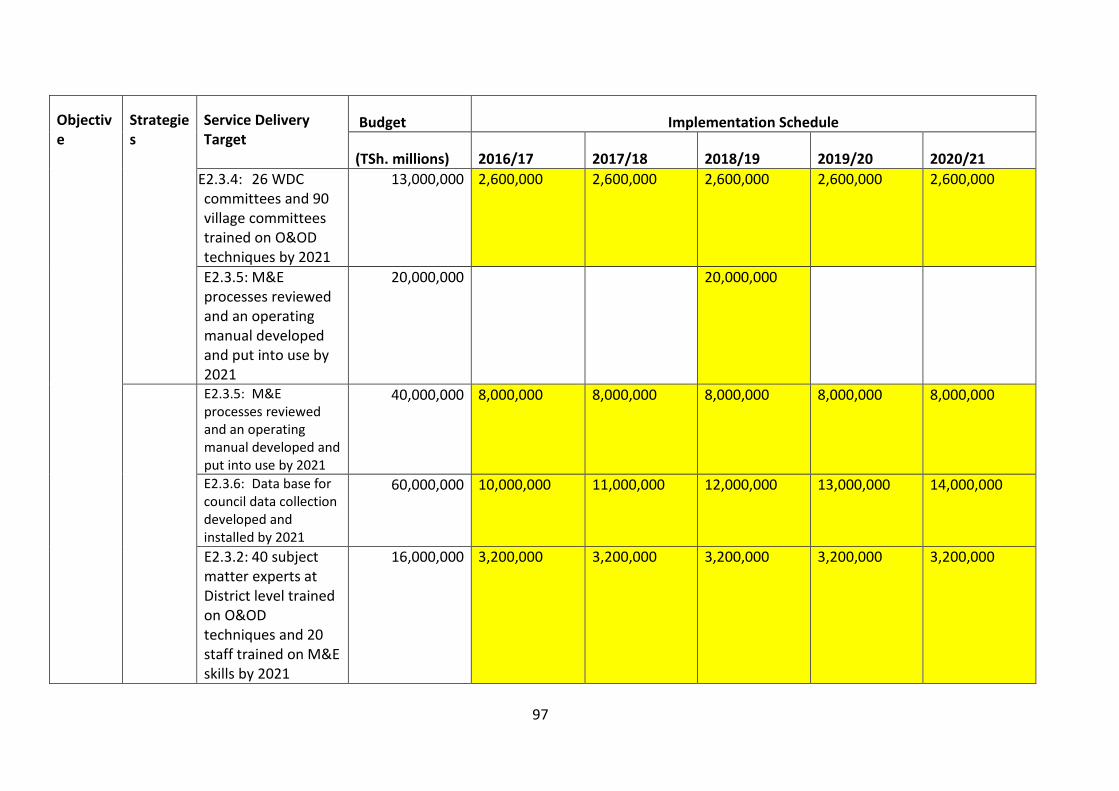
97
Objective
Strategies
Service Delivery Target
Budget Implementation Schedule
(TSh. millions) 2016/17 2017/18 2018/19 2019/20 2020/21
E2.3.4: 26 WDC committees and 90 village committees trained on O&OD techniques by 2021
13,000,000 2,600,000 2,600,000 2,600,000 2,600,000 2,600,000
E2.3.5: M&E processes reviewed and an operating manual developed and put into use by 2021
20,000,000 20,000,000
E2.3.5: M&E processes reviewed and an operating manual developed and put into use by 2021
40,000,000 8,000,000 8,000,000 8,000,000 8,000,000 8,000,000
E2.3.6: Data base for council data collection developed and installed by 2021
60,000,000 10,000,000 11,000,000 12,000,000 13,000,000 14,000,000
E2.3.2: 40 subject matter experts at District level trained on O&OD techniques and 20 staff trained on M&E skills by 2021
16,000,000 3,200,000 3,200,000 3,200,000 3,200,000 3,200,000
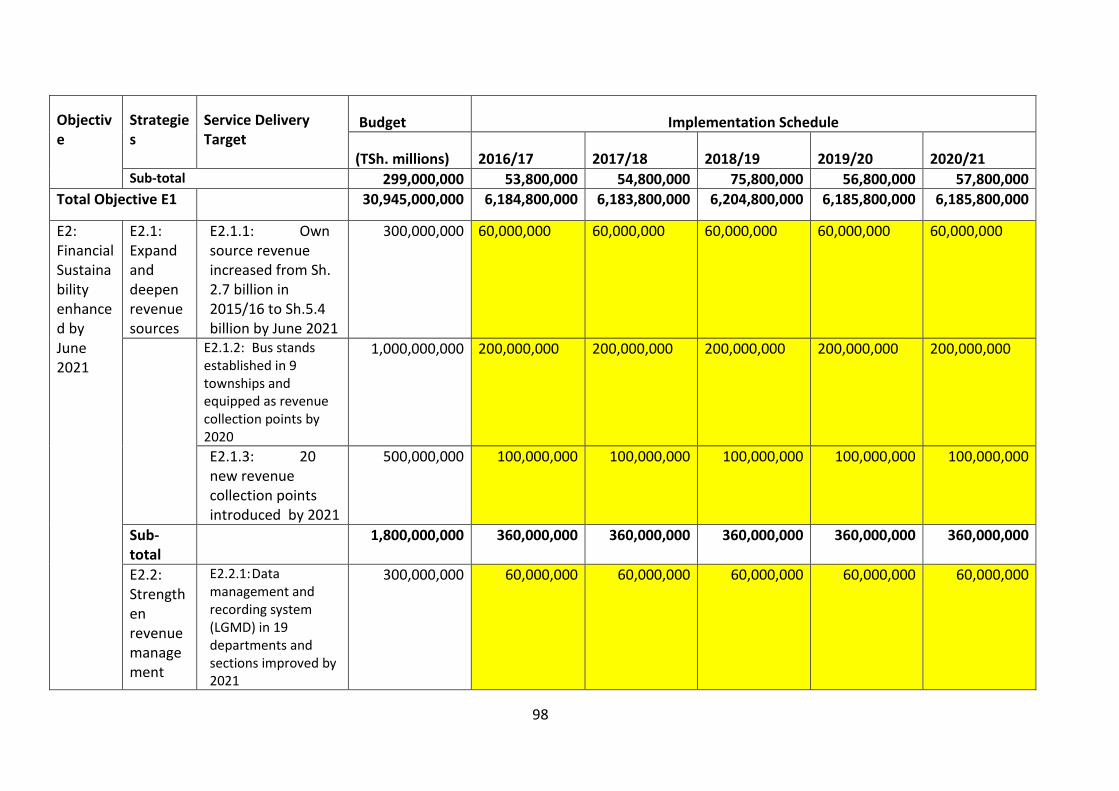
98
Objective
Strategies
Service Delivery Target
Budget Implementation Schedule
(TSh. millions) 2016/17 2017/18 2018/19 2019/20 2020/21 Sub-total 299,000,000 53,800,000 54,800,000 75,800,000 56,800,000 57,800,000
Total Objective E1 30,945,000,000 6,184,800,000 6,183,800,000 6,204,800,000 6,185,800,000 6,185,800,000
E2: Financial Sustainability enhanced by June 2021
E2.1: Expand and deepen revenue sources
E2.1.1: Own source revenue increased from Sh. 2.7 billion in 2015/16 to Sh.5.4 billion by June 2021
300,000,000 60,000,000 60,000,000 60,000,000 60,000,000 60,000,000
E2.1.2: Bus stands established in 9 townships and equipped as revenue collection points by 2020
1,000,000,000 200,000,000 200,000,000 200,000,000 200,000,000 200,000,000
E2.1.3: 20 new revenue collection points introduced by 2021
500,000,000 100,000,000 100,000,000 100,000,000 100,000,000 100,000,000
Sub-total
1,800,000,000 360,000,000 360,000,000 360,000,000 360,000,000 360,000,000
E2.2: Strengthen revenue management
E2.2.1: Data management and recording system (LGMD) in 19 departments and sections improved by 2021
300,000,000 60,000,000 60,000,000 60,000,000 60,000,000 60,000,000
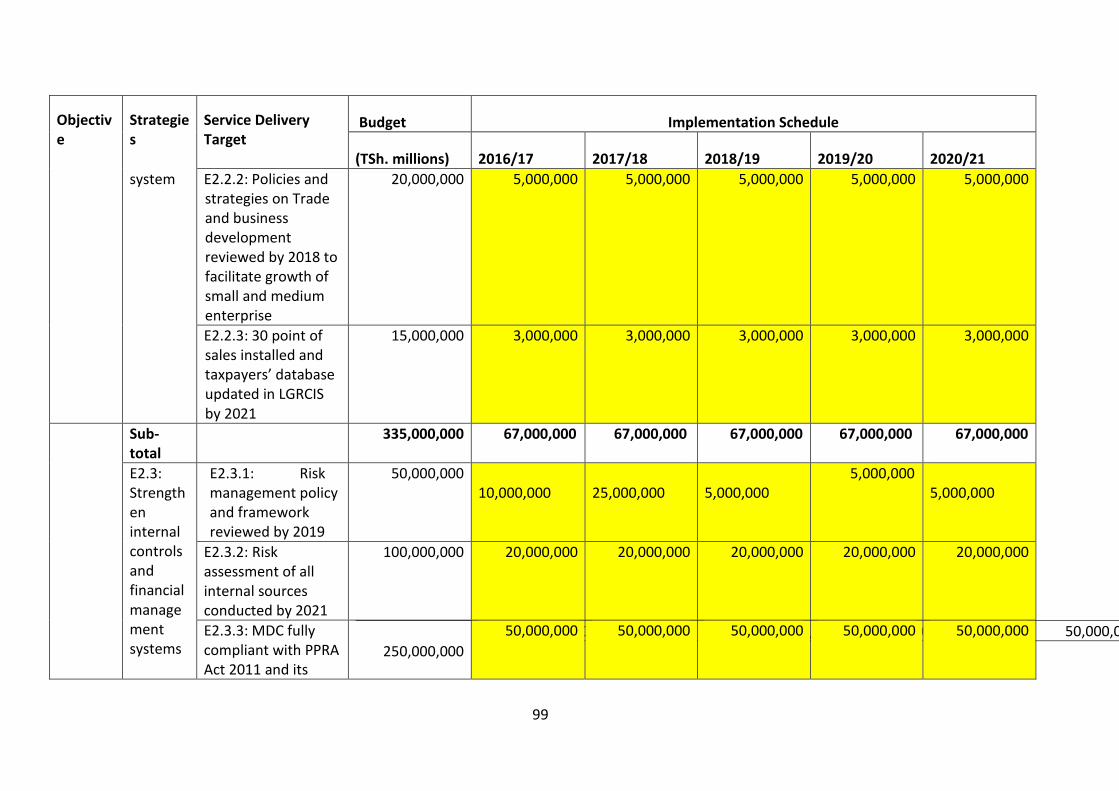
99
Objective
Strategies
Service Delivery Target
Budget Implementation Schedule
(TSh. millions) 2016/17 2017/18 2018/19 2019/20 2020/21
system E2.2.2: Policies and strategies on Trade and business development reviewed by 2018 to facilitate growth of small and medium enterprise
20,000,000 5,000,000 5,000,000 5,000,000 5,000,000 5,000,000
E2.2.3: 30 point of sales installed and taxpayers’ database updated in LGRCIS by 2021
15,000,000 3,000,000 3,000,000 3,000,000 3,000,000 3,000,000
Sub-total
335,000,000 67,000,000 67,000,000 67,000,000 67,000,000 67,000,000
E2.3: Strengthen internal controls and financial management systems
E2.3.1: Risk management policy and framework reviewed by 2019
50,000,000 10,000,000
25,000,000
5,000,000
5,000,000 5,000,000
E2.3.2: Risk assessment of all internal sources conducted by 2021
100,000,000 20,000,000 20,000,000 20,000,000 20,000,000 20,000,000
E2.3.3: MDC fully compliant with PPRA Act 2011 and its
50,000,000/= 50,000,000/= 50,000,000/= 50,000,000/= 50,000,000/=
250,000,000
50,000,000 50,000,000 50,000,000 50,000,000 50,000,000
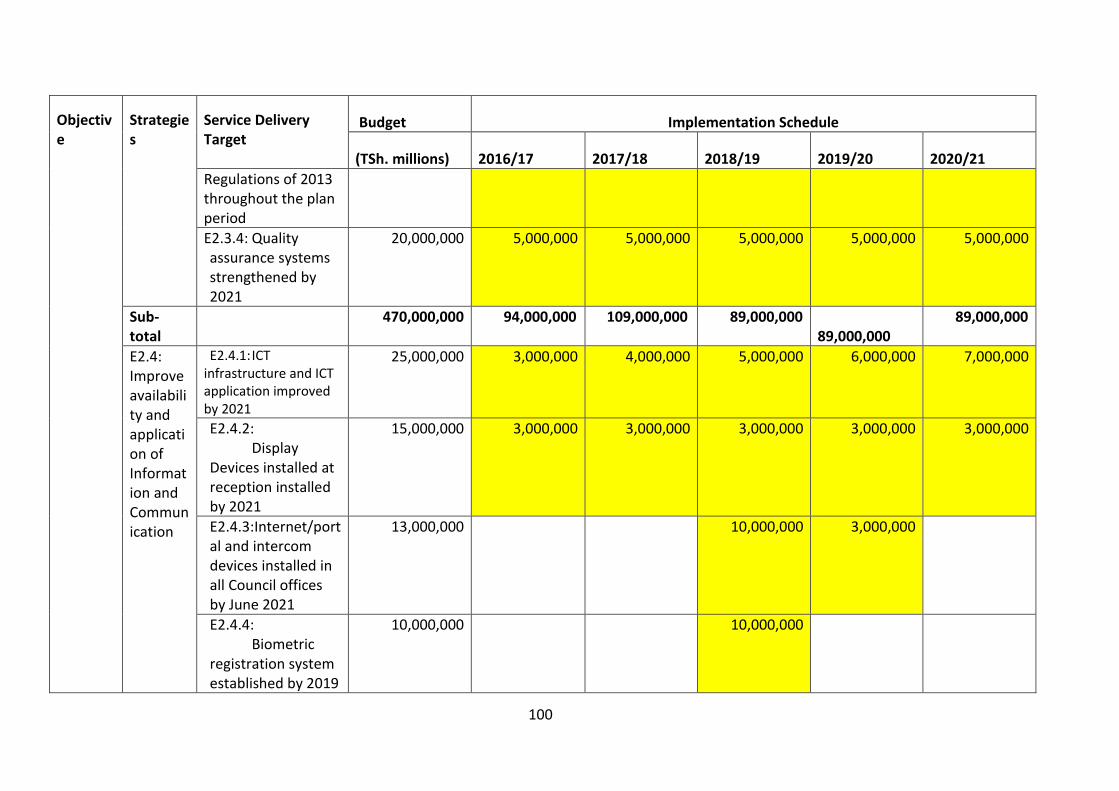
100
Objective
Strategies
Service Delivery Target
Budget Implementation Schedule
(TSh. millions) 2016/17 2017/18 2018/19 2019/20 2020/21
Regulations of 2013 throughout the plan period
E2.3.4: Quality assurance systems strengthened by 2021
20,000,000 5,000,000 5,000,000 5,000,000 5,000,000 5,000,000
Sub-total
470,000,000 94,000,000 109,000,000 89,000,000 89,000,000
89,000,000
E2.4: Improve availability and application of Information and Communication
E2.4.1: ICT infrastructure and ICT application improved by 2021
25,000,000 3,000,000 4,000,000 5,000,000 6,000,000 7,000,000
E2.4.2: Display Devices installed at reception installed by 2021
15,000,000 3,000,000 3,000,000 3,000,000 3,000,000 3,000,000
E2.4.3:Internet/portal and intercom devices installed in all Council offices by June 2021
13,000,000 10,000,000 3,000,000
E2.4.4: Biometric registration system established by 2019
10,000,000 10,000,000
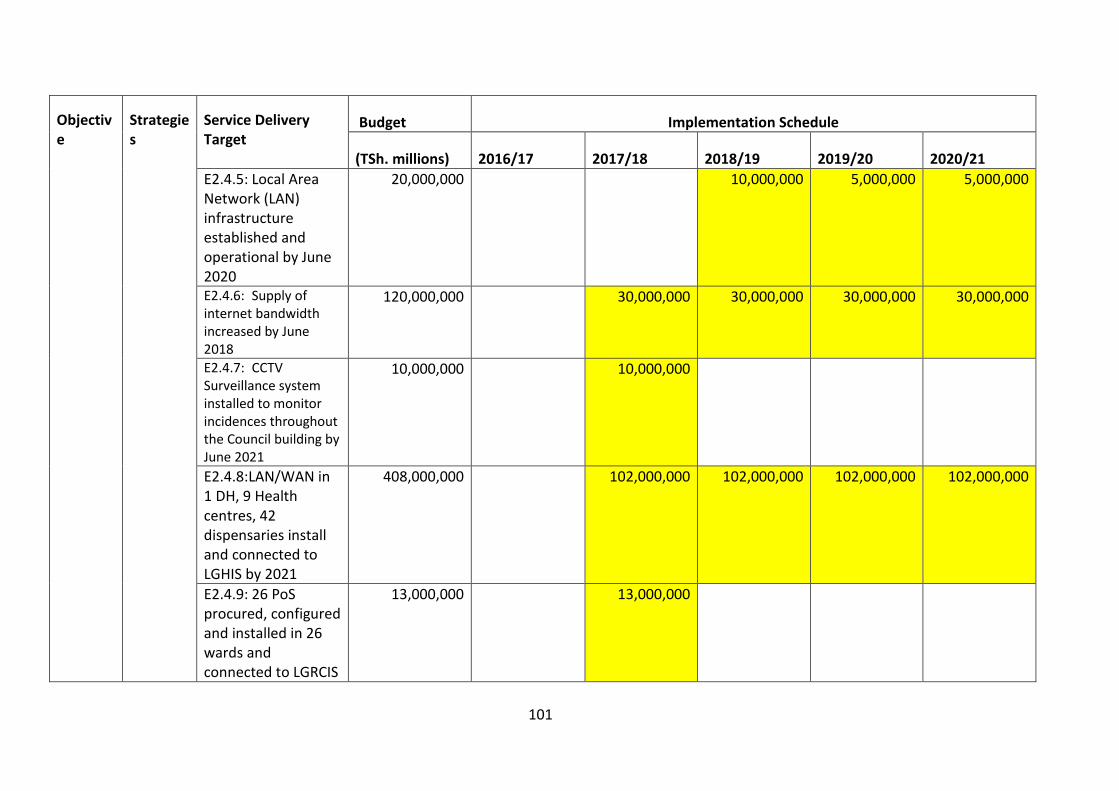
101
Objective
Strategies
Service Delivery Target
Budget Implementation Schedule
(TSh. millions) 2016/17 2017/18 2018/19 2019/20 2020/21
E2.4.5: Local Area Network (LAN) infrastructure established and operational by June 2020
20,000,000 10,000,000 5,000,000 5,000,000
E2.4.6: Supply of internet bandwidth increased by June 2018
120,000,000 30,000,000 30,000,000 30,000,000 30,000,000
E2.4.7: CCTV Surveillance system installed to monitor incidences throughout the Council building by June 2021
10,000,000 10,000,000
E2.4.8:LAN/WAN in 1 DH, 9 Health centres, 42 dispensaries install and connected to LGHIS by 2021
408,000,000 102,000,000 102,000,000 102,000,000 102,000,000
E2.4.9: 26 PoS procured, configured and installed in 26 wards and connected to LGRCIS
13,000,000 13,000,000
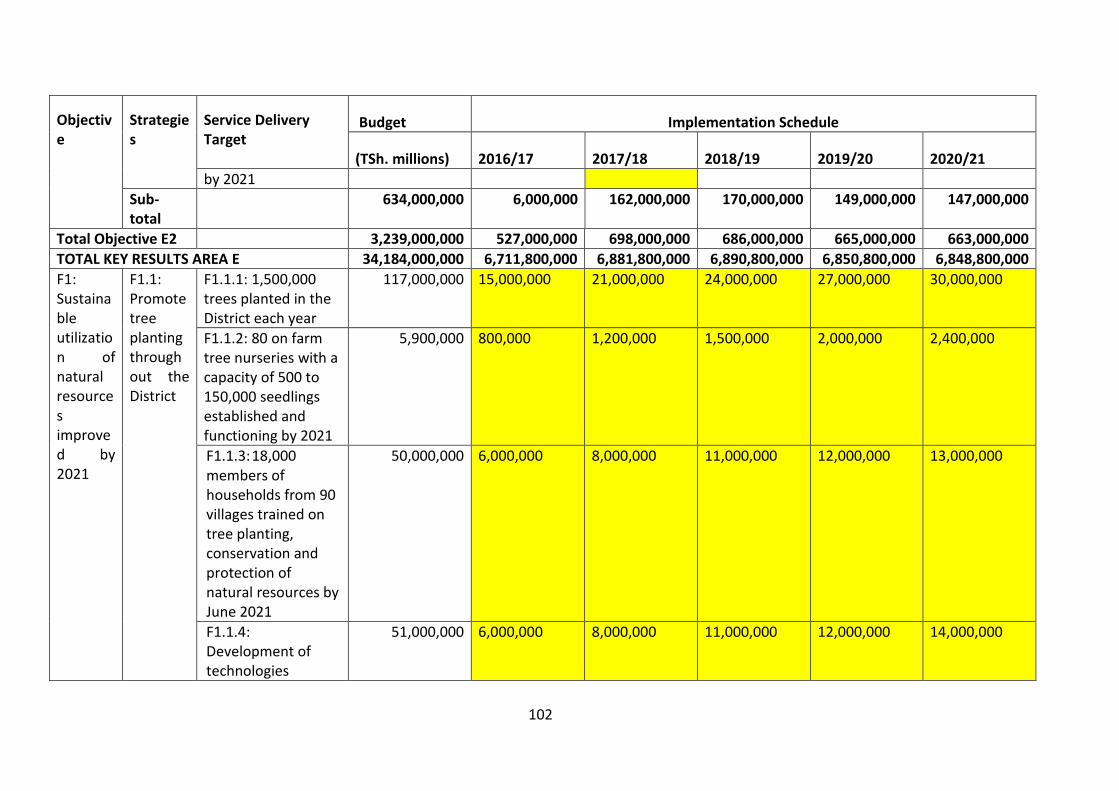
102
Objective
Strategies
Service Delivery Target
Budget Implementation Schedule
(TSh. millions) 2016/17 2017/18 2018/19 2019/20 2020/21
by 2021
Sub-total
634,000,000 6,000,000 162,000,000 170,000,000 149,000,000 147,000,000
Total Objective E2 3,239,000,000 527,000,000 698,000,000 686,000,000 665,000,000 663,000,000
TOTAL KEY RESULTS AREA E 34,184,000,000 6,711,800,000 6,881,800,000 6,890,800,000 6,850,800,000 6,848,800,000
F1: Sustainable utilization of natural resources improved by 2021
F1.1: Promote tree planting throughout the District
F1.1.1: 1,500,000 trees planted in the District each year
117,000,000 15,000,000 21,000,000 24,000,000 27,000,000 30,000,000
F1.1.2: 80 on farm tree nurseries with a capacity of 500 to 150,000 seedlings established and functioning by 2021
5,900,000 800,000 1,200,000 1,500,000 2,000,000 2,400,000
F1.1.3: 18,000 members of households from 90 villages trained on tree planting, conservation and protection of natural resources by June 2021
50,000,000 6,000,000 8,000,000 11,000,000 12,000,000 13,000,000
F1.1.4: Development of technologies
51,000,000 6,000,000 8,000,000 11,000,000 12,000,000 14,000,000
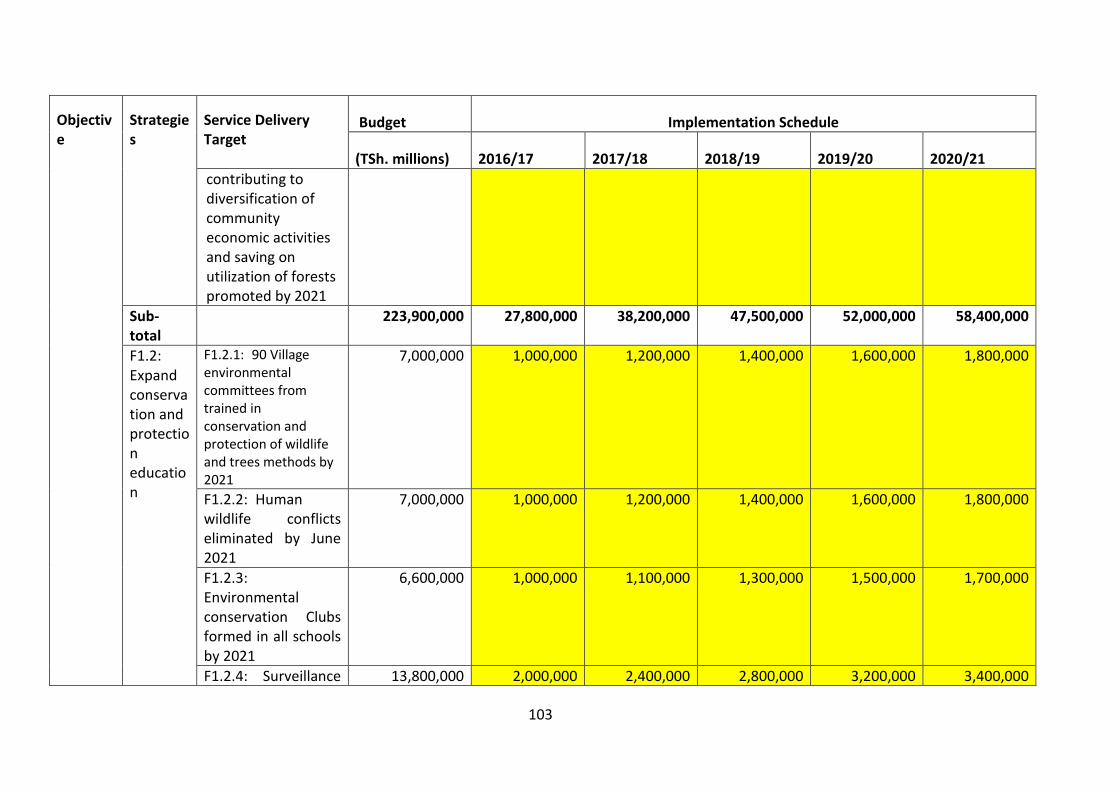
103
Objective
Strategies
Service Delivery Target
Budget Implementation Schedule
(TSh. millions) 2016/17 2017/18 2018/19 2019/20 2020/21
contributing to diversification of community economic activities and saving on utilization of forests promoted by 2021
Sub-total
223,900,000 27,800,000 38,200,000 47,500,000 52,000,000 58,400,000
F1.2: Expand conservation and protection education
F1.2.1: 90 Village environmental committees from trained in conservation and protection of wildlife and trees methods by 2021
7,000,000 1,000,000 1,200,000 1,400,000 1,600,000 1,800,000
F1.2.2: Human wildlife conflicts eliminated by June 2021
7,000,000 1,000,000 1,200,000 1,400,000 1,600,000 1,800,000
F1.2.3: Environmental conservation Clubs formed in all schools by 2021
6,600,000 1,000,000 1,100,000 1,300,000 1,500,000 1,700,000
F1.2.4: Surveillance 13,800,000 2,000,000 2,400,000 2,800,000 3,200,000 3,400,000
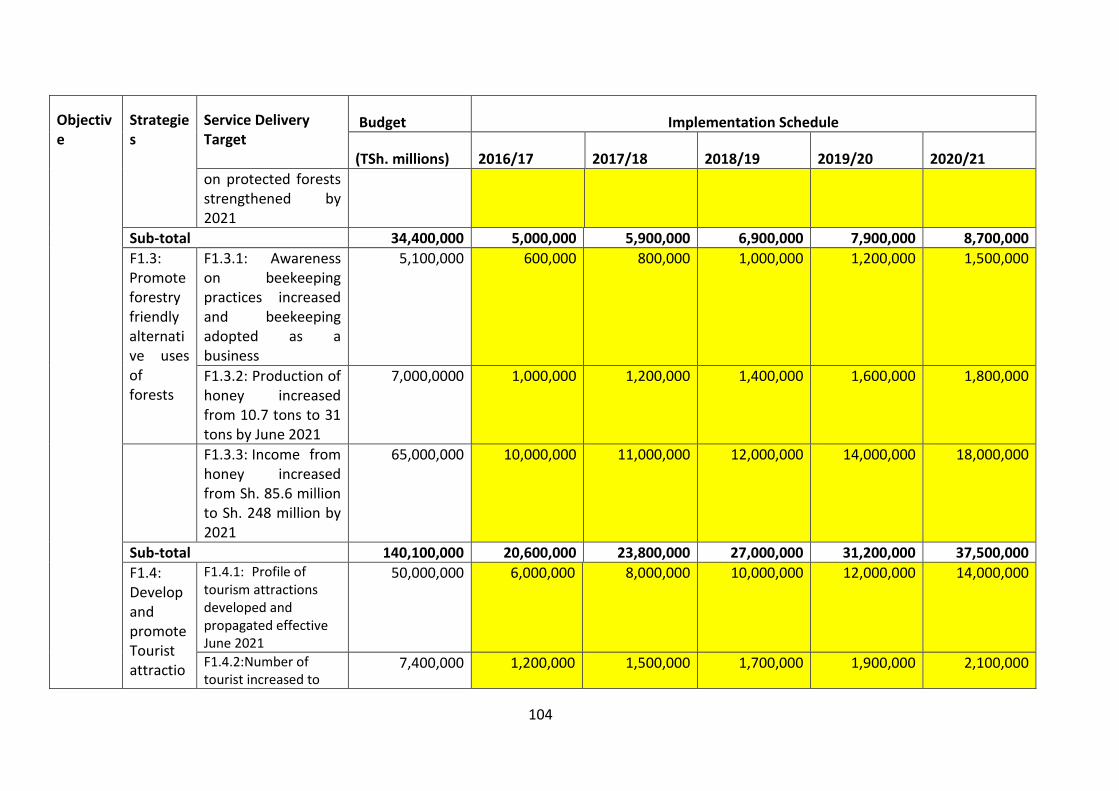
104
Objective
Strategies
Service Delivery Target
Budget Implementation Schedule
(TSh. millions) 2016/17 2017/18 2018/19 2019/20 2020/21
on protected forests strengthened by 2021
Sub-total 34,400,000 5,000,000 5,900,000 6,900,000 7,900,000 8,700,000
F1.3: Promote forestry friendly alternative uses of forests
F1.3.1: Awareness on beekeeping practices increased and beekeeping adopted as a business
5,100,000 600,000 800,000 1,000,000 1,200,000 1,500,000
F1.3.2: Production of honey increased from 10.7 tons to 31 tons by June 2021
7,000,0000 1,000,000 1,200,000 1,400,000 1,600,000 1,800,000
F1.3.3: Income from honey increased from Sh. 85.6 million to Sh. 248 million by 2021
65,000,000 10,000,000 11,000,000 12,000,000 14,000,000 18,000,000
Sub-total 140,100,000 20,600,000 23,800,000 27,000,000 31,200,000 37,500,000
F1.4: Develop and promote Tourist attractio
F1.4.1: Profile of tourism attractions developed and propagated effective June 2021
50,000,000 6,000,000 8,000,000 10,000,000 12,000,000 14,000,000
F1.4.2:Number of tourist increased to
7,400,000 1,200,000 1,500,000 1,700,000 1,900,000 2,100,000
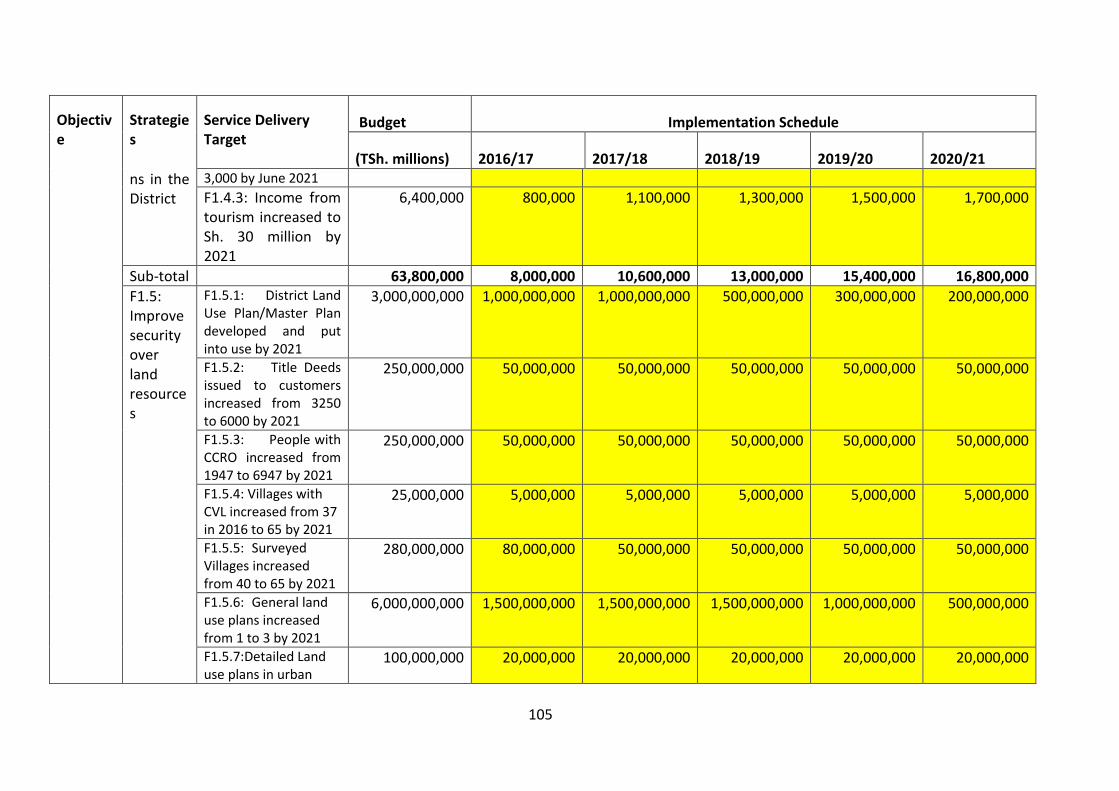
105
Objective
Strategies
Service Delivery Target
Budget Implementation Schedule
(TSh. millions) 2016/17 2017/18 2018/19 2019/20 2020/21
ns in the District
3,000 by June 2021
F1.4.3: Income from tourism increased to Sh. 30 million by 2021
6,400,000 800,000 1,100,000 1,300,000 1,500,000 1,700,000
Sub-total 63,800,000 8,000,000 10,600,000 13,000,000 15,400,000 16,800,000
F1.5: Improve security over land resources
F1.5.1: District Land Use Plan/Master Plan developed and put into use by 2021
3,000,000,000 1,000,000,000 1,000,000,000 500,000,000 300,000,000 200,000,000
F1.5.2: Title Deeds issued to customers increased from 3250 to 6000 by 2021
250,000,000 50,000,000 50,000,000 50,000,000 50,000,000 50,000,000
F1.5.3: People with CCRO increased from 1947 to 6947 by 2021
250,000,000 50,000,000 50,000,000 50,000,000 50,000,000 50,000,000
F1.5.4: Villages with CVL increased from 37 in 2016 to 65 by 2021
25,000,000 5,000,000 5,000,000 5,000,000 5,000,000 5,000,000
F1.5.5: Surveyed Villages increased from 40 to 65 by 2021
280,000,000 80,000,000 50,000,000 50,000,000 50,000,000 50,000,000
F1.5.6: General land use plans increased from 1 to 3 by 2021
6,000,000,000 1,500,000,000 1,500,000,000 1,500,000,000 1,000,000,000 500,000,000
F1.5.7:Detailed Land use plans in urban
100,000,000 20,000,000 20,000,000 20,000,000 20,000,000 20,000,000
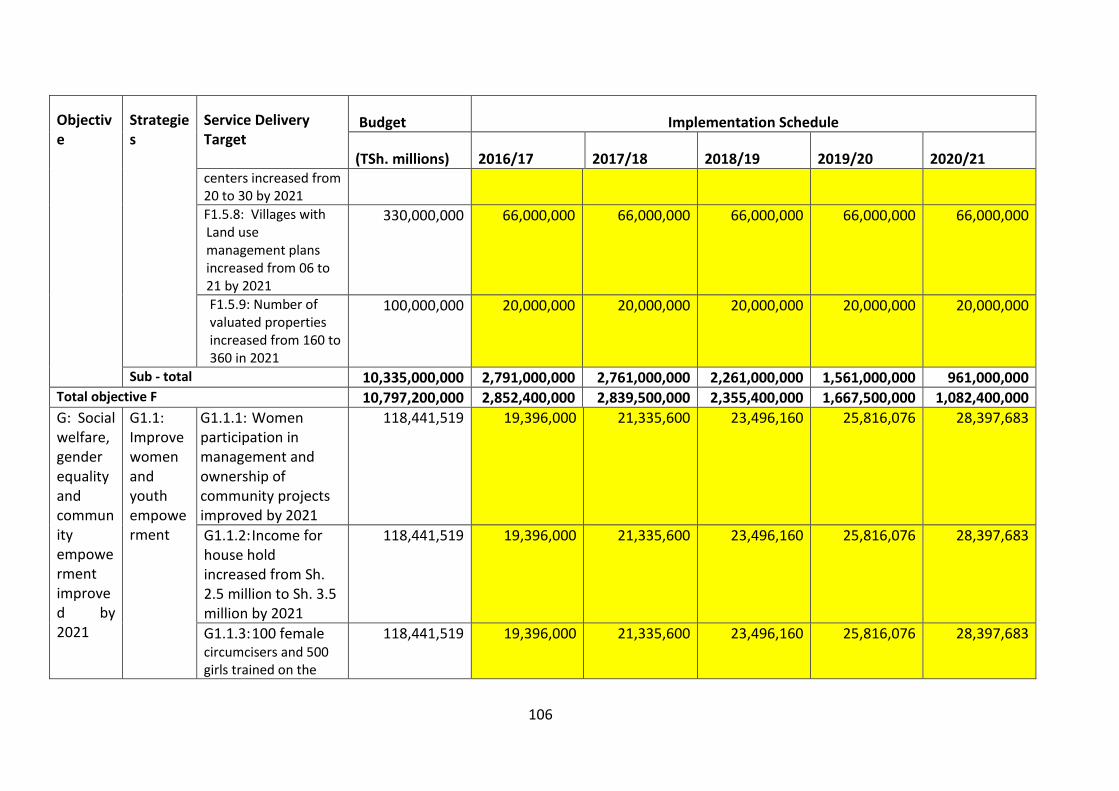
106
Objective
Strategies
Service Delivery Target
Budget Implementation Schedule
(TSh. millions) 2016/17 2017/18 2018/19 2019/20 2020/21 centers increased from 20 to 30 by 2021
F1.5.8: Villages with Land use management plans increased from 06 to 21 by 2021
330,000,000 66,000,000 66,000,000 66,000,000 66,000,000 66,000,000
F1.5.9: Number of valuated properties increased from 160 to 360 in 2021
100,000,000 20,000,000 20,000,000 20,000,000 20,000,000 20,000,000
Sub - total 10,335,000,000 2,791,000,000 2,761,000,000 2,261,000,000 1,561,000,000 961,000,000 Total objective F 10,797,200,000 2,852,400,000 2,839,500,000 2,355,400,000 1,667,500,000 1,082,400,000
G: Social welfare, gender equality and community empowerment improved by 2021
G1.1: Improve women and youth empowerment
G1.1.1: Women participation in management and ownership of community projects improved by 2021
118,441,519
19,396,000 21,335,600 23,496,160 25,816,076 28,397,683
G1.1.2: Income for house hold increased from Sh. 2.5 million to Sh. 3.5 million by 2021
118,441,519
19,396,000 21,335,600 23,496,160 25,816,076 28,397,683
G1.1.3: 100 female circumcisers and 500 girls trained on the
118,441,519
19,396,000 21,335,600 23,496,160 25,816,076 28,397,683
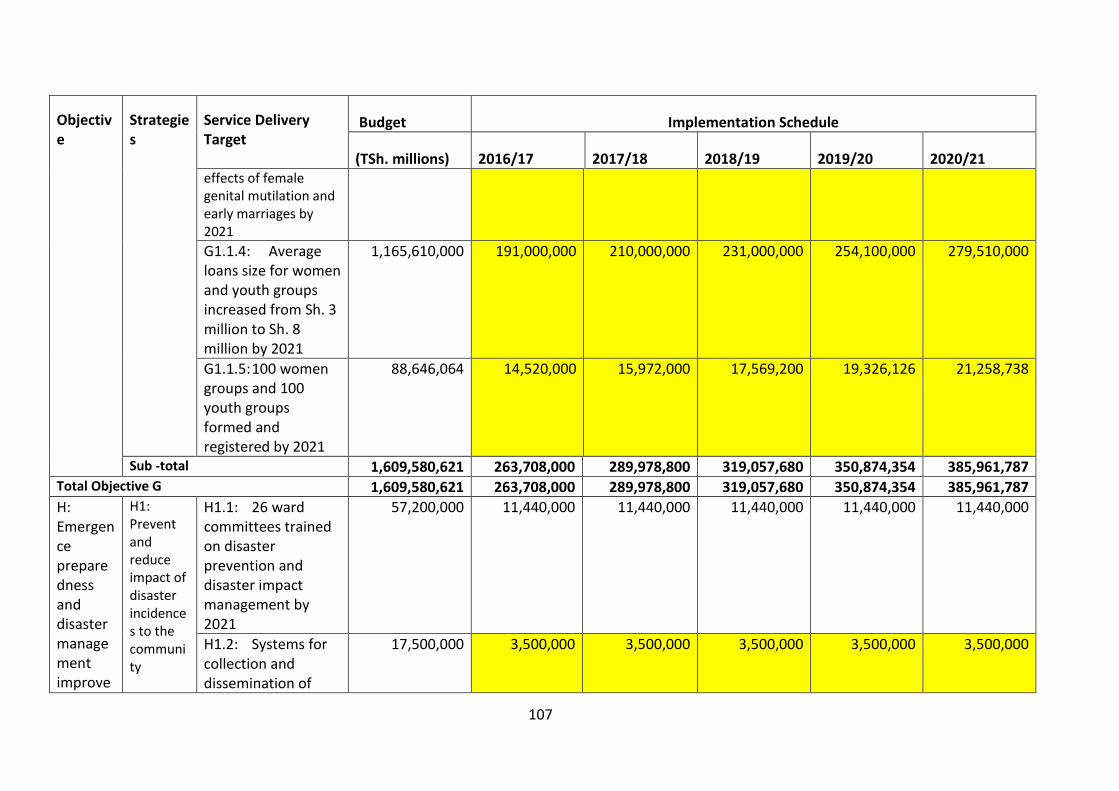
107
Objective
Strategies
Service Delivery Target
Budget Implementation Schedule
(TSh. millions) 2016/17 2017/18 2018/19 2019/20 2020/21 effects of female genital mutilation and early marriages by 2021
G1.1.4: Average loans size for women and youth groups increased from Sh. 3 million to Sh. 8 million by 2021
1,165,610,000
191,000,000 210,000,000 231,000,000 254,100,000 279,510,000
G1.1.5: 100 women groups and 100 youth groups formed and registered by 2021
88,646,064
14,520,000 15,972,000 17,569,200 19,326,126 21,258,738
Sub -total 1,609,580,621 263,708,000 289,978,800 319,057,680 350,874,354 385,961,787 Total Objective G 1,609,580,621 263,708,000 289,978,800 319,057,680 350,874,354 385,961,787
H: Emergence preparedness and disaster management improve
H1: Prevent and reduce impact of disaster incidences to the community
H1.1: 26 ward committees trained on disaster prevention and disaster impact management by 2021
57,200,000 11,440,000 11,440,000 11,440,000 11,440,000 11,440,000
H1.2: Systems for collection and dissemination of
17,500,000 3,500,000 3,500,000 3,500,000 3,500,000 3,500,000
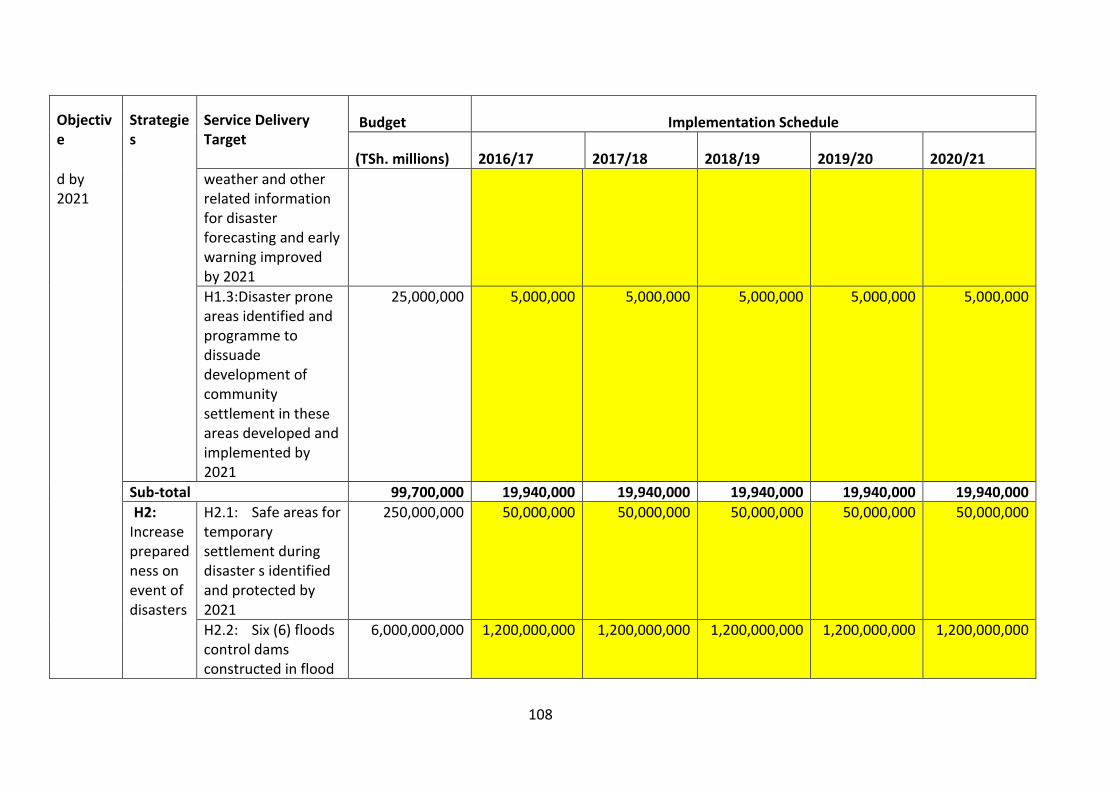
108
Objective
Strategies
Service Delivery Target
Budget Implementation Schedule
(TSh. millions) 2016/17 2017/18 2018/19 2019/20 2020/21
d by 2021
weather and other related information for disaster forecasting and early warning improved by 2021
H1.3:Disaster prone areas identified and programme to dissuade development of community settlement in these areas developed and implemented by 2021
25,000,000 5,000,000 5,000,000 5,000,000 5,000,000 5,000,000
Sub-total 99,700,000 19,940,000 19,940,000 19,940,000 19,940,000 19,940,000
H2: Increase preparedness on event of disasters
H2.1: Safe areas for temporary settlement during disaster s identified and protected by 2021
250,000,000 50,000,000 50,000,000 50,000,000 50,000,000 50,000,000
H2.2: Six (6) floods control dams constructed in flood
6,000,000,000 1,200,000,000 1,200,000,000 1,200,000,000 1,200,000,000 1,200,000,000
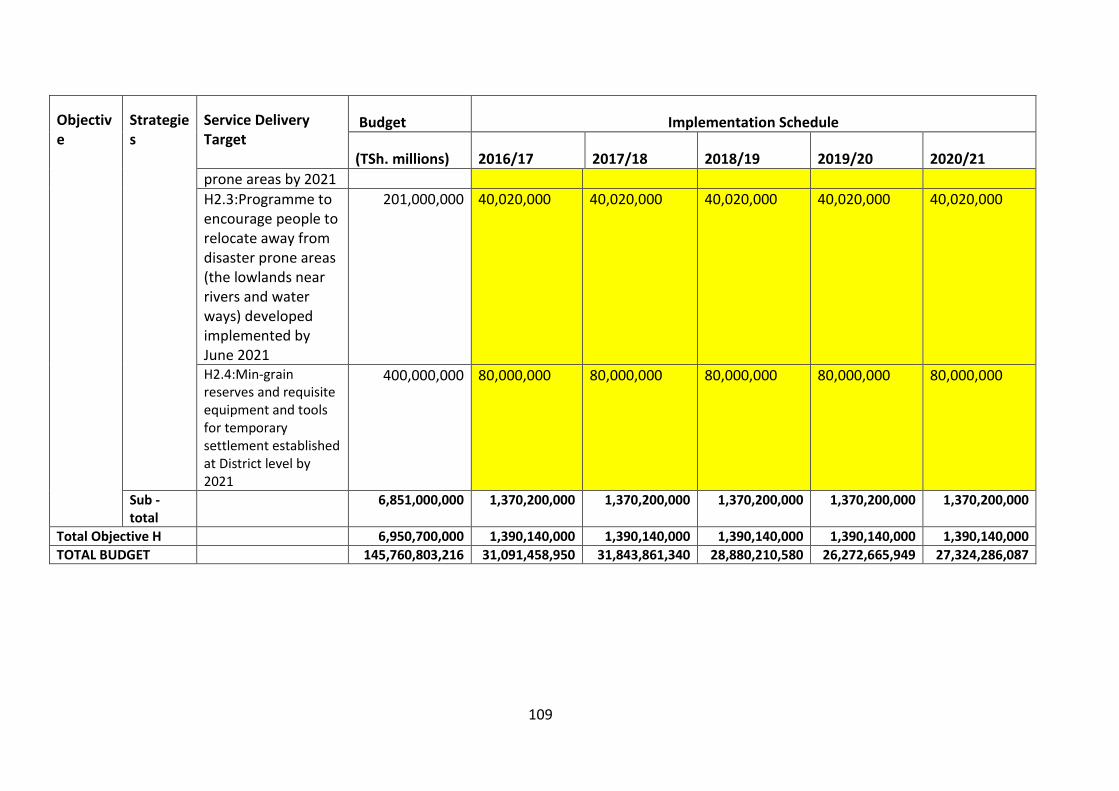
109
Objective
Strategies
Service Delivery Target
Budget Implementation Schedule
(TSh. millions) 2016/17 2017/18 2018/19 2019/20 2020/21
prone areas by 2021
H2.3:Programme to encourage people to relocate away from disaster prone areas (the lowlands near rivers and water ways) developed implemented by June 2021
201,000,000 40,020,000 40,020,000 40,020,000 40,020,000 40,020,000
H2.4:Min-grain reserves and requisite equipment and tools for temporary settlement established at District level by 2021
400,000,000 80,000,000 80,000,000 80,000,000 80,000,000 80,000,000
Sub - total
6,851,000,000 1,370,200,000 1,370,200,000 1,370,200,000 1,370,200,000 1,370,200,000
Total Objective H 6,950,700,000 1,390,140,000 1,390,140,000 1,390,140,000 1,390,140,000 1,390,140,000
TOTAL BUDGET 145,760,803,216 31,091,458,950 31,843,861,340 28,880,210,580 26,272,665,949 27,324,286,087