meshing of bathymetries for numerical wave modelling
TRANSCRIPT

6th International Conference on Hydroinformatics - Liong, Phoon & Babovic (eds) © 2004 World Scientific Publishing Company, ISBN 981-238-787-0
MESHING OF BATHYMETRIES FOR NUMERICAL WAVE MODELLING
VOLKER BERKHAHN
Institute for Computer Science in Civil Engineering, University of Hannover Callinstraße 34, D-30167 Hannover, Germany
STEPHAN MAI
Franzius-Institute for Hydraulics, Waterway and Coastal Engineering University of Hannover, Nienburgerstraße 4, D-30167 Hannover, Germany
Rectangular and curvilinear meshes are used for numerical wave simulations based on finite differences calculation schemes. In order to improve the approximation quality of rectangular meshes an adapted b-spline technique is developed to generate curvilinear meshes. The numerical results and the computational efforts for both kinds of meshes are discussed. INTRODUCTION Numerical wave models using finite differences calculation schemes, like SWAN presented by Booij et al. [3], require regular element meshes of the bathymetry. The bathymetry approximation, the resolution as well as the shape of these meshes have strong influence on the results of wave modelling. Traditionally, these numerical simulations based on finite differences schemes are performed with rectangular meshes. These rectangular meshes are easy to generate, but they involve the disadvantage of poor bathymetry approximation. In order to improve the approximation quality a method to generate curvilinear meshes based on an adapted b-spline technique is presented. The key idea of this meshing approach, presented by Berkhahn [1], is characterized by an approximation of the initial measurement data by free form surfaces. The wave propagation in the German tidal flats, located in the coastal zone of the North Sea, is analysed for various bathymetric meshes. Special focus is put on the propagation through tidal creeks near the dune islands of Spiekeroog and Wangerooge. BATHYMETRY UNDER CONSIDERATION Large tidal flats exist along the northern Dutch and western German North Sea coast. This so called wadden sea is separated from the open sea by a chain of dune islands. Deep creeks are located between the islands enabling a periodic flooding and drying of the wadden sea. The tidal range amounts to approx. 2.80 m. The islands of Spiekeroog and Wangerooge are located at the eastern end of this chain of six Dutch and seven German islands. The tidal creek between them is named Harle. Its width is approx. 2.5 km, its depth approx. up to 9 m below mean sea level (msl) with comparably high
1

2
slopes. The waves approaching from the North Sea and passing through the Harle determine – besides of the local wind set-up – the wave field over the tidal flats. Therefore wave forecasting respectively hindcasting requires an accurate modelling of the wave propagation through the tidal creek. NUMERICAL WAVE SIMULATION The accuracy of numerical wave modelling strongly relates to the type and the resolution of the computational grid and its bathymetric mesh. Because of the structured bathymetry this is valid especially for the numerical wave simulation in coastal regions, as Booij et al. [3] have shown with the third generation wave model SWAN. The basis of SWAN operated in the stationary mode is the action balance equation
x ySc N c N c N c N
x yσ θ
σ θ σ∂ ∂ ∂ ∂
+ + + =∂ ∂ ∂ ∂
. (1)
The first and the second term on the left hand side represent the propagation of action in geographical space with propagation velocities cx and cy in x- and y-space. The third term describes the frequency shift due to variations in depths with propagation velocity cσ in σ-space. The fourth term models the depth-induced refraction with propagation velocity cθ in θ–space. The right hand side of the action balance equation is the source respectively sink term of energy density representing the effects of generation, dissipation and nonlinear wave-wave interactions. Equation (1) is discretized in σ-, θ-space as well as in x-, y-space using the bathymetric mesh constructed by b-splines. The standard physical processes incorporated in the source term were activated applying the standard parameter set of SWAN presented by Ris [7,8]. Slight modifications of these parameter set are based on a calibration with on-site measurements performed by Mai et al. [4] and with physical modeling developed by Mai et al. [5]. FREEFORM SURFACE MODELING The technique of b-splines is widely used in computer aided geometric design and re-engineering of surfaces in order to describe the geometric shape of technical products. This technique leads to the surface representation based on b-splines for bathymetry approximation presented by Berkhahn [1]. This concept is realized in the meshing tool called HydroMesh [10]. A point on a b-spline surface is defined by
0 0( , ) ( ) ( )
N MK L
ij i ji j
u v N u N v= =
= ∑∑b d for [ ]1,K Nu u u +∈ and [ ]1,L Mv v v +∈ . (2)
In equation (2) all expressions in bold face indicate a point in the three dimensional Euclidian space E3. On the left hand side of this equation b(u,v) denotes a point on the b-spline surface in dependence of the two parameters u and v. The first expression dij in the double sum describes a regular grid of N+1 control points in u parameter direction and M+1 control points in v parameter direction. The shape functions in u and v parameter

3
directions are called b-spline functions and , where the upper indices ( )KiN u ( )L
jN v K and L indicate the degree of the b-spline functions.
In order to ensure the property of local modeling possibility, the influence of the control points with respect to the shape of the surface has to be restricted to a specified parameter range. Therefore the b-spline functions of degree 0 are defined as follows
[ [10 forfor
else
1 ,( ) 0, ,
0 i i
iu u u
N u i N K+⎧ ∈= =⎨⎩
K + . (3)
In equation (3) ui and ui+1 denote the lower and upper bounds of the ith parameter interval. All bounds of the parameter intervals are gathered in the knot vector u
[ ]0 1, , TN Ku u + +=u K . (4)
The b-spline functions of higher degree are given with the recursive formula 11 1
11 1
( ) ( ) ( )i i rr ri i i
i r i i r i
u u u uN u N u N uu u u u
+ +− −+
+ + + +
− −= +
− −r
r for
1, ,0, ,
r N Ki N K= += + −
K
K . (5)
The b-spline function of degree riN r is based on the b-spline functions and
which ensures the important property of local modeling possibility
1riN − 1
1riN −+
( ) 0riN u = for u R∈ ] [1,i i ru u + + . (6)
The equation (2) has to be an affine combination. This requirement is fulfilled only within the interval, which leads to the restriction for the parameters u and v .
0( ) 1
NKi
iN u
==∑ for [ ]1,K Nu u u +∈ . (7)
Figure 1. Rectangular (left) and curvilinear (right) control point grid.
Since the boundary curves are defined the control points are interpolated via bilinear blended Coons patches as shown by Berkhahn [1,2]. In case of rectangular boundary curves this interpolation leads to a rectangular control point grid, as illustrated on the left hand side of figure 1 for 40 × 35 control point grid. In this special case of bathymetry
4
shape this Coons interpolation method leads to an impracticable mesh as shown on the right hand side of figure 1.
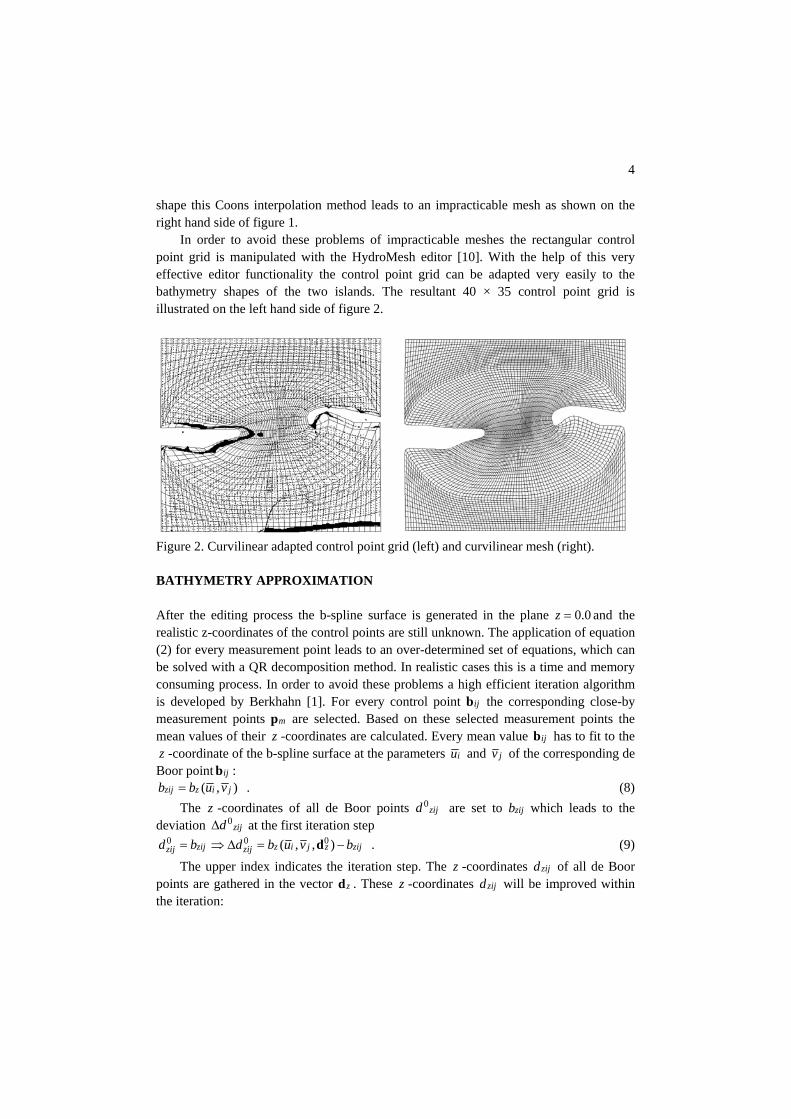
In order to avoid these problems of impracticable meshes the rectangular control point grid is manipulated with the HydroMesh editor [10]. With the help of this very effective editor functionality the control point grid can be adapted very easily to the bathymetry shapes of the two islands. The resultant 40 × 35 control point grid is illustrated on the left hand side of figure 2.
Figure 2. Curvilinear adapted control point grid (left) and curvilinear mesh (right). BATHYMETRY APPROXIMATION After the editing process the b-spline surface is generated in the plane and0.0z = the realistic z-coordinates of the control points are still unknown. The application of equation (2) for every measurement point leads to an over-determined set of equations, which can be solved with a QR decomposition method. In realistic cases this is a time and memory consuming process. In order to avoid these problems a high efficient iteration algorithm is developed by Berkhahn [1]. For every control point the corresponding close-by measurement points are selected. Based on these selected measurement points the mean values of their -coordinates are calculated. Every mean value has to fit to the
-coordinate of the b-spline surface at the parameters
ijbmp
z ijbz iu and jv of the corresponding de Boor point : ijb
( , )zij z i jb b u v= . (8) The -coordinates of all de Boor points are set to which leads to the
deviation at the first iteration step z 0zijd zijb
0zijd∆0
zijzijd b= 0 0( , , )z i j z zijzijd b u v b⇒ ∆ = −d . (9) The upper index indicates the iteration step. The z -coordinates of all de Boor
points are gathered in the vector . These -coordinates will be improved within the iteration:
zijdzd z zijd

5
1 1k k kzij zij zijd d d− −= + ∆ for with 0k > ( , , )k k
z i j z zijzijd b u v b∆ = −d . (10) The iteration process will be continued until all deviations are small enough.
This dragging algorithm drags the approximating surface towards the mean values and is proved for the calculation of large-scale b-spline surfaces with several thousands of control points as proven by Mai and Berkhahn [6] and Berkhahn et al. [2].
k zijd∆ijb
MESH GENERATION Since the approximating b-spline surface is based on a regular de Boor point grid it is very easy to generate a regular quadrilateral element mesh. The element nodes n are generated in the uv-parameter space of the b-spline surface with equal parameters distances and : u∆ v∆
0 0( ,ij u i u v j v= + ∆ + ∆n b ) . (11) The result of this mesh generation is shown for the curvilinear 160 × 140 element
mesh on the right hand side of figure 2. Any other criteria based on the geometry of the b-spline surface can be used to generate other element pattern. Using a common refinement method, the new nodes are defined by a linear interpolation between existing element nodes. Instead of this conventional mesh refinement the new nodes are created by a linear interpolation in the uv -parameter space. Thus the refinement nodes are placed on the b-spline surface and describe the bathymetry with increased accuracy. NUMERICAL RESULTS OF WAVE SIMULATIONS In order to analyse the influence of the type and the resolution of the bathymetric respectively computational mesh on the accuracy of wave modelling numerical simulations are carried out for two grid types (rectangular resp. curvilinear) with two different grid resolutions (160 × 140 resp. 320 × 280 elements).
The incoming wave field at the western, northern and eastern boundary of the focus area near Spiekeroog and Wangerooge is derived from large scale numerical simulations of wave propagation for the southern German bight [7]. Within the focus area the water level and wind conditions are varied from 0 m above msl to 4 m above msl respectively from 16 m/s to 32 m/s with directions from 300° to 60°.
An example of the wave field in the southern German bight and in the focus area is given in figure 3. The results within the focus area are given for a fine (320 × 280 elements) rectangular mesh and a fine (320 × 280 elements) curvilinear mesh. Significant differences between the results for both mesh types become obvious in the southern part of the tidal creek Harle. A detail analysis of the spectral properties and characteristic wave parameters is carried out at three locations (L1, L2, L3) south of Spiekeroog and Wangerooge, given in figure 3.

6
3415000 3425000 3435000 3445000 3455000 3465000
5925
000
5935
000
5945
000
5955
000
5965
000
5975
000
focus area
Jade
Weser
North Sea
5955
000
5959
000
5963
000
3417000 3421000 3425000 3429000
Spiekeroog
Wangerooge
0.51.52.53.55.0significantwave height [m]
finerectangular
L2 L3L1
3417000 3421000 3425000 3429000
5955
000
5959
000
5963
000
Spiekeroog
Wangerooge
finecurvilinear
L1 L2 L3
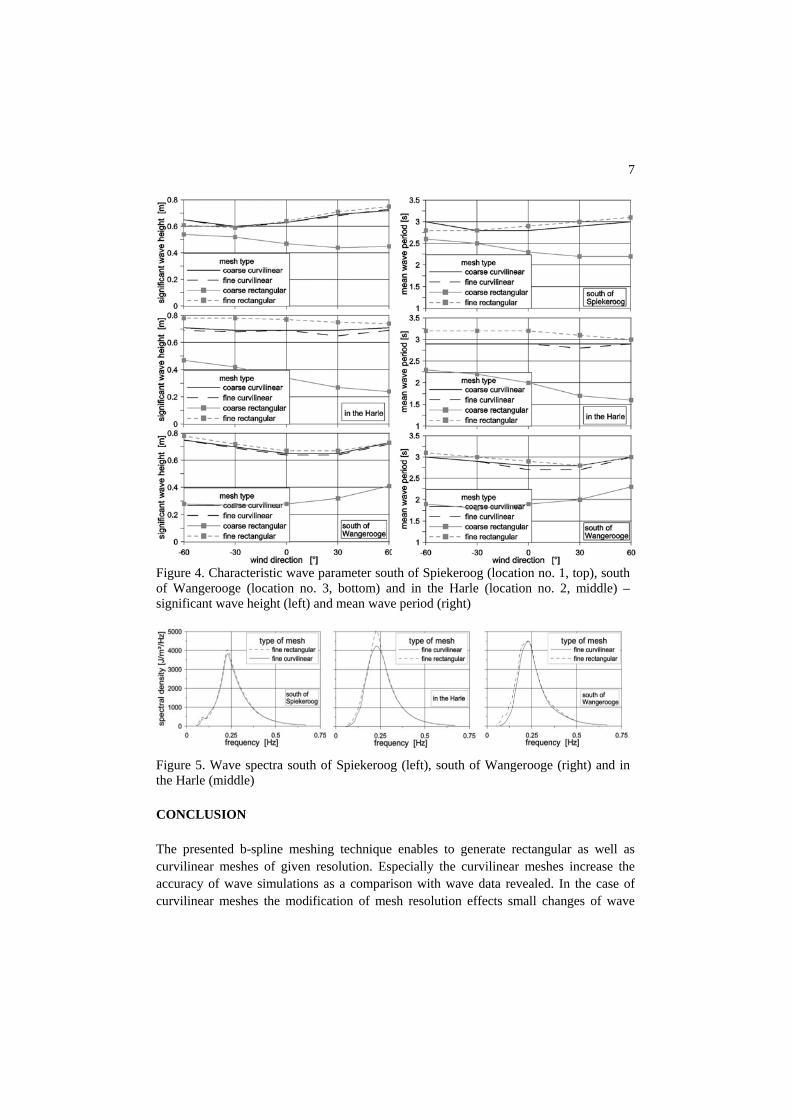
Figure 3. Wave field in the southern German Bight (left) based on large scale numerical simulations and in the focus area near the islands Spiekeroog and Wangerooge (right) based on different mesh types. COMPARISON OF RESULTS A comparison of the characteristic wave parameters (significant wave height and mean wave period) calculated with different computational respectively bathymetric meshes is given in figure 4. The use of different meshes leads to a large scatter in significant wave height of up to 75 % and in mean wave period of up to 50 %.
Doubling the resolution of rectangular meshes leads to large changes of wave parameters. In contrast to this, doubling the resolution of curvilinear meshes effects small changes of wave parameters. Thus numerical wave modelling using curvilinear meshes has lower requirements on grid resolution. The differences in characteristic wave parameters relate to differences in the wave spectrum. Figure 5 exemplary shows wave spectra at the locations L1–L3.
7
Figure 4. Characteristic wave parameter south of Spiekeroog (location no. 1, top), south of Wangerooge (location no. 3, bottom) and in the Harle (location no. 2, middle) – significant wave height (left) and mean wave period (right)
Figure 5. Wave spectra south of Spiekeroog (left), south of Wangerooge (right) and in the Harle (middle) CONCLUSION The presented b-spline meshing technique enables to generate rectangular as well as curvilinear meshes of given resolution. Especially the curvilinear meshes increase the accuracy of wave simulations as a comparison with wave data revealed. In the case of curvilinear meshes the modification of mesh resolution effects small changes of wave

8
parameters. Thus curvilinear meshes are favoured, which are easy to generate for example with the HydroMesh meshing tool [10]. These results are demonstrated by numerical simulations for the German Bight near the islands of Spiekeroog and Wangerooge. REFERENCES
[1] Berkhahn V., “Mesh Generation for Hydrodynamics Simulations”, Proceedings of the Symposium "Fundamentals and Applications of Computer Science in Civil Engineering - State of the Art in Germany", University of Science and Technology, Building and Housing Research Center, Teheran, Iran, (2002).
[2] Berkhahn V., Göbel M., Stoschek O. and Matheja A., “Generation of Adaptive Finite Element Meshes Based on Approximation Surfaces”, Proceedings of the 5th International Conference on Hydro-Science and Engineering ICHE, Warsaw, Poland, (2002).
[3] Booij N., Ris R.C. and Holthuijsen L.H., “A Third-Generation Wave Model for Coastal Regions, 1. Model Description and Validation”, Journal of Geophysical Research, Vol. 104, (1999), pp 7649-7666.
[4] Mai S., Ohle N., and Zimmermann C., “Applicability of Wave Models in Shallow Coastal Waters”, Proceedings of the 5th International Conference on Coastal and Port Engineering in Developing Countries (COPEDEC), Cape Town, South Africa, (1999), pp 170 – 179.
[5] Mai S., Ohle N., Daemrich K.-F., and Zimmermann C. “Numerical Simulation of Wave Transmission at Submerged Breakwaters Compared to Physical Modelling”, Proceedings of the 11th International Biennial Conference on Physics of Estuaries and Coastal Seas (PECS), Hamburg, Germany, (2002), pp 155 – 158.
[6] Mai S. and Berkhahn V., “Generation of Regular Meshes For Numerical Wave Modelling”, Proceedings of the XXX IAHR Congress, Thessaloniki, Greece, (2003).
[7] Mai S. and Zimmermann C., “Risk Analysis - Tool for Integrated Coastal Planning” Proceedings of the 6th International Conference on Coastal and Port Engineering in Developing Countries COPEDEC, Colombo, Sri Lanka, (2003).
[8] Ris S., “Spectral Modelling of Wind Waves in Coastal Areas”, Communication on Hydraulic and Geotechnical Engineering, Report No. 97-4, Delft, Netherlands, (1997).
[9] Ris R.C., Holthuijsen L.H. and Booij N., “A Third-Generation Wave Model for Coastal Regions, 2. Verification”, Journal of Geophysical Research, Vol. 104, C4, (1999), pp 7667 – 7681.
[10] www.hydromesh.com, “Mesh Generation for Numerical Hydrodynamic Simula-tions”, (2004).