message from the chairman - annualreports.com · message from the chairman ... audit and...
TRANSCRIPT

Message from the Chairman
I would like to personally address you, my fellow shareholders, about the governance of our Company. Aschairman of the board, the largest shareholder and the person whose name is above the door, I have a uniquevantage point – a bird’s eye view, if you will – of our business.
I, along with the individual board members, represent you in the governance of this Company. Your board is – andhas been – operating according to many of the “best practices” guidelines that have emerged in the aftermath ofnegative corporate headlines. Some of our actions include:
Separate chairman of the board and chief executive officer positions.
An independent, outside director, Michael Rose, as our lead director.
Audit and compensation committees comprised of independent, outside directors, with specific dutiesand responsibilities detailed in separate charters.
The establishment of a Disclosure Committee, and
We are offering, for your approval, new outside and inside directors whom we believe can increase thebusiness acumen of our board.
In short, we are and have been attentive to the quality, integrity and transparency of our board leadership.
As you know, our esteemed CEO, JackWilliams, retired earlier this year (see note below.) Our new leadership –Mike Fisher, chief executive officer, and Gwen Manto, vice chair and chief merchandising officer – reflects ourbelief that the future will continue to be forged by those who successfully blend intelligence, experience and leadership.Both are seasoned executives with extensive background at some of the nation’s premier retailers, and both haveserved this Company well over the past several years. I am personally delighted by the opportunities that we havegiven them, and that they, in turn, can create for all of us.
We each have a stake in this company, and I take the performance of this company personally. Although we livein uncertain times, I believe that Stein Mart’s proven concept, seasoned management and loyal customers willultimately prevail. As we continue to pursue greater profitability, I look forward to bottom line progress thatreflects our commitment to you, the stockholders.
Thank you for your interest in our Company.
Jay SteinChairman of the Board
I must take a moment in this public messageto thank and to show my appreciation tomy friend, my partner and my co-worker,Jack Williams. Jack began with us almost atthe beginning, when we had just three stores.I want to thank him for his sincere love, wisecounsel, and tireless devotion to this companyand me. We are, in great part, the Companywe are today because Jack Williamsanswered my call 23 years ago.
How do you thank someone for a lifetimeof commitment? The way you start is to tellthe world what he has meant to us.
Jay

Stein Mart, Inc. Corporate Profile
Stein Mart’s 265 stores offer the merchandise, service and presentation of a traditional, better department/specialty store,at prices competitive with off-price retail chains.
Located in 29 states from California to Florida to NewYork, Stein Mart stores feature fashion merchandise includingmoderate to designer brand-name apparel for women, men and children, as well as accessories, gifts, linens and shoes.
For a complete list of Stein Mart store locations, please visit www.steinmart.com
StoresOpen at End of theYear300
275
250
225
200
175
150
125
100
75
50
25
0
’93 ’94 ’95 ’96 ’97 ’98 ’99 ’00 ’01 ’02
6680
100123
151
182
205226
253265
Net Sales (dollars in millions)
$1,600$1,500$1,400$1,300$1,200$1,100$1,000$900$800$700$600$500$400$300$200$100
0’93 ’94 ’95 ’96 ’97 ’98 ’99 ’00 ’01 ’02
$342.7$419.2
$496.0
$616.2
$792.7
$897.8
$1,035
$1,207
$1,320
$1,409
1
Table of ContentsFinancial Highlights 1Letter to our Shareholders 2Highlights of 2002 4Selected Financial Data 7
Management’s Discussionand Analysis 8Financial Statements 12Report of IndependentCertified Public Accountants 25
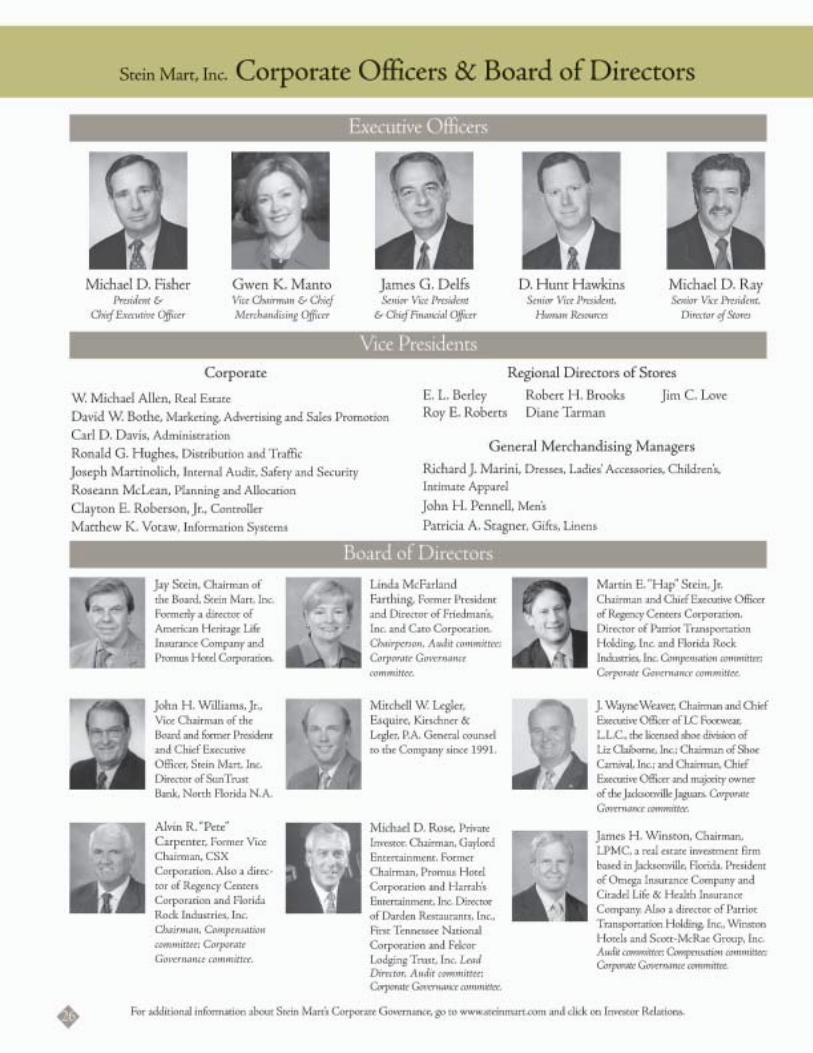
Corporate Officers andDirectors 26
Stockholder Information 27
Selected Financial Highlights (Dollars in thousands except per share amounts)
2002 2001(1) % changeIncome Statement Data:
Net Sales $1,408,648 $1,320,190 6.7Net Income $20,690 $15,354 34.8Diluted Earnings Per Share $0.50 $0.37 35.1
Operational Data:Number of stores 265 253 4.7Same Store Sales (0.8)% (0.7)%
(1)Beginning with fiscal year 2001, the Company changed to a 52-53 week year ending the Saturday closest to January 31;previously, the Company’s fiscal year ended on the Saturday closest to December 31.

Dear fellow stockholders,Our 2002 financial performance was markedly improved over the previous year, although the retail environmentimpeded the achievement of our initial plan. The Company earned $20.7 million or $0.50 per share in 2002,significantly ahead of the $15.4 million or $0.37 per share earned last year, and a sizeable accomplishmentconsidering annual net sales were actually down slightly (-0.8%) on a comparable store basis.
Because the challenging external environment hampered sales growth, it became imperative to look elsewhere forprofitability. Stein Mart’s success in 2002 came from making strategic improvements in our core business, and webelieve that this progress will prove crucial in 2003.
Disciplined inventory management and improved sales productivityDespite negative comparable store sales and the resulting inability to leverage occupancy costs, the Company’s gross profitgrew by nearly $32 million in 2002, increasing from 24.0% of sales to 24.7% of sales. This key indicator was the result oftwo Company-wide initiatives –more disciplined inventory management and greater sales-per-square foot productivity.
Our merchants, who excel at choosing the right merchandise, worked with their planning and allocation partnersto make strategic reductions in inventory in 2002. These reductions were the result of streamlined purchases, amore aggressive markdown schedule and an improved basic stock replenishment system which reduced back stockof certain items. The result was a fresher assortment, greater mobility in the stores for customers, increased inven-tory turnover and fewer markdowns. At year-end, inventories in the average store were reduced by four percent.
To increase sales per square foot productivity, floor space was reallocated in Spring ’02, with additional space givento areas with greater profit opportunities such as Boutique, Gifts and Accessories. At the same time, merchandisein Men’s and Children’s was reduced and confined to specific categories. Gifts and Accessories were the most positivelyimpacted by the changes,while the Boutique re-format has not been as successful given the weak sales environment.We also replaced one of our two shoe department lessees, and our fledgling partnership with DSW ShoeWarehouse is already showing great promise for additional profitability.
Growth in the store networkWe opened 16 new stores and closed four under-performing ones. By choosing a conservative opening scheduleand refining our location/siting process, we enjoyed a class of new stores with the best sales-to-operating planperformance we’ve had in recent history.
In the fall of 2002, a smaller-format concept store, known as “collections of Stein Mart”, debuted in Rolling Hills,California. This prototype is less than half the size of our traditional Stein Mart store, and is being tested to see if itwill allow us to enter more resort and premiummarkets where a full-size SteinMart may not be feasible. Initial resultsare promising, and at least two more “collections of Stein Mart” stores are included in the 2003 store opening plans.
Financial strengthOur more disciplined approach to inventory control decreased our capital needs and lowered interest expense.At year-end, our borrowings were down nearly thirty percent from the end of 2001 and our interest expense
Letter to our Shareholders
2

Stein Mart, Inc.
decreased by one-third. And although nearly twomillion shares remain on our stock repurchaseauthorization, we chose to be conservative with cashin this environment and limit our share repurchasesto 220,000 shares.
Looking aheadStein Mart’s premise of great fashion for the wardrobeand the home at exceptional prices is as fresh andrelevant as ever, and we continue to believe there issignificant future opportunity for our Company.
The productivity initiatives begun in 2002 continuethis year. In 2003, we remain dedicated to improvingour core business model, using tactical decision-mak-ing, technology and training to create profitabilityprogress. We will continue to employ a disciplinedinventory strategy, assess the opportunities in each storeand each family of business, and use our capital wisely.
For 2003, we will open 14 stores based on our updatedprocess for new store site selection. Using proprietarymarket research in addition to traditional demograph-ics, we expect more successful new store performancessuch as the ones enjoyed in 2002.Also during 2003, wewill close 16 stores that remain unprofitable despiteconcerted efforts to stimulate sales. These concurrentactivities should help improve the overall quality of theCompany’s portfolio of stores.
Thanks to the initiatives put in place this year, and the15,000 associates who have worked so hard toproduce these results, our Company stands to reapgreater benefits when the external environmentbecomes more advantageous. Our promise to you, asstockholders, is to be conservative stewards of yourinvestment, and to honor the trust you have placed inour Company.
This is my last annual letter to you. By thetime you read this, Mike Fisher will havebeen installed as our president and chiefexecutive officer – the second non-familyCEO in Stein Mart’s history.
As I step aside from an active officer’s role,my deepest gratitude goes to Jay Stein forthe opportunities he has given me duringthe past 23 years. It has been my privilege tohelp him build Stein Mart into a successfulcompany, filled with many talented people,and in which we take great pride. Over theyears, our complementary strengths andmutual respect for one another have createdan enduring partnership, and I greatlyappreciate his faith and trust in my abilities.
The world that we have operated in sinceSeptember 11, 2001 has been different andmore difficult than any time in ourCompany’s history. I’m sorry to say that theresults of the last two years have not satisfiedanyone, especially us. At the same time, ourkey executive team has worked hard toprotect the core business for the futurebenefit of our Company and its stockholders,with the goal of prudently managing theCompany’s capital, and investing in systemsand people who will produce better resultsas conditions improve.
The planned transition of key leadership hasallowed us to put in place a team with thecapacity, talent and motivation to takeStein Mart forward. It is with confidenceand pride that the corporate reins have beenturned over to them. I wish them and youthe best in the future…
John H.Williams, Jr.
Vice Chairman of the Board
Michael D. FisherPresident and
Chief Executive Officer3


7
(Dollars In Thousands Except Per Share Amounts and Operating Data) For the Fiscal Year Ended________________________________________________________________________________Feb. 1, Feb. 2, Dec. 30, Jan. 1, Jan. 2,
STATEMENT OF INCOME DATA: 2003 2002 1 2000 2000 1999________________________________________________________________________________
Net Sales $1,408,648 $1,320,190 $1,206,624 $1,034,561 $897,821
Cost of Merchandise Sold 1,060,117 1,003,567 896,560 781,038 677,334________________________________________________________________________________
Gross Profit 348,531 316,623 310,064 253,523 220,487Selling, General andAdministrative Expenses 2 326,509 301,937 257,042 244,100 195,460
Other Income, Net 13,953 14,078 13,766 12,129 10,420________________________________________________________________________________
Income From Operations 35,975 28,764 66,788 21,552 35,447Interest Expense 2,604 4,000 3,309 2,485 2,368________________________________________________________________________________
Income Before Income Taxes 33,371 24,764 63,479 19,067 33,079Provision For Income Taxes 12,681 9,410 24,122 7,245 12,570________________________________________________________________________________
Net Income $ 20,690 $ 15,354 $ 39,357 $ 11,822 $ 20,509
Earnings Per Share - Basic 3 $0.50 $0.37 $0.92 $0.26 $0.45Earnings Per Share - Diluted 3 $0.50 $0.37 $0.91 $0.26 $0.44
SELECTED OPERATING DATA:Stores Open at End of Period 265 253 226 205 182Average Sales Per Store (000’s) 4 $5,741 $5,922 $6,068 $5,663 $5,958Average Sales Per Square Footof Selling Area 5 $184 $189 $192 $176 $185
Comparable Store Net Sales(Decrease) Increase 6 (0.8%) (0.7%) 9.7% 2.3% 1.2%
BALANCE SHEET DATA:Working Capital $145,787 $179,212 $120,602 $117,284 $110,985Total Assets 410,217 417,672 389,989 354,094 318,012Long-term Debt 7 – 57,750 – – –Total Stockholders’ Equity 223,307 201,895 194,028 179,912 177,979
1 Beginning with fiscal 2001, the Company changed to a 52-53 week year ending on the Saturday closest to January 31; previously, theCompany‘s fiscal year ended on the Saturday closest to December 31. See Note 12 to the Financial Statements for financial data for thefive-week Transition Period ended February 3, 2001.
2 Selling,General andAdministrative Expenses include store closing/asset impairment charges of $2.7 million in 2002; $2.9 million in 2001;and $15.9 million in 1999. A $3.4 million credit related to store closings was recorded in 2000.
3 Basic andDiluted Earnings Per Share are presented for all periods in accordancewith Statement of FinancialAccounting Standards (“SFAS”)No. 128,“Earnings Per Share.”
4 Average sales per store (including sales from leased shoe and fragrance departments) for each period have been calculated by dividing(a) total sales during such period by (b) the number of stores open at the end of such period, in each case exclusive of stores open for lessthan 12 months. All periods are calculated on a 52-week basis.
5 Includes sales and selling space of the leased shoe and fragrance departments. Selling area excludes administrative, receiving and storageareas. All periods are calculated on a 52-week basis.
6 Comparable store information for a period reflects stores open throughout that period and for the same 52-week period in the prior year.7 Notes payable to banks of $41,350 at February 1, 2003 is classified as current (see Note 4 to the Financial Statements).
Stein Mart, Inc. Selected Financial Data

This document includes a number of forward-looking statements which reflect the Company’s current views with respect to futureevents and financial performance. Wherever used, the words “plan”, “expect”, “anticipate”, “believe”, “estimate” and similar expressionsidentify forward-looking statements.
All such forward-looking statements contained in this document are subject to risks and uncertainties that could cause theCompany’sactual results of operations to differ materially from historical results or current expectations. These risks include, without limitation,ongoing competition from other retailers many of whom are larger and have greater financial andmarketing resources, the availabilityof suitable new store sites at acceptable lease terms, ability to successfully implement strategy to exit or improve under-performingstores, changes in store closings, changing preferences in apparel, changes in the level of consumer spending due to current eventsand/or general economic conditions, adequate sources of designer and brand-name merchandise at acceptable prices, and theCompany’s ability to attract and retain qualified employees to support planned growth.
The Company does not undertake to publicly update or revise its forward-looking statements even if experience or future changesmake clear that any projected results expressed or implied therein will not be realized.
The following should be read in conjunction with the “Selected Financial Data” and the notes thereto and the Financial Statementsand notes thereto of the Company.
Results of OperationsThe following table sets forth, for the periods indicated, the percentage of the Company’s net sales represented by each line itempresented:
52 Weeks Ended_____________________________________________________________Feb. 1, Feb. 2, Dec. 30,2003 2002 2000____________________________________________________________
Net sales 100.0% 100.0% 100.0%Cost of merchandise sold 75.3 76.0 74.3____________________________________________________________Gross profit 24.7 24.0 25.7
Selling, general and administrative expenses 23.1 22.9 21.3Other income, net 1.0 1.1 1.2____________________________________________________________Income from operations 2.6 2.2 5.6
Interest expense 0.2 0.3 0.3____________________________________________________________Income before income taxes 2.4% 1.9% 5.3%
2003 Store ClosingsThe Company regularly reviews under-performing stores and implements strategies designed to improve their performance. InSpring 2003, following more than two years of retail economic weakness, it was determined that a group of these under-performing stores would be unlikely to achieve profitability despite the Company’s efforts to stimulate sales. In order to improvethe quality of the Company’s portfolio of stores, management decided in April to close 13 stores in addition to the three alreadyplanned for closure in 2003 (see Notes 10 and 14 to the Financial Statements). In accordance with SFASNo. 146,“Accountingfor Costs Associated with Exit or Disposal Activities,” the estimated pretax charges that will be recorded in 2003 areapproximately $19 million to recognize the present value of store closing costs. In addition, approximately $10 million inmarkdowns will be required to liquidate inventory in those stores.
Year Ended February 1, 2003 Compared to Year Ended February 2, 2002In 2002 the Company opened 16 stores and closed four stores bringing to 265 the number of stores in operation at year-end. TheCompany revised its approach to selecting locations for new stores effective with stores opening in 2002. Prior to that time, theCompany’s principal consideration was population demographics, including data relating to income, education levels, age andoccupation. The availability of prime real estate locations, existing and potential competitors, and the number of SteinMart storesthat a market can support was also considered. The Company has since expanded its analysis to consider psychographics (such asfashion consciousness in the marketplace) as well as local area market research. The Company has also retained a third-partyconsulting firm to analyze each potential market. Finally, a committee of senior officers considers the collected data and analysis,and approves anypotential new store location. While it is too early to provide assurances, theCompany’s initial results suggest thatthis new approach will significantly improve the Company’s ability to successfully predict performance of new store locations.
Net sales of $1.409 billion were achieved for the fiscal year 2002, an increase of $88.5 million, or 6.7 percent over net sales of8
Management’s Discussion & Analysis
$1.320 billion for the fiscal year 2001. The 16 new stores opened in 2002 contributed $56.5 million to net sales. Comparablestore net sales decreased 0.8 percent from 2001.
Gross profit for 2002 was $348.5 million or 24.7 percent of net sales compared to $316.6 million or 24.0 percent of net sales for2001. The 0.7 percent increase in the gross profit percent primarily resulted from inventory control initiatives which resulted inlower markdowns, somewhat offset by higher occupancy costs as a percent of sales.
Selling, general and administrative expenses were $326.5 million or 23.1 percent of net sales for 2002, as compared to $301.9million or 22.9 percent of net sales in 2001. The 0.2 percent increase was primarily due to a lack of sales leverage slightly offset bylower pre-opening costs. Selling, general and administrative expenses include a pre-tax asset impairment charge of $2.7million in2002. As described in Note 10 to the Financial Statements, this charge reduces the carrying value of property and equipment ofthree stores that will close in 2003 and fifteen other under-performing stores to their respective estimated fair value. In 2001,selling, general and administrative expenses included a pre-tax charge of $2.9 million, including $2.2 million for lease terminationcosts and $0.7 million for asset impairments, for four stores that were closed in fiscal 2002.
Pre-opening expenses for the 16 stores opened in 2002 amounted to $3.1million and for the 30 stores opened in 2001, amountedto $5.0 million.
Other income, primarily from in-store leased shoe departments, was $14.0 million in 2002, a slight decrease from the $14.1million for 2001. In 2002, a new shoe lessee, whose offerings more closely mirror the SteinMart apparel assortment, was chosenfor approximately 60% of the stores. During the period preceding the turnover date, a decrease in shoe sales of the predecessorshoe lessee resulted in lower sublease income.
Interest expense for 2002was $2.6million, compared to $4.0million in 2001. The decrease resulted from lower average borrowingsas a result of decreased inventory levels on a per store basis, as well as lower interest rates this year compared to last year.
Net income for 2002 was $20.7 million or $0.50 per diluted share compared to net income of $15.4 million or $0.37 per dilutedshare for 2001.
Year Ended February 2, 2002 Compared to Year Ended December 30, 2000In November 2001, the Company changed its year end (see Note 1 to the Financial Statements). The following discussioncompares the 52 weeks ended February 2, 2002 to the 52 weeks ended December 30, 2000.
In 2001 the Company opened 30 stores and closed three stores bringing to 253 the number of stores in operation at year-end.
Net sales of $1.320 billion were achieved for the fiscal year 2001, an increase of $113.6 million, or 9.4 percent over net sales of$1.207 billion for the fiscal year 2000. The 30 new stores opened in 2001 contributed $74.3 million to net sales. Comparablestore net sales, which decreased 0.7 percent from 2000, began to decline in early 2001, reversing strong, double digit increasesfrom 2000. This trend continued in the fall season as shopping declined following the September 11 terrorist attacks.
Gross profit for 2001 was $316.6 million or 24.0 percent of net sales compared to $310.1 million or 25.7 percent of net sales for2000. The 1.7 percent decrease in the gross profit percent resulted primarily from higher markdowns as a percent of sales anddecreased leverage of occupancy expenses in 2001. Markdowns were particularly high during the fall season, primarily in theweeks following September 11, in order to reduce in-store inventories through promotion and markdowns.
Selling, general and administrative expenses were $301.9 million or 22.9 percent of net sales for 2001, as compared to $257.0million or 21.3 percent of net sales in 2000. In 2001, selling, general and administrative expenses included a pre-tax charge of$2.9 million for four stores that were closed in fiscal 2002. Fiscal 2000 includes a $3.4 million store closing credit related toadjustments of store closing reserves recorded in fiscal 1999.The increase of 1.6 percent of net sales is primarily due to the effectof the store closing charge and credit, increased advertising and decreased leverage of selling and administrative expenses.
Pre-opening expenses for the 30 stores opened in 2001 amounted to $5.0million and for the 22 stores opened in 2000, amountedto $3.4 million.
Other income, primarily from in-store leased shoe departments, was $14.1 million in 2001, a slight increase over the $13.8million for 2000. The increase was primarily from the additional stores operated during 2001.
Interest expense for 2001 was $4.0 million, compared to $3.3 million in 2000. The increase resulted from higher averageborrowings offset by lower interest rates during 2001 compared to 2000.The increased borrowings were used to fund operatingactivities and to repurchase common stock.
Net income for 2001 was $15.4 million or $0.37 per diluted share compared to net income of $39.4 million or $0.91 per dilutedshare for 2000.
Five-Week Transition Period Ended February 3, 2001SeeNote 12 to the Financial Statements for audited financial data for the five-week transition period of December 31,2000 throughFebruary 3, 2001. This period preceded the start of the 2001 fiscal year and no comparable period information is presented herein.
9
Stein Mart, Inc.
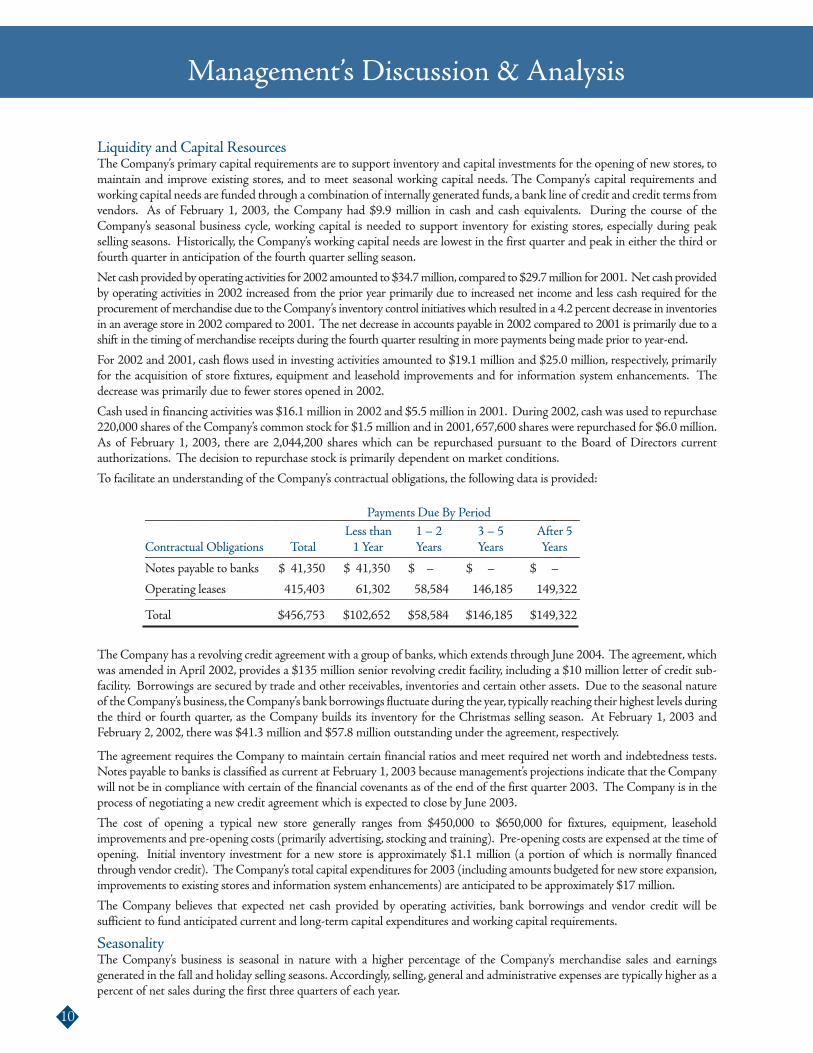
Liquidity and Capital ResourcesThe Company’s primary capital requirements are to support inventory and capital investments for the opening of new stores, tomaintain and improve existing stores, and to meet seasonal working capital needs. The Company’s capital requirements andworking capital needs are funded through a combination of internally generated funds, a bank line of credit and credit terms fromvendors. As of February 1, 2003, the Company had $9.9 million in cash and cash equivalents. During the course of theCompany’s seasonal business cycle, working capital is needed to support inventory for existing stores, especially during peakselling seasons. Historically, the Company’s working capital needs are lowest in the first quarter and peak in either the third orfourth quarter in anticipation of the fourth quarter selling season.
Net cashprovidedbyoperating activities for 2002 amounted to $34.7million, compared to $29.7million for 2001. Net cashprovidedby operating activities in 2002 increased from the prior year primarily due to increased net income and less cash required for theprocurement of merchandise due to theCompany’s inventory control initiativeswhich resulted in a 4.2 percent decrease in inventoriesin an average store in 2002 compared to 2001. The net decrease in accounts payable in 2002 compared to 2001 is primarily due to ashift in the timing of merchandise receipts during the fourth quarter resulting in more payments being made prior to year-end.
For 2002 and 2001, cash flows used in investing activities amounted to $19.1 million and $25.0 million, respectively, primarilyfor the acquisition of store fixtures, equipment and leasehold improvements and for information system enhancements. Thedecrease was primarily due to fewer stores opened in 2002.
Cash used in financing activities was $16.1 million in 2002 and $5.5 million in 2001. During 2002, cash was used to repurchase220,000 shares of the Company’s common stock for $1.5 million and in 2001,657,600 shares were repurchased for $6.0 million.As of February 1, 2003, there are 2,044,200 shares which can be repurchased pursuant to the Board of Directors currentauthorizations. The decision to repurchase stock is primarily dependent on market conditions.
To facilitate an understanding of the Company’s contractual obligations, the following data is provided:
Payments Due By Period_________________________________________________________________Less than 1 – 2 3 – 5 After 5
Contractual Obligations Total 1 Year Years Years Years_________________________________________________________________Notes payable to banks $ 41,350 $ 41,350 $ – $ – $ –
Operating leases 415,403 61,302 58,584 146,185 149,322_________________________________________________________________
Total $456,753 $102,652 $58,584 $146,185 $149,322
The Company has a revolving credit agreement with a group of banks, which extends through June 2004. The agreement, whichwas amended in April 2002, provides a $135 million senior revolving credit facility, including a $10 million letter of credit sub-facility. Borrowings are secured by trade and other receivables, inventories and certain other assets. Due to the seasonal natureof theCompany’s business, theCompany’s bank borrowings fluctuate during the year, typically reaching their highest levels duringthe third or fourth quarter, as the Company builds its inventory for the Christmas selling season. At February 1, 2003 andFebruary 2, 2002, there was $41.3 million and $57.8 million outstanding under the agreement, respectively.
The agreement requires the Company to maintain certain financial ratios and meet required net worth and indebtedness tests.Notes payable to banks is classified as current at February 1, 2003 because management’s projections indicate that the Companywill not be in compliance with certain of the financial covenants as of the end of the first quarter 2003. The Company is in theprocess of negotiating a new credit agreement which is expected to close by June 2003.
The cost of opening a typical new store generally ranges from $450,000 to $650,000 for fixtures, equipment, leaseholdimprovements and pre-opening costs (primarily advertising, stocking and training). Pre-opening costs are expensed at the time ofopening. Initial inventory investment for a new store is approximately $1.1 million (a portion of which is normally financedthrough vendor credit). TheCompany’s total capital expenditures for 2003 (including amounts budgeted for new store expansion,improvements to existing stores and information system enhancements) are anticipated to be approximately $17 million.
The Company believes that expected net cash provided by operating activities, bank borrowings and vendor credit will besufficient to fund anticipated current and long-term capital expenditures and working capital requirements.
SeasonalityThe Company’s business is seasonal in nature with a higher percentage of the Company’s merchandise sales and earningsgenerated in the fall and holiday selling seasons.Accordingly, selling, general and administrative expenses are typically higher as apercent of net sales during the first three quarters of each year.
10
Management’s Discussion & Analysis
Critical Accounting PoliciesThe preparation of the Company’s financial statements requires management to make estimates and assumptions that affect thereported amounts of assets, liabilities, expenses and related disclosure of contingent assets and liabilities. Management bases itsestimates and judgments on historical experience and other relevant factors, the results of which form the basis for makingjudgments about the carrying values of assets and liabilities that are not readily apparent from other sources. While theCompanybelieves that the historical experience and other factors considered provide a meaningful basis for the accounting policies appliedin the preparation of the financial statements, the Company cannot guarantee that its estimates and assumptions will be accurate,which could require the Company to make adjustments to these estimates in future periods. Following is a summary of themore significant accounting policies:
InventoriesMerchandise inventories are valued at the lower of average cost or market, on a first-in first-out basis, using the retail inventorymethod (RIM). RIM is an averaging method that is widely used in the retail industry. The use of RIM results in inventoriesbeing valued at the lower of cost or market as markdowns are taken as a reduction of the retail values of inventories.
Based on a review of historical markdowns, current business trends and seasonal inventory categories, additional inventoryreserves may be recorded to reflect estimated markdowns which may be required to liquidate certain inventories and reduceinventories to the lower of cost or market. Management believes its inventory valuation methods approximate the net realizablevalue of clearance inventory and result in valuing inventory at the lower of cost or market.
Long-Lived AssetsLong-lived assets are reviewed for impairment whenever events or changes in circumstances indicate that the carrying amount ofan asset may not be recoverable. Factors used in the review include management’s plans for future operations, recent operatingresults and projected cash flows. An impairment loss is recognized if the sum of the expected future undiscounted cash flowsfrom the use of the asset is less than the net book value of the assets. An impairment loss is recognized if the carrying value ofthe asset exceeds its fair value.
Insurance Reserve EstimatesThe Company uses a combination of insurance and self-insurance for various risks including workers’ compensation, generalliability and associate-related health care benefits, a portion of which is paid by the covered employees. The Company isresponsible for paying the claims that are under the insured limits. The reserves recorded for these claims are estimatedactuarially, based on claims filed and claims incurred but not reported. These reserve estimates are adjusted based upon actualclaims filed and settled. The estimated accruals for these reserves could be significantly affected if future claims differ fromhistorical trends and other actuarial assumptions.
For a complete listing of our significant accounting policies, please see Note 1 to the Company’s Financial Statements.
NewAccounting PronouncementsSFAS No. 146, “Accounting for Costs Associated with Exit or Disposal Activities,” was issued in June 2002. SFAS No. 146requires the recognition of costs associated with exit or disposal activities when they are incurred rather than at the date ofcommitment to an exit or disposal plan. The provisions of the Statement are effective for exit or disposal activities that areinitiated after December 31, 2002. TheCompany did not incur any new liability related to a disposal cost or exit activity betweenthe effective date of this statement and the end of the fiscal year on February 1, 2003. See Note 14 to the Financial Statementsregarding management’s plans to close certain under-performing stores in 2003.
SFAS No. 148, “Accounting for Stock-Based Compensation – Transition and Disclosure,” was issued in December 2002 andamends SFASNo. 123,“Accounting for Stock-Based Compensation.” This standard provides two additional alternative transitionmethods for recognizing an entity’s voluntary decision to change its method of accounting for stock-based employee compensationto the fair-valuemethod. In addition, the standard amends the disclosure requirements of SFASNo. 123 so that entities will haveto make more prominent disclosures regarding the pro forma effects of using the fair-value method of accounting for stock-basedcompensation and present those disclosures in a more accessible format in the footnotes to the annual and interim financialstatements. Amendment of the transition and annual disclosure requirements are effective for fiscal years ending afterDecember 15,2002. The additional disclosures required under SFASNo. 148 are presented in Note 8 to the Financial Statements.
Quantitative and Qualitative Disclosures about Market RiskThe Company is exposed to interest rate risk primarily through borrowings under its revolving credit facility. At February 1, 2003,direct borrowings aggregated$41.3million. The facility, as amended inApril 2002,permits debt commitmentsup to$135.0million,has a June 2004maturity date and bears interest at spreads over LIBOR. The average outstanding borrowings during fiscal 2002,2001 and 2000 were $66.0 million, $82.3 million and $48.8 million, respectively, at weighted-average interest rates of 3.9%, 4.9%and 6.7% respectively. Management believes that its exposure to market risk associated with its borrowings is not material.
11
Stein Mart, Inc.
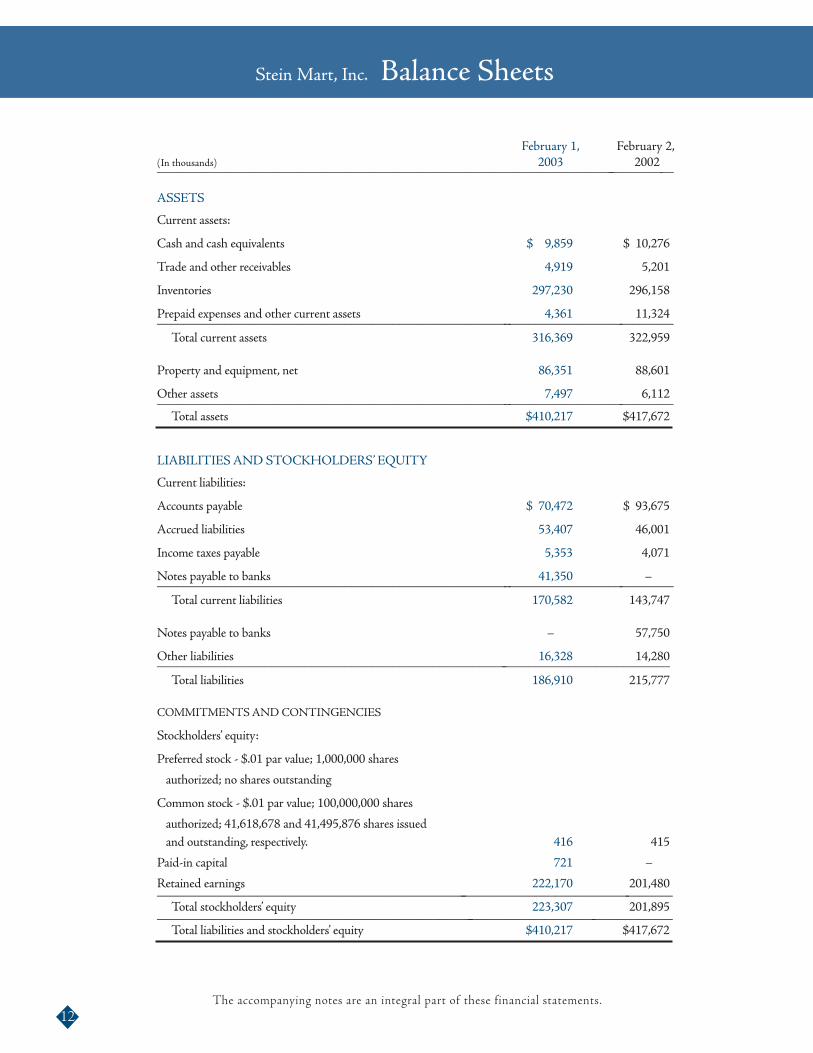
February 1, February 2,(In thousands) 2003 2002______________________________________________________________________________
ASSETS
Current assets:
Cash and cash equivalents $ 9,859 $ 10,276
Trade and other receivables 4,919 5,201
Inventories 297,230 296,158
Prepaid expenses and other current assets 4,361 11,324______________________________________________________________________________Total current assets 316,369 322,959
Property and equipment, net 86,351 88,601
Other assets 7,497 6,112______________________________________________________________________________Total assets $410,217 $417,672
LIABILITIESAND STOCKHOLDERS’ EQUITY
Current liabilities:
Accounts payable $ 70,472 $ 93,675
Accrued liabilities 53,407 46,001
Income taxes payable 5,353 4,071
Notes payable to banks 41,350 –______________________________________________________________________________Total current liabilities 170,582 143,747
Notes payable to banks – 57,750
Other liabilities 16,328 14,280_____________________________________________________________________________Total liabilities 186,910 215,777
COMMITMENTSANDCONTINGENCIES
Stockholders’ equity:
Preferred stock - $.01 par value; 1,000,000 shares
authorized; no shares outstanding
Common stock - $.01 par value; 100,000,000 shares
authorized; 41,618,678 and 41,495,876 shares issuedand outstanding, respectively. 416 415
Paid-in capital 721 –
Retained earnings 222,170 201,480______________________________________________________________________________Total stockholders’ equity 223,307 201,895______________________________________________________________________________Total liabilities and stockholders’ equity $410,217 $417,672
12
Stein Mart, Inc. Balance Sheets
The accompanying notes are an integral part of these financial statements.
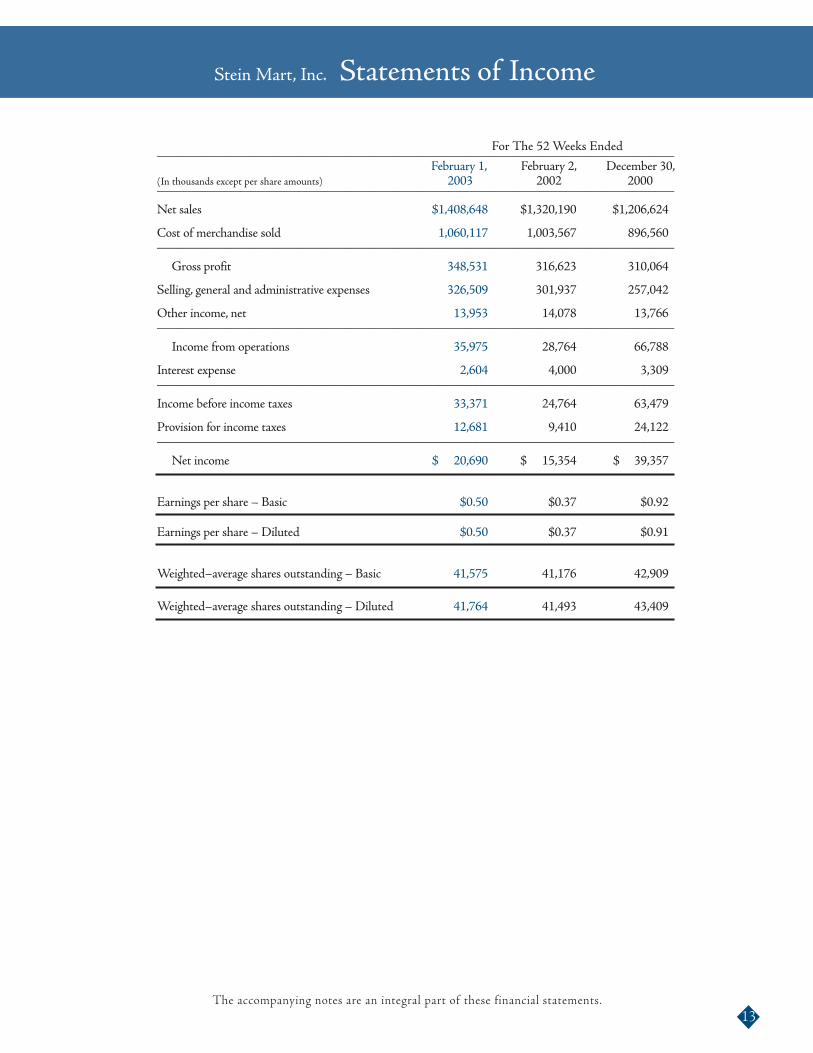
For The 52Weeks Ended_____________________________________________________________________________February 1, February 2, December 30,
(In thousands except per share amounts) 2003 2002 2000_____________________________________________________________________________
Net sales $1,408,648 $1,320,190 $1,206,624
Cost of merchandise sold 1,060,117 1,003,567 896,560_____________________________________________________________________________
Gross profit 348,531 316,623 310,064
Selling, general and administrative expenses 326,509 301,937 257,042
Other income, net 13,953 14,078 13,766_____________________________________________________________________________
Income from operations 35,975 28,764 66,788
Interest expense 2,604 4,000 3,309_____________________________________________________________________________
Income before income taxes 33,371 24,764 63,479
Provision for income taxes 12,681 9,410 24,122_____________________________________________________________________________
Net income $ 20,690 $ 15,354 $ 39,357
Earnings per share – Basic $0.50 $0.37 $0.92
Earnings per share – Diluted $0.50 $0.37 $0.91
Weighted–average shares outstanding – Basic 41,575 41,176 42,909
Weighted–average shares outstanding – Diluted 41,764 41,493 43,409
13
Stein Mart, Inc. Statements of Income
The accompanying notes are an integral part of these financial statements.
TotalCommon Paid-in Retained Stockholders’
(In thousands) Stock Capital Earnings Equity______________________________________________________________________________
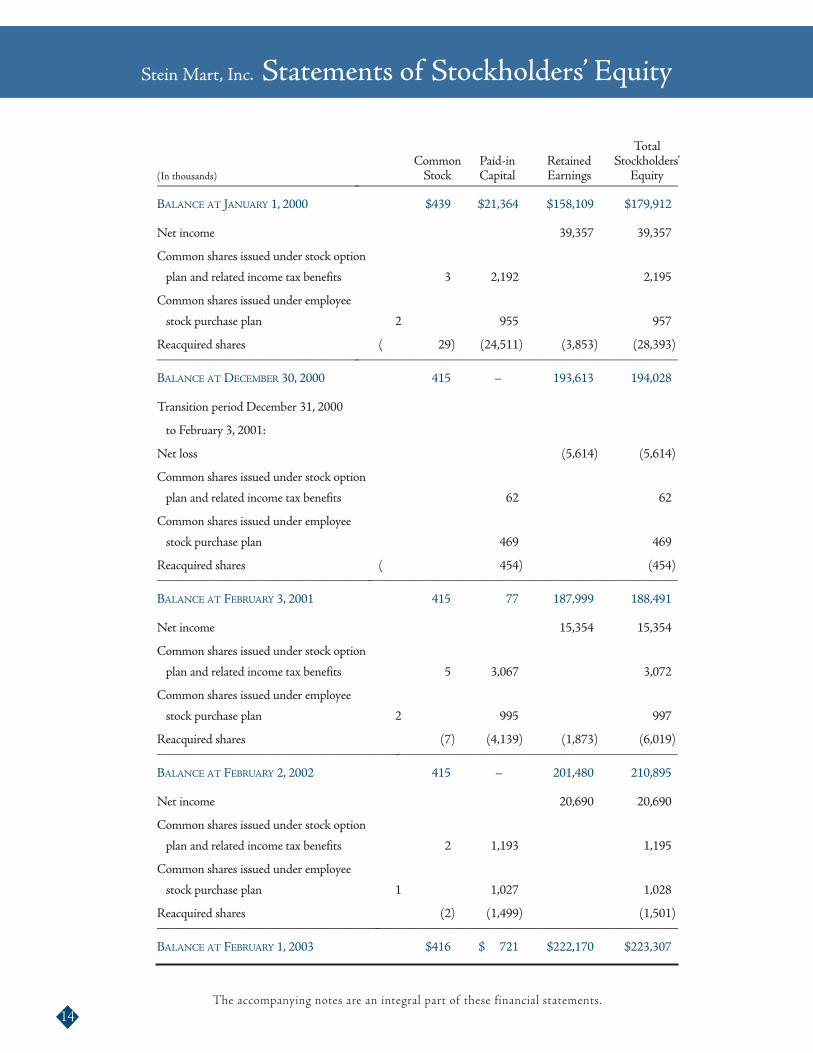
BALANCE AT JANUARY 1, 2000 $439 $21,364 $158,109 $179,912
Net income 39,357 39,357
Common shares issued under stock option
plan and related income tax benefits 3 2,192 2,195
Common shares issued under employee
stock purchase plan 2 955 957
Reacquired shares ( 29) (24,511) (3,853) (28,393)______________________________________________________________________________
BALANCE AT DECEMBER 30, 2000 415 – 193,613 194,028
Transition period December 31, 2000
to February 3, 2001:
Net loss (5,614) (5,614)
Common shares issued under stock option
plan and related income tax benefits 62 62
Common shares issued under employee
stock purchase plan 469 469
Reacquired shares ( 454) (454)______________________________________________________________________________
BALANCE AT FEBRUARY 3, 2001 415 77 187,999 188,491
Net income 15,354 15,354
Common shares issued under stock option
plan and related income tax benefits 5 3,067 3,072
Common shares issued under employee
stock purchase plan 2 995 997
Reacquired shares (7) (4,139) (1,873) (6,019)______________________________________________________________________________
BALANCE AT FEBRUARY 2, 2002 415 – 201,480 210,895
Net income 20,690 20,690
Common shares issued under stock option
plan and related income tax benefits 2 1,193 1,195
Common shares issued under employee
stock purchase plan 1 1,027 1,028
Reacquired shares (2) (1,499) (1,501)______________________________________________________________________________
BALANCE AT FEBRUARY 1, 2003 $416 $ 721 $222,170 $223,307
14
Stein Mart, Inc. Statements of Stockholders’ Equity
The accompanying notes are an integral part of these financial statements.
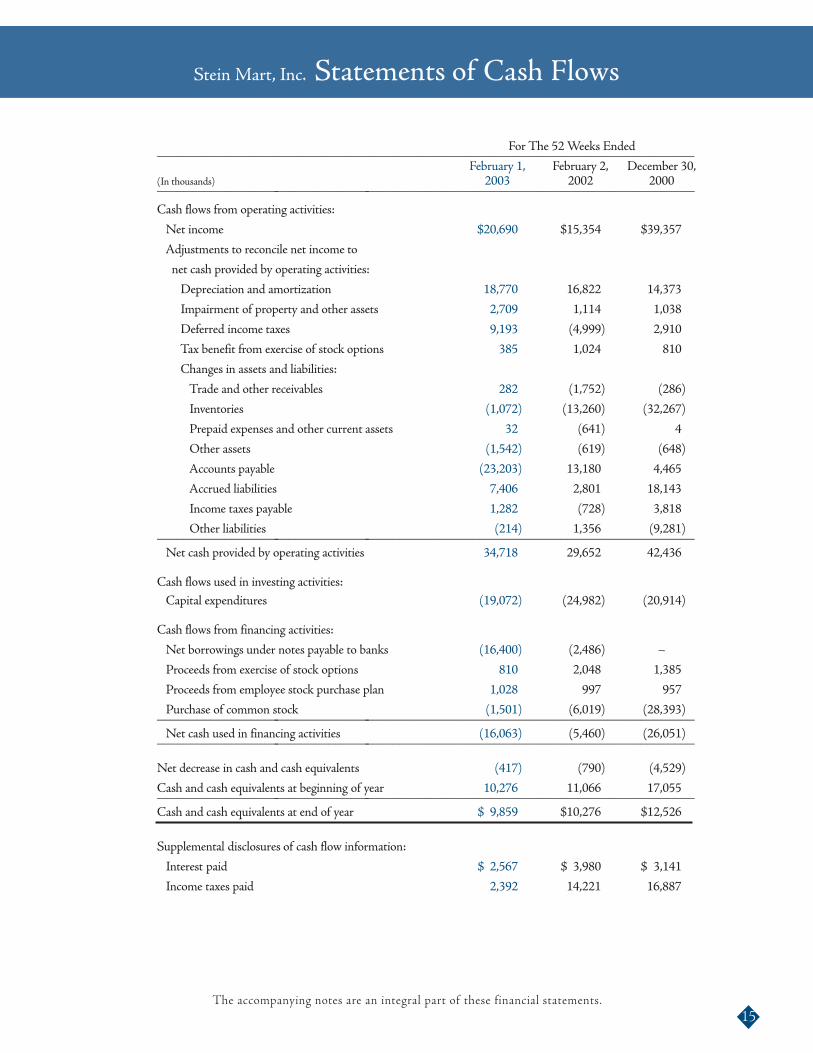
For The 52Weeks Ended________________________________________________________________________________February 1, February 2, December 30,
(In thousands) 2003 2002 2000_________________________________________________________________________________
Cash flows from operating activities:
Net income $20,690 $15,354 $39,357
Adjustments to reconcile net income to
net cash provided by operating activities:
Depreciation and amortization 18,770 16,822 14,373
Impairment of property and other assets 2,709 1,114 1,038
Deferred income taxes 9,193 (4,999) 2,910
Tax benefit from exercise of stock options 385 1,024 810
Changes in assets and liabilities:
Trade and other receivables 282 (1,752) (286)
Inventories (1,072) (13,260) (32,267)
Prepaid expenses and other current assets 32 (641) 4
Other assets (1,542) (619) (648)
Accounts payable (23,203) 13,180 4,465
Accrued liabilities 7,406 2,801 18,143
Income taxes payable 1,282 (728) 3,818
Other liabilities (214) 1,356 (9,281)_________________________________________________________________________________Net cash provided by operating activities 34,718 29,652 42,436
Cash flows used in investing activities:Capital expenditures (19,072) (24,982) (20,914)
Cash flows from financing activities:
Net borrowings under notes payable to banks (16,400) (2,486) –
Proceeds from exercise of stock options 810 2,048 1,385
Proceeds from employee stock purchase plan 1,028 997 957
Purchase of common stock (1,501) (6,019) (28,393)_________________________________________________________________________________Net cash used in financing activities (16,063) (5,460) (26,051)_________________________________________________________________________________
Net decrease in cash and cash equivalents (417) (790) (4,529)
Cash and cash equivalents at beginning of year 10,276 11,066 17,055_________________________________________________________________________________Cash and cash equivalents at end of year $ 9,859 $10,276 $12,526
Supplemental disclosures of cash flow information:
Interest paid $ 2,567 $ 3,980 $ 3,141
Income taxes paid 2,392 14,221 16,887
15
Stein Mart, Inc. Statements of Cash Flows
The accompanying notes are an integral part of these financial statements.
February 1, 2003(Dollars in tables in thousands except per share amounts)
1. Summary of Significant Accounting PoliciesAt February 1, 2003 the Company operated a chain of 265 off-price retail stores in 29 states. Each store offers women’s, men’sand children’s apparel, as well as accessories, gifts, linens and shoes.
Change in Fiscal Year EndIn November 2001, the Company changed its fiscal year end from the Saturday closest to December 31 to the Saturday closestto January 31. The five-week transition period of December 31, 2000 through February 3, 2001 (the “Transition Period”)preceded the start of the 2001 fiscal year. Audited financial information for the Transition Period is presented in Note 12.Results for 2002, 2001 and 2000 are for the 52 weeks ended February 1, 2003, February 2, 2002 and December 30, 2000,respectively.
Use of EstimatesThe preparation of financial statements in conformity with generally accepted accounting principles requires management tomake estimates and assumptions that affect the reported amounts of assets and liabilities and disclosure of contingent assetsand liabilities at the date of the financial statements and the reported amounts of revenues and expenses during the reportingperiod. Actual results could differ from those estimates.
Cash and Cash EquivalentsCash and cash equivalents include cash on hand, demand deposits and short-term investments with original maturities of threemonths or less.
InventoriesMerchandise inventories are valued at the lower of average cost or market, on a first-in first-out basis, using the retail inventorymethod.
Property and EquipmentProperty and equipment are stated at cost less accumulated depreciation and amortization. Depreciation is provided on astraight-line method using estimated useful lives of 3-10 years. Leasehold improvements are amortized over the shorter of theestimated useful lives of the improvements or the term of the lease.
Impairment of Long Lived AssetsThe Company follows Statement of Financial Accounting Standards (“SFAS”) No. 144, “Accounting for the Impairment orDisposal of Long-Lived Assets,” which requires impairment losses to be recorded on long-lived assets used in operationswhenever events or changes in circumstances indicate that the net carrying amounts may not be recoverable. An impairmentloss is recognized if the sum of the expected future undiscounted cash flows from the use of the assets is less than the net bookvalue of the assets. An impairment loss is recognized if the carrying value of the asset exceeds its fair value. Impairment reviewsare performed for individual stores. Factors used in the review include management’s plans for future operations, recentoperating results and projected cash flows. See Note 10.
Insurance ReservesThe Company uses a combination of insurance and self-insurance for various risks including workers’ compensation, generalliability and associate-related health care benefits. Claim liabilities are estimated actuarially, based on claims filed and claimsincurred but not reported.
Store Pre-Opening CostsNew store pre-opening costs are expensed as incurred.
Advertising ExpenseAdvertising costs are expensed as incurred. Advertising expenses of $52,086,000, $47,007,000, $2,256,000, and$43,092,000 are reflected in Selling, general and administrative expenses in the Statements of Income for 2002, 2001, theTransition Period and 2000, respectively.
Income TaxesDeferred income taxes reflect the net tax effects of temporary differences between the carrying amounts of assets and liabilitiesfor financial reporting purposes and the amounts used for income tax purposes.
Earnings Per ShareBasic earnings per share is computed by dividing net income by the weighted-average number of common shares outstandingfor the period. Diluted earnings per share is computed by dividing net income by the weighted-average number of commonshares outstanding plus common stock equivalents related to stock options for each period. Stock options are not included inthe diluted loss per share calculation for the Transition Period because they are anti-dilutive.
16
Notes to Financial Statements
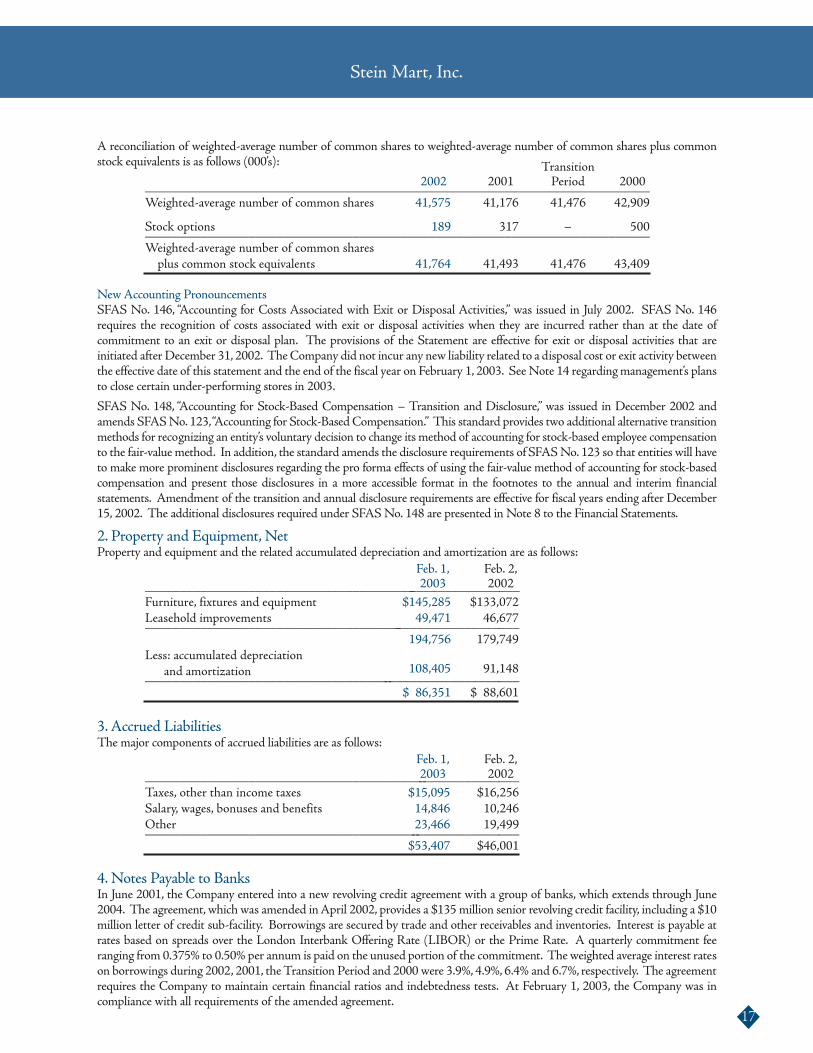
A reconciliation of weighted-average number of common shares to weighted-average number of common shares plus commonstock equivalents is as follows (000’s): Transition
2002 2001 Period 2000_________________________________________________________________________Weighted-average number of common shares 41,575 41,176 41,476 42,909
Stock options 189 317 – 500_________________________________________________________________________Weighted-average number of common sharesplus common stock equivalents 41,764 41,493 41,476 43,409
NewAccounting PronouncementsSFAS No. 146, “Accounting for Costs Associated with Exit or Disposal Activities,” was issued in July 2002. SFAS No. 146requires the recognition of costs associated with exit or disposal activities when they are incurred rather than at the date ofcommitment to an exit or disposal plan. The provisions of the Statement are effective for exit or disposal activities that areinitiated after December 31, 2002. TheCompany did not incur any new liability related to a disposal cost or exit activity betweenthe effective date of this statement and the end of the fiscal year on February 1, 2003. SeeNote 14 regardingmanagement’s plansto close certain under-performing stores in 2003.
SFAS No. 148, “Accounting for Stock-Based Compensation – Transition and Disclosure,” was issued in December 2002 andamends SFASNo. 123,“Accounting for Stock-Based Compensation.” This standard provides two additional alternative transitionmethods for recognizing an entity’s voluntary decision to change its method of accounting for stock-based employee compensationto the fair-valuemethod. In addition, the standard amends the disclosure requirements of SFASNo. 123 so that entities will haveto make more prominent disclosures regarding the pro forma effects of using the fair-value method of accounting for stock-basedcompensation and present those disclosures in a more accessible format in the footnotes to the annual and interim financialstatements. Amendment of the transition and annual disclosure requirements are effective for fiscal years ending after December15, 2002. The additional disclosures required under SFASNo. 148 are presented in Note 8 to the Financial Statements.
2. Property and Equipment, NetProperty and equipment and the related accumulated depreciation and amortization are as follows:
Feb. 1, Feb. 2,2003 2002_______________________________________________________
Furniture, fixtures and equipment $145,285 $133,072Leasehold improvements 49,471 46,677_______________________________________________________
194,756 179,749Less: accumulated depreciation
and amortization 108,405 91,148_______________________________________________________
$ 86,351 $ 88,601
3. Accrued LiabilitiesThe major components of accrued liabilities are as follows:
Feb. 1, Feb. 2,2003 2002_______________________________________________________
Taxes, other than income taxes $15,095 $16,256Salary, wages, bonuses and benefits 14,846 10,246Other 23,466 19,499_______________________________________________________
$53,407 $46,001
4. Notes Payable to BanksIn June 2001, the Company entered into a new revolving credit agreement with a group of banks, which extends through June2004. The agreement, which was amended inApril 2002, provides a $135million senior revolving credit facility, including a $10million letter of credit sub-facility. Borrowings are secured by trade and other receivables and inventories. Interest is payable atrates based on spreads over the London Interbank Offering Rate (LIBOR) or the Prime Rate. A quarterly commitment feeranging from 0.375% to 0.50% per annum is paid on the unused portion of the commitment. The weighted average interest rateson borrowings during 2002, 2001, theTransition Period and 2000 were 3.9%, 4.9%, 6.4% and 6.7%, respectively. The agreementrequires the Company to maintain certain financial ratios and indebtedness tests. At February 1, 2003, the Company was incompliance with all requirements of the amended agreement.
17
Stein Mart, Inc.

Notes payable to banks is classified as current at February 1, 2003 because management’s projections indicate that the Companywill not be in compliance with certain of the financial covenants as of the end of the first quarter 2003. The Company is in theprocess of negotiating a new credit agreement which is expected to close by June 2003.
5. Leased Facilities and CommitmentsThe Company leases all of its retail and support facilities. Annual store rent is generally comprised of a fixed minimum amountplus a contingent amount based on a percentage of sales exceeding a stipulated amount. Most leases also require additionalpayments covering real estate taxes, common area costs and insurance.
Rent expense is as follows:
Transition2002 2001 Period 2000_____________________________________________________
Minimum rental $60,805 $55,278 $4,335 $48,329Contingent rentals 678 889 52 689_____________________________________________________
$61,483 $56,167 $4,387 $49,018
At February 1, 2003, for the majority of its retail and corporate facilities, the Company was committed under noncancellableleases with remaining terms of up to 15 years. Future minimum payments under noncancellable leases are:
2003 $ 61,3022004 58,5842005 53,9902006 48,6412007 43,554Thereafter 149,332__________________________
$415,403
During all periods presented, the Company subleased the space for shoe and fragrance departments in all of its stores. As ofMarch 2003, the Company owns and operates the fragrance department. Sales from leased departments are excluded from salesof the Company. Sublease rental income of $12,519,000, $12,610,000, $752,000 and $12,710,000 is included in Otherincome, net in the Statements of Income for 2002, 2001, the Transition Period and 2000, respectively.
6. Income TaxesThe income tax provision (benefit) is as follows:
Transition2002 2001 Period 2000_____________________________________________________________
Current:Federal $ 3,212 $13,271 $(3,387) $19,537State 276 1,138 (290) 1,675_____________________________________________________________Total 3,488 14,409 (3,677) 21,212_____________________________________________________________
Deferred:Federal 8,467 (4,604) 217 2,680State 726 (395) 19 230_____________________________________________________________Total 9,193 (4,999) 236 2,910_____________________________________________________________
Income tax provision (benefit) $12,681 $ 9,410 $(3,441) $24,122
18
Notes to Financial Statements

Income tax expense (benefit) differed from the amounts computed by applying the federal statutory rate of 35 percent to incomebefore taxes as follows:
Transition2002 2001 Period 2000____________________________________________________________________
Federal tax at the statutory rate $11,680 $8,667 $(3,169) $22,218State income taxes, net of federal benefit 1,001 743 (272) 1,904____________________________________________________________________
$12,681 $9,410 $ (3,441) $24,122
Effective income tax rate 38.0% 38.0% 38.0% 38.0%
Temporary differences, which give rise to deferred tax assets and liabilities, are as follows:
Feb. 1, Feb. 2,2003 2002__________________________________________________
Deferred tax assets:NOL carryforward $ – $ 5,417Store closing and asset impairmentreserves 3,162 2,158
Accrued liabilities 3,368 2,012Other 1,082 2,034__________________________________________________
7,612 11,621__________________________________________________Deferred tax liabilities:Depreciation 14,248 12,019Inventory 3,060 –Other 1,931 2,036__________________________________________________
19,239 14,055__________________________________________________
Net deferred tax liability $(11,627) $(2,434)
At February 2, 2002, the Company had approximately $14million in federal and state net operating loss (“NOL”) carryforwards,which were fully utilized in 2002. The NOL carryforwards were generated in the five-week tax period ended February 2, 2002which resulted from the Company’s change in fiscal year (see Note 1).
On March 14, 2002, the Internal Revenue Service released new rules (Rev. Proc. 2002-19), which allowed the Company anaccelerated deduction of certain components of the Company’s deferred tax asset relating to inventories. As a result, theCompany’s income tax payable and the corresponding deferred tax asset as of February 2, 2002 relating to inventories werereduced by $3.8 million in the first quarter of fiscal 2002.
Deferred tax assets and liabilities are reflected on the Company’s Balance Sheets as follows:
Feb. 1, Feb. 2,2003 2002___________________________________________________
Current deferred tax assets (includedin Prepaid expenses and othercurrent assets) $ 196 $ 7,127
Non-current deferred tax liabilities(included in Other liabilities) (11,823) (9,561)___________________________________________________
Net deferred tax liabilities $(11,627) $(2,434)
The exercise of certain stock optionswhich have been granted under theCompany’s stock option plans gives rise to compensationwhich is includable in the taxable income of the applicable employees and deductible by theCompany for federal and state incometax purposes. Such compensation results from increases in the market value of the Company’s common stock subsequent to thedate of grant of the applicable exercised stock options, and in accordance withAccounting Principles BoardOpinionNo. 25, suchcompensation is not recognized as an expense for financial accounting purposes and the related tax benefits are recorded directlyin Paid-in capital.
19
Stein Mart, Inc.
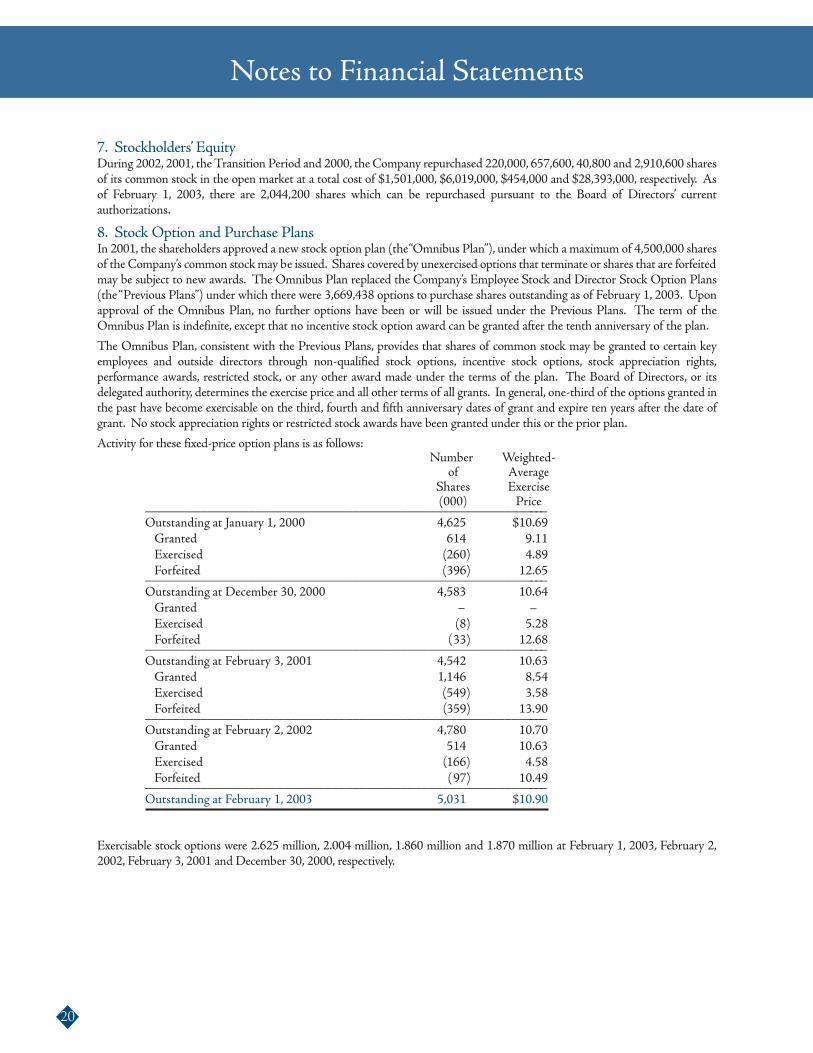
7. Stockholders’ EquityDuring 2002, 2001, theTransition Period and 2000, the Company repurchased 220,000, 657,600, 40,800 and 2,910,600 sharesof its common stock in the open market at a total cost of $1,501,000, $6,019,000, $454,000 and $28,393,000, respectively. Asof February 1, 2003, there are 2,044,200 shares which can be repurchased pursuant to the Board of Directors’ currentauthorizations.
8. Stock Option and Purchase PlansIn 2001, the shareholders approved a new stock option plan (the“Omnibus Plan”), under which a maximum of 4,500,000 sharesof the Company’s common stockmay be issued. Shares covered by unexercised options that terminate or shares that are forfeitedmay be subject to new awards. The Omnibus Plan replaced the Company’s Employee Stock and Director Stock Option Plans(the“Previous Plans”) under which there were 3,669,438 options to purchase shares outstanding as of February 1, 2003. Uponapproval of the Omnibus Plan, no further options have been or will be issued under the Previous Plans. The term of theOmnibus Plan is indefinite, except that no incentive stock option award can be granted after the tenth anniversary of the plan.
The Omnibus Plan, consistent with the Previous Plans, provides that shares of common stock may be granted to certain keyemployees and outside directors through non-qualified stock options, incentive stock options, stock appreciation rights,performance awards, restricted stock, or any other award made under the terms of the plan. The Board of Directors, or itsdelegated authority, determines the exercise price and all other terms of all grants. In general, one-third of the options granted inthe past have become exercisable on the third, fourth and fifth anniversary dates of grant and expire ten years after the date ofgrant. No stock appreciation rights or restricted stock awards have been granted under this or the prior plan.
Activity for these fixed-price option plans is as follows:Number Weighted-
of AverageShares Exercise(000) Price___________________________________________________________
Outstanding at January 1, 2000 4,625 $10.69Granted 614 9.11Exercised 260) 4.89Forfeited 396) 12.65___________________________________________________________
Outstanding at December 30, 2000 4,583 10.64Granted –Exercised (8) 5.28Forfeited 33) 12.68___________________________________________________________
Outstanding at February 3, 2001 4,542 10.63Granted ,146 8.54Exercised 549) 3.58Forfeited 359) 13.90___________________________________________________________
Outstanding at February 2, 2002 4,780 10.70Granted 514 10.63Exercised 166) 4.58Forfeited 97) 10.49___________________________________________________________
Outstanding at February 1, 2003 5,031 $10.90
Exercisable stock options were 2.625 million, 2.004 million, 1.860 million and 1.870 million at February 1, 2003, February 2,2002, February 3, 2001 and December 30, 2000, respectively.
20
Notes to Financial Statements
–
((
(
((
((
1

The following table summarizes information about fixed-price stock options outstanding at February 1, 2003:
Options Outstanding Options Exercisable____________________________________ ____________________Weighted-Average Weighted- Weighted-
Range of Number Remaining Average Number AverageExercise Outstanding Contractual Exercise Exercisable ExercisePrices (000) Life (Years) Price (000) Price____________________________________________________________________________
$ 2.50– 5.75 453 5.5 $ 5.58 159 $ 5.62$ 6.53– 9.63 1,656 7.2 8.09 348 7.91$10.00–13.81 2,387 5.3 12.86 1,738 13.47$14.25–16.59 535 5.2 15.31 380 15.15__________________________________________________________
5,031 5.9 $10.90 2,625 $12.50
The Company has adopted the disclosure-only provisions of SFAS No. 123, as amended by SFAS No. 148, “Accounting forStock-Based Compensation,” and intends to retain the intrinsic value method of accounting for stock-based compensation whichit currently uses. Accordingly, no compensation cost has been recognized for the stock option plans. Had compensation cost ofthe Company’s stock option plans been determined consistent with the provisions of SFASNo. 123, the Company’s net income(loss) and earnings (loss) per share would have been reduced to the following pro forma amounts:
Transition2002 2001 Period 2000________________________________________________________________________
Net income (loss) – as reported $20,690 $15,354 $(5,614) $39,357Stock option compensation– net of tax 1,741 2,087 179 2,891________________________________________________________________________Net income (loss) – pro forma $18,949 $13,267 (5,793) $36,466
Basic earnings (loss) per share– as reported $0.50 $0.37 $(0.14) $0.92Diluted earnings (loss) per share– as reported 0.50 0.37 (0.14) 0.91
Basic earnings (loss) per share– pro forma $0.46 $0.32 $(0.14) $0.85Diluted earnings (loss) per share– pro forma 0.45 0.32 (0.14) 0.84
The effects of applying this Statement for pro forma disclosures are not likely to be representative of the effects on reportednet income for future years, because options vest over several years and additional awards are made each year.No options weregranted during the Transition Period. In determining the pro forma compensation cost, the weighted-average fair value ofoptions granted during fiscal 2002, 2001 and 2000 was estimated to be $5 using the Black-Scholes options pricing model.The following weighted-average assumptions were used for grants made during 2002, 2001 and 2000: dividend yield of 0.0%,expected volatility of 51.9%, 51.7% and 51.1%, respectively, risk-free interest rate of 3.8%, 4.8% and 5.2%, respectively andexpected lives of 5.0, 7.0 and 7.0 years, respectively.
The Company has an Employee Stock Purchase Plan (the “Stock Purchase Plan”) whereby all employees who complete sixmonths employment with the Company and who work on a full-time basis or are regularly scheduled to work more than 20hours per week are eligible to participate in the Stock Purchase Plan. Participants in the Stock Purchase Plan are permittedto use their payroll deductions to acquire shares at 85% of the fair market value of the Company’s stock determined at eitherthe beginning or end of each option period. In 2002, 2001, theTransition Period and 2000, the participants acquired 173,048shares, 127,220 shares, 53,856 shares and 198,051 shares of the Company’s common stock at weighted average per-shareprices of $5.94, $7.84, $8.71 and $4.83 per share, respectively.
On May 7, 2001, the shareholders approved an amendment to the Stock Purchase Plan, increasing the number of shareseligible for issuance under the Plan by 1,000,000 and extending the Plan until December 31, 2005.
9. Employee Benefit PlansThe Company has a defined contribution retirement plan covering employees who are at least 21 years of age, havecompleted at least one year of service and who work at least 1,000 hours annually. Under the profit sharing portion of theplan, the Company makes discretionary contributions, which vest at a rate of 20 percent per year after two years of service.Under the 401(k) portion of the plan, the Company matches 50 percent of the employee’s voluntary pre-tax contributions
21
Stein Mart, Inc.
up to a maximum of four percent of the employee’s compensation.The Company’s matching portion vests in accordance withthe plan’s vesting schedule. Total Company contributions under the retirement plan were $1,627,000, $1,571,000, $66,000and $1,750,000 for 2002, 2001, the Transition Period and 2000, respectively.
The Company has an executive split dollar life insurance plan wherein eligible executives are provided with pre-retirementlife insurance protection based upon three to five times base salary. Upon retirement, the executive is provided with lifeinsurance protection based upon one and one-half to two and one-half times final base salary. The expense for this plan was$331,000, $293,000 and $248,000 in 2002, 2001 and 2000, respectively. There was no expense recorded during theTransition Period.
The Company also has an executive deferral plan providing officers and key executives with the opportunity to participatein an unfunded, deferred compensation program. Effective November 1, 2002, the plan was amended to include director-level employees. Under the program, participants may defer up to 100% of their base compensation and bonuses earned.The Company will match the officers and key executives’ contributions 100%, and the directors’ contributions 50%, up tothe first 10% of income deferred. A participant’s Company matching contributions and related investment earnings are 20%vested after four years of participation in the plan and increase 20% per year through the eighth year, at which time aparticipant is fully vested. The total of participant deferrals, which is reflected in Accrued liabilities, was $1,223,000 atFebruary 1, 2003, $814,000 at February 2, 2002 and $402,000 at February 3, 2001.The expense for this plan was $611,000,$495,000, $25,000 and $486,000 in 2002, 2001, the Transition Period and 2000, respectively.
In connection with the above two plans, whole life insurance contracts were purchased on the related participants. AtFebruary 1, 2003 and February 2, 2002 the cash surrender value of these policies was $3,132,000 and $2,773,000,respectively, and is included in Other assets.
10. Store Closing Charges and Impairment of Long-Lived AssetsIn April 2003 the Company decided to close 13 additional under-performing stores in 2003. See Note 14.
During the fourth quarter of 2002, management approved a plan to close three stores in 2003. The Company does not expectto incur significant lease exit costs upon closing these stores. However, a pretax non-cash asset impairment charge of $2.7millionwas recorded during the fourth quarter of 2002 to reduce the carrying value of property and equipment of these three closingstores and fifteen other under-performing stores to their respective estimated fair value.The estimated future undiscounted cashflows from the under-performing stores are not expected to exceed the current net book value of their property and equipment.This charge is included in Selling, general and administrative expenses in the Statement of Income for 2002.
During the fourth quarter of 2001, the Company recorded a pre-tax charge of $2.9 million, including $2.2 million for theestimated cost of lease terminations and $0.7 million for the impairment of certain property and equipment for four storesthat were closed in 2002. The charge is included in Selling, general and administrative expenses in the Statement of Incomefor 2001.
During 2000, the Company recorded a net pre-tax credit of $3.4 million related to certain store closing reserves recorded in1999. The credit resulted from adjustments to estimated lease obligations for changes in anticipated closing dates and forfavorable lease settlements ($2.5 million), unsatisfactory lease negotiations to close two stores ($1.9 million), offset by a $1.0million charge for the write-down of furniture, fixtures and equipment related to store closings. The store closing credit isincluded in Selling, general and administrative expenses in the Statement of Income for 2000.
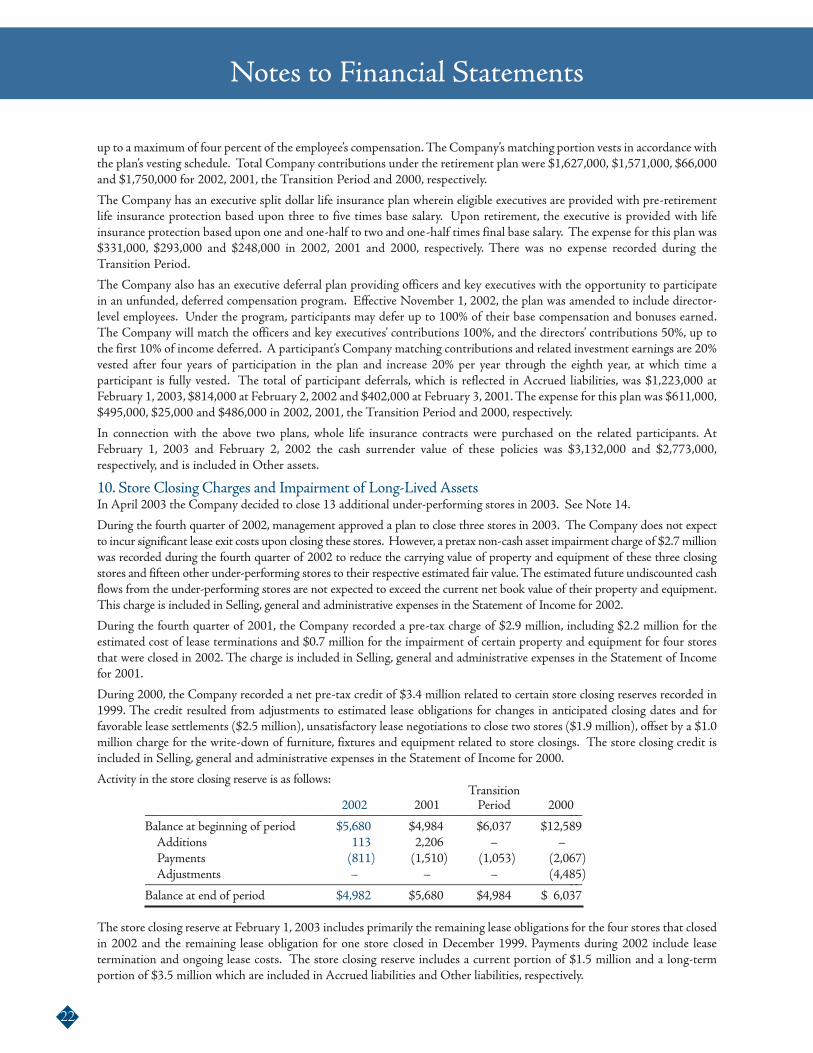
Activity in the store closing reserve is as follows:Transition
2002 2001 Period 2000_________________________________________________________________Balance at beginning of period $5,680 $4,984 $6,037 $12,589Additions 113 2,206 – –Payments (811) (1,510) (1,053) (2,067)Adjustments – – – (4,485)_________________________________________________________________
Balance at end of period $4,982 $5,680 $4,984 $ 6,037
The store closing reserve at February 1, 2003 includes primarily the remaining lease obligations for the four stores that closedin 2002 and the remaining lease obligation for one store closed in December 1999. Payments during 2002 include leasetermination and ongoing lease costs. The store closing reserve includes a current portion of $1.5 million and a long-termportion of $3.5 million which are included in Accrued liabilities and Other liabilities, respectively.
22
Notes to Financial Statements
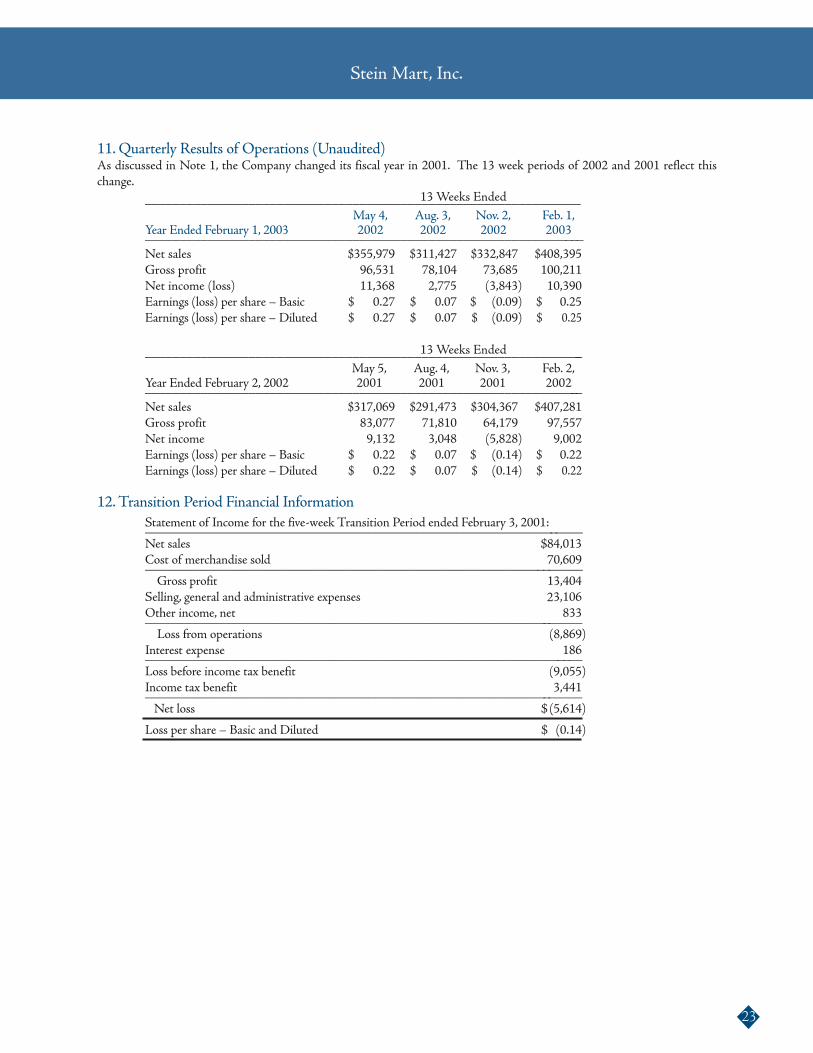
11. Quarterly Results of Operations (Unaudited)As discussed in Note 1, the Company changed its fiscal year in 2001. The 13 week periods of 2002 and 2001 reflect thischange.
13Weeks Ended_______________________________________________________________May 4, Aug. 3, Nov. 2, Feb. 1,
Year Ended February 1, 2003 2002 2002 2002 2003________________________________________________________________Net sales $355,979 $311,427 $332,847 $408,395Gross profit 96,531 78,104 73,685 100,211Net income (loss) 11,368 2,775 (3,843) 10,390Earnings (loss) per share – Basic $ 0.27 $ 0.07 $ (0.09) $ 0.25Earnings (loss) per share – Diluted $ 0.27 $ 0.07 $ (0.09) $ 0.25
13Weeks Ended________________________________________________________________May 5, Aug. 4, Nov. 3, Feb. 2,
Year Ended February 2, 2002 2001 2001 2001 2002________________________________________________________________Net sales $317,069 $291,473 $304,367 $407,281Gross profit 83,077 71,810 64,179 97,557Net income 9,132 3,048 (5,828) 9,002Earnings (loss) per share – Basic $ 0.22 $ 0.07 $ (0.14) $ 0.22Earnings (loss) per share – Diluted $ 0.22 $ 0.07 $ (0.14) $ 0.22
12.Transition Period Financial InformationStatement of Income for the five-week Transition Period ended February 3, 2001:_________________________________________________________________Net sales $84,013Cost of merchandise sold 70,609_________________________________________________________________Gross profit 13,404
Selling, general and administrative expenses 3,106Other income, net 833_________________________________________________________________Loss from operations (8,869)
Interest expense 186_________________________________________________________________Loss before income tax benefit (9,055)Income tax benefit 3,441_________________________________________________________________Net loss $ (5,614)
Loss per share – Basic and Diluted $ (0.14)
23
Stein Mart, Inc.
2
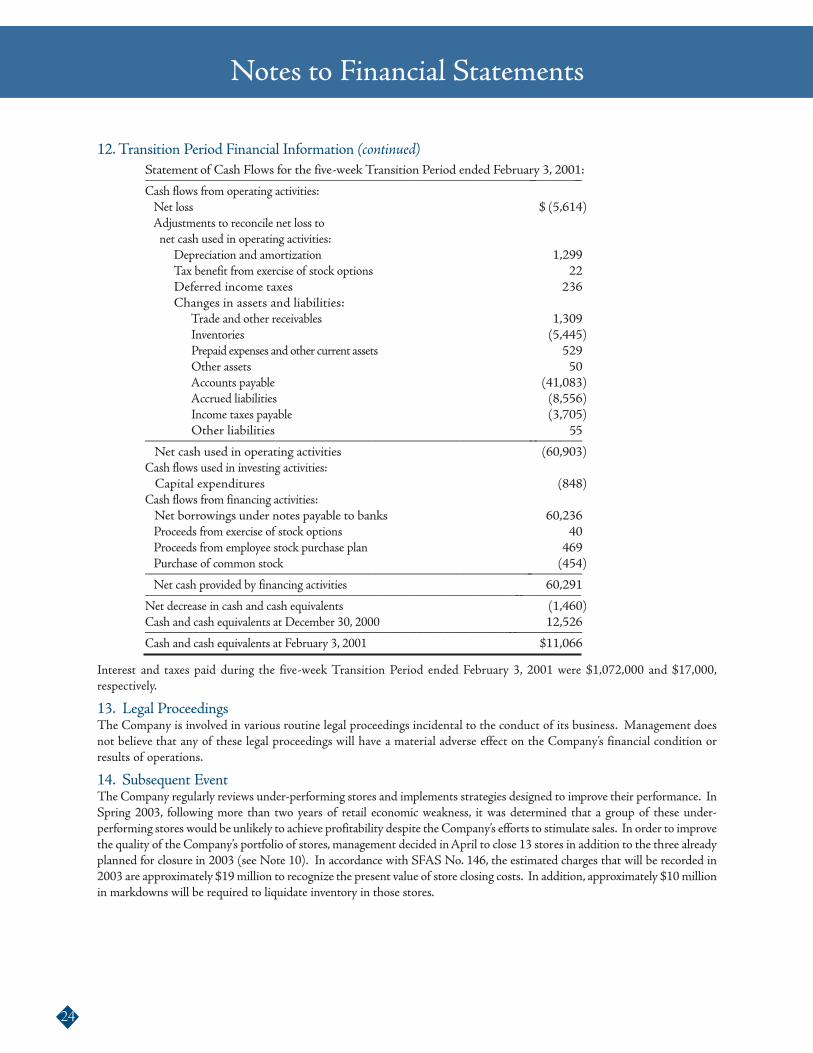
12.Transition Period Financial Information (continued)Statement of Cash Flows for the five-week Transition Period ended February 3, 2001:_______________________________________________________________Cash flows from operating activities:Net loss $ (5,614)Adjustments to reconcile net loss tonet cash used in operating activities:
Depreciation and amortization 1,299Tax benefit from exercise of stock options 22Deferred income taxes 36Changes in assets and liabilities:
Trade and other receivables 1,309Inventories (5,445)Prepaid expenses and other current assets 529Other assets 50Accounts payable (41,083)Accrued liabilities (8,556)Income taxes payable (3,705)Other liabilities 5_________________________________________________________________
Net cash used in operating activities (60,903)Cash flows used in investing activities:Capital expenditures (848)
Cash flows from financing activities:Net borrowings under notes payable to banks 60,236Proceeds from exercise of stock options 40Proceeds from employee stock purchase plan 469Purchase of common stock (454)_________________________________________________________________Net cash provided by financing activities 60,291_________________________________________________________________
Net decrease in cash and cash equivalents (1,460)Cash and cash equivalents at December 30, 2000 12,526_________________________________________________________________Cash and cash equivalents at February 3, 2001 $11,066
Interest and taxes paid during the five-week Transition Period ended February 3, 2001 were $1,072,000 and $17,000,respectively.
13. Legal ProceedingsThe Company is involved in various routine legal proceedings incidental to the conduct of its business. Management doesnot believe that any of these legal proceedings will have a material adverse effect on the Company’s financial condition orresults of operations.
14. Subsequent EventThe Company regularly reviews under-performing stores and implements strategies designed to improve their performance. InSpring 2003, following more than two years of retail economic weakness, it was determined that a group of these under-performing stores would be unlikely to achieve profitability despite the Company’s efforts to stimulate sales. In order to improvethe quality of the Company’s portfolio of stores,management decided inApril to close 13 stores in addition to the three alreadyplanned for closure in 2003 (see Note 10). In accordance with SFAS No. 146, the estimated charges that will be recorded in2003 are approximately $19million to recognize the present value of store closing costs. In addition, approximately $10millionin markdowns will be required to liquidate inventory in those stores.
24
Notes to Financial Statements
2
5


Corporate headquartersStein Mart, Inc.1200 Riverplace BoulevardJacksonville, FL 32207(904) 346-1500www.steinmart.com
Annual meeting of stockholdersThe annual meeting of stockholders will be held attwo o’clock in the afternoon, Monday, June 9, 2003 atThe Cummer Gallery of Art and Gardens,Jacksonville, Florida.
Transfer Agent and RegistrarMellon Investor Services LLCP. O. Box 3315South Hackensack, NJ 07606-19151-800-756-3353www.melloninvestor.com
Legal CounselMitchell W. LeglerKirschner & Legler, P.A.300AWharfsideWayJacksonville, Florida 32207
Independent AuditorsPricewaterhouseCoopers LLPJacksonville, Florida
Common stock informationStein Mart’s common stock trades on The Nasdaq StockMarket® under the trading symbol SMRT. On April 11,2003, there were 1,135 stockholders of record.
The following table reflects the high and low salesprices of the common stock for each fiscal quarter in2001 and 2002.
Stock prices by quarterQuarter ending dates High Low
May 5, 2001 $ 12.31 $ 8.69
August 4, 2001 $ 12.47 $ 7.85
November 3, 2001 $ 9.08 $ 6.12
February 2, 2002 $ 9.20 $ 7.96
May 4, 2002 $ 12.12 $ 8.74
August 3, 2002 $ 12.32 $ 6.89
November 2, 2002 $ 8.75 $ 5.37
February 1, 2003 $ 7.85 $ 5.20
The Company intends to reinvest future earnings in thebusiness and accordingly does not anticipate payingdividends in the foreseeable future.
Financial informationCopies of the Annual Report, Form 10-K and otherfinancial reports are available without charge by writtenrequest to: Stockholder Relations, Stein Mart, Inc.,1200 Riverplace Boulevard, Jacksonville, FL 32207.
Current and past news releases, all SEC filings, currentstock price and stock history are available on line atwww.steinmart.com; click on Investor Relations.
Investor and Media InquiriesIf you are a member of the financial community or thenews media and need to address specific financialinformation, please call Susan Datz Edelman,Director of Stockholder Relations, at (904) 346-1506.
27
Stein Mart, Inc. Stockholder Information