metabolic engineering of saccharomyces cerevisiae...
TRANSCRIPT
General rights Copyright and moral rights for the publications made accessible in the public portal are retained by the authors and/or other copyright owners and it is a condition of accessing publications that users recognise and abide by the legal requirements associated with these rights.
• Users may download and print one copy of any publication from the public portal for the purpose of private study or research. • You may not further distribute the material or use it for any profit-making activity or commercial gain • You may freely distribute the URL identifying the publication in the public portal
If you believe that this document breaches copyright please contact us providing details, and we will remove access to the work immediately and investigate your claim.
Downloaded from orbit.dtu.dk on: May 02, 2018
Metabollic Engineering of Saccharomyces Cereviae a,omi acid metabolism forproduction of products of industrial interest
Chen, Xiao; Kielland-Brandt, Morten; Karhumaa, Kaisa; Nielsen, Jens
Publication date:2011
Document VersionPublisher's PDF, also known as Version of record
Link back to DTU Orbit
Citation (APA):Chen, X., Kielland-Brandt, M., Karhumaa, K., & Nielsen, J. (2011). Metabollic Engineering of SaccharomycesCereviae a,omi acid metabolism for production of products of industrial interest. Kgs. Lyngby, Denmark:Technical University of Denmark (DTU).
Xiao ChenPh.D. ThesisJune 2011
Metabolic engineering of Saccharomyces cerevisiae amino acid metabolism for production of chemicals of industrial interest
TitelN
avn Efternavn
Center for Microbial BiotechnologyDepartment of Systems Biology

Metabolic engineering of Saccharomyces cerevisiae amino acid metabolism for
production of chemicals of industrial interest
Ph.D. thesis
Xiao Chen
Center for Microbial Biotechnology
Department of Systems Biology
Technical University of Denmark
2011

2

Metabolic engineering af aminosyrestofskiftet hos Saccharomyces cerevisiae for produktion
af kemikalier af industriel interesse
Ph.D.-afhandling
Xiao Chen
Center for Mikrobiel Bioteknologi
Institut for Systembiologi
Danmarks Tekniske Universitet
2011
3

Copyright©: Xiao Chen
June 2011
Address: Center for Microbial Biotechnology
Department of Systems Biology
Technical University of Denmark
Building 223
DK-2800 Kgs. Lyngby
Denmark
Phone: +45 4525 2693
Fax: +45 4588 4148
Web: www.cmb.dtu.dk
Print: J&R Frydenberg A/S
København
September 2011
ISBN: 978-87-9149499-4
4
This Ph.D. project is funded by the Technical University of Denmark. It started in December
of 2006 with Professor Jens Nielsen as main supervisor and PostDoc Verena Siewers as
cosupervisor. In January of 2009 the project was reformulated. From January of 2009 to
March of 2011, Professor Morten C. Kielland-Brandt acted as main supervisor and Professor
Jens Nielsen and Assistant Professor Kaisa Karhumaa as cosupervisors.
5

6
Preface
I
Preface
This dissertation presents the results of my Ph.D. study carried out at the Center for
Microbial Biotechnology (CMB), Department of Systems Biology, Technical
University of Denmark, in the period from December 2006 to March 2011.
I am indebted to various people who have made my study in the center a highly joyful
and inspiring time. First of all, I would like to thank my supervisors Professor Morten
C. Kielland-Brandt and Assistant Professor Kaisa Karhumaa, for their guidance and
encouragement in solving various problems in my research. I am also grateful to
Professor Jens Nielsen and Postdoc Verena Siewers, who supervised me in the first
part of my Ph.D. thesis.
Various colleagues have helped me throughout my research. I would particularly
thank Irina Borodina for invaluable discussions and inspiration on my research. Jesper
Mogensen and Jette Jepmond Mortensen have provided crucial technical assistance in
my experimental work. Michael Rørdam Andersen has provided invaluable help in
the modelling part of this work.
I would also like to acknowledge Technical University of Denmark for providing the
scholarship and S.C. Van Foundation, Denmark for financing part of my Ph.D. study.
Finally, I wish to thank my family for their support and encouragement throughout
my work, which has been beyond words.
Copenhagen, March 2011
Xiao Chen
7

Preface
II
8

Summary
III
Summary
Saccharomyces cerevisiae is widely used in microbial production of chemicals,
metabolites and proteins, mainly because genetic manipulation of S. cerevisiae is
relatively easy and experiences from its wide application in the existing industrial
fermentations directly benefit new S. cerevisiae-based processes. This study has
focused on metabolic engineering of the amino acid metabolism in S. cerevisiae for
production of two types of chemicals of industrial interest.
The first chemical is δ-(L-α-aminoadipyl)–L-cysteinyl–D-valine (LLD-ACV). ACV
belongs to non-ribosomal peptides (NRPs), which are synthesized by specific peptide
synthetases and have a broad range of biological and pharmacological properties. Due
to the scarcity of the production of NRPs in nature and the difficulties in their
chemical synthesis, it was initiated here to develop S. cerevisiae as a platform for
microbial production of one type of NRPs – ACV. Production of ACV was achieved
by introducing the Penicillium chrysogenum gene pcbAB, which encodes ACV
synthetase (ACVS), and the Aspergillus nidulans gene npgA, which encodes
phosphopantetheinyl transferase (PPTase) required for activation of ACVS, into S.
cerevisiae on a high-copy plasmid. Several possible factors that could improve ACV
production were investigated. Lowering the cultivation temperature from 30 to 20 oC
led to a 30-fold enhancement. The ACVS and PPTase encoding genes were also
integrated into the yeast genome.
The second chemical is isobutanol, which is regarded as an important next generation
biofuel. As a substitute for liquid fossil fuels, isobutanol is better than ethanol due to
its higher energy density, lower hygroscopicity and lower vapor pressure. Isobutanol
is also better than its isomer n-butanol due to a higer octane number. In this study, by
simultaneous overexpression of biosynthetic genes ILV2, ILV3, and ILV5 in valine
metabolism in S. cerevisiae, the isobutanol yield was improved from 0.16 to 0.97 mg
per g glucose in anaerobic fermentation in mineral medium. Isobutanol yield was
further improved by two times by the additional overexpression of BAT2. Additional
9

Summary
IV
overexpression of ILV6 in the ILV2 ILV3 ILV5 overexpression strain decreased
isobutanol production yield by three times.
The stoichiometric genome-scale model of S. cerevisiae was applied to find genetic
manipulation targets. The BioOpt software was used for in silico cell metabolism
simulation. A reasonable agreement was obtained between the experimental data and
the in silico simulation results. Through the application of single gene overexpression
and deletion options of BioOpt in the overexpression strain ILV2356_XCY605,
several target genes are suggested for further overexpression or deletion.
10

Dansk sammenfatning
V
Dansk sammenfatning
Saccharomyces cerevisiae (bagegær) anvendes til mikrobiel fremstilling af en bred
palet af produkter, eksempelvis kemikalier, metabolitter og proteiner. Den brede
anvendelse skyldes hovedsageligt, at genmanipulation af S. cerevisiae er forholdsvist
enkelt, samt at erfaringen fra eksisterende processer kan direkte udnyttes i nye
processer baseret på S. cerevisiae. Nærværende studie fokuserer på manipulation af
mikroorganismens omsætning af aminosyrer for at opnå produktion af to kemikalier
med industriel anvendelse.
Det første stof er δ-(L-α-aminoadipyl)-L-cysteinyl-D-valin (LLD-ACV). ACV
tilhører de non-ribosomale peptider (NRPer), der syntetiseres af en særlig klasse af
peptid synthetaser. NRPer har beviseligt en lang række biologiske og farmakologiske
aktiviteter. Grundet den lave koncentration af de enkelte NRPer i de naturlige
processer og det faktum at kemisk syntese af disse stoffer er meget udfordrende, er
det her blevet søgt at udvikle S. cerevisiae som en platform til produktion af én slags
NRP: ACV. ACV-produktion i S. cerevisiae blev opnået ved at indsætte pcbAB-genet
fra Penicillium chrysogenum, der koder for ACV synthetase (ACVS), og npgA-genet
fra Aspergillus nidulans, som koder for phosphopantetheinyl transferase (PPTase).
PPTase er nødvendigt for aktiveringen af ACVS. Begge gener blev overført til S.
cerevisiae ved hjælp af et plasmid med højt kopi-tal. Et antal faktorer, der potentielt
kunne påvirke productionen af ACV, blev undersøgt. Sænkning af
kultiveringstemperaturen fra 30 til 20 oC øgede produktionen 30 gange. Effekten af at
integrere pcbAB og npgA direkte i gærens arvemasse blev også undersøgt.
Det andet stof, der blev søgt produceret, er isobutanol – en af kandidaterne til næste
generation af bio-baserede brændstoffer. Isobutanol er en bedre erstatning af flydende
fossile brændstoffer end ethanol, da isobutanol har højer energitæthed, lavere
vandabsorption og laver damptryk. Isobutanol er også bedre end sin isomer n-butanol
da det har et højere oktantal. I dette studie blev isobutanol-udbyttet øget fra 0.16 til
0.97 mg/g glukose ved at overudtrykke ILV2, ILV3 og ILV5 generne fra
valinstofskiftet i S. cerevisiae. Udbyttet blev øget ved anaerob gæring i et mineral-
11
Dansk sammenfatning
VI
baseret vækstmedium. Isobutanoludbyttet blev yderligere fordoblet ved tillige at
overudtrykke BAT2-genet. Yderligere overekspression af ILV6 nedsatte isobutanol
produktionsudbyttet til en tredjedel.
En støkiometrisk model af stofskiftet i S. cerevisiae blev anvendt til at finde nye gen-
kandidater til forbedring af isobutanol-produktionen. Softwaren BioOpt blev anvendt
til at simulere stofskiftet in silico og en rimelig overenstemmelse mellem
simuleringsresultaterne og data fra de anaerobe gæringer blev observeret. Anvendelse
af BioOpts muligheder for forudsigelse af resultatet af deletion eller overudtryk af
enkelte gener i stammen ILV2356_XCY605 identificerede et antal gener til videre
studier.
12
Contents
VII
Contents
Preface............................................................................................................................ I
Summary ...................................................................................................................... III
Dansk sammenfatning ................................................................................................... V
Contents ..................................................................................................................... VII
Chapter 1. Introduction .................................................................................................. 1
Chapter 2. Saccharomyces cerevisiae as a cell factory .................................................. 3
2.1. Introduction .................................................................................................................... 3
2.2. Industrial biotechnology and microbial cell factories .................................................... 4
2.3. Metabolic engineering .................................................................................................... 6
2.4. Genome-scale stoichiometric model of S. cerevisiae ..................................................... 8
2.5. Non-ribosomal peptide LLD-ACV biosynthesis .......................................................... 11
2.6. Production of branched-chain higher alcohols in S. cerevisiae .................................... 14
2.7. Summary ...................................................................................................................... 17
References ........................................................................................................................... 17
Chapter 3. Heterologous production of the non-ribosomal peptide LLD-ACV in Saccharomyces cerevisiae ........................................................................................... 23
Abstract ............................................................................................................................... 23
3.1. Introduction .................................................................................................................. 24
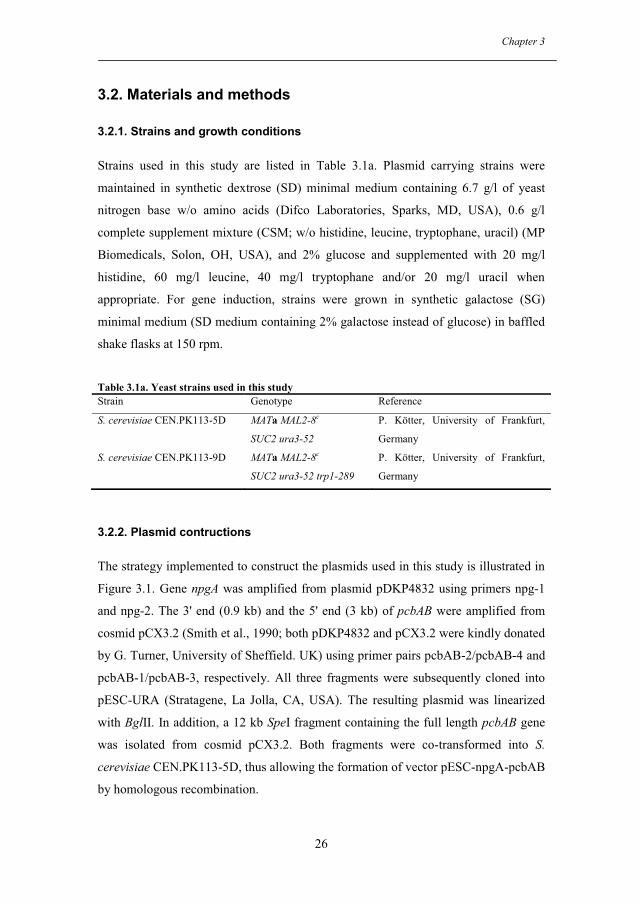
3.2. Materials and methods .................................................................................................. 26
3.2.1. Strains and growth conditions .................................................................... 26
3.2.2. Plasmid contructions................................................................................... 26
3.2.3. Chromosomal integration of pcbAB and npgA ........................................... 29
3.2.4. Fluorescence microscopy ........................................................................... 30
3.2.5. LC-MS analysis of ACV formation............................................................ 31
3.3. Results .......................................................................................................................... 31
3.3.1. Expression of ACVS and PPTase in S. cerevisiae ..................................... 31
3.3.2. Production of ACV in S. cerevisiae ............................................................ 33
13
Contents
VIII
3.3.3. Enhancement of ACV production in S. cerevisiae ..................................... 34
3.3.4. Chromosomal integration ........................................................................... 36
3.4. Discussion .................................................................................................................... 37
Acknowledgements ............................................................................................................. 39
References ........................................................................................................................... 40
Chapter 4. Increased isobutanol production in Saccharomyces cerevisiae by overexpression of genes in valine metabolism ............................................................ 45
Abstract ............................................................................................................................... 45
4.1. Background .................................................................................................................. 46
4.2. Results and discussion .................................................................................................. 49
4.2.1. Improvement of anaerobic isobutanol production by overexpression of genes in valine metabolism................................................................................... 49
4.2.2. Influence of various media on isobutanol production and growth rate ...... 55
4.3. Conclusions .................................................................................................................. 58
4.4. Methods ........................................................................................................................ 58
4.4.1. Media and culture conditions ..................................................................... 58
4.4.2. Strains and strain construction .................................................................... 59
4.4.3. Quantitative real-time PCR ........................................................................ 62
4.4.4. Fermentation ............................................................................................... 64
4.4.5. Analytical methods ..................................................................................... 64
Acknowledgements ............................................................................................................. 65
References ........................................................................................................................... 66
Chapter 5. Application of genome-scale model in metabolic engineering of Saccharomyces cerevisiae for improvement of isobutanol production ....................... 69
Abstract ............................................................................................................................... 69
5.1. Introduction .................................................................................................................. 70
5.2. Methods ........................................................................................................................ 73
5.2.1. Experimental data ....................................................................................... 73
5.2.2. Model and simulation tool .......................................................................... 74
5.2.2. General settings for stating different genetic and metabolic backgrounds . 74
5.2.3. Single gene deletions .................................................................................. 75
14

Contents
IX
5.2.4. Overexpression studies ............................................................................... 75
5.3. Results and discussions ................................................................................................ 75
5.3.1. Verification of the metabolic simulation model ......................................... 75
5.3.2. Prediction of further genetic manipulation targets in ILV2356_XCY605 . 77
5.4. Conclusions and future perspectives ............................................................................ 82
References ........................................................................................................................... 83
Chapter 6. Conclusions and future perspectives .......................................................... 85
15

Contents
X
16
Chapter 1
1
Chapter 1. Introduction
Saccharomyces cerevisiae is probably the most widely used eukaryotic organism in
human life. It has been used to produce fermented foods such as wine, beer and bread
since acient times. Nowadays S. cerevisiae is broadly used in industrial biotechnology
for production of a wide range of chemicals, metabolites and proteins. In addition to
its application in industry, S. cerevisiae also serves as a model organism for modern
cell biology research.
S. cerevisiae can be used to produce various metabolites of practical interest such as
non-ribosomal peptides (NRPs). NRPs belong to secondary metabolites, and many of
them have active biological activities and can be used for pharmaceutical purposes.
They are synthesized by peptide synthetases and could contain non-proteinogenic
amino acids. Natural organisms only produce NRPs in small concentrations and masss
production by purficiation from those biological sources is impractical. Chemical
synthesis of NRPs is also challenging due to the complexity of those peptides.
Heterologous production of NRPs in S. cerevisiae may provide an alternative way of
production of this group of compounds. In this study, the non-ribosomal tripeptide δ-
(L-α-aminoadipyl)–L-cysteinyl–D-valine (LLD-ACV), which is naturally produced in
most Penicillium species, was chosen as the model NRP, and heterologously
produced in S. cerevisiae.
Another group of chemicals that are valuable to produce in S. cerevisiae are biofuels.
Synthesis of biofuels from renewable resources has attracted an increasing interest
these years due to the global energy and environmental problems. Bioethanol
accounts for the major proportion in today’s biofuel production. Compared to
bioethanol, higher alcohols have a number of advantages including higher energy
density, lower hydroscopicity, and lower vapour pressure, making them better
substitutes for fossil fuels used in transportation. Among those higher alcohols,
isobutanol is favored over n-butanol due to its higher octane number, and regarded as
a promising type of the next generation biofuels. Since S. cerevisiae is the ideal
17

Chapter 1
2
natural host for alcohol production, a study of the production of isobutanol in S.
cerevisiae was performed in the second part of this PhD project.
The present thesis consists of six chapters. In Chapter 1 and Chapter 2, background
knowledge relevant to S. cerevisiae cell factories, genome-scale model, etc., is
described. In Chapter 3, heterologous production of non-ribosomal peptide ACV, as
well as the strategies applied to improvement of the production, is investigated. The
Penicillium chrysogenum gene pcbAB, which encodes ACV synthetase (ACVS), is
expressed in S. cerevisiae from a high-copy plasmid together with
phosphopantetheinyl transferase (PPTase)-encoding genes from Aspergillus nidulans,
P. chrysogenum and Bacillus subtilis. To improve ACV synthesis, codon optimization
and low-temperature cultivation were studied. An ACVS and PPTase genome
integration strain was also investigated to see the effect of the copy number of the
genes on the production of ACV. In Chapter 4, an experimental study was carried out
to improve isobutanol production in S. cerevisiae. Several genes of valine
biosynthetic and degradation pathways were simultaneously overexpressed with
different combinations. The constructed strains were characterized on different media
with glucose as the growth-limiting component during anaerobic and aerobic batch
cultivations. The isobutanol concentration in the fermentation broth was measured
through head-space gas chromatography (GC). In Chapter 5, further analysis of
isobutanol production in S. cerevisiae was performed by applying an S. cerevisiae
genome-scale model for searching other factors that would influence isobutanol
production. In Chapter 6, conclusions are drawn from the previous chapters and future
perspectives are presented.
18
Chapter 2
3
Chapter 2. Saccharomyces cerevisiae as a cell factory
2.1. Introduction
S. cerevisiae is a budding yeast widely used in fermentation processes. It is
traditionally used to produce fermented foods, such as bread and alcoholic beverages.
Its modern usage is not limited to food production. It has been extended into industrial
production of other chemicals, metabolites, and proteins.
S. cerevisiae is recognized today not only as an extremely useful model eukaryote
organism but also as a promising cell factory for industrial applications due to its
several unique features. S. cerevisiae can be cultured with ease on different carbon
sources. It has a high growth rate with a doubling time between 1.25 and 2 hours at
30 °C (Boekhout and Robert 2003). As a eukaryote, S. cerevisiae has the similar
internal cell structure and metabolic network with plant and animal cells, whereas its
low percentage of non-coding DNA simplifies the research in molecular and cell
biology in eukaryotes. In the study of the underlying mechanisms of human diseases,
like cancer and diabetes, S. cerevisiae served as a valuable tool for being a model
organism (Botstein et al. 1997; Dujon 1996). S. cerevisiae can be easily genetically
manipulated for heterologous metabolite production and improvement of the
established productions. Fermentation using S. cerevisiae is one of the most common
types in industry and experiences with the existing processes can be applied to the
production of a new chemical using S. cerevisiae.
Some fundamental knowledge about industrial biotechnology and metabolic
engineering will be first presented below, in Sections 2.2 and 2.3. It will also be
discussed why S. cerevisiae is a preferred organism for industrial biotechnology and
metabolic engineering. Several examples of S. cerevisiae as a cell factory are given in
Section 2.2. Application of metabolic engineering to improve production of ethanol in
S. cerevisiae is briefly presented in Section 2.3. In connection to metabolic
engineering of S. cerevisiae, Section 2.4 describes how a genome-scale stoichiometric
model is constructed and how it works for finding target genes for production
19

Chapter 2
4
improvement. The same type of model is used in Chapter 5 for a modeling analysis of
improvement of isobutanol production. LLD-ACV production and isobutanol
production in S. cerevisiae, which are investigated in this study, are two relatively
novel processes. Some extra details about production of them in S. cerevisiae, not
covered in Chapters 3 and 4, are given in Sections 2.5 and 2.6. Those details concern
the mechanisms underlying the synthesis of the two products in S. cerevisiae.
2.2. Industrial biotechnology and microbial cell factories
By far, most of energy and consumer products needed in human life are produced in
the chemical industry, particularly the petrochemical industry, via classical chemical
synthesis. Production by chemical synthesis, however, has many drawbacks, such as
substantial industrial waste, large energy consumption, and a limited range of
products, often without complex structures. On the other hand, our society is faced
with challenges with depleting fossil fuel reserves, growing global environmental
problems, and increasing demands for energy and consumer products. New processes
using renewable feedstock for bulk and fine chemical production are obviously on the
agenda to decrease our dependency on the fossil fuel based economy.
Industrial biotechnology, often known as white biotechnology in Europe, provides a
solution to the aforementioned challenges. The European Association for
Bioindustries (http://www.europabio.org/Industrial_biotech/IB_about.htm) has
defined industrial biotechnology as “the application of biotechnology for processing
and production of chemicals, materials and energy” and “it uses enzymes and
microorganisms to make products in sectors such as chemicals, food and feed, paper
and pulp, textiles and energy”.
One important aspect in industrial biotechnology is to use fermentation or enzymatic
conversion processes to produce industrial useful products, replacing those produced
from the traditional chemical industry. Products from the early industrial
biotechnology include several important products from anaerobic fermentations, such
as lactic acid, n-butanol and isopropanol, which can be subsequently converted to
important petrochemicals, such as lactide, n-butylene and glycerol (Hanselman 1982).
20
Chapter 2
5
Morden industrial biotechnology can be used to produce a larger variety of bulk and
fine chemicals, such as biofuels, bioplastics, pharmaceuticals and food ingredients,
from microbial fermentations rather than chemical synthesis. Biotechnological
processes based on microbial cell factories have several advantages compared to the
traditional chemical ones. For example, it uses sustainable bio resources instead of
fossil fuels; it gives much less carbon dioxide emission and thus mitigates global
warming; and it is capable of producing chemicals with a huge diversity, novel or
complex structures, which are hard to obtain through chemical synthesis. A classical
petrochemical process would be replaced by a microbial fermentation based
biotechnological process if the latter becomes cost-effective.
Traditionally, people screened and applied the natural producer of the desired
metabolites in industrial biotechnological processes. However, in recent years with
the development in genetic engineering tools people tend to use several widely used
microorganisms, like the filamentous fungus Aspergillus oryzae, the bacterium E. coli
and the yeast S. cerevisiae as cell factories for production of desired products. The
extensive fundamental research and the availability of numerous of genetic
manipulation tools on these cell factories facilitate the ease of strain improvement and
optimization of the production process (Maury et al. 2005).
S. cerevisiae is traditionally used in production of bioethanol. As a cell factory, it is
also used today to produce other important chemicals including organic acids, e.g.
lactic acid (Porro et al. 1999), glycerol (Geertman et al. 2006), succinate (Raab et al.
2010), and more complex natural products, e.g. vanillin, a plant secondary metabolite
used as flavouring agent (Hansen et al. 2009), isoprenoids (Shiba et al. 2007), and
polyketides (Mutka et al. 2006).
Another important application of S. cerevisiae in biotechnology is production of
heterologous protein. S. cerevisiae is an ideal host for heterologous protein production
since it can secrete protein product extracellular and post-translational modification
can be performed in it (Schekman and Novick 1982). The human peptide hormone
insulin produced by S. cerevisiae accounts for a big proportion in the current insulin
market. S. cerevisiae is also used to produce other proteins for diagnostic purpose,
21

Chapter 2
6
like human interferon, the hepatitis B surface antigen, papilloma virus antigen and
various vaccines (Hitzeman et al. 1981; Valenzuela et al. 1982).
2.3. Metabolic engineering
Cell factories are applied extensively to industrial production processes nowadays. In
order to optimize production and obtain desirable cellular properties, such as higher
production yield, improved physiological properties, and production of novel
metabolites, we need certain engineering tools to manipulate those cell factories. One
way to achieve that is through traditional mutagenesis strategies, like random
mutagenesis and screening. Although the traditional methods did provide successful
cases such as production of antibiotics, solvents and vitamins (Koffas et al. 1999),
they are always demanding in terms of time and labor. This is partly due to the fact
that those traditional methods are not based on a systematic understanding of the
underlying mechanism for the desired cellular properties. Even in the cases where the
desired properties are obtained, the underlying mechanism is still largely unknown,
which benefits little to the further research and development.
Metabolic engineering is defined as “the directed improvement of product formation
or cellular properties through the modification of specific biochemical reactions or
introduction of new ones with the use of recombinant DNA technology”
(Stephanopoulos 1999). The practice of metabolic engineering can be described as an
iterative process consisting of three steps: synthesis, analysis and design (Nielsen
2001). The synthesis step mainly utilizes DNA biotechnology including cloning,
transformation and homologous recombination to achieve genetic modifications. The
new constructed strains with the genetic modifications are then tested in the analysis
step to complete their metabolic characterization. Different analytical techniques, like
transcription analysis, protein analysis, metabolite analysis, and flux analysis, could
be applied. Comparison with the original strain is made in their fermentation
physiology and metabolic network. By interpreting the obtained analysis data, further
examination of the metabolism network is made, and new genetic manipulation
targets for the next round can be proposed in the design step (Nielsen 2001).
Compared with the traditional random mutagenesis and screening, the most crucial
22
Chapter 2
7
difference in metabolic engineering is that the practice of metabolic engineering is
based on rational and directed genetic modifications.
Metabolic engineering helps us to improve the microbial production processes in a
more efficient way. Application of metabolic engineering in biotechnological fields
are mainly used to obtain higher yield or productivity of the target metabolite,
improve cellular physiology for an optimized process, delete or down-regulate by-
product formation, produce novel products, etc. (Stephanopoulos 1998).
In order to carry out efficient metabolic engineering in a strain improvement process,
the availability of competent genetic modification tools for the given strain is
necessary. Metabolic engineering can be relatively easily carried out in S. cerevisiae
mainly due to its well-defined genetic system and highly efficient heterologous
recombination feature. S. cerevisiae also has other advantages favourable to metabolic
engineering, such as the availability of numerous markers, strains (especially
auxotrophic strains) and efficient transformation vectors. S. cerevisiae has a high
degree of homologous recombination, which facilitates modification of the yeast
genome on specific locations. Furthermore, there are promoters with different strength
that can control the expression level of the interested gene(s). For example, glycolytic
promoters, such as PGK1, the promoter of the gene encoding 3-phosphoglycerate
kinase, the key enzyme in glycolysis and gluconeogenesis, can be used for strong
constitutive expression of the target gene(s) (Blake and Rice 1981). Regulated
expression in S. cerevisiae could also be achieved by applying inducible promoters
like GAL7, which is the promoter of the gene encoding galactose-1-phosphate uridyl
transferase in S. cerevisiae galactose metabolism. The expression under the control of
GAL7 is regulated by the galactose and the glucose concentrations in the medium
(Park et al. 1993).
Metabolic engineering has been extensively applied to improving production of
bioethanol in S. cerevisiae. A central issue in bioethanol production is to lower the
production price so that the produced bioethanol can be competitive with fossil fuel.
Several modifications of S. cerevisiae have been made to address the issue. An
important new feature introduced to S. cerevisiae is the capability of growing on
23

Chapter 2
8
xylose, one of the main components of lignocelluloses. This is achieved by inserting
genes encoding xylose isomerise from the anaerobic fungus Piromyces sp.E2 (Kuyper
et al. 2003). In order to enhance the use of substrates, the gene encoding Mig1p DNA-
binding protein was deleted to remove the suppression for metabolism of carbon
sources other than glucose (Olsson et al. 1997). A major by-product in the bioethanol
production using S. cerevisiae is glycerol. Its production was suppressed by deletion
of gene GDH1, which encodes the NADPH-dependent glutamate dehydrogenase
(Nissen et al. 2000). The aforementioned modifications based on metabolic
engineering have significantly improved the bioethanol production in S. cerevisiae.
2.4. Genome-scale stoichiometric model of S. cerevisiae
Mathematical models can be used to describe the metabolisms in various organisms
with some necessary assumptions or simplifications. With the help of mathematical
models, their metabolisms can be analyzed for various purposes. For S. cerevisiae,
metabolic reconstructions and constraint-based modeling are valuable tools for
predicting its phenotypic behavior (Duarte et al. 2004b). The same modeling strategy
is adopted here for metabolic engineering of S. cerevisiae amino acid metabolism for
improvement of isobutanol production.
In the traditional improvement of phenotypes such as increase in the yield of a desired
metabolite, it is only possible to apply the old experiences or to make analysis of
small-scale metabolic pathways to select the gene targets for manipulation. After the
small-scale analysis has identified the synthetic pathway or the competing pathway
for the targeted metabolite, the synthetic pathway can be overexpressed and the
competing one can be disrupted or reduced. In this way, more carbon is directed to the
formation of the targeted metabolite. The traditional small-scale analysis, although
assuming that the analyzed pathways have no interaction with the rest of the
metabolic network, has achieved some successes in the past (Ostergaard et al. 2000).
The choice of the small-scale model is mainly due to the lack of a modeling
framework that can take into account numerous metabolic pathways and their
interactions in the metabolic network. Nowadays, extensive knowledge of S.
cerevisiae has accumulated in its cell biology and biochemistry, and its complete
24
Chapter 2
9
genome sequence (Goffeau et al. 1996) is available, which leads to the establishment
of genome-scale network models. Those models, in combination with mathematical
tools like flux balance analysis (FBA) and linear programming, provide the possibility
of genome-scale analysis in metabolic engineering.
The first stoichiometric genome-scale model of S. cerevisiae was established in 2003
(Forster et al. 2003a). Reconstruction of the metabolic network of S. cerevisiae
involves collection of the relevant genomic, biochemical, and physiological
information for S. cerevisiae, and inclusion of the important enzymatic reactions in
the metabolic pathways of S. cerevisiae. The sources of information cover the genome
annotation, biochemical pathway databases, biochemistry textbooks, and the latest
publications by then. The reconstructed metabolic network consisted of 1175
metabolic reactions and 584 metabolites. It included 708 metabolic open reading
frames (ORFs), to which 1035 reactions were assigned. It also included cofactors like
NADH and NADPH into consideration. The metabolic reactions were classified into
two groups in the first version: mitochondria reactions and the rest into one group as
cytosolic reactions. Regulation information, however, was not included in the network
due to lack of the complete regulation information, complexity of the regulation
network, and difficulty of integrating the regulation information into the flux balance
analysis (Forster et al. 2003a).
Several genome-scale metabolic models are now available for S. cerevisiae, including
iFF708, iND750, iLL672 and iIN800 (Duarte et al. 2004a; Forster et al. 2003a;
Kuepfer et al. 2005; Nookaew et al. 2008). All these models share a similar
calculation framework. The biochemical network in S. cerevisiae is described by a set
of stoichiometric reactions in these models (Patil et al. 2004). These reaction rates can
be calculated by flux balance analysis under steady-state growth conditions
(Asadollahi et al. 2009; Kauffman et al. 2003). To determine an optimum flux
distribution, an objective function must be specified by the user, and linear
programming is employed for the optimization with constraints (Famili et al. 2003;
Forster et al. 2003b).
25
Chapter 2
10
The genome-scale metabolic model of S. cerevisiae (Forster et al. 2003a) has the
capability of predicting the change in phenotype due to single gene deletion. This can
be used to evaluate the model by comparing the model predicted phenotypes with the
experimental data. Famili et al. performed such an evaluation by simulating growth on
a synthetic complete medium after single-gene deletions (Famili et al. 2003; Forster et
al. 2003b). It was found that 81.5% (93 of 114 cases) of the in silico predictions were
in agreement with in vivo phenotypes (Famili et al. 2003; Forster et al. 2003b). A
larger-scale investigation of in silico gene deletion was performed later (Famili et al.
2003; Forster et al. 2003b), where 599 mutant strains of S. cerevisiae were included in
the comparison. It was found that 87.8% (526 of 599 cases) of the in silico results
were in agreement with the experimental observations when growth on synthetic
medium was simulated. These two evaluations showed the capability of the model to
reproduce most of the existing data for S. cerevisiae and also the potential usage of
the model in understanding and predicting the metabolic behavior of S. cerevisiae
(Famili et al. 2003; Forster et al. 2003b).
Genome-scale metabolic models of S. cerevisiae can be used to guide the design of an
improved S. cerevisiae cell factory. One recent application of the genome-scale
metabolic model of S. cerevisiae (Forster et al. 2003a) is to enhance sesquiterpene
production in S. cerevisiae through in silico driven metabolic engineering (Asadollahi
et al. 2009). The authors used the stoichiometric model of S. cerevisiae to evaluate the
effect of gene deletions on sesquiterpene production by using OptGene with
minimization of metabolic adjustments (MOMA) as objective function. The analysis
showed that deletion of NADPH-dependent glutamate dehydrogenase encoded by
GDH1 was the best target for the further experimental study. For this mutant, the
model prediction gives around 10-fold increase in the flux towards sesquiterpene
production, with 15% reduction in the specific growth rate. The experimental results
in 5 L batch two-phase fermenters showed an approximately 85% increase in the final
sesquiterpene concentration and a significant decrease (65%) in the maximum specific
growth rate, which were in general agreement with the model predictions although the
increase in the sesquiterpene production was moderate and the reduction in specific
growth rate was much higher. The authors argued that it was due to the fact that
stoichiometric models do not take into account of the kinetic and thermodynamic
26

Chapter 2
11
constraints on the possible flux changes. Despite the limitations, the directions of the
changes were correctly predicted. Another example of application of the S. cerevisiae
model in in silico design is the improvement of production of vanillin through a
heterologous introduced pathway (Brochado et al. 2010). In that study, iFF708 was
employed to identify and select target reactions by using OptGene with MOMA as the
biological objective function. Among six reaction knockout targets, two targets
(PDC1 and GDH1) were finally selected for experimental verification. In the
experiments with the modified strains, a 1.5-fold higher vanillin β-D-glucoside yield
in batch fermentation was achieved for three different mutants and a 2-fold
productivity improvement in continuous culture for the Δpdc1 mutant. The study
demonstrates again that use of the genome-scale metabolic model of S. cerevisiae can
guide the design of overproducing strains.
2.5. Non-ribosomal peptide LLD-ACV biosynthesis
Tripeptide δ-(L-α-aminoadipyl)–L-cysteinyl–D-valine (LLD-ACV) is a type of non-
ribosomal peptides (NRPs) and the starting point for β-lactam antibiotic biosynthesis.
NRPs are small peptide molecules synthesized independent of DNA sequence, and
often contain unusual amino acids as building blocks. People have shown great
interest in NRPs mainly because most of them have active biological activities, and
could be used for pharmaceutical purpose (Sieber and Marahiel 2005).
Synthesis of NRPs is controlled by non-ribosomal peptide synthetases (NRPS), in
contrast to the synthesis of other common proteins by ribosome. The synthesis
mechanism of NRPs belongs to the multienzyme thiotemplate mechanism (Sieber and
Marahiel 2005). The multienzyme complex NRPS can be divided into different
modules. Each module is responsible for taking one specific amino acid into the
peptide product (Sieber and Marahiel 2005). A module can be subdivided into a
number of domains. Different domains have different individual enzymatic functions,
such as substrate recognition and activation, binding, modification, elongation, and
release. NRPS works as a template and biosynthetic machinery during the peptide
synthesis process. Different domains in each module contribute to the amino acid
addition to the peptide chain, and after the addition of all of the amino acid molecules,
27
Chapter 2
12
the final peptide product is checked and the one with the right structure is released
from the complex (Sieber and Marahiel 2005). The features of NRPs are determined
by the order and the characteristics of the domains. Therefore it is possible to make
the enzyme with totally new features by domain shuffling (Sieber and Marahiel
2005).
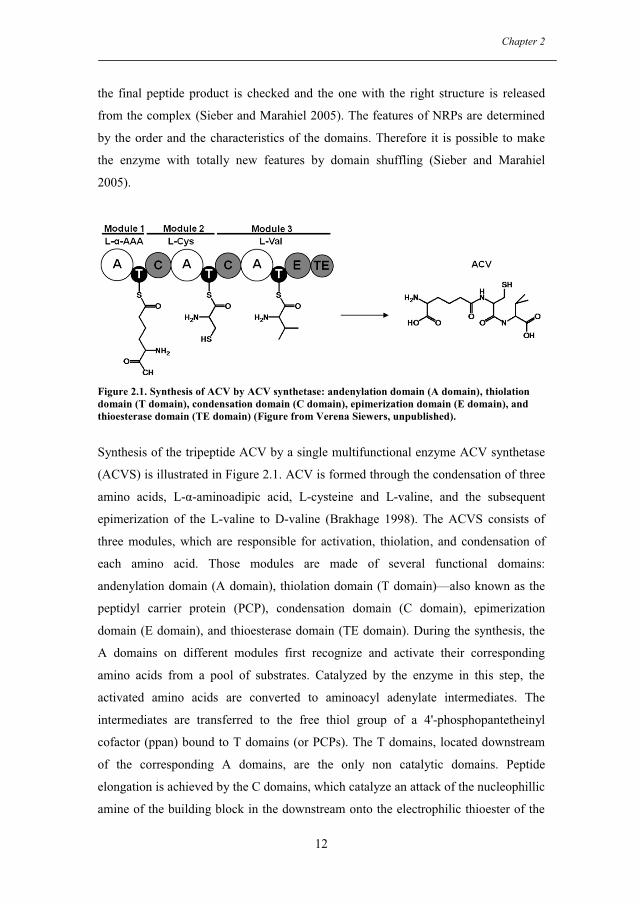
Figure 2.1. Synthesis of ACV by ACV synthetase: andenylation domain (A domain), thiolation domain (T domain), condensation domain (C domain), epimerization domain (E domain), and thioesterase domain (TE domain) (Figure from Verena Siewers, unpublished).
Synthesis of the tripeptide ACV by a single multifunctional enzyme ACV synthetase
(ACVS) is illustrated in Figure 2.1. ACV is formed through the condensation of three
amino acids, L-α-aminoadipic acid, L-cysteine and L-valine, and the subsequent
epimerization of the L-valine to D-valine (Brakhage 1998). The ACVS consists of
three modules, which are responsible for activation, thiolation, and condensation of
each amino acid. Those modules are made of several functional domains:
andenylation domain (A domain), thiolation domain (T domain)—also known as the
peptidyl carrier protein (PCP), condensation domain (C domain), epimerization
domain (E domain), and thioesterase domain (TE domain). During the synthesis, the
A domains on different modules first recognize and activate their corresponding
amino acids from a pool of substrates. Catalyzed by the enzyme in this step, the
activated amino acids are converted to aminoacyl adenylate intermediates. The
intermediates are transferred to the free thiol group of a 4'-phosphopantetheinyl
cofactor (ppan) bound to T domains (or PCPs). The T domains, located downstream
of the corresponding A domains, are the only non catalytic domains. Peptide
elongation is achieved by the C domains, which catalyze an attack of the nucleophillic
amine of the building block in the downstream onto the electrophilic thioester of the
28
Chapter 2
13
building block in the upstream (Sieber and Marahiel 2005). The last module in ACVS
contains an E domain which converts L-valine to its D-isomer. The peptide grows
from the amino terminus to the carboxyl terminus, and the intermediate peptides keep
bound to the enzyme (Kleinkauf and Von Dohren 1996). Once the assembly line of
the amino acids is ended, the formed peptide is released at the C-terminal TE domain
of the enzyme. The TE domain at the C-terminal region of ACV synthetase is
responsible for the selective release of tripeptide with the correct LLD configuration
(Kleinkauf and Von Dohren 1996). This highly ordered process is beneficial in
preventing side reactions and saving time for substrate transportation (Sieber and
Marahiel 2005).
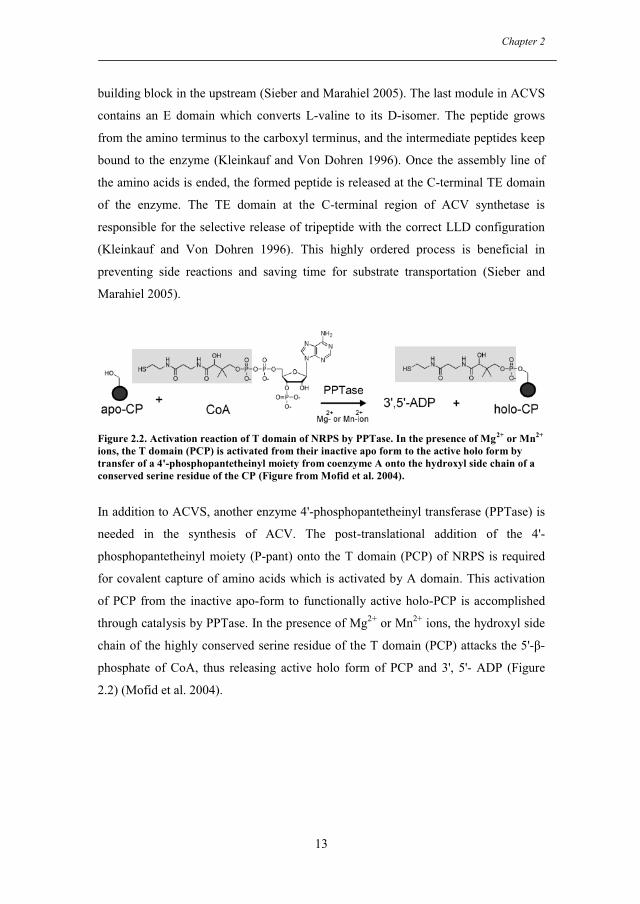
Figure 2.2. Activation reaction of T domain of NRPS by PPTase. In the presence of Mg2+ or Mn2+ ions, the T domain (PCP) is activated from their inactive apo form to the active holo form by transfer of a 4'-phosphopantetheinyl moiety from coenzyme A onto the hydroxyl side chain of a conserved serine residue of the CP (Figure from Mofid et al. 2004).
In addition to ACVS, another enzyme 4'-phosphopantetheinyl transferase (PPTase) is
needed in the synthesis of ACV. The post-translational addition of the 4'-
phosphopantetheinyl moiety (P-pant) onto the T domain (PCP) of NRPS is required
for covalent capture of amino acids which is activated by A domain. This activation
of PCP from the inactive apo-form to functionally active holo-PCP is accomplished
through catalysis by PPTase. In the presence of Mg2+ or Mn2+ ions, the hydroxyl side
chain of the highly conserved serine residue of the T domain (PCP) attacks the 5'-β-
phosphate of CoA, thus releasing active holo form of PCP and 3', 5'- ADP (Figure
2.2) (Mofid et al. 2004).
29
Chapter 2
14
2.6. Production of branched-chain higher alcohols in S. cerevisiae
Two challenging issues that mankind are confronted with today are the energy
security and the global climate change. With the increasing global demand for energy
and the limited reserves of fossil fuels, the role of sustainable energy in the whole
energy portfolio becomes bigger and bigger. Replacement of fossil fuels by
sustainable energy can also reduce CO2 emission and mitigate the greenhouse gas
effects. Among various types of sustainable energy, liquid biofuels, produced from
biomass, have received enormous attention, largely because it is by far the only option
implemented on a large scale to substitute liquid fossil fuels used in transportation.
Major types of liquid biofuels include bioalcohols, vegetable oils, and biodiesel.
Bioethanol production is the most matured technology among various liquid biofuels.
Bioethanol has been produced in large amounts from feedstocks such as corn or sugar
cane for years, and recently lignocelluslosic bioethanol production started from
woody or fibrous biomass which cannot be used as food. Actually, higher alcohols
with longer carbon chains may have more suitable properties than ethanol as
substitutes for the current fossil fuels. Butanols have four different isomers, n-butanol
(1-butanol or butan-1-ol), isobutanol (isobutyl alcohol or 2-methylpropan-1-ol), 2-
butanol (sec-butanol or butan-2-ol) and t-butanol (tert-butanol or 2-methyl-propan-2-
ol). In general all these four isomers have a higher energy density, lower
hygroscopicity, and lower vapor pressure than ethanol. As a result, butanols provide
energy content closer to that of gasoline than ethanol, better water stability and
smaller tendency to separation when blended with gasoline, and does not increase the
vapor pressure when added to gasoline. The aforementioned advantages also facilitate
the use of the existing fuel distribution infrastructure for biobutanols.
Biological synthesis of butanol is by far mainly achieved by the Acetone Butanol
Ethanol (ABE) fermentation process using the Clostridia bacteria such as Clostridium
acetobutylicum. The process utilizes feedstock such as wheat and corn and produces
acetone, 1-butanol and ethanol together. The process was largely replaced by more
economic petrochemical processes during the 1950s. Recently, a renewed interest in
this process as well as other ways to produce biobutanols has appeared, driven by the
high oil prices and the demands in chemical markets (ButamaxTM Advanced Biofuels
30
Chapter 2
15
LLC January 2010). In 2006, North American based company DuPont and UK based
company BP created a partnership to develop, produce and market the next generation
biofuels, with focus on biobutanols. While BP and DuPont are working on different
butanol isomers, it is isobutanol that they have selected for commercialization
(ButamaxTM Advanced Biofuels LLC January 2010). Compared to n-butanol,
isobutanol has a higher octane number and is more suitable as biofuel. Recently, the
research group led by J.C. Liao at University of California, Los Angeles, has engaged
in using engineered Escherichia coli to produce different higher alcohols, including
isobutanol (Atsumi et al. 2008a; Atsumi et al. 2008b; Hanai et al. 2007; Shen and
Liao 2008). The isobutanol concentration reportedly reached 22 g/L during aerobic
cultivations (Atsumi et al. 2008). However, compared with yeasts, E. coli is less
robust against pH or temperature change, and has a lower alcohol tolerance (Weber et
al. 2010), which can be a potential limitation in its industrial applications. Production
of isobutanol with yeast like S. cerevisiae seems to be more suitable especially
because isobutanol is already produced by wild-type S. cerevisiae (Weber et al. 2010).
Actually, several companies like DuPont, Gevo and Butalco are working on the
genetic engineering of S. cerevisiae for isobutanol production although no scientific
articles have yet been published in this area (Weber et al. 2010). It should be
mentioned that we were not aware of the fact until the late stage of this study.
The biosynthetic pathway of higher branched alcohols in S. cerevasiae is illustrated in
Figure 2.3. Metabolism of amino acid in S. cerevasiae generates 2-keto acids as
intermediates, which are converted to aldehydes by broad-substrate-range
decarboxylases and then to alcohols by alcohol dehydragenases (ADHs) (Figure 2.3a).
Figure 2.3b illustrates four different branched-chain higher alcohols production in S.
cerevasiae. The biosynthesis pathways for four different amino acids, including valine,
isoleucine, leucine, and pheylalanine, produce 2-keto-isovalerate, 2-keto-3-methyl-
valerate, α-ketoisocaproate, and phenylpyuvate, respectively. These four 2-keto acids
are then converted to isobutanol, 2-methyl-1-butanol, 3-methyl-1-butanol, and 2-
phenylethanol, respectively.
31

Chapter 2
16
2-Ketoisovalerate Phenylpyruvate2-Keto-3-methyl-valerate α-Ketoisocaproate
Isobutanol 2-Phenylethanol2-Methyl-1-butanol 3-Methyl-1-butanol
Decarboxylase
Alcohol dehydrogenase
(a)
Glucose
PyruvateL-Threonine
2-Keto-3-methyl-valerate
2-Methyl-1-butanol3-Methyl-1-butanol
α-Ketoisocaproate
Isobutanol
2-Ketoisovalerate
Phenylpyruvate
2-Phenylethanol
PDCADHPDC
ADH
THI3ADH
PDCADH
Phenylalaninebiosynthesis
Valinebiosynthesis
Leucine biosynthesis
IIv235IIv1253
Leu124
Isoleucinebiosynthesis
(b) Figure 2.3. Biosynthesis of higher alcohols in S. cerevisiae: (a) various 2-keto acid precursors converted to corresponding alcohols by decarboxylase and alcohol dehydrogenase; (b) various amino acid biosynthesis pathways lead to production of higher alcohols in S. cerevisiae (modified from Atusmi et al. 2008b).
32

Chapter 2
17
2.7. Summary
This chapter has covered diverse topics as background and fundamentals for the
following chapters. It starts with a general description about the importance of
industrial biotechnology and microbial cell factories to our society and the
significance of metabolic engineering to modern biotechnology. In particular,
examples are given to show what S. cerevisiae can produce as cell factories and how
metabolic engineering can be used to improve production of bioethanol in S.
cerevisiae. Furthermore, genome-scale stoichiometric modeling, as an important and
unique tool in metabolic engineering, provides the possibility to analyze the cellular
metabolism as a whole. Its construction and applications are therefore briefly
reviewed. Background details about production of LLD-ACV and bioisobutanol, two
chemicals selected in this study, have been provided. For biosynthesis of LLD-ACV,
two enzymes ACVS and PPTase are essential. For bioisobutanol, its biosynthesis
pathway in S. cerevisiae has been illustrated.
References
Asadollahi MA, Maury J, Patil KR, Schalk M, Clark A, Nielsen J. 2009. Enhancing
sesquiterpene production in Saccharomyces cerevisiae through in silico driven
metabolic engineering. Metab Eng 11(6):328-34.
Atsumi S, Cann AF, Connor MR, Shen CR, Smith KM, Brynildsen MP, Chou KJ,
Hanai T, Liao JC. 2008a. Metabolic engineering of Escherichia coli for 1-
butanol production. Metab Eng 10(6):305-11.
Atsumi S, Hanai T, Liao JC. 2008b. Non-fermentative pathways for synthesis of
branched-chain higher alcohols as biofuels. Nature 451(7174):86-9.
Blake CC, Rice DW. 1981. Phosphoglycerate kinase. Philos Trans R Soc Lond B Biol
Sci 293(1063):93-104.
Boekhout T, Robert V, editors. 2003. Yeasts in Food: Beneficial and Detrimental
Aspects. Hamburg: B. Behr's Verlag GmbH & Co.
Botstein D, Chervitz SA, Cherry JM. 1997. Yeast as a model organism. Science
277(5330):1259-60.
33
Chapter 2
18
Brakhage AA. 1998. Molecular regulation of beta-lactam biosynthesis in filamentous
fungi. Microbiol Mol Biol Rev 62(3):547-85.
Brochado AR, Matos C, Moller BL, Hansen J, Mortensen UH, Patil KR. 2010.
Improved vanillin production in baker's yeast through in silico design. Microb
Cell Fact 9:84.
ButamaxTM Advanced Biofuels LLC. January 2010. California Biobutanol
Multimedia Evaluation Tier I Report.
Duarte NC, Herrgard MJ, Palsson BO. 2004a. Reconstruction and validation of
Saccharomyces cerevisiae iND750, a fully compartmentalized genome-scale
metabolic model. Genome Res 14(7):1298-309.
Duarte NC, Palsson BO, Fu P. 2004b. Integrated analysis of metabolic phenotypes in
Saccharomyces cerevisiae. BMC Genomics 5:63.
Dujon B. 1996. The yeast genome project: what did we learn? Trends Genet
12(7):263-70.
Famili I, Forster J, Nielsen J, Palsson BO. 2003. Saccharomyces cerevisiae
phenotypes can be predicted by using constraint-based analysis of a genome-
scale reconstructed metabolic network. Proc Natl Acad Sci U S A
100(23):13134-9.
Forster J, Famili I, Fu P, Palsson BO, Nielsen J. 2003a. Genome-scale reconstruction
of the Saccharomyces cerevisiae metabolic network. Genome Res 13(2):244-
53.
Forster J, Famili I, Palsson BO, Nielsen J. 2003b. Large-scale evaluation of in silico
gene deletions in Saccharomyces cerevisiae. OMICS 7(2):193-202.
Geertman JM, van Maris AJ, van Dijken JP, Pronk JT. 2006. Physiological and
genetic engineering of cytosolic redox metabolism in Saccharomyces
cerevisiae for improved glycerol production. Metab Eng 8(6):532-42.
Goffeau A, Barrell BG, Bussey H, Davis RW, Dujon B, Feldmann H, Galibert F,
Hoheisel JD, Jacq C, Johnston M and others. 1996. Life with 6000 genes.
Science 274(5287):546, 563-7.
Hanai T, Atsumi S, Liao JC. 2007. Engineered synthetic pathway for isopropanol
production in Escherichia coli. Appl Environ Microbiol 73(24):7814-8.
Hanselman KW. 1982. Lignochemicals. Experientia 38:176-189.
34
Chapter 2
19
Hansen EH, Moller BL, Kock GR, Bunner CM, Kristensen C, Jensen OR, Okkels FT,
Olsen CE, Motawia MS, Hansen J. 2009. De novo biosynthesis of vanillin in
fission yeast (Schizosaccharomyces pombe) and baker's yeast (Saccharomyces
cerevisiae). Appl Environ Microbiol 75(9):2765-74.
Hitzeman RA, Hagie FE, Levine HL, Goeddel DV, Ammerer G, Hall BD. 1981.
Expression of a human gene for interferon in yeast. Nature 293(5835):717-22.
Kauffman KJ, Prakash P, Edwards JS. 2003. Advances in flux balance analysis. Curr
Opin Biotechnol 14(5):491-6.
Kleinkauf H, Von Dohren H. 1996. A nonribosomal system of peptide biosynthesis.
Eur J Biochem 236(2):335-51.
Koffas M, Roberge C, Lee K, Stephanopoulos G. 1999. Metabolic engineering. Annu
Rev Biomed Eng 1:535-57.
Kuepfer L, Sauer U, Blank LM. 2005. Metabolic functions of duplicate genes in
Saccharomyces cerevisiae. Genome Res 15(10):1421-30.
Kuyper M, Harhangi HR, Stave AK, Winkler AA, Jetten MS, de Laat WT, den Ridder
JJ, Op den Camp HJ, van Dijken JP, Pronk JT. 2003. High-level functional
expression of a fungal xylose isomerase: the key to efficient ethanolic
fermentation of xylose by Saccharomyces cerevisiae? FEMS Yeast Res
4(1):69-78.
Maury J, Asadollahi MA, Moller K, Clark A, Nielsen J. 2005. Microbial isoprenoid
production: an example of green chemistry through metabolic engineering.
Adv Biochem Eng Biotechnol 100:19-51.
Mofid MR, Finking R, Essen LO, Marahiel MA. 2004. Structure-based mutational
analysis of the 4'-phosphopantetheinyl transferases Sfp from Bacillus subtilis:
carrier protein recognition and reaction mechanism. Biochemistry
43(14):4128-36.
Mutka SC, Bondi SM, Carney JR, Da Silva NA, Kealey JT. 2006. Metabolic pathway
engineering for complex polyketide biosynthesis in Saccharomyces cerevisiae.
FEMS Yeast Res 6(1):40-7.
Nielsen J. 2001. Metabolic engineering. Appl Microbiol Biotechnol 55(3):263-83.
Nissen TL, Kielland-Brandt MC, Nielsen J, Villadsen J. 2000. Optimization of
ethanol production in Saccharomyces cerevisiae by metabolic engineering of
the ammonium assimilation. Metab Eng 2(1):69-77.
35

Chapter 2
20
Nookaew I, Jewett MC, Meechai A, Thammarongtham C, Laoteng K,
Cheevadhanarak S, Nielsen J, Bhumiratana S. 2008. The genome-scale
metabolic model iIN800 of Saccharomyces cerevisiae and its validation: a
scaffold to query lipid metabolism. BMC Syst Biol 2:71.
Olsson L, Larsen ME, Ronnow B, Mikkelsen JD, Nielsen J. 1997. Silencing MIG1 in
Saccharomyces cerevisiae: effects of antisense MIG1 expression and MIG1
gene disruption. Appl Environ Microbiol 63(6):2366-71.
Ostergaard S, Olsson L, Nielsen J. 2000. Metabolic engineering of Saccharomyces
cerevisiae. Microbiol Mol Biol Rev 64(1):34-50.
Park YS, Shiba S, Lijima S, Kobayashi T, Hishinuma F. 1993. Comparison of three
different promoter systems for secretory alpha-amylase production in fed-
batch cultures of recombinant Saccharomyces cerevisiae. Biotechnol Bioeng
41(9):854-61.
Patil KR, Akesson M, Nielsen J. 2004. Use of genome-scale microbial models for
metabolic engineering. Curr Opin Biotechnol 15(1):64-9.
Porro D, Bianchi MM, Brambilla L, Menghini R, Bolzani D, Carrera V, Lievense J,
Liu CL, Ranzi BM, Frontali L and others. 1999. Replacement of a metabolic
pathway for large-scale production of lactic acid from engineered yeasts. Appl
Environ Microbiol 65(9):4211-5.
Raab AM, Gebhardt G, Bolotina N, Weuster-Botz D, Lang C. 2010. Metabolic
engineering of Saccharomyces cerevisiae for the biotechnological production
of succinic acid. Metab Eng 12(6):518-25.
Schekman R, Novick P. 1982. The secretory process and yeast cell-surface assembly.
In: Strathern JN, editor. The molecular biology of the yeast Saccharomyces.
N. Y.: Cold Spring Harbor Laboratory. p 361-393.
Shen CR, Liao JC. 2008. Metabolic engineering of Escherichia coli for 1-butanol and
1-propanol production via the keto-acid pathways. Metab Eng 10(6):312-20.
Shiba Y, Paradise EM, Kirby J, Ro DK, Keasling JD. 2007. Engineering of the
pyruvate dehydrogenase bypass in Saccharomyces cerevisiae for high-level
production of isoprenoids. Metab Eng 9(2):160-8.
Sieber SA, Marahiel MA. 2005. Molecular mechanisms underlying nonribosomal
peptide synthesis: approaches to new antibiotics. Chem Rev 105(2):715-38.
Stephanopoulos G. 1998. Metabolic engineering. Biotechnol Bioeng 58(2-3):119-20.
36

Chapter 2
21
Stephanopoulos G. 1999. Metabolic fluxes and metabolic engineering. Metab Eng
1(1):1-11.
Valenzuela P, Medina A, Rutter WJ, Ammerer G, Hall BD. 1982. Synthesis and
assembly of hepatitis B virus surface antigen particles in yeast. Nature
298(5872):347-50.
Weber C, Farwick A, Benisch F, Brat D, Dietz H, Subtil T, Boles E. 2010. Trends and
challenges in the microbial production of lignocellulosic bioalcohol fuels.
Appl Microbiol Biotechnol 87(4):1303-15.
37

Chapter 2
22
38

Chapter 3
23
Chapter 3. Heterologous production of the non-ribosomal peptide LLD-ACV in Saccharomyces cerevisiae
Verena Siewers, Xiao Chen, Le Huang, Jie Zhang, and Jens Nielsen*
Metabolic Engineering 11 (2009) 391-397
Abstract
Non-ribosomal peptides (NRPs) are a diverse family of secondary metabolites with a
broad range of biological activities. We started to develop a eukaryotic microbial
platform based on the yeast Saccharomyces cerevisiae for heterologous production of
NRPs using �-(L-�-aminoadipyl)-L-cysteinyl-D-valine (ACV) as a model NRP. The
Penicillium chrysogenum gene pcbAB encoding ACV synthetase was expressed in S.
cerevisiae from a high copy plasmid together with phosphopantetheinyl transferase
(PPTase) encoding genes from Aspergillus nidulans, P. chrysogenum and Bacillus
subtilis, and in all the three cases production of ACV was observed. To improve ACV
synthesis, several factors were investigated. Codon optimization of the 5' end of
pcbAB did not significantly increase ACV production. However, a 30-fold
enhancement was achieved by lowering the cultivation temperature from 30 to 20 ºC.
When ACVS and PPTase encoding genes were integrated into the yeast genome a 6-
fold decrease in ACV production was observed indicating that gene copy number was
one of the rate-limiting factors for ACV production in yeast.
Keywords: secondary metabolites; non-ribosomal peptide synthetase;
phosphopantetheinyl transferase; S. cerevisiae
39

Chapter 3
24
3.1. Introduction
Non-ribosomal peptides (NRPs) represent a versatile group of microbial secondary
metabolites exhibiting a broad range of biological and pharmacological activities
(Sieber and Marahiel, 2005). They include antibiotics such as bacitracin (Eppelmann
et al., 2001) and vancomycin (van Wageningen et al., 1998), antibiotic precursors like
�-(L-�-aminoadipyl)-L-cysteinyl-D-valine (ACV) (Byford et al., 1997), cytostatics
such as epothilone (Molnar et al., 2000), immunosuppressive agents like cyclosporine
(Weber and Leitner, 1994) and siderophores (Quadri et al., 1998a). Non-ribosomal
peptides are synthesized by specific peptide synthetases via a thiotemplate mechanism
(Kleinkauf and von Doehren, 1996). Unlike DNA-encoded peptides, the non-
ribosomal peptides can contain non-proteinogenic amino acids, and often carry
unusual modifications like N-methyl and N-formyl groups (Schwarzer et al., 2003).
Non-ribosomal peptides have attained much interest because of their important roles
as human pharmaceuticals. Because of the scarcity of non-ribosomal peptide
production in nature and the complexity of their structures, mass production by
purification from biological material or chemical synthesis is, however, rarely
performed. Moreover, it is also often difficult to genetically manipulate the natural
producers for either production optimization through metabolic engineering or novel
chemical entity exploration through combinatorial biosynthesis.
For these reasons we initiated the development of a yeast platform based on
Saccharomyces cerevisiae for heterologous production of NRPs. As a model
eukaryote, S. cerevisiae is one of the most thoroughly studied organisms. It is easy to
manipulate and cultivate, and classified as a generally recognized as safe (GRAS)
organism for production of a number of different products. To establish NRP
production in yeast, we chose the non-ribosomal tripeptide �-(L-�-aminoadipyl)-L-
cysteinyl-D-valine (ACV) as our target in this study.
ACV is the first intermediate in the biosynthetic pathways of β-lactam antibiotics, of
which the penicillins and cephalosporins are the most well-known. The formation of
ACV is catalyzed by a single non-ribosomal peptide synthetase named ACV
40

Chapter 3
25
synthetase (ACVS), which consists of three modules involved in incorporation of the
corresponding amino acids L-α-aminoadipic acid, L-cysteine and L-valine,
respectively. Each module is comprised of functional domains for amino acid
activation, thiolation, and condensation. In addition, the last module of ACV
synthetase contains an epimerization domain involved in conversion of L-valine to its
D-isomer. The thioesterase domain in the C-terminal region of ACV synthetase is
responsible for the selective release of the tripeptide with the correct LLD
configuration (Kleinkauf and von Doehren, 1996).
In addition, a 4'-phosphopantetheinyl transferase (PPTase) is required to convert the
ACVS apo-enzyme into its active form by transferring a phosphopantetheinyl moiety
from coenzyme A to the conserved serine residue in carrier proteins of the three PCP
domains in ACVS (Keszenman-Pereyra et al., 2003). Based on their sequence and
substrate specificity, PPTases are generally classified into three types: AcpS-type
PPTases associated with fatty acid synthase of prokaryotes, FAS2-type PPTases,
which represent integrated domains of fatty acid synthase of eukaryotes and Sfp-type
PPTases, which are usually involved in secondary metabolism (Fichtlscherer et al.,
2000; Lambalot et al., 1996; Quadri et al., 1998b). The PPTases identified in S.
cerevisiae include Lys5 involved in lysine biosynthesis, Ppt2 specific for
mitochondrial acyl carrier protein (Ehmann et al., 1999), and the integrated PPTase in
the fatty acid synthase responsible for its own modification (Fichtlscherer et al., 2000),
which do not seem suitable for secondary metabolite production (Kealey et al., 1998).
Therefore, Sfp-type PPTase encoding genes npgA from Aspergillus nidulans reported
to be essential for penicillin biosynthesis (Keszenman-Pereyra et al., 2003), sfp from
B. subtilis, which had been proven to be a suitable candidate for heterologous co-
expression with non-ribosomal peptide and polyketide synthase genes (Quadri et al.,
1998b), and pptA from P. chrysogenum (Schoergendorfer and Kurnsteiner, 2005), the
same origin as pcbAB, the ACVS encoding gene used in this study, were chosen to be
co-expressed with pcbAB to ensure activation of the NRPS enzyme.
In the present work, we demonstrate for the first time the production of a non-
ribosomal peptide in yeast.
41
Chapter 3
26
3.2. Materials and methods
3.2.1. Strains and growth conditions
Strains used in this study are listed in Table 3.1a. Plasmid carrying strains were
maintained in synthetic dextrose (SD) minimal medium containing 6.7 g/l of yeast
nitrogen base w/o amino acids (Difco Laboratories, Sparks, MD, USA), 0.6 g/l
complete supplement mixture (CSM; w/o histidine, leucine, tryptophane, uracil) (MP
Biomedicals, Solon, OH, USA), and 2% glucose and supplemented with 20 mg/l
histidine, 60 mg/l leucine, 40 mg/l tryptophane and/or 20 mg/l uracil when
appropriate. For gene induction, strains were grown in synthetic galactose (SG)
minimal medium (SD medium containing 2% galactose instead of glucose) in baffled
shake flasks at 150 rpm.
Table 3.1a. Yeast strains used in this study Strain Genotype Reference
S. cerevisiae CEN.PK113-5D MATa MAL2-8c
SUC2 ura3-52
P. Kötter, University of Frankfurt,
Germany
S. cerevisiae CEN.PK113-9D MATa MAL2-8c
SUC2 ura3-52 trp1-289
P. Kötter, University of Frankfurt,
Germany
3.2.2. Plasmid contructions
The strategy implemented to construct the plasmids used in this study is illustrated in
Figure 3.1. Gene npgA was amplified from plasmid pDKP4832 using primers npg-1
and npg-2. The 3' end (0.9 kb) and the 5' end (3 kb) of pcbAB were amplified from
cosmid pCX3.2 (Smith et al., 1990; both pDKP4832 and pCX3.2 were kindly donated
by G. Turner, University of Sheffield. UK) using primer pairs pcbAB-2/pcbAB-4 and
pcbAB-1/pcbAB-3, respectively. All three fragments were subsequently cloned into
pESC-URA (Stratagene, La Jolla, CA, USA). The resulting plasmid was linearized
with BglII. In addition, a 12 kb SpeI fragment containing the full length pcbAB gene
was isolated from cosmid pCX3.2. Both fragments were co-transformed into S.
cerevisiae CEN.PK113-5D, thus allowing the formation of vector pESC-npgA-pcbAB
by homologous recombination.
42

Chapter 3
27
Figure 3.1. Plasmid construction. PCR product tails homologous to vector sequences are indicated as dotted lines, the codon optimized 5' end of pcbAB by a checked bar. Cloning steps that involved homologous recombination in yeast are marked as “HR”. See materials and methods for further details.
cDNA of pptA from P. chrysogenum NN P8 (kindly donated by Novo Nordisk,
Copenhagen, Denmark) was generated by means of RT-PCR using primer pair pptA-
F/pptA-R; sfp was amplified from B. subtilis DSM3256 genomic DNA using primer
pair sfp-F/sfp-R. Both primer pairs contain tails, which are homologous to the vector
sequences flanking npgA in pESC-npgA-pcbAB. NpgA in this vector was replaced
with pptA and sfp, respectively, by linearizing pESC-npgA-pcbAB with SmaI and
transforming it into CEN.PK113-9D together with the respective PCR fragment.
Hereby, plasmids pESC-pptA-pcbAB and pESC-sfp-pcbAB were formed by
homologous recombination.
Primers pcbAB-F and module1-R were used to amplify the 5' end (2.8 kb) of pcbAB,
thereby optimizing the first 27 codons of the gene with regard to the yeast codon bias.
Plasmid pESC-npgA-pcbAB was cut with NotI/EcoNI in order to eliminate the
original 5' region. Vector and PCR fragment were co-transformed into CEN.PK113-
9D to generate pESC-optpcbAB by homologous recombination as described above.
43
Chapter 3
28
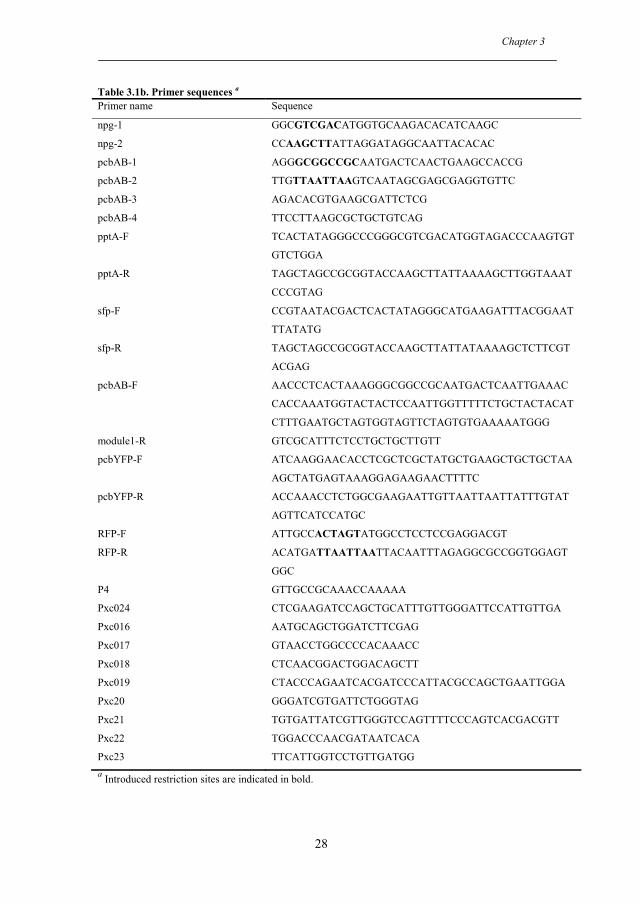
Table 3.1b. Primer sequences a Primer name Sequence
npg-1 GGCGTCGACATGGTGCAAGACACATCAAGC
npg-2 CCAAGCTTATTAGGATAGGCAATTACACAC
pcbAB-1 AGGGCGGCCGCAATGACTCAACTGAAGCCACCG
pcbAB-2 TTGTTAATTAAGTCAATAGCGAGCGAGGTGTTC
pcbAB-3 AGACACGTGAAGCGATTCTCG
pcbAB-4 TTCCTTAAGCGCTGCTGTCAG
pptA-F TCACTATAGGGCCCGGGCGTCGACATGGTAGACCCAAGTGT
GTCTGGA
pptA-R TAGCTAGCCGCGGTACCAAGCTTATTAAAAGCTTGGTAAAT
CCCGTAG
sfp-F CCGTAATACGACTCACTATAGGGCATGAAGATTTACGGAAT
TTATATG
sfp-R TAGCTAGCCGCGGTACCAAGCTTATTATAAAAGCTCTTCGT
ACGAG
pcbAB-F AACCCTCACTAAAGGGCGGCCGCAATGACTCAATTGAAAC
CACCAAATGGTACTACTCCAATTGGTTTTTCTGCTACTACAT
CTTTGAATGCTAGTGGTAGTTCTAGTGTGAAAAATGGG
module1-R GTCGCATTTCTCCTGCTGCTTGTT
pcbYFP-F ATCAAGGAACACCTCGCTCGCTATGCTGAAGCTGCTGCTAA
AGCTATGAGTAAAGGAGAAGAACTTTTC
pcbYFP-R ACCAAACCTCTGGCGAAGAATTGTTAATTAATTATTTGTAT
AGTTCATCCATGC
RFP-F ATTGCCACTAGTATGGCCTCCTCCGAGGACGT
RFP-R ACATGATTAATTAATTACAATTTAGAGGCGCCGGTGGAGT
GGC
P4 GTTGCCGCAAACCAAAAA
Pxc024 CTCGAAGATCCAGCTGCATTTGTTGGGATTCCATTGTTGA
Pxc016 AATGCAGCTGGATCTTCGAG
Pxc017 GTAACCTGGCCCCACAAACC
Pxc018 CTCAACGGACTGGACAGCTT
Pxc019 CTACCCAGAATCACGATCCCATTACGCCAGCTGAATTGGA
Pxc20 GGGATCGTGATTCTGGGTAG
Pxc21 TGTGATTATCGTTGGGTCCAGTTTTCCCAGTCACGACGTT
Pxc22 TGGACCCAACGATAATCACA
Pxc23 TTCATTGGTCCTGTTGATGG a Introduced restriction sites are indicated in bold.
44

Chapter 3
29
The YFP encoding gene was amplified from plasmid pWJ1164 (Reid et al., 2002)
using primers pcbYFP-F and pcbYFP-R, thereby introducing a short linker sequence
in front of the YFP start codon. Plasmids pESC-npgA-pcbAB and pESC-optpcbAB
were linearised by restriction with PacI and transformed into CEN.PK113-9D
together with the PCR fragment. The tails added to both PCR primers allowed the
formation of plasmids pESC-pcbYFP and pESC-optpcbYFP by homologous
recombination.
Primers RFP-F and RFP-R were used to amplify the RFP encoding DNA sequence
from plasmid pWJ1350 (Lisby et al., 2003). A 9 bp sequence encoding the
peroxisomal targeting signal, SKL, was introduced upstream of the RFP stop codon.
Both PCR fragment and vector pESC-TRP (Stratagene) were cut with SpeI/PacI and
ligated to generate plasmid pESC-RFPSKL.
All plasmid constructs were verified by sequencing (MWG, Martinsried, Germany)
(Table 3.1b).
3.2.3. Chromosomal integration of pcbAB and npgA
Three fragments were generated for integration at position YCRWdelta11 (Figure
3.2). Fragment 1 is the result of a fusion of two PCR products: the upstream flank of
the integration site, which was amplified from genomic DNA using primer pair
P4/Pxc024, and npgA including GAL1 promoter and CYC1 terminator, which was
amplified from plasmid pESC-npgA-pcbAB using primers Pxc016 and Pxc017. Since
a tail had been added to primer Pxc024, both PCR products shared an overlapping
sequence that allowed them to fuse in an additional PCR using the outer primers for
amplification. Accordingly, fragment 3 was produced through fusion PCR of three
PCR products: the 3' region of pcbAB and the ADH1 terminator amplified from
pESC-npgA-pcbAB with primers Pxc018 and Pxc019, the Kluyveromyces lactis
URA3 locus with direct repeats amplified from vector pWJ1042 (Reid et al., 2002)
using primer pair Pxc20/Pxc21, and the downstream flank of the integration site
amplified with primers Pxc22 and Pxc23. Fragment 2 containing the bi-directional
GAL1/GAL10 promoter and the pcbAB gene was isolated from vector pESC-npgA-
45

Chapter 3
30
pcbAB after restriction with XmaI/PacI. Co-transformation of all three fragments
enabled chromosomal integration by homologous recombination at four positions as
indicated in Figure 3.2. Correct integration was confirmed by PCR and sequencing of
the resulting PCR products. Subsequently, the cells were cultivated on plates
containing 5-fluoroorotic acid (5-FOA). This led to the selection of clones that had
lost the K.l. URA3 marker via homologous recombination between the two flanking
direct repeats.
Figure 3.2. Chromosomal integration of npgA and pcbAB: direct repeats flanking K.l. URA3 are indicated as black bars. P1P10, bi-directional GAL1/GAL10 promoter; TA, ADH1 terminator; TC, CYC1 terminator; up, upstream flank; down, downstream flank and 5-FOA, 5-fluoroorotic acid. Dotted lines indicate primary PCR products, which were fused to generate fragments 1 and 2.
3.2.4. Fluorescence microscopy
Cells were harvested by centrifugation, washed in SG medium and mixed with an
equal volume of 1.2% (w/v) low melting agarose (Cambrex, Rockland, ME, USA) on
a microscope slide for immobilisation. In order to visualize DNA 10 µg/ml 4',6-
diamidino-2-phenylindole (DAPI) (Sigma-Aldrich, St. Louis, MO, USA) was added
to the cultures 30 min before harvesting. Live cell images were captured with a cooled
mono-12-bit QImaging Retiga EXi camera mounted on a Nikon Eclipse E1000
microscope. All images were captured using a Nikon Plan Flour 100 x, 1.30
46

Chapter 3
31
numerical aperture objective lens. The illumination source was a 12V 100W LL
mercury lamp. Images were acquired using Image Pro Plus 5.1 software (Media
Cybernetics, Bethesda, MD, USA).
3.2.5. LC-MS analysis of ACV formation
Yeast strains expressing ACVS and a PPTase were grown in shake flasks containing
SG medium. 30 ml of culture were harvested at late exponential or early stationary
growth phase by centrifugation and cells were re-dissolved in 1 ml methanol.
Mechanical disruption of the cells was achieved using glass beads and a Savant
FastPrep FP120 at speed 4 for 5×30 s. After centrifugation, the supernatant was run at
20 °C on HPLC (Agilent 1100)-MS (Micromass LCT) with Phenomenex Gemini 3u
C6-Phenyl 110A 50×2 mm column (with 2 mm guard column). A linear gradient of
H2O (containing 20 mM formic acid) and methanol (containing 20 mM formic acid)
was used. The gradient was changed from 0 % methanol to 100 % over 20 min and
then maintained at 100 % methanol for 5 min before returning to starting conditions.
The flow rate was 0.3 ml/min. Mass spectra were collected from m/z 100 to 900. As a
standard, ACV (Sigma-Aldrich) dissolved in methanol was used.
To compare ACV formation in different strains or at different conditions the area of
the ACV peak was normalized to OD600 of the culture at harvesting and the harvested
culture volume.
3.3. Results
3.3.1. Expression of ACVS and PPTase in S. cerevisiae
The P. chrysogenum ACVS encoding gene pcbAB and the A. nidulans PPTase
encoding gene npgA were cloned into the pESC-URA vector containing a bi-
directional galactose-inducible GAL1/GAL10 promoter. S. cerevisiae strain CEN.PK
119-9D was transformed with the resulting plasmid. Strains were grown in SG
medium containing galactose as sole carbon source at 30 °C. Transformants
harbouring pESC-npgA-pcbAB showed no significant differences in the growth rate
47
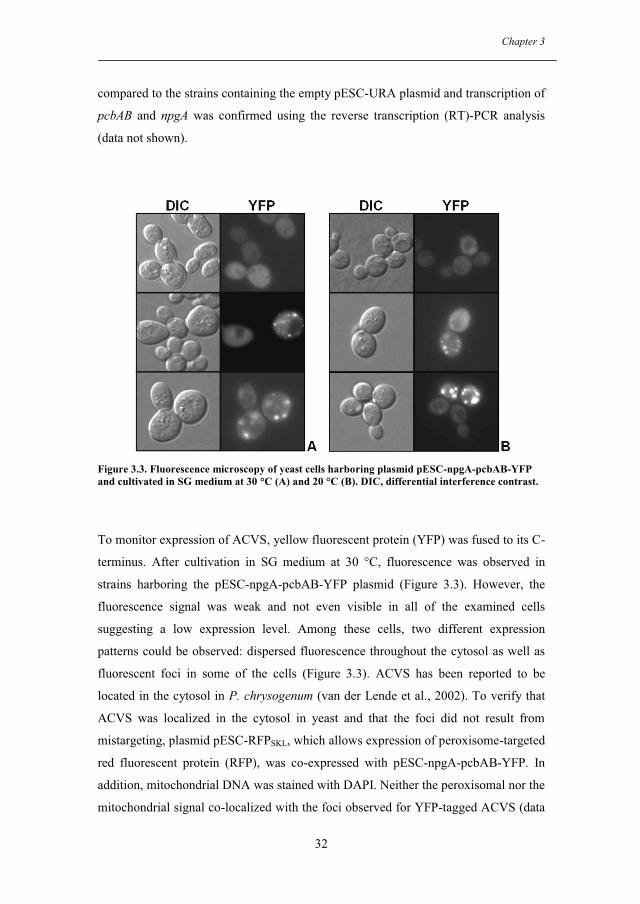
Chapter 3
32
compared to the strains containing the empty pESC-URA plasmid and transcription of
pcbAB and npgA was confirmed using the reverse transcription (RT)-PCR analysis
(data not shown).
Figure 3.3. Fluorescence microscopy of yeast cells harboring plasmid pESC-npgA-pcbAB-YFP and cultivated in SG medium at 30 °C (A) and 20 °C (B). DIC, differential interference contrast.
To monitor expression of ACVS, yellow fluorescent protein (YFP) was fused to its C-
terminus. After cultivation in SG medium at 30 °C, fluorescence was observed in
strains harboring the pESC-npgA-pcbAB-YFP plasmid (Figure 3.3). However, the
fluorescence signal was weak and not even visible in all of the examined cells
suggesting a low expression level. Among these cells, two different expression
patterns could be observed: dispersed fluorescence throughout the cytosol as well as
fluorescent foci in some of the cells (Figure 3.3). ACVS has been reported to be
located in the cytosol in P. chrysogenum (van der Lende et al., 2002). To verify that
ACVS was localized in the cytosol in yeast and that the foci did not result from
mistargeting, plasmid pESC-RFPSKL, which allows expression of peroxisome-targeted
red fluorescent protein (RFP), was co-expressed with pESC-npgA-pcbAB-YFP. In
addition, mitochondrial DNA was stained with DAPI. Neither the peroxisomal nor the
mitochondrial signal co-localized with the foci observed for YFP-tagged ACVS (data
48

Chapter 3
33
not shown). Thus, ACVS appears to be located in the cytosol when expressed in S.
cerevisiae and the observation of foci indicates the formation of protein aggregates.
3.3.2. Production of ACV in S. cerevisiae
Yeast strains harbouring ACVS and PPTase expression plasmid pESC-npgA-pcbAB
were grown at 30 °C in shake flasks containing SG medium. As a negative control
strains containing plasmid pESC-URA were cultivated under the same conditions.
Methanol extracts from cells harvested at late exponential growth phase were
analysed by LC-MS using pure ACV as a standard. ACV elutes at 6.6 min with a
predominant ion at m/z 364.15, which corresponds to its protonated molecular ion. As
shown in Figure 3.4, a peak with a similar m/z and retention time as the ACV standard
was observed in the spectra from strains containing plasmid pESC-npgA-pcbAB,
while no such peak was found in spectra from strains containing plasmid pESC-URA.
The LC-MS results thus demonstrate the production of ACV in yeast strains
expressing ACVS and PPTase.
When measuring the ACV content at different time points, we saw a decline during
stationary phase (data not shown). Hence, all further cultivations for product detection
were harvested in late exponential or early stationary phase.
For comparison of different strains and different conditions, ACV concentrations are
given in arbitrary units in the following since the extraction method used in this study
has not been thoroughly validated yet. However, assuming a 100% recovery, the
measured ACV concentrations are in the range of 1µg - 1 mg/g dry cell weight.
49

Chapter 3
34
Figure 3.4. LC-MS analysis: ion traces for m/z 364.15 of metabolites extracted from a strain carrying the pESC-npgA-pcbAB plasmid (A), of metabolites extracted from a strain carrying the pESC-URA plasmid (B) and of the ACV standard (C).
3.3.3. Enhancement of ACV production in S. cerevisiae
The ACV concentrations measured in producing yeast strains were often close to the
detection limit. Therefore, three approaches were followed to enhance ACV
production in S. cerevisiae: (i) implementation of three different PPTases to ensure
optimal transfer of the 4'-phosphopantetheine cofactor, (ii) codon optimization of the
5' end of pcbAB to increase the translation efficiency and (iii) lowering the cultivation
temperature to improve protein folding.
In the first approach, two PPTases different from NpgA were expressed together with
ACVS: PptA, the native activator of P. chrysogenum ACVS and Sfp, a broad
specificity PPTase of B. subtilis. For this purpose, the npgA gene in plasmid pESC-
npgA-pcbAB was replaced with pptA and sfp. Yeast harboring plasmids pESC-npgA-
pcbAB, pESC-pptA-pcbAB and pESC-sfp-pcbAB were cultivated at 30 ºC and cell
extracts were analysed by LC-MS. The results showed that implementation of
different PPTases had no influence on the ACV production in yeast (Table 3.2a).
50

Chapter 3
35
Codon optimization of the 5' end of the coding sequence can assist to improve the
yield of a heterologously expressed protein (Batard et al., 2000; Johansson et al., 1999;
Mutka et al., 2005). Since the 5' region of pcbAB contains a number of rare codons
(codons used < 13 times per 1000 codons in the yeast genome; Carlini, 2005), 20 out
of its first 27 codons were replaced by synonymous codons preferred in S. cerevisiae.
Strains harboring plasmid pESC-optpcbAB and strains containing plasmid pESC-
npgA-pcbAB were cultivated at 30 ºC. Cell extracts were analyzed by LC-MS. A
slight increase in ACV production was observed, which was however not statistically
significant (Table 3.2a).
Table 3.2a. ACV production of plasmid carrying strains at 30�C a Plasmid ACV (arbitrary units) SD
pESC-npgA-pcbAB 40.8 28.5
pESC-pptA-pcbAB 40.7 18.5
pESC-sfp-pcbAB 48.8 16.9
pESC-optpcbAB 83.2 30.9 a ACV was measured in two to six independent cultures of each type of strain and experiments were at
least performed twice.
The protein aggregates observed for YFP-tagged ACVS may represent the result of an
improper folding process. Protein misfolding problems can often be compensated by
growing cells at low temperature (Li et al., 2001; Weickert et al., 1997). To
investigate the influence of low temperature cultivation on protein aggregation, yeast
strains expressing ACVS-YFP were cultivated at 30 °C and 20 °C. Growth at 20 °C
seemed to enhance the fluorescence intensity as observed under the microscope (not
shown). However, the cells still contained ACVS-YFP aggregates indicated by the
presence of fluorescent foci (Figure 3.3).
Even though low temperature cultivation did not prevent the formation of protein
aggregates, it had a pronounced effect on the ACV production level. Cell extracts of
strains carrying plasmid pESC-optpcbAB and grown at 30 °C, 20 °C and 15 °C were
analyzed by LC-MS. Strains grown at 20 °C had a 30-fold higher ACV content than
those cultivated at 30 °C while there was no further improvement in ACV production
by lowering the cultivation temperature from 20 °C to 15 °C (Table 3.2b).
51

Chapter 3
36
When the strains containing either the original or the codon optimised version of
ACVS were cultivated at 20 °C, no significant differences in ACV production were
observed (Table 3.2c). The same was true for the strains expressing either of the three
different PPTases at low temperature cultivation (data not shown).
3.3.4. Chromosomal integration
In order to investigate the effect of gene dosage on ACV production in yeast, we
constructed strains containing a single copy of the ACVS and PPTase encoding genes.
PcbAB and npgA were integrated into the yeast genome (Figure 3.2). To reduce the
possibility of affecting the expression of other genes a long terminal repeat (LTR),
which marks the previous position of a retrotransposon, was chosen as the integration
site in this study. The GAL1/GAL10 promoter already used in the pESC-npgA-pcbAB
construct was also used in the integrated strain, to obtain controlled gene expression.
The integrated strain as well as the plasmid containing strain harboring pESC-npgA-
pcbAB, were cultivated at 20 ºC. The LC-MS results showed that ACV production in
the integrated strain was about 6-fold lower than that observed in the plasmid carrying
strain (Table 3.2d).
Table 3.2b. ACV production of pESC-optpcbAB containing strains a
Temperature (�C) ACV (arbitrary units) SD
30 255 61
20 9158 1148
15 7514 1846 a ACV was measured in two to six independent cultures of each type of strain and experiments were at
least performed twice.
Table 3.2c. ACV production of plasmid carrying strains at 20�C a Plasmid ACV (arbitrary units) SD
pESC-npgA-pcbAB 8004 1566
pESC-optpcbAB 9312 875 a ACV was measured in two to six independent cultures of each type of strain and experiments were at
least performed twice.
52
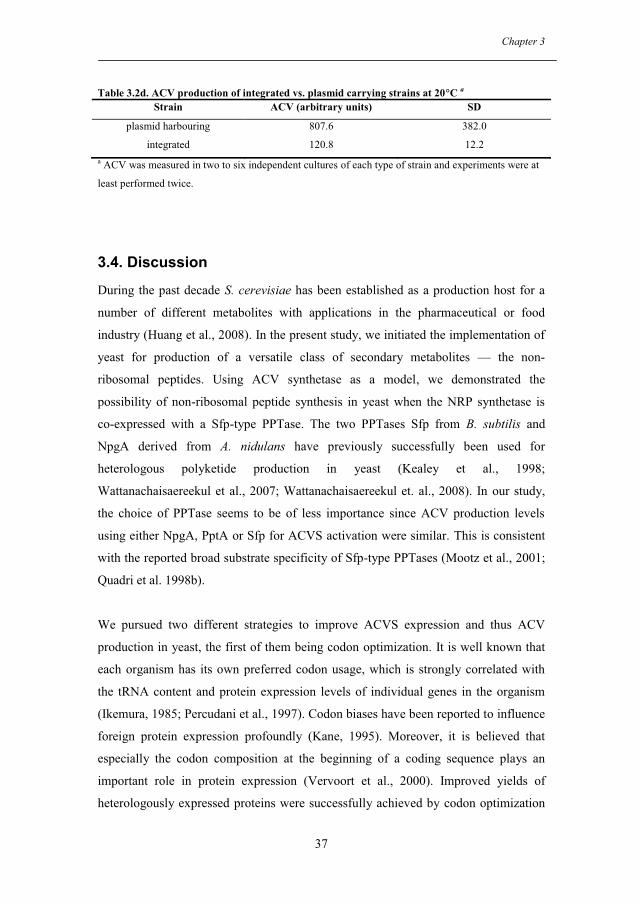
Chapter 3
37
Table 3.2d. ACV production of integrated vs. plasmid carrying strains at 20�C a Strain ACV (arbitrary units) SD
plasmid harbouring 807.6 382.0
integrated 120.8 12.2 a ACV was measured in two to six independent cultures of each type of strain and experiments were at
least performed twice.
3.4. Discussion
During the past decade S. cerevisiae has been established as a production host for a
number of different metabolites with applications in the pharmaceutical or food
industry (Huang et al., 2008). In the present study, we initiated the implementation of
yeast for production of a versatile class of secondary metabolites –– the non-
ribosomal peptides. Using ACV synthetase as a model, we demonstrated the
possibility of non-ribosomal peptide synthesis in yeast when the NRP synthetase is
co-expressed with a Sfp-type PPTase. The two PPTases Sfp from B. subtilis and
NpgA derived from A. nidulans have previously successfully been used for
heterologous polyketide production in yeast (Kealey et al., 1998;
Wattanachaisaereekul et al., 2007; Wattanachaisaereekul et. al., 2008). In our study,
the choice of PPTase seems to be of less importance since ACV production levels
using either NpgA, PptA or Sfp for ACVS activation were similar. This is consistent
with the reported broad substrate specificity of Sfp-type PPTases (Mootz et al., 2001;
Quadri et al. 1998b).
We pursued two different strategies to improve ACVS expression and thus ACV
production in yeast, the first of them being codon optimization. It is well known that
each organism has its own preferred codon usage, which is strongly correlated with
the tRNA content and protein expression levels of individual genes in the organism
(Ikemura, 1985; Percudani et al., 1997). Codon biases have been reported to influence
foreign protein expression profoundly (Kane, 1995). Moreover, it is believed that
especially the codon composition at the beginning of a coding sequence plays an
important role in protein expression (Vervoort et al., 2000). Improved yields of
heterologously expressed proteins were successfully achieved by codon optimization
53

Chapter 3
38
of the 5' end of the coding sequence in E. coli (Johansson et al., 1999) and yeast
(Batard et al., 2000; Mutka et al., 2005). Optimization of as few as the first 14 codons
was reported to enhance the expression of G+C-rich genes (Mutka et al., 2005). By
contrast, changing the first 27 codons of ACVS with regard to the yeast codon bias
had no significant effect on ACV production. However, codon optimization of further
regions of pcbAB with a high frequency of codons rarely used in yeast or even the
complete gene may still be a promising tool to enhance the ACV production level.
In a second strategy, which is commonly used in heterologous protein production, we
lowered the cultivation temperature of the ACVS expressing yeast strains. Expression
of heterologous proteins in biological hosts often results in problems with improper
folding (Dobson and Karplus, 1999), which may result in low yield or activity of the
enzyme and hereby in a low production level of the desired product. These misfolding
problems can often be reduced by growing cells at low temperature (Gidijala et al.,
2008; Li et al., 2001; Weickert et al., 1997). Our results on fluorescence microscopy
of cells expressing an ACVS-YFP fusion protein indicated possible folding problems
during ACVS expression in yeast. As expected, fluorescence occurred in the cytosol,
albeit partially in the form of foci indicating the formation of insoluble aggregates
potentially as a result of an improper folding process. Reducing the cultivation
temperature from 30 to 20 �C profoundly increased the ACV production level by a
factor of 30 supporting the theory of improved protein folding conditions at low
temperature. However, low cultivation temperature did not inhibit the formation of
ACVS-YFP aggregates. Investigations on bacterial inclusion bodies have shown that
heterologous proteins occurring in the form of aggregates may still be properly folded
(Ventura and Villaverde, 2006) and that not only protein solubility is influenced by
growth temperature, but also conformational quality of recombinant proteins, even in
the insoluble fraction (Vera et al., 2007).
When integrating the ACVS and PPTase encoding genes into the chromosomal DNA
another rate-limiting factor for ACV production in S. cerevisiae was detected – the
gene copy number. Integrated strains produced 6 times less ACV than plasmid
carrying strains. On the other hand, chromosomal integration bears the advantage of
54

Chapter 3
39
higher mitotic stability in comparison to plasmid-based expression. Thus, multiple
copy integration could be considered.
We noticed a relatively high variation in ACV production of the same strains in
different experiments (see also Tables 3.2a-3.2d), probably due to even slight
differences in experimental conditions, leaving room for further improvement
strategies.
In general, the present study represents a basis for a further development of S.
cerevisiae as a cell factory for production of NRPs that are difficult to produce with
their natural hosts. As a eukaryote, yeast may in many cases be a better candidate for
the synthesis of antibiotics than prokaryotic expression systems. The easy amenability
of yeast for genetic manipulation will allow a fast construction of new NRPSs
containing specific point mutations or exchanged domains for the development of
new NRPs with new or improved properties and metabolic engineering can help to
reach suitable production levels within a reasonable amount of time (Chemler and
Koffas, 2008; Huang et al., 2008; Olano et al., 2008).
Acknowledgements
XC was financially supported by a scholarship obtained from the Technical
University of Denmark.
We would like to thank Hanne Jakobsen for excellent technical assistance as well as
Kristian Fog Nielsen and Jørn Smedsgaard for helpful discussions.
55

Chapter 3
40
References
Batard, Y., Hehn, A., Nedelkina, S., Schalk, M., Pallett, K., Schaller, H., Werck-
Reichhart, D., 2000. Increasing expression of P450 and P450-reductase
proteins from monocots in heterologous systems. Arch. Biochem. Biophys.
379, 161-169.
Byford, M.F., Baldwin, J.E., Shiau, C.Y., Schofield, C.J., 1997. The mechanism of
ACV Synthetase. Chem. Rev. 97, 2631-2650.
Carlini, D.B. 2005. Context-dependent codon bias and messenger RNA longevity in
the yeast transcriptome. Mol. Biol. Evol. 22, 1403-1411.
Chemler, J.A., Koffas, M.A.G. 2008. Metabolic engineering for plant natural product
biosynthesis in microbes. Curr. Opin. Biotechnol. 19, 597-605.
Dobson, C.M., Karplus, M., 1999. The fundamentals of protein folding: bringing
together theory and experiment. Curr. Opin. Struct. Biol. 9, 92-101.
Ehmann, D.E., Gehring, A.M., Walsh, C.T., 1999. Lysine biosynthesis in
Saccharomyces cerevisiae: mechanism of alpha-aminoadipate reductase
(Lys2) involves posttranslational phosphopantetheinylation by Lys5.
Biochemistry 38, 6171-6177.
Eppelmann, K., Doekel, S., Marahiel, M.A., 2001. Engineered biosynthesis of the
peptide antibiotic bacitracin in the surrogate host Bacillus subtilis. J. Biol.
Chem. 276, 34824-34831.
Fichtlscherer, F., Wellein, C., Mittag, M., Schweizer, E., 2000. A novel function of
yeast fatty acid synthase. Subunit alpha is capable of self-pantetheinylation.
Eur. J. Biochem. 267, 2666-2671.
Gidijala, L., Bovenberg, R.A.L., Klaassen, P., van der Klei, I.J., Veenhuis, M., Kiel,
J.A.K.W., 2008. Production of functionally active Penicillium chrysogenum
isopenicillin N synthase in the yeast Hansenula polymorpha. BMC
Biotechnol. 8, 29.
Huang, B., Guo, J., Yi, B., Yu, X., Sun, L., Chen, W., 2008. Heterologous production
of secondary metabolites as pharmaceuticals in Saccharomyces cerevisiae.
Biotechnol. Lett. 30, 1121-1137.
Ikemura, T., 1985. Codon usage and tRNA content in unicellular and multicellular
organisms. Mol. Biol. Evol. 2, 13-34.
56
Chapter 3
41
Johansson, A.S., Bolton-Grob, R., Mannervik, B., 1999. Use of silent mutations in
cDNA encoding human glutathione transferase M2-2 for optimized expression
in Escherichia coli. Protein Expr. Purif. 17, 105-112.
Kane, J.F., 1995. Effects of rare codon clusters on high-level expression of
heterologous proteins in Escherichia coli. Curr. Opin. Biotechnol. 6, 494-500.
Kealey, J.T., Liu, L., Santi, D.V., Betlach, M.C., Barr, P.J., 1998. Production of a
polyketide natural product in nonpolyketide-producing prokaryotic and
eukaryotic hosts. Proc. Natl. Acad. Sci. USA 95, 505-509.
Keszenman-Pereyra, D., Lawrence, S., Twfieg, M.E., Price, J., Turner, G., 2003. The
npgA/ cfwA gene encodes a putative 4'-phosphopantetheinyl transferase which
is essential for penicillin biosynthesis in Aspergillus nidulans. Curr. Genet. 43,
186-190.
Kleinkauf, H., von Doehren, H., 1996. A nonribosomal system of peptide
biosynthesis. Eur. J. Biochem. 236, 335-351.
Lambalot, R.H., Gehring, A.M., Flugel, R.S., Zuber, P., LaCelle, M., Marahiel, M.A.,
Reid, R., Khosla, C., Walsh, C.T., 1996. A new enzyme superfamily - the
phosphopantetheinyl transferases. Chem. Biol. 3, 923-936.
Li, Z., Xiong, F., Lin, Q., d'Anjou, M., Daugulis, A.J., Yang, D.S., Hew, C.L., 2001.
Low-temperature increases the yield of biologically active herring antifreeze
protein in Pichia pastoris. Protein Expr. Purif. 21, 438-445.
Lisby, M., Mortensen, U.H., Rothstein, R., 2003. Colocalization of multiple DNA
double-strand breaks at a single Rad52 repair centre. Nat. Cell Biol. 5, 572-
577.
Molnar, I., Schupp, T., Ono, M., Zirkle, R.E., Milnamow, M., Nowak-Thompson, B.,
Engel, N., Toupet, C., Stratmann, A., Cyr, D.D., Gorlach, J., Mayo, J.M., Hu,
A., Goff, S., Schmid, J., Ligon, J.M., 2000. The biosynthetic gene cluster for
the microtubule-stabilizing agents epothilones A and B from Sorangium
cellulosum So ce90. Chem. Biol. 7, 97-109.
Mootz, H.D., Finking, R., Marahiel, M.A., 2001. 4'-Phosphopantetheine transfer in
primary and secondary metabolism of Bacillus subtilis. J. Biol. Chem. 276,
37289-37298.
57

Chapter 3
42
Mutka, S.C., Bondi, S.M., Carney, J.R., Da Silva, N.A., Kealey, J.T., 2005. Metabolic
pathway engineering for complex polyketide biosynthesis in Saccharomyces
cerevisiae. FEMS Yeast Res. 6, 40-47.
Olano, C., Lombó, F., Méndez, C., Salas, J.A. 2008. Improving production of
bioactive secondary metabolites in actinomycetes by metabolic engineering.
Metab. Eng. 10, 281-292.
Percudani, R., Pavesi, A., Ottonello, S., 1997. Transfer RNA gene redundancy and
translational selection in Saccharomyces cerevisiae. J. Mol. Biol. 268, 322-
330.
Quadri, L.E., Sello, J., Keating, T.A., Weinreb, P.H., Walsh, C.T., 1998a.
Identification of a Mycobacterium tuberculosis gene cluster encoding the
biosynthetic enzymes for assembly of the virulence-conferring siderophore
mycobactin. Chem. Biol. 5, 631-645.
Quadri, L.E., Weinreb, P.H., Lei, M., Nakano, M.M., Zuber, P., Walsh, C.T., 1998b.
Characterization of Sfp, a Bacillus subtilis phosphopantetheinyl transferase for
peptidyl carrier protein domains in peptide synthetases. Biochemistry 37,
1585-1595.
Reid, R., Lisby, M., Rothstein, R., 2002. Cloning-free genome alterations in
Saccharomyces cerevisiae using adaptamer-mediated PCR. Methods Enzymol.
350, 258-77.
Schoergendorfer, K., Kurnsteiner, H., 2005. New isolated Penicillium chrysogenum
4'-phosphopantethein transferase PPTase protein, useful for producing
penicillin G or penicillin V. Patent WO2005040369.
Schwarzer, D., Finking, R., Marahiel, M.A., 2003. Nonribosomal peptides: from
genes to products. Nat. Prod. Rep. 20, 275-287.
Sieber, S.A., Marahiel, M.A., 2005. Molecular mechanisms underlying nonribosomal
peptide synthesis: approaches to new antibiotics. Chem. Rev. 105, 715-738.
Smith, D.J., Earl, A.J., Turner, G., 1990. The multifunctional peptide synthetase
performing the first step of penicillin biosynthesis in Penicillium chrysogenum
is a 421,073 dalton protein similar to Bacillus brevis peptide antibiotic
synthetases. EMBO J. 9, 2743-2750.
van der Lende, T.R., van de Kamp, M., van den Berg, M., Sjollema, K., Bovenberg,
R.A.L., Veenhuis, M., Konings, W.N., Driessen, A.J.M., 2002. �-(L-�-
58

Chapter 3
43
Aminoadipyl)-L-cysteinyl-D-valine synthetase, that mediates the first
committed step in penicillin biosynthesis, is a cytosolic enzyme. Fungal
Genet. Biol. 37, 49-55.
van Wageningen, A.M., Kirkpatrick, P.N., Williams, D.H., Harris, B.R., Kershaw,
J.K., Lennard, N.J., Jones, M., Jones, S.J., Solenberg, P.J., 1998. Sequencing
and analysis of genes involved in the biosynthesis of a vancomycin group
antibiotic. Chem. Biol. 5, 155-162.
Ventura, S., Villaverde, A., 2006. Protein quality in bacterial inclusion bodies. Trends
Biotechnol. 24, 179-185.
Vera, A., González-Montalbán, N., Arís, A., Villaverde, A., 2007. The
conformational quality of insoluble recombinant proteins is enhanced at low
growth temperatures. Biotechnol. Bioeng. 96, 1101-1106.
Vervoort, E.B., van Ravestein, A., van Peij, N.N.M.E., Heikoop, J.C., van Haastert,
P.J.M., Verheijden, G.F., Linskens, M.H.K., 2000. Optimizing heterologous
expression in Dictyostelium: importance of 5' codon adaptation. Nucleic Acids
Res. 28, 2069-2074.
Wattanachaisaereekul, S., Lantz, A.E., Nielsen, M.L., Andrésson, O.S., Nielsen, J.,
2007. Optimization of heterologous production of the polyketide 6-MSA in
Saccharomyces cerevisiae. Biotechnol. Bioeng. 97, 893-900.
Wattanachaisaereekul, S., Lantz, A.E., Nielsen, M.L., Nielsen, J., 2008. Production of
the polyketide 6-MSA in yeast engineered for increased malonyl-CoA supply.
Metab. Eng. 10, 246-254.
Weber, G., Leitner, E., 1994. Disruption of the cyclosporin synthetase gene of
Tolypocladium niveum. Curr. Genet. 26, 461-467.
Weickert, M.J., Pagratis, M., Curry, S.R., Blackmore, R., 1997. Stabilization of
apoglobin by low temperature increases yield of soluble recombinant
hemoglobin in Escherichia coli. Appl. Environ. Microbiol. 63, 4313-4320.
59

Chapter 3
44
60

Chapter 4
45
Chapter 4. Increased isobutanol production in Saccharomyces cerevisiae by overexpression of genes in valine metabolism
Xiao Chen*, Kristian Fog Nielsen, Irina Borodina, Morten C. Kielland-Brandt,
Kaisa Karhumaa
Submitted to Biotechnology for Biofuels
Abstract
Background
Isobutanol can be a better biofuel than ethanol due to its higher energy density and
lower hygroscopicity. Furthermore, the branched-chain structure of isobutanol gives a
higher octane number than the isomeric n-butanol. Saccharomyces cerevisiae was
chosen as the production host because of its relative tolerance to alcohols, robustness
in industrial fermentations, and the possibility for future combination of isobutanol
production with fermentation of lignocellulosic materials.
Results
The yield of isobutanol was improved from 0.16 to 0.97 mg per g glucose by
simultaneous overexpression of biosynthetic genes ILV2, ILV3, and ILV5 in valine
metabolism in anaerobic fermentation of glucose in mineral medium in S. cerevisiae.
Isobutanol yield was further improved by two times by the additional overexpression
of BAT2, encoding the cytoplasmic branched-chain amino acid aminotransferase.
Overexpression of ILV6, encoding the regulatory subunit of Ilv2, in the ILV2 ILV3
ILV5 overexpression strain decreased isobutanol production yield by three times. In
aerobic cultivations in shake flasks in mineral medium, the isobutanol yield of the
ILV2 ILV3 ILV5 overexpression strain and the reference strain were 3.86 and 0.28 mg
per g glucose, respectively. They were increased to 4.12 and 2.4 mg per g glucose in
YPD complex medium under aerobic conditions, respectively.
61

Chapter 4
46
Conclusions
Overexpression of genes ILV2, ILV3, ILV5, and BAT2 in valine metabolism led to an
increase in isobutanol production in S. cerevisiae. Additional overexpression of ILV6
in the ILV2 ILV3 ILV5 overexpression strain had a negative effect, presumably by
increasing the sensitivity of Ilv2 to valine inhibition, thus weakening the positive
impact of overexpression of ILV2, ILV3, and ILV5 on isobutanol production.
Aerobic cultivations of the ILV2 ILV3 ILV5 overexpression strain and the reference
strain showed that supplying amino acids in cultivation media gave a substantial
improvement in isobutanol production for the reference strain, but not for the ILV2
ILV3 ILV5 overexpression strain. This result implies that other constraints besides the
enzyme activities for the supply of 2-ketoisovalerate may become bottlenecks for
isobutanol production after ILV2, ILV3, and ILV5 have been overexpressed, which
most probably include the valine inhibition to Ilv2.
4.1. Background
Environmentally friendly production of biofuels is a target of great interest due to
climate change and the need for renewable transportation fuels. Microbial production
of chemicals to be used as liquid biofuels will allow the use of renewable raw
materials such as lignocellulose. Optimally, biomass from agricultural and forestry
waste products could be used as raw material.
Bioethanol is the most established biofuel, with existing commercial production.
Several pilot plants are in operation for lignocellulosic ethanol production in several
countries. However, the chemical properties of ethanol, such as high tendency to
absorb water, are not optimal for all purposes. For many purposes, such as jet fuel,
better properties are required with regard to hygroscopicity and energy density.
Higher alcohols, such as n-butanol and isobutanol, represent possible alternatives.
Compared with n-butanol, isobutanol has the advantage of having a higher octane
number, and the possibility of usage also outside the fuel industry [1].
62
Chapter 4
47
Microbial production of isobutanol has been studied in food fermentations and
alcoholic beverages for flavor profiling since the 1970s [2, 3]. In recent years,
production of isobutanol was investigated as a biofuel in engineered Escherichia coli
to reach a concentration of 22 g/L during aerobic cultivations [4]. However, as
isobutanol concentrations over 15 g/L are toxic to E. coli [5], this concentration may
also be close to the maximal possible production in this bacterium. Since
Corynebacterium glutamicum is more tolerant to isobutanol than is E. coli, it was
engineered as a host and produced about 4 g/L of isobutanol in the presence of
oxygen [5]. Yeast is well known to be tolerant to alcohols. Saccharomyces cerevisiae
is tolerant to up to 20% ethanol [6]. In a test of many microbial strains for butanol
tolerance, baker’s yeast S. cerevisiae and Lactobacilli were the only microbes able to
grow in butanol concentrations higher than 20 g/l [7]. In addition, yeast is relatively
robust in other respects, commonly used in fermentations with harsh conditions, and
its outstanding performance in lignocellulosic hydrolysates would enable future
combination of the higher alcohol production with fermentation of lignocellulosic
materials. Yeast naturally produces small amounts of higher alcohols through the
degradation of amino acids [8, 9], such as isobutanol among others [2, 3]. These are
of great importance in the flavor profiles of beer and wine, as they generate desired
fruity aromas to these products when produced in favorable amounts. Use of a host
that naturally produces isobutanol may in principle offer an opportunity to avoid the
use of heterologous pathways, which often require extensive work for optimal
expression. According to all these advantages, S. cerevisiae is a potential alternative
host for higher alcohol production.
We studied the effect of concomitant overexpression of several structural genes from
the endogenous yeast valine biosynthetic pathway (Figure 4.1) for anaerobic
isobutanol production in S. cerevisiae. It is well studied how yeast can convert valine
to isobutanol [9], in other words isobutanol is a side product of valine synthesis, and
our interest was whether increased flux in the valine biosynthetic pathway would
increase isobutanol production. Isobutanol can be produced from pyruvate via
formation of 2-ketoisovalerate (Figure 4.1). First, acetolactate synthase (Ilv2+Ilv6)
converts 2 molecules of pyruvate to 2-acetolactate, which is then reduced to 2,3-
dihydroxy-isovalerate by acetohydroxyacid reductoisomerase (Ilv5). Further, 2,3-
63

Chapter 4
48
dihydroxy-isovalerate is converted to 2-ketoisovalerate by dihydroxyacid dehydratase
(Ilv3). Ilv6 is the regulatory subunit of acetolactate synthase and an enhancer of Ilv2
catalytic activity. The bidirectional reaction between 2-ketoisovalerate and valine is
catalyzed by the branched-chain amino acid aminotransferases (Bat1 and Bat2,
present in the mitochondrial matrix and the cytosol, respectively). At last the 2-
ketoisovalerate is converted to isobutanol by pyruvate decarboxylases (PDC) and
alcohol dehydrogenases (ADH). We have here used overexpression of the valine
pathway genes ILV2, ILV3, and ILV5 to generate a 6-fold higher isobutanol yield. The
finding that the isobutanol production in yeast that ferments a rich, complex medium
could be increased by overexpression of Bat2 [10] prompted us to overexpress BAT2
additional to the overexpression of ILV2, ILV3, and ILV5 in synthetic medium. This
turned out to increase isobutanol production further by two fold. However,
overexpression of ILV6, encoding the regulatory subunit of the first committed step in
valine biosynthesis, weakened the impact of overexpression of ILV2, ILV3, and ILV5
on isobutanol production. After the initiation of the present work, results of somewhat
similar genetic approaches on isobutanol production in S. cerevisiae appeared in
patent applications [11, 12], but not in the refereed scientific literatures.
2-aceto-lactate
2,3-dihydroxy-isovalerate
2-keto-isovalerate
L-Valine
Ilv2 Ilv6CO2
H+, NADPH
NADPIlv5
H2O Ilv3
L-glutamate
2-oxoglutarateBat1
isobutanol
Pdc6,5,1 ADHs
CO2 NADH NADisobutanal
PyruvateMitochondria:
Pyruvate
L-Valine 2-keto-isovalerateBat2
Pdc6,5,1 ADHs
CO2 NADH NADacetaldehyde ethanol
Cytosol: Glucose
L-glutamate2-oxoglutarate Figure 4.1. The metabolic pathways from pyruvate to isobutanol and ethanol in S. cerevisiae. The enzymes that catalyze the pathway from pyruvate to L-valine in the mitochondria are: acetolactate synthase (Ilv2+Ilv6), acetohydroxyacid reductoisomerase (Ilv5), dihydroxyacid dehydratase (Ilv3), and branched-chain amino acid aminotransferase (Bat1). Ilv2 is the catalytic subunit of acetolactate synthase, and Ilv6 is the regulatory subunit. The enzymes that catalyze the pathway from L-valine to isobutanol in the cytosol are pyruvate decarboxylases (Pdc6, 5, 1) and alcohol dehydrogenases (ADHs). Pyruvate decarboxylases and alcohol dehydrogenases also catalyze the pathway from pyruvate to ethanol in S. cerevisiae. The broken line indicates the export of 2-keto-isovalerate from mitochondria to cytosol.
64
Chapter 4
49
4.2. Results and discussion
The objective of this work was to study isobutanol formation in S. cerevisiae, and to
improve isobutanol production by metabolic engineering. We studied overexpression
of the genes ILV2, ILV3, ILV5, ILV6, and BAT2, involved in valine metabolism, in
different combinations, and investigated the isobutanol production in the constructed
strains.
4.2.1. Improvement of anaerobic isobutanol production by overexpression of genes in valine metabolism
To overexpress the genes, ILV2, ILV3, and ILV5, which encode the catalysts for the
conversion of pyruvate to 2-keto-isovalerate (direct precursor of L-valine), the coding
regions were fused with the S. cerevisiae PGK1 promoter. The resulting PGK1-ILV2,
PGK1-ILV3 and PGK1-ILV5 DNA fusion fragments were cloned into integration
vectors YDp-L, YDp-W, and YDp-H [13], respectively. The three resulting plasmids
were linearized by cleavage of the ILV genes and successively integrated into the
genome of CEN.PK 2-1C (MATα leu2-3, 112 his3-Δ1 ura3-52 trp1-289 MAL2-
8(Con) MAL3 SUC3) (a kind gift of Peter Kötter, Frankfurt, Germany). The resulting
strain was designated ILV235_XCY561 (ILV2 ILV3 ILV5 overexpression strain).
Successful genomic integration was confirmed by analytical PCR on chromosomal
DNA. The copy number of the integrated gene was estimated by performing
quantitative real-time PCR with genomic DNA as template [14, 15]. The estimates of
the copy numbers of ILV2, ILV3, and ILV5 in ILV235_XCY561 given by the
quantitative PCR were 4.1±0.90, 2.1±0.65, and 3.6±1.12 times larger than those in the
reference strain, respectively. Multiple integrations might happen in some cases. The
expression of ILV2, ILV3, and ILV5 at the transcriptional level in ILV235_XCY561
was also measured by quantitative real-time PCR. The mRNA levels of ILV2, ILV3,
and ILV5 in ILV235_XCY561 measured by qPCR were 6.42±2.20, 9.98±1.31, and
3.24±0.61 times larger than those in the reference strain, respectively. Overexpression
of these three genes at mRNA level was proved. However, no enzymatic assays were
performed to confirm the overexpression since the reagents needed are not
commercially available.
65

Chapter 4
50
The ILV2 ILV3 ILV5 overexpressing strain (ILV235_XCY561) and the reference
strain (CEN.PK 113-5D) were cultivated in mineral glucose medium supplemented
with uracil in fermenters under anaerobic conditions. Primary metabolite
concentrations were measured by high-performance liquid chromatography (HPLC)
throughout the fermentation. Isobutanol concentration was measured by gas
chromatography (GC) only from the samples taken at the end of fermentations after
glucose depletion, due to the large sample volume needed for reliable measurements.
The ILV2 ILV3 ILV5 overexpression strain produced 0.97±0.14 mg isobutanol per g
glucose, which was 6 times more than the reference strain (Figure 4.2). No difference
was detected between the ILV2 ILV3 ILV5 overexpression strain and the reference
strain in the production of biomass, ethanol, pyruvate, succinate, glycerol, acetate and
CO2 (Table 4.1). Our interpretation is that overexpression of gene ILV2, ILV3, and
ILV5 led to a higher concentration of 2-keto-isovalerate, which resulted in higher
isobutanol production.
0.16
0.97
2.13
0.34
0
0.5
1
1.5
2
2.5
Isob
utan
ol y
ield
on
gluc
ose,
mg/
g
CEN.PK 113-5D
ILV2 ILV3 ILV5 overexpression strain
ILV2 ILV3 ILV5 BAT2 overexpression strain
ILV2 ILV3 ILV5 ILV6 overexpression strain
Figure 4.2. Effects of overexpression of ILV genes on isobutanol yield under anaerobic conditions. Isobutanol yields (mg per g glucose) of the reference strain (CEN.PK 113-5D) and ILV2 ILV3 ILV5, ILV2 ILV3 ILV5 BAT2, ILV2 ILV3 ILV5 ILV6 overexpression strains were presented with columns with different colors, and the values are shown on the tops of each column. All cultivations were carried out in fermenters in mineral medium with 40 g glucose per liter under anaerobic conditions.
66

Chapter 4
51
The ILV2 ILV3 ILV5 overexpression strain had a maximum specific growth rate of
0.29±0.02 hr-1, which was slower than the maximum specific growth rate of the
reference strain, which was 0.38±0.02 hr-1. The slower growth rate may be due to a
metabolic imbalance caused by the overexpression of the ILV genes, which affects
some amino acids pools, or due to insufficient expression of the selection markers,
which were put at different loci and might not work with the same efficiency as at
their wild type locations.
BAT2 encodes a branched-chain amino acid aminotransferase, which catalyzes the
first reaction in the catabolism of valine in the cytosol [16]. BAT2 is highly expressed
during stationary phase and repressed during logarithmic growth, which is the
opposite way of the regulation of the mitochondrial branched-chain amino acid
aminotransferase, encoded by BAT1 [17]. It has been previously shown that
overexpression of BAT2 alone increases isobutanol concentration in wine
fermentations [18]. We therefore decided to investigate whether overexpression of
BAT2 could complement the valine pathway overexpression and result in higher
yields and concentrations of isobutanol.
An ILV2 ILV3 ILV5 BAT2 overexpression strain, ILV235BAT2_XCY715, was thus
constructed by using the same promoter and the same molecular strategy. The
estimate of the copy number of gene BAT2 in ILV235BAT2_XCY715 was 1.5±0.50
times larger than the one in the reference strain, which was in accordance with the
expected copy number of two. The overexpression of BAT2 at the transcriptional level
in ILV235BAT2_XCY715 was 90.82±0.45 times larger than that in the reference
strain. The different overexpression levels among ILV2, ILV3, ILV5, and BAT2, reflect
the fact that the expression level controlled by inserted promoters depends on the
surrounding sequence. Anaerobic fermentations with ILV235BAT2_XCY715 were
carried out in fermenters under the conditions described above. The GC results
showed that the ILV2 ILV3 ILV5 BAT2 overexpression strain produced 13 times more
isobutanol per gram of glucose than the reference strain, which is an improvement by
two fold over that of the ILV2 ILV3 ILV5 overexpression strain (Figure 4.2). The
biomass yield on glucose of the ILV2 ILV3 ILV5 BAT2 overexpression strain was
0.07±0.01 g per g glucose, which was lower than the biomass yields of the ILV2 ILV3
67

Chapter 4
52
ILV5 overexpression strain and the reference strain, which were 0.10±0.00 and
0.11±0.01, respectively. Carbon balance calculation showed that after accounting for
carbon in produced biomass, isobutanol, ethanol, pyruvate, succinate, glycerol,
acetate, and CO2, there was about 11 % carbon missing (Table 4.1). We have
investigated whether the missing carbon could be explained by the increase in the
production of 3-methyl butanol and 2-methyl butanol, since the BAT2 encoding
aminotransferase also catalyzes the first step in the leucine and isoleucine
catabolisms, which produce 3-methyl butanol and 2-methyl butanol, respectively [9,
19, 20]. GC analysis showed that the yield of 3-methyl butanol increased from 0.28 to
0.48 mg per g glucose (0.0330% carbon) compared to the reference strain, and there
was no increase observed in 2-methyl butanol yield. These increases, however, were
not large enough to explain the missing carbon. The deviation in carbon balance could
be due to some other products not included in the present analysis. The time profiles
of anaerobic fermentations of the ILV2 ILV3 ILV5 BAT2 overexpression strain and the
CEN.PK 113-5D reference strain are presented in Figure 4.3 A and B, respectively.
Glucose consumption and all measured production rates were much higher in the
reference strain than in the ILV2 ILV3 ILV5 BAT2 overexpression strain. The
maximum specific growth rate of the ILV2 ILV3 ILV5 BAT2 overexpression strain
was 0.16±0.01 hr-1, and thus much lower than that of the reference strain and the ILV2
ILV3 ILV5 overexpression strain, which has the growth rate at 0.38±0.02 and
0.29±0.02 hr-1, respectively. The decrease in growth rate could be due to the same
reasons as explained earlier for the slow growth rate of the ILV2 ILV3 ILV5
overexpression strain. The very high overexpression of BAT2 might result in a further
metabolic imbalance of some amino acids pools, and could be the cause the further
drop of the growth rate of the ILV2 ILV3 ILV5 BAT2 overexpression strain. An
independent transformant of the ILV2 ILV3 ILV5 overexpression strain with the BAT2
overexpression construct, named ILV235BAT2_XCY723, was investigated, and it
behaved identically to ILV235BAT2_XCY715.
68

Chapter 4
53
Table 4.1. Effects of gene overexpression on growth rates and product yields under anaerobic batch fermentationsa
Strain Reference strainb
ILV2 ILV3 ILV5
overexpression
strainb
ILV2 ILV3 ILV5
BAT2
overexpression
strainb
ILV2 ILV3 ILV5
ILV6
overexpression
strainb
Specific growth
rate, hr-1 0.38 ± 0.02 0.29 ± 0.02 0.16 ± 0.01 0.18 ± 0.00
Biomass
(CH1.78O0.6N0.19)
yield, g/g glucose
0.10 ± 0.00 0.11 ± 0.01 0.07 ± 0.01 0.11 ± 0.00
Ethanol yield, g/g
glucose 0.38 ± 0.01 0.37 ± 0.02 0.34 ± 0.01 0.37 ± 0.00
Pyruvate yield,
g/g glucose 0.0011 ± 0.007 0.0016 ± 0.0007 0.0032 ± 0.0006 0.0028 ± 0.0001
Succinate yield,
g/g glucose 0.0016 ± 0.0006 0.0006 ± 0.0001 0.0028 ± 0.0001 0.0035 ± 0.0003
Glycerol yield,
g/g glucose 0.100 ± 0.008 0.087 ± 0.006 0.095 ± 0.001 0.099 ± 0.003
Acetate yield, g/g
glucose 0.0076 ± 0.0014 0.0088 ± 0.0010 0.0110 ± 0.0006 0.0069 ± 0.0003
CO2 yield, g/g
glucose 0.32 ± 0.01 0.39 ± 0.01 0.37 ± 0.04 0.41 ± 0.03
Carbon balance
deviation, %b 5.9 ± 2.2 3.0 ± 4.0 10.9 ± 1.7 1.3 ± 1.7
a The mineral medium with 40 g per liter of glucose was used. bThe reference strain used was CEN.PK 113-5D; The ILV2 ILV3 ILV5 overexpression strain used was
ILV235_XCY561; The ILV2 ILV3 ILV5 BAT2 overexpression strain used were
ILV235BAT2_XCY715 and ILV235BAT2_XCY723; The ILV2 ILV3 ILV5 ILV6 overexpression strain
used was ILV2356_XCY605.
69

Chapter 4
54
0.0
0.5
1.0
1.5
2.0
2.5
3.0
3.5
4.0
4.5
5.0
0
5
10
15
20
25
30
35
40
45
50
0.00 10.00 20.00 30.00 40.00 50.00 60.00
Gly
cero
l, py
ruva
te, s
ucci
nate
, ace
tate
, iso
buta
nol,
g/L
Glu
cose
, eth
anol
, bio
mas
s con
cent
rati
on, g
/L
Glucose
Ethanol
Biomass
Glycerol
Pyruvate
Succinate
Acetate
Isobutanol
0.0
0.5
1.0
1.5
2.0
2.5
3.0
3.5
4.0
4.5
5.0
0
5
10
15
20
25
30
35
40
45
50
0 10 20 30 40 50 60
Gly
cero
l, py
ruva
te, s
ucci
nate
, ace
tate
, iso
buta
nol,
g/L
Glu
cose
, eth
anol
, bio
mas
s con
cent
rati
on, g
/L
Time, hr
Glucose
Ethanol
Biomass
Glycerol
Pyruvate
Succinate
Acetate
Isobutanol
Figure 4.3. Time profiles of fermentations of ILV2 ILV3 ILV5 BAT2 overexpression (A) and reference strain (B). The ILV2 ILV3 ILV5 BAT2 overexpression strain and the reference strain CEN.PK 113-5D were cultivated under anaerobic batch fermentations in mineral medium with 40 g glucose per liter. The concentrations of glucose, biomass, and products are plotted as a function of time. Isobutanol concentrations were measured after glucose depletion in both cases. Fermentations were performed in triplicate, representative cultivations are shown.
Ilv6 is the regulatory subunit of acetolactate synthase and has been described as an
enhancer of Ilv2 catalytic activity. To investigate whether ILV6 overexpression would
further improve isobutanol production by possibly approaching equimolar amounts of
both proteins, ILV6 was overexpressed in the strain background with ILV2, ILV3, and
ILV5 overexpression. The resulting strain was designated ILV2356_XCY605, here
A
B
70

Chapter 4
55
also referred to as the ILV2 ILV3 ILV5 ILV6 overexpression strain. The estimate of the
copy number of ILV6 in ILV2356_XCY605 was 2.8±1.67 times larger than that in the
reference strain. We also estimated the copy number of ILV6 in
ILV235BAT2_XCY715 and that of BAT2 in ILV2356_XCY605. Their copy numbers
were 0.9±0.31 and 1.0±0.42 times, respectively, compared to the reference strain,
which was in agreement with the fact that these two genes were not overexpressed in
their respective strains. The overexpression of ILV6 at the transcriptional level in
ILV2356_XCY605 was 8.07±1.14 times larger than that in the reference strain.
Unexpectedly, integration of the overexpression construct with ILV6 overexpression
caused 3 times less isobutanol production, namely 0.34 mg per g glucose (Figure 4.2),
and a drop of the maximum specific growth rate to 0.18±0.00 hr-1. The yields of the
other measured products, i.e. biomass, ethanol, pyruvate, succinate, glycerol, acetate,
and CO2 were largely unaffected (Table 4.1). We interpret the lower yield of
isobutanol upon overexpression of ILV6 to be due to an increased sensitivity of Ilv2 to
valine inhibition, weakening the positive impact of overexpression of ILV2, ILV3, and
ILV5 on increasing isobutanol production in S. cerevisiae, since Ilv6 stimulates Ilv2
catalytic activity seven- to ten fold and confers Ilv2 sensitivity to valine inhibition [21,
22].
4.2.2. Influence of various media on isobutanol production and growth rate
The ILV2 ILV3 ILV5 overexpression strain and the CEN.PK 113-5D reference strain
were cultivated under aerobic conditions in shake flasks to further investigate the
effect of valine pathway overexpression on growth rates and isobutanol production.
Buffered mineral medium with 40 g glucose per liter and Yeast-extract Peptone
Dextrose (YPD) complex medium with 17 g glucose per liter were used. The growth
rates and the main product yields are shown in Table 4.2. In the mineral medium, the
ILV2 ILV3 ILV5 overexpression strain had a three times lower maximum specific
growth rate (0.110 hr-1) than the reference strain (0.359 hr-1). In YPD, however, they
grew at similar growth rates, about 0.5 hr-1. Our interpretation is that genetic
manipulations in the ILV2 ILV3 ILV5 overexpression strain might cause a metabolic
imbalance, which perhaps affected some amino acid pools, or the improper
71

Chapter 4
56
functioning of the selection markers. Any of these problems could be compensated by
growing the overexpression strain in the complex medium.
Isobutanol yields of the ILV2 ILV3 ILV5 overexpression strain and the reference strain
under aerobic cultivation conditions in different media are compared in Figure 4.4. In
mineral medium the ILV2 ILV3 ILV5 overexpression strain produced 3.86 mg
isobutanol per g glucose, and the reference strain produced 0.28 mg isobutanol per g
glucose. In YPD complex medium the ILV2 ILV3 ILV5 overexpression strain and the
reference strain produced 4.12 and 2.4 mg isobutanol per g glucose, respectively.
There were 2.12 mg isobutanol per g glucose of increase for the reference strain, and
only 0.26 mg isobutanol per g glucose of increase for the ILV2 ILV3 ILV5
overexpression strain. We interpret this to be due to overexpression of ILV2, ILV3,
and ILV5 and uptake of valine from the complex medium both caused a strong
increase of the pool of valine, and thereby an increase of isobutanol production. Since
the provision of valine in the medium by using the YPD complex medium did not
increase the isobutanol production yield of the ILV2 ILV3 ILV5 overexpression strain
much, it appears that other constraints besides the enzyme activities for the supply of
2-ketoisovalerate in the ILV2 ILV3 ILV5 overexpression strain might have become
bottlenecks. These could include valine inhibition to Ilv2, transportation of 2-
ketoisovalerate or valine from mitochondria to cytosol, and affinities of PDCs to 2-
ketoisovalerate in cytosol.
In this study, the isobutanol production yield was increased first by simultaneously
overexpression genes, ILV2, ILV3 and ILV5 in valine biosynthetic pathway. However,
which gene(s) out of these three is (are) needed to reach the same increased level of
isobutanol yield, was not investigated in this study. Even though the isobutanol
production yield was improved with 9 folds by overexpression of ILV2, ILV3, ILV5,
and BAT2, in valine biosynthetic and degradation pathways, the isobutanol production
yield was still too low for commercial applications. The low production of isobutanol
was probably due to the regulation control of valine production in mitochodria, which
limited the flux toisobutanol. Moving the pathway from pyruvate to 2-keto-isovalerate
from mitochondria to cytosol would benefit the production of isobutanol in yeast.
72
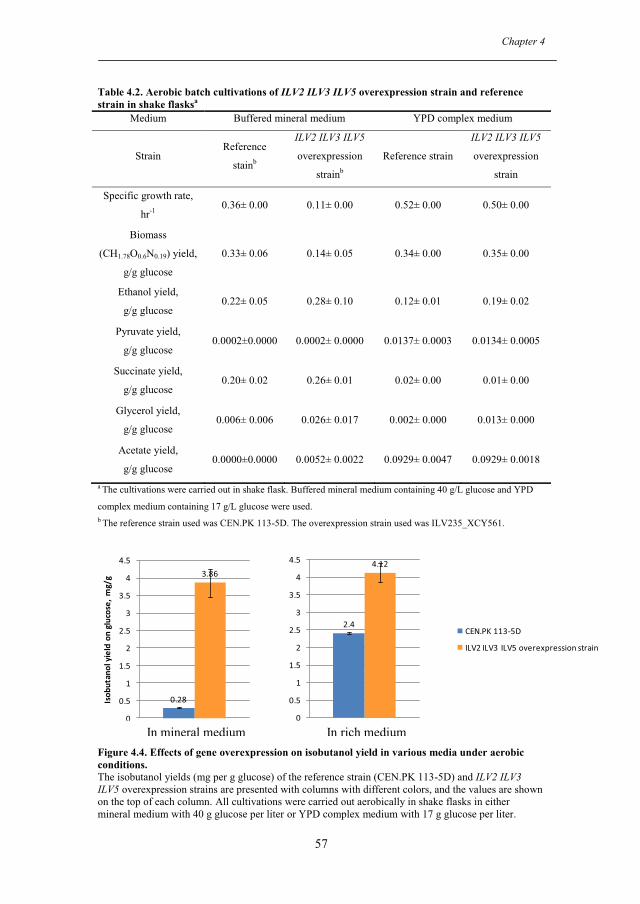
Chapter 4
57
Table 4.2. Aerobic batch cultivations of ILV2 ILV3 ILV5 overexpression strain and reference strain in shake flasksa
Medium Buffered mineral medium YPD complex medium
Strain Reference
stainb
ILV2 ILV3 ILV5
overexpression
strainb
Reference strain
ILV2 ILV3 ILV5
overexpression
strain
Specific growth rate,
hr-1 0.36± 0.00 0.11± 0.00 0.52± 0.00 0.50± 0.00
Biomass
(CH1.78O0.6N0.19) yield,
g/g glucose
0.33± 0.06 0.14± 0.05 0.34± 0.00 0.35± 0.00
Ethanol yield,
g/g glucose 0.22± 0.05 0.28± 0.10 0.12± 0.01 0.19± 0.02
Pyruvate yield,
g/g glucose 0.0002±0.0000 0.0002± 0.0000 0.0137± 0.0003 0.0134± 0.0005
Succinate yield,
g/g glucose 0.20± 0.02 0.26± 0.01 0.02± 0.00 0.01± 0.00
Glycerol yield,
g/g glucose 0.006± 0.006 0.026± 0.017 0.002± 0.000 0.013± 0.000
Acetate yield,
g/g glucose 0.0000±0.0000 0.0052± 0.0022 0.0929± 0.0047 0.0929± 0.0018
a The cultivations were carried out in shake flask. Buffered mineral medium containing 40 g/L glucose and YPD
complex medium containing 17 g/L glucose were used. b The reference strain used was CEN.PK 113-5D. The overexpression strain used was ILV235_XCY561.
0.28
3.86
0
0.5
1
1.5
2
2.5
3
3.5
4
4.5
Isob
utan
ol y
ield
on
gluc
ose,
mg/
g
CEN.PK 113-5D
ILV2 ILV3 ILV5 overexpression strain
2.4
4.12
0
0.5
1
1.5
2
2.5
3
3.5
4
4.5
CEN.PK 113-5D
ILV2 ILV3 ILV5 overexpression strain
Figure 4.4. Effects of gene overexpression on isobutanol yield in various media under aerobic conditions. The isobutanol yields (mg per g glucose) of the reference strain (CEN.PK 113-5D) and ILV2 ILV3 ILV5 overexpression strains are presented with columns with different colors, and the values are shown on the top of each column. All cultivations were carried out aerobically in shake flasks in either mineral medium with 40 g glucose per liter or YPD complex medium with 17 g glucose per liter.
In mineral medium In rich medium
73
Chapter 4
58
4.3. Conclusions
Isobutanol production yield on glucose was first increased from 0.16 to 0.97 mg
isobutanol per gram of glucose by overexpression of genes ILV2, ILV3, and ILV5,
which encode the catalysts for the conversion of pyruvate to 2-keto-isovalerate, the
immediate precursor of valine. With the background of ILV2 ILV3 ILV5
overexpression, isobutanol yield was further improved two-fold by overexpression of
BAT2, encoding the catalyst for the first step of valine catabolism. Also with the
background of the ILV2 ILV3 ILV5 overexpression, overexpression of ILV6,
encoding a regulatory subunit that combines with Ilv2, which catalyzes the first
committed step in valine biosynthesis, resulted in a three times drop of the yield of
isobutanol. We interpret this to be due to an increased sensitivity of Ilv2 to valine
inhibition, weakening the positive impact of overexpression of ILV2, ILV3, and ILV5
on increasing isobutanol production.
Aerobic cultivation of the ILV2 ILV3 ILV5 overexpression strain and the reference
strain in shake flasks indicated that uptake of valine has the same effect on increasing
the valine pool and thereby isobutanol production as on increasing the flux capacity
from pyruvate to 2-keto isovalerate by overexpression of the three genes. Thus, the
enzyme activities for the supply of 2-keto isovalerate were not a bottleneck any longer
in the ILV2 ILV3 ILV5 overexpression strain. Other bottlenecks, such as the regulation
of valine production, export of valine or 2-keto isovalerate from mitochondria to
cytosol, or the affinities of PDCs to 2-ketoisovalerate in cytosol, should be
investigated in order to further increase the yield of isobutanol.
4.4. Methods
4.4.1. Media and culture conditions
The mineral medium, which was used in all anaerobic fermentations, had the
following composition (per liter): (NH4)2SO4, 10 g; KH2PO4, 6 g; MgSO4 · 7H2O, 1 g;
Antifoam 289 (A-5551; Sigma-Aldrich), 0.2 ml; trace metal solution, 2 ml; vitamin
solution, 2 ml; and ergosterol solution, 2 ml. This medium was supplemented with 40
g/liter glucose and 0.1 g/liter uracil. The trace metal solution consisted of the
74

Chapter 4
59
following (per liter): EDTA (sodium salt), 15.0 g; ZnSO4 · 7H2O, 4.5 g;
MnCl2 · 2H2O, 0.84 g; CoCl2 · 6H2O, 0.3 g; CuSO4 · 5H2O, 0.3 g; Na2MoO4 · 2H2O,
0.4 g; CaCl2 · 2H2O, 4.5 g; FeSO4 · 7H2O, 3 g; H3BO3, 1 g; and KI, 0.1 g. The vitamin
solution contained the following (per liter): biotin, 0.05 g; p-aminobenzoic acid, 0.2 g;
nicotinic acid, 1 g; calcium pantothenate, 1 g; pyridoxine-HCl, 1 g; thiamine-HCl, 1 g;
and myo-inositol, 25 g. The ergosterol solution contained 2 g ergosterol and 84 g
Tween 80 in 100 ml pure ethanol.
For the pre-cultivations, 50 ml of mineral medium was used in 500 ml shake flasks,
with the exception that 0.1 g/liter uracil was added when necessary, and no ergosterol
was used. The pre-cultures were grown at 30°C with shaking at 200 rpm and a start
pH of 5.0.
All aerobic cultivations were performed in 500 ml baffled shake flasks with 100 ml of
working volume of either buffered mineral medium or YPD complex medium.
Buffered mineral medium contained (per liter): (NH4)2SO4, 15 g; KH2PO4, 28.8 g;
MgSO4 · 7H2O, 1 g; Antifoam 289, 0.2 ml; trace metal solution, 4 ml; vitamin
solution, 2 ml and 40 g glucose. The compositions of trace metal and vitamin
solutions were as above. 0.1 g/liter uracil was used when necessary. The YPD
complex medium contained, per liter, 10 g of yeast extract, 20 g of peptone, and 17 g
glucose. The aerobic cultivations were carried out at 30 °C with shaking at 200 rpm
and a start pH of 5.0.
4.4.2. Strains and strain construction
All S. cerevisiae strains used in this study were derivatives of CEN.PK 2-1C strain
(MATα leu2-3, 112 his3-Δ1 ura3-52 trp1-289 MAL2-8(Con) MAL3 SUC3) (Table 4.3).
Strain CEN.PK 113-5D (MATα SUC2 MAL2-8c ura3-52) and CEN.PK 113-7D
(MATα MAL2-8c SUC2), were used as reference strains in fermentation and real-time
PCR experiments, respectively. For routine cultivation, YPD solid or liquid medium
was used. Synthetic drop-out (SD) solid media appropriately lacking uracil or amino
acids were used for selection of yeast plasmid transformants. YPG glycerol-based
solid medium (containing, per liter, 10 g of yeast extract, 20 g of peptone, and 20 g of
75
Chapter 4
60
glycerol) was used for petite test before long-term storage of strains in 20% of
glycerol at -80°C.
Throughout strain construction, standard molecular biology methods were used.
Primers used for PCR amplification of DNA fragments (PGK1 promoter, genes ILV2,
ILV3, ILV5, ILV6 and BAT2) from S. cerevisiae are listed in Table 4.4. Each amplified
target gene (ILV2, ILV3, ILV5, ILV6, or BAT2) was fused to the downstream end of
the PGK1 promoter sequence (1480 bp) in subsequent PCR through designed
overlapping ends between the promoter and the target gene. All preparative PCRs
were performed with Phusion high-fidelity DNA polymerase (Finnzymes).
The generated blunt end fusion PCR products, PGK1+ILV2, PGK1+ILV3,
PGK1+ILV5, PGK1+ILV6 or PGK1+BAT2, were cloned into the pCR-Blunt II-
TOPO vector by using the Zero Blunt TOPO PCR Cloning Kit (Invitrogen). The
resulting plasmids were designated pTOPO_P+ILV2, pTOPO_P+ILV3,
pTOPO_P+ILV5, pTOPO_P+ILV6, and pTOPO_P+BAT2, respectively. The PGK1
promoter together with the target gene were cut out from these pTOPO clones, and
ligated into vector YDp-L, YDp-W, YDp-H, YDp-U, and YDp-U [13], respectively.
The resulting plamids were designated YDp-L_P+ILV2, YDp-W_P+ILV3, YDp-
H_P+ILV5, YDp-U_P+ILV6, and YDp-U_P+BAT2, respectively (Table 4.3). They
were digested with BglII, BglII, EcoRI, NarI, and EagI in the middle of gene ILV2,
ILV3, ILV5, ILV6, and BAT2, respectively. The linearized plasmids were
chromosomally integrated into yeast strain CEN.PK 2-1C (a kind gift of Peter Kötter,
Frankfurt, Germany) in various combinations. The strain with plasmids YDp-
L_P+ILV2, YDp-W_P+ILV3 and YDp-H_P+ILV5 integrated in the genome was
designated ILV235_XCY561. The strain with plasmids YDp-L_P+ILV2, YDp-
W_P+ILV3, YDp-H_P+ILV5, and YDp-U_P+ILV6 was designated
ILV2356_XCY605. Two identical strains, independently isolated in the last step of
construction, with plasmids YDp-L_P+ILV2, YDp-W_P+ILV3, YDp-H_P+ILV5,
and YDp-U_P+BAT2 were designated ILV235BAT2_XCY715 and
ILV235BAT2_XCY723, respectively. The genomic integration of the plasmid was
confirmed by PCR amplifying PGK1+ILV2, PGK1+ILV3, PGK1+ILV5,
76

Chapter 4
61
PGK1+ILV6 or PGK1+BAT2 fragment from the genomic DNA of the constructed
overexpression strains.
Table 4.3. Plasmids and strains
Plasmid or strain Relevant characteristics Source or reference
Plasmid
pCR-Blunt II-TOPO Cloning vector; Kmr Invitrogen YDp-L pUC9 derivative, with LEU2 marker [11] YDp-W pUC9 derivative, with TRP1 marker [11] YDp-H pUC9 derivative, with HIS3 marker [11] YDp-U pUC9 derivative, with URA3 marker [11] pTOPO_P+ILV2 pCR-Blunt II-TOPO with PGK1
promoter and ILV2 gene from S. cerevisiae
This study
pTOPO_P+ILV3 pCR-Blunt II-TOPO with PGK1 promoter and ILV3 gene from S. cerevisiae
This study
pTOPO_P+ILV5 pCR-Blunt II-TOPO with PGK1 promoter and ILV5 gene from S. cerevisiae
This study
pTOPO_P+ILV6 pCR-Blunt II-TOPO with PGK1 promoter and ILV6 gene from S. cerevisiae
This study
pTOPO_P+BAT2 pCR-Blunt II-TOPO with PGK1 promoter and BAT2 gene from S. cerevisiae
This study
YDp-L_P+ILV2 Plasmid YDp-L with PGK1 promoter and ILV2
This study
YDp-W_P+ILV3 Plasmid YDp-W with PGK1 promoter and ILV3
This study
YDp-H_P+ILV5 Plasmid YDp-H with PGK1 promoter and ILV5
This study
YDp-U_P+ILV6 Plasmid YDp-U with PGK1 promoter and ILV6
This study
YDp-U_P+BAT2 Plasmid YDp-U with PGK1 promoter and BAT2
This study
Strains CEN.PK 2-1C MATα leu2-3, 112 his3-Δ1 ura3-52
trp1-289 MAL2-8(Con) MAL3 SUC3 P. Kötter
CEN.PK 113-5D MATα SUC2 MAL8c ura3-52 P. Kötter CEN.PK 113-7D MATα MAL2-8c SUC2 P. Kötter
ILV235_XCY561 CEN.PK 2-1C with YDp-H_P+ILV5, YDp-L_P+ILV2, and YDp-W_P+ILV3 inserted into the genome.
This study
ILV235BAT2_XCY715, ILV235BAT2_XCY723
CEN.PK 2-1C with YDp-H_P+ILV5, YDp-L_P+ILV2, YDp-W_P+ILV3, and YDp-U_P+BAT2 inserted into the genome.
This study
ILV2356_XCY605 CEN.PK 2-1C with YDp-H_P+ILV5, YDp-L_P+ILV2, YDp-W_P+ILV3, and YDp-U_P+ILV6 inserted into the genome.
This study
77
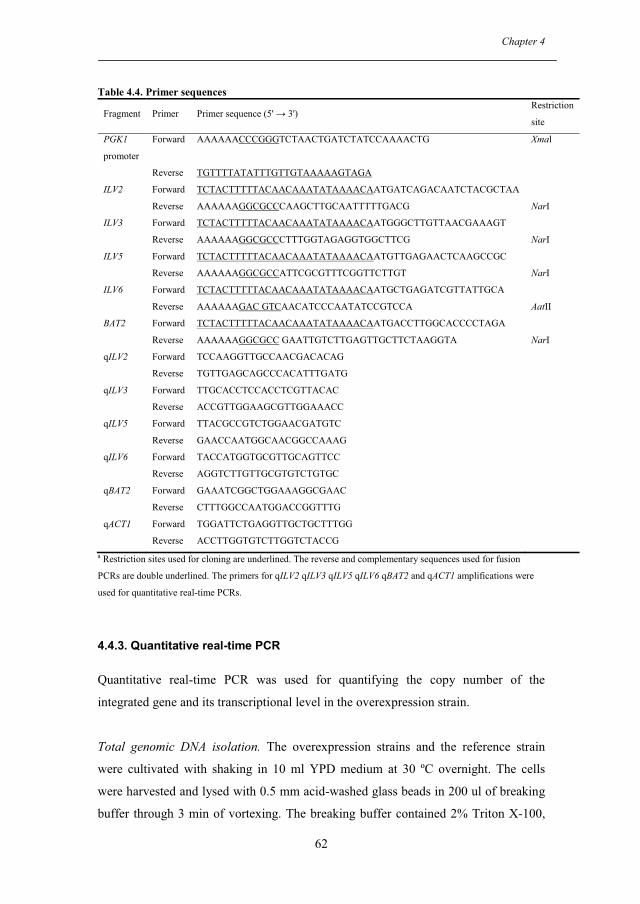
Chapter 4
62
Table 4.4. Primer sequences
Fragment Primer Primer sequence (5' → 3') Restriction
site
PGK1
promoter
Forward AAAAAACCCGGGTCTAACTGATCTATCCAAAACTG Xmal
Reverse TGTTTTATATTTGTTGTAAAAAGTAGA
ILV2 Forward TCTACTTTTTACAACAAATATAAAACAATGATCAGACAATCTACGCTAA
Reverse AAAAAAGGCGCCCAAGCTTGCAATTTTTGACG NarI
ILV3 Forward TCTACTTTTTACAACAAATATAAAACAATGGGCTTGTTAACGAAAGT
Reverse AAAAAAGGCGCCCTTTGGTAGAGGTGGCTTCG NarI
ILV5 Forward TCTACTTTTTACAACAAATATAAAACAATGTTGAGAACTCAAGCCGC
Reverse AAAAAAGGCGCCATTCGCGTTTCGGTTCTTGT NarI
ILV6 Forward TCTACTTTTTACAACAAATATAAAACAATGCTGAGATCGTTATTGCA
Reverse AAAAAAGAC GTCAACATCCCAATATCCGTCCA AatII
BAT2 Forward TCTACTTTTTACAACAAATATAAAACAATGACCTTGGCACCCCTAGA
Reverse AAAAAAGGCGCC GAATTGTCTTGAGTTGCTTCTAAGGTA NarI
qILV2 Forward TCCAAGGTTGCCAACGACACAG
Reverse TGTTGAGCAGCCCACATTTGATG
qILV3 Forward TTGCACCTCCACCTCGTTACAC
Reverse ACCGTTGGAAGCGTTGGAAACC
qILV5 Forward TTACGCCGTCTGGAACGATGTC
Reverse GAACCAATGGCAACGGCCAAAG
qILV6 Forward TACCATGGTGCGTTGCAGTTCC
Reverse AGGTCTTGTTGCGTGTCTGTGC
qBAT2 Forward GAAATCGGCTGGAAAGGCGAAC
Reverse CTTTGGCCAATGGACCGGTTTG
qACT1 Forward TGGATTCTGAGGTTGCTGCTTTGG
Reverse ACCTTGGTGTCTTGGTCTACCG a Restriction sites used for cloning are underlined. The reverse and complementary sequences used for fusion
PCRs are double underlined. The primers for qILV2 qILV3 qILV5 qILV6 qBAT2 and qACT1 amplifications were
used for quantitative real-time PCRs.
4.4.3. Quantitative real-time PCR
Quantitative real-time PCR was used for quantifying the copy number of the
integrated gene and its transcriptional level in the overexpression strain.
Total genomic DNA isolation. The overexpression strains and the reference strain
were cultivated with shaking in 10 ml YPD medium at 30 ºC overnight. The cells
were harvested and lysed with 0.5 mm acid-washed glass beads in 200 ul of breaking
buffer through 3 min of vortexing. The breaking buffer contained 2% Triton X-100,
78
Chapter 4
63
1% SDS, 100 mM NaCl, 100 mM Tris-Cl and 1 mM EDTA with pH at 8.0. 200 ul 1x
TE buffer, which contained 10 mM Tris-HCl and 1 mM EDTA, was added to the
lysed cells. After centrifugation at 12000 g for 5 min, the supernatant was transferred
into a new Eppendorf tube. The DNA in the supernatant was precipitated with 1 ml of
100% ethanol, washed with 1ml of 70% ethanol twice, and resuspended in 50ul sterile
Milli-Q water. The quality and quantity of the isolated genomic DNA was measured
using NanoDrop ND-1000 (Thermo Scientific). The isolated gDNA with good purity
and appropriate quantity was used as template for quantitative real-time PCR to
determine the copy number of the integrated genes in the overexpression strains.
Total RNA isolation. The overexpression strains and the reference stain were
cultivated aerobically in mineral medium in shake flasks. Cells were harvested when
the optical density of the culture was between 4 and 6 at 600 nm. Total RNA was
isolated using TRI REAGENT TMLS from Sigma as recommended by the
manufacturer. The quality and quantity of the isolated RNA was measured using
NanoDrop ND-1000. Then DNase treatment was performed to the RNA samples by
using DEOXYRIBONUCLEASE I from Sigma. The cDNA was made using M-
MuLV RNase H+ reverse transcriptase and random hexamer primer set provided by
DyNAmoTM SYBR Green 2-Step qRT-PCR Kit from FINNZYMES. The negative
control of reverse transcription was carried with the RNA which was not treated by
DNaseout. The cDNA and the negative controls were used as the template for
quantitative real-time PCR to determine the transcriptional level of the target genes in
the overexpression strains and the reference strain.
The primers used for amplifying the small parts of ILV2, ILV3, ILV5, ILV6, BAT2,
and the reference gene ACT1, are listed in Table 4.3. The resulting PCR fragments’
sizes were 80, 74, 72, 76, 73, and 125 bp, respectively. The program used for
quantitative PCR reactions was as follows: initial denaturation at 95°C for 15 min; 40
cycles of denaturation at 94°C for 10 s, annealing at 66°C for 30 s, fluorescence data
collection, extension at 72°C for 30 s; final extension at 72°C for 10 min; melting
curve from 65 to 95°C. The threshold cycles (C(t)s) were calculated with the set
threshold value by using Mx3005P software. The delta delta C(t) method was applied
for the relative quantification of the copy numbers and the transcription of ILV2, ILV3,
79

Chapter 4
64
ILV5, ILV6, and BAT2 in the overexpression strains with respect to the reference
strain.
4.4.4. Fermentation
All anaerobic batch fermentations were performed in triplicate in 2-liter fermenters
(Braun-Biostat B2, stirred tank) with a working volume of 1.5 liter. The fermenter
was inoculated with a pre-culture from a shake flask to an optical density of 0.05 at
600 nm. During cultivation the temperature was maintained at 30°C, agitation was set
at 200 rpm, and sparging was kept at 1 liter of pure nitrogen per min. pH was
maintained at 5.0 by automatic addition of 2 N NaOH. The CO2 and O2
concentrations in the effluent gas from the fermenter were analyzed by gas monitor
(Innova 1311). Samples were taken throughout the cultivation for optical density
measurement, biomass dry weight determination, and high-performance liquid
chromatography analysis. Samples for GC analysis were taken when glucose was
depleted (defined by the zero value of CO2 in the effluent gas).
4.4.5. Analytical methods
Optical density was measured at 600 nm with a Shimadzu UV-Mini 1240
spectrophotometer. Dry weight of biomass was determined gravimetrically by
filtration of a known volume of culture over a pre-dried and weighed 0.45 μm-pore-
size filter. The filter with biomass was rinsed with a two-fold volume of 0.9% NaCl,
dried in a microwave oven at 150 W for 20 min and weighed again.
The concentrations of glucose, pyruvate, acetate, succinate, glycerol, and ethanol
were measured by using isocratic high-performance liquid chromatography with
refractive Index detection on an Agilent 1100 system (Waldbronn, Germany)
equipped with cooled autosampler (5 °C). Separation was conducted on an Aminex
HPX-87H ion-exclusion column, and 5 mM of H2SO4 as the mobile phase at a flow
rate of 0.6 milliliter per minute at 60 °C was used. Twenty μl of sample were injected,
and concentrations were determined against freshly prepared external standards.
80
Chapter 4
65
Isobutanol was determined using static head space-gas chromatography on a
PerkinElmer HS 40 Head-space sampler (Waltham, Massachusetts, USA) connected
to a Perkin Elmer PE Autosystem gas chromatograph equipped with a Flame
Ionization Detector (FID) and 60 m, 0.25 mm ID, 1 µm, DB-5 capillary column.
Samples (1 ml in 20 ml sealed head space vials) were equilibrated for 5 min at 60 °C
in the auto sampler. The temperature of the needle and the transfer line was 90 °C.
Helium carrier gas was used at 20 psi. The temperatures of the injector and the
detector were set to 200 °C and 250 °C, respectively. The oven temperature program
was 1 min at 60 °C and then 10 °C per min to 150 °C.
Quantification had to be done using standard addition, since the slope of the
calibration curve in pure water was different from the one obtained by spiking the
fermentation sample with standards. Standard addition was done at three different
levels using 50 μl isobutanol standard solutions to certain volume of sample solutions.
The corresponding addition were 7-100%, 40-150%, and 57-300% extra isobutanol.
R2 of the corresponding addition curves were in all cases larger than 0.96, and in most
cases over 0.98. The initial isobutanol concentration was extrapolated by the readings
changed before and after adding the standard solutions. Quantification of 2-methyl
butanol and 3-methyl butanol was done by using isobutanol as the internal standard.
The response factor differences of 2-methyl butanol and 3-methyl butanol versus
isobutanol were determined by calibration with mixtures of isobutanol, 2-methyl
butanol and 3-methyl butanol spiked into the media blank, at different concentrations
similar to the ones observed in real samples.
Acknowledgements
The authors would like to acknowledge Peter Kötter for providing the applied yeast
strain CEN.PK 2-1C. Uffe Hasbro Mortensen is acknowledged for his support and
valuable comments. Furthermore, we would like to thank Jesper Mogensen and Jette
Jepmond Mortensen for expert technical assistance. The authors gratefully
acknowledge a contribution to the fellowship for X.C. from the S.C. Van Foundation,
Denmark.
81

Chapter 4
66
References
1. Connor MR, Liao JC: Microbial production of advanced transportation
fuels in non-natural hosts. Curr Opin Biotechnol 2009, 20:307-315.
2. Cronk TC, Mattick LR, Steinkraus KH, Hackler LR: Production of higher
alcohols during indonesian tape ketan fermentation. Appl Environ
Microbiol 1979, 37:892-896.
3. Giudici P, Romano P, Zambonelli C: A biometric study of higher alcohol
production in Saccharomyces cerevisiae. Can J Microbiol 1990, 36:61-64.
4. Atsumi S, Hanai T, Liao JC: Non-fermentative pathways for synthesis of
branched-chain higher alcohols as biofuels. Nature 2008, 451:86-89.
5. Smith KM, Cho KM, Liao JC: Engineering Corynebacterium glutamicum
for isobutanol production. Appl Microbiol Biotechnol 2010, 87:1045-1055.
6. Hohmann S: Osmotic adaptation in yeast-control of the yeast osmolyte
system. In International Review of Cytology. Edited by Zeuthen T, Stein WD.
California: Academic Press; 2002: 149-188. [Molecular mechanisms of water
transport across biological membranes, vol 215.]
7. Knoshaug EP, Zhang M: Butanol tolerance in a selection of
microorganisms. Appl Biochem Biotechnol 2009, 153:13-20.
8. Hazelwood LA, Daran JM, van Maris AJ, Pronk JT, Dickinson JR: The
Ehrlich pathway for fusel alcohol production: a century of research on
Saccharomyces cerevisiae metabolism. Appl Environ Microbiol 2008,
74:2259-2266.
9. Dickinson JR, Harrison SJ, Hewlins MJ: An investigation of the metabolism
of valine to isobutyl alcohol in Saccharomyces cerevisiae. J Biol Chem
1998, 273:25751-25756.
10. Yoshimoto H, Fukushige T, Yonezawa T, Sone H: Genetic and physiological
analysis of branched-chain alcohols and isoamyl acetate production in
Saccharomyces cerevisiae. Appl Microbiol Biotechnol 2002, 59:501-508.
11. Larry Cameron Anthony A, PA (US), Lixuan Lisa Huang H, DE (US), Rick
W. Ye H, DE (US): Production of isobutanol in yeast mitochondria. Pub.
No.: US 20100129886A1. United States. 2010. Patent.
12. Reid M. Renny Feldman HR, CO (US), Uvini Gunavardena I, CA (US), Jun
Urano A, CO (US), Peter Meinhold D, CO (US), Aristos A. Aristidou HR, CO
82

Chapter 4
67
(US), Catherine Asleson Dundon E, CO (US), Christopher Smith E, CO (US):
Yeast organism producing isobutanol at high yield. Pub. No.: US
20090226991 A1. United States. 2009. Patent.
13. Berben G, Dumont J, Gilliquet V, Bolle PA, Hilger F: The YDp plasmids: a
uniform set of vectors bearing versatile gene disruption cassettes for
Saccharomyces cerevisiae. Yeast 1991, 7:475-477.
14. Ferreira ID, Rosario VE, Cravo PV: Real-time quantitative PCR with SYBR
Green I detection for estimating copy numbers of nine drug resistance
candidate genes in Plasmodium falciparum. Malar J 2006, 5:1.
15. Yi CX, Zhang J, Chan KM, Liu XK, Hong Y: Quantitative real-time PCR
assay to detect transgene copy number in cotton (Gossypium hirsutum).
Anal Biochem 2008, 375:150-152.
16. Kispal G, Steiner H, Court DA, Rolinski B, Lill R: Mitochondrial and
cytosolic branched-chain amino acid transaminases from yeast, homologs
of the myc oncogene-regulated Eca39 protein. J Biol Chem 1996,
271:24458-24464.
17. Eden A, Simchen G, Benvenisty N: Two yeast homologs of ECA39, a target
for c-Myc regulation, code for cytosolic and mitochondrial branched-
chain amino acid aminotransferases. J Biol Chem 1996, 271:20242-20245.
18. Lilly M, Bauer FF, Styger G, Lambrechts MG, Pretorius IS: The effect of
increased branched-chain amino acid transaminase activity in yeast on
the production of higher alcohols and on the flavour profiles of wine and
distillates. FEMS Yeast Res 2006, 6:726-743.
19. Sentheshanuganathan S: The mechanism of the formation of higher
alcohols from amino acids by Saccharomyces cerevisiae. Biochem J 1960,
74:568-576.
20. Dickinson JR: Pathways of leucine and valine catabolism in yeast. Methods
Enzymol 2000, 324:80-92.
21. Cullin C, Baudin-Baillieu A, Guillemet E, Ozier-Kalogeropoulos O:
Functional analysis of YCL09C: evidence for a role as the regulatory
subunit of acetolactate synthase. Yeast 1996, 12:1511-1518.
83

Chapter 4
68
22. Pang SS, Duggleby RG: Expression, purification, characterization, and
reconstitution of the large and small subunits of yeast acetohydroxyacid
synthase. Biochemistry 1999, 38:5222-5231.
84

Chapter 5
69
Chapter 5. Application of genome-scale model in metabolic engineering of Saccharomyces cerevisiae for improvement of isobutanol production
Xiao Chen*, Irina Borodina; Kaisa Karhumaa; Morten Kielland-Brandt;
Mikael Rørdam Andersen
Abstract
Cellular metabolism is a complex system by nature, and should be analyzed as a
whole in metabolic engineering. In this study, the genome-scale stoichiometric model
of Saccharomyces cerevisiae was applied to find genetic manipulation targets for
improvement of isobutanol production in S. cerevisiae strains. The BioOpt software,
which performs flux balance analysis using linear programming, was used for in silico
cell metabolism simulation. An updated version of iFF708 was established and
designated iFF708_IDU. The positive effect of overexpression of BAT2 on isobutanol
production was achieved in this updated version. In this study, the anaerobic
fermentation data of four S. cerevisiae strains, three overexpression strains and one
reference strain, were compared with their corresponding in silico simulation data. A
fair agreement was obtained between the experimental data and the simulation results,
indicating the feasibility of applying genome-scale model in metabolic engineering.
Single gene overexpression and deletion were applied to the overexpression strain
ILV2356_XCY605 to predict the possible genetic manipulation targets for
overexpression and deletion. Genetic modifications and fermentations should be
carried out in order to validate the predicted overexpression and deletion targets for
further improvement of isobutanol yield in S. cerevisiae.
85

Chapter 5
70
5.1. Introduction
Metabolic engineering is an effective way to improve strains for a desried property.
Finding the correct targeted genes is not easy since cellular metabolism is a complex
system by nature. Analysis based on small-scale metabolic pathways may often result
in unsuccessful or suboptimal modifications (Kim et al. 2008; Nevoigt 2008).
Analysis of the whole metabolic network is more appropriate in principle.
Owing to the important role of S. cerevisiae both in industry and academic research,
extensive fundamental studies have been carried out (Costanzo et al. 2001; DeRisi et
al. 1997; Goffeau 1997; Mewes et al. 2002; Uetz et al. 2000). Its complete genome
sequence became available in 1996 (Goffeau et al. 1996). Based on all this knowledge
of S. cerevisiae, the first genome-scale stoichiometric model, iFF708, was established
by the research groups of Jens Nielsen and Bernhard Ø. Palsson (Forster et al. 2003a).
The model has integrated genomic, biochemical, and physiological information of S.
cerevisiae at different levels (Forster et al. 2003a).
The iFF708 model contains 708 structural open reading frames (ORFs), 1175
metabolic reactions and 584 metabolites in total. Establishment of this genome-scale
model has made it possible to take the interactions of different pathways into
consideration. Based on the overall analysis, we can most likely identify the proper
target genes for manipulation (Famili et al. 2003; Forster et al. 2003b).
One possible application of the genome-scale model is within the area of biofuels.
The transition to biofuels plays an important role in meeting the challenges of energy
security and climate change since the feestocks for biofuel production is sustainable.
Isobutanol, with higher energy density, lower hygroscopicity and higher octane
number compared to ethanol, has received more and more attention as a potential
biofuel. Isobutanol is formed from the valine degradation pathway in cytosol in S.
cerevisiae, while the valine biosynthetic pathway occurs in mitochondria (Dickinson
et al. 1998) (Figure 5.1). The obvious strategy is to direct more carbon from pyruvate
to valine and further to isobutanol biosynthetic pathways by overexpression of the
genes, ILV2, ILV5, ILV3, BAT1, and BAT2 on the pathway from pyruvate to valine
and further to isobutanol. Enzyme Ilv2, Ilv5, and Ilv3 catalyze the reactions from
86
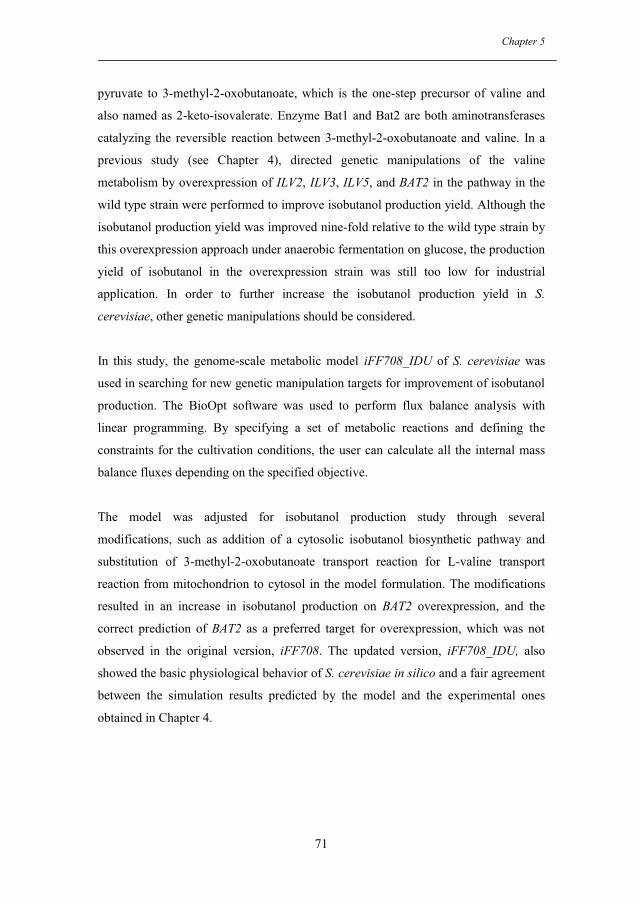
Chapter 5
71
pyruvate to 3-methyl-2-oxobutanoate, which is the one-step precursor of valine and
also named as 2-keto-isovalerate. Enzyme Bat1 and Bat2 are both aminotransferases
catalyzing the reversible reaction between 3-methyl-2-oxobutanoate and valine. In a
previous study (see Chapter 4), directed genetic manipulations of the valine
metabolism by overexpression of ILV2, ILV3, ILV5, and BAT2 in the pathway in the
wild type strain were performed to improve isobutanol production yield. Although the
isobutanol production yield was improved nine-fold relative to the wild type strain by
this overexpression approach under anaerobic fermentation on glucose, the production
yield of isobutanol in the overexpression strain was still too low for industrial
application. In order to further increase the isobutanol production yield in S.
cerevisiae, other genetic manipulations should be considered.
In this study, the genome-scale metabolic model iFF708_IDU of S. cerevisiae was
used in searching for new genetic manipulation targets for improvement of isobutanol
production. The BioOpt software was used to perform flux balance analysis with
linear programming. By specifying a set of metabolic reactions and defining the
constraints for the cultivation conditions, the user can calculate all the internal mass
balance fluxes depending on the specified objective.
The model was adjusted for isobutanol production study through several
modifications, such as addition of a cytosolic isobutanol biosynthetic pathway and
substitution of 3-methyl-2-oxobutanoate transport reaction for L-valine transport
reaction from mitochondrion to cytosol in the model formulation. The modifications
resulted in an increase in isobutanol production on BAT2 overexpression, and the
correct prediction of BAT2 as a preferred target for overexpression, which was not
observed in the original version, iFF708. The updated version, iFF708_IDU, also
showed the basic physiological behavior of S. cerevisiae in silico and a fair agreement
between the simulation results predicted by the model and the experimental ones
obtained in Chapter 4.
87
Chapter 5
72
2-aceto-lactate
2,3-dihydroxy-isovalerate
3-methyl-2-oxobutanoate
L-Valine
Ilv2 Ilv6CO2
H+, NADPH
NADPIlv5
H2O Ilv3
L-glutamate
2-oxoglutarateBat1
isobutanol
Pdc6,5,1 ADHs
CO2 NADH NADisobutanal
PyruvateMitochondria:
L-Valine 3-methyl-2-oxobutanoateBat2Cytosol:
L-glutamate2-oxoglutarate
2-aceto-lactate
2,3-dihydroxy-isovalerate
3-methyl-2-oxobutanoate
L-Valine
Ilv2 Ilv6CO2
H+, NADPH
NADPIlv5
H2O Ilv3
L-glutamate
2-oxoglutarateBat1
isobutanol
Pdc6,5,1 ADHs
CO2 NADH NADisobutanal
PyruvateMitochondria:
3-methyl-2-oxobutanoateCytosol:
Figure 5.1. A: The isobutanol biosynthetic pathway in S. cerevisiae suggested by this study; B: The isobutanol biosynthetic pathway resulting in the addition of the cytosolic steps of Pdc6 and Adh3 to the iFF708 model.
We also applied the options for prediction of single gene overexpression and deletion
by BioOpt to the overexpression strain ILV2356_XCY605 with the anaerobic
fermentation on glucose as the reference metabolic state. The genes predicted by the
model were ILV3, ILV5, ILV2, BAT1, and BAT2, which are directly involved in the
isobutanol biosynthetic pathway, and IDP3, CTP1, PUT2, CDC21, and CDC8, which
facilitate the formation of NADPH, glutamate, 2-oxoglutarate, and NADH, the
A
B
88
Chapter 5
73
cofactors used in valine and isobutanol biosynthetic pathways. Simulation of single
gene deletion showed that deletion of MDH1, LSC2, KGD1, or YAT1, which are
involved in the tricarboxylic acid cycle (TCA cycle), released the pyruvate used for
TCA cycle for valine and isobutanol biosynthesis. The simulation data also showed
that deletion of gene GLY1 facilitated the use of a NADH forming reaction for glycine
biosynthesis, and thereby facilitated isobutanol production in cytosol. This study
proved the prediction capability of the genome-scale model. However, real genetic
modifications and fermentations should be carried out to verify these predictions
made by the model.
5.2. Methods
5.2.1. Experimental data
The experimental data used in this study are obtained from anaerobic fermentations of
S. cerevisiae strains (listed in Table 5.1) on glucose in mineral medium at 30 °C.
The detailed description of the plasmids used for the construction of the
overexpression strains and the anaerobic fermentations performed are described in the
Methods section of Chapter 4.
Table 5.1. Strains, of which the anaerobic fermentation data was used in the study Strain Relevant characteristics Description of the
genotype Source or reference
CEN.PK 113-5D MATα SUC2 MAL8c ura3-52 Wild type P. Kötter
ILV235_XCY561 CEN.PK 2-1C with YDp-H_P+ILV5, YDp-L_P+ILV2, and YDp-W_P+ILV3 inserted into the genome.
With gene ILV2 ILV3 ILV5 overespressed
Chapter 4
ILV2356_XCY605 CEN.PK 2-1C with YDp-H_P+ILV5, YDp-L_P+ILV2, YDp-W_P+ILV3, and YDp-U_P+ILV6 inserted into the genome.
With gene ILV2 ILV3 ILV5 ILV6
overespressed
Chapter 4
ILV235BAT2_XCY715, ILV235BAT2_XCY723
CEN.PK 2-1C with YDp-H_P+ILV5, YDp-L_P+ILV2, YDp-W_P+ILV3, and YDp-U_P+BAT2 inserted into the genome.
With gene ILV2 ILV3 ILV5 BAT2
overespressed
Chapter 4
89
Chapter 5
74
5.2.2. Model and simulation tool
All modeling was made based on the S. cerevisiae iFF708 model (Forster et al.
2003a), or an updated version of it, iFF708_IDU, which was established in this study.
The BioOpt software, a commercially available linear programming (LP) solver from
Lindo Systems Inc, was used as the simulation tool. Simulation calculations were
performed using LP with an objective function, which is specific according to
individual experiments as described in Forster et al. (2003a).
The compartmentalization of the reactions for the isobutanol biosynthesis in the
iFF708 model did not agree with our hypothesis, in which L-valine is first produced
in the mitochondrion, and then exported to the cytosol and degraded into 3-methyl-2-
oxobutanoate in the cytosol. The 3-methyl-2-oxobutanoate is converted into
isobutanol in two steps. The updated version, iFF708_IDU, was made with the
following changes in the model formulation relative to iFF708: 1) insertion of a
cytosolic isobutanol production pathway. Reactions of conversion of 3-methyl-2-
oxobutanoate to isobutanol and further to isobutanol, which are catalyzed by PDC6,
PDC5, PDC1, ADH1, ADH2, ADH3, ADH4, ADH5, and SFA1, were added; 2)
addition of an extra mitochondrial function of BAT1 for formation of L-valine from 3-
methyl-2-oxobutanoate; 3) substitution of 3-methyl-2-oxobutanoate transport reaction
from mitochondrion to cytosol for L-valine transport reaction from mitochondrion to
cytosol; 4) since the model prefers to produce L-leucine rather than to produce
isobutanol, the export flux of L-leucine from cytosol to the extracellular space was
setted to zero in order to study the isobutanol production in silico.
5.2.2. General settings for stating different genetic and metabolic backgrounds
The fluxes in both iFF708 and iFF708_IDU model were set to fit the genetic
background of the strain and the experimental conditions. The growth mineral
medium with uracil supplemented was presented by including the components on a
one gram glucose basis as follows: glucose is from 0 to 5.55 mmol; NH4+is from 0 to
3.8 mmol; PO43- is from 0 to 1.1 mmol; SO4
2- is from 0 to 0.1 mmol; uracil is from 0
to 0.022 mmol. If the model simulation led to a flux equal to zero, the flux was reset
90
Chapter 5
75
to its corresponding experimental value. The overexpression background for ILV2,
ILV3, ILV5, and BAT2 overexpression was modeled by increasing the original flux
catalyzed by these genes by 12.5 %. Oxygen uptake was set to zero to simulate the
anaerobic condition. The URA3 gene was deleted in the background if the strain is
uracil auxotrophic.
5.2.3. Single gene deletions
Single gene deletion predictions were performed by using the built-in option in
BioOpt for single gene deletion. The model was run by setting biomass growth as the
objective function. The predicted knockout strains with increased isobutanol yield
compared to the overexpression strain ILV2356_XCY605 were examined.
5.2.4. Overexpression studies
The effects of overexpressing single genes on isobutanol yield were studied by
applying the built-in option in BioOpt for single gene overexpression. Biomass
growth was set as the objective function. The predicted overexpressions with
increased isobutanol yield compared to the overexpression strain ILV2356_XCY605
were examined.
5.3. Results and discussions
The genome-scale metabolic stoichiometric model, iFF708_IDU, the updated version
of iFF708, was applied to searching genetic manipulation targets for improvement of
isobutanol production in S. cerevisiae strain with gene ILV2, ILV3, ILV5, and BAT2
overexpressed, ILV2356_XCY605.
5.3.1. Verification of the metabolic simulation model
First, the model was checked for its ability of describing the basic physiological
characteristics of S. cerevisiae. The flux distribution of the wild type under aerobic
and anaerobic cultivations on glucose was simulated using biomass yield as the
91
Chapter 5
76
objective function. The simulation results showed that a large increase in ethanol
production was obtained when oxygen uptake rate was set to zero in the model, and
under aerobic fermentation conditions high CO2 and low ethanol productions were
observed. The simulation results are in agreement with the physiological
characteristics of S. cerevisiae.
The cytosolic isobutanol biosynthetic pathway, or in other words the cytosolic valine
degradation pathway, which are catalyzed by Pdc1, Pdc5, Pdc6, Adh1, Adh2, Adh3,
Adh4, Adh5, and Sfa1, together with the reactions, the formation of valine from 3-
methyl-2-oxobutanoate and the formation of 3-methyl-2-oxobutanoate from valine
catalyzed by Bat1 in mitochondria, were added in the model formulation as described
in the Methods section.
The original model iFF708 with the addition of isobutanol synthesis pathway has a
preference to make isobutanol from 3-methyl-2-oxobutanoate, which is transported
from mitochondria to cytosol, through the catalyzation of PDCs and ADHs enzymes
in cytosol. However, our hypothesis is that most of isobutanol is made from valine,
which is transported from mitochondria, through the three steps catalyzed with the
enzymes encoded by BAT2, PDCs, and ADHs in cytosol. Based on this hypothesis,
the reaction of transporting 3-methyl-2-oxobutanoate from mitochondrion to cytosol
is substituted for reaction of transporting L-valine from mitochondrion to cytosol in
the model formulation. The model with the above modifications was designated
iFF708_IDU.
The prediction capability of this model, iFF708_IDU, was checked through
comparison of the anaerobic fermentation data for four S. cerevisiae strains and the in
silico simulation data under the same genetic and metabolic background. These four
S. cerevisiae strains were CEN.PK 113-5D, ILV235_XCY561, ILV2356_XCY605,
and ILV235BAT2_XCY715/723. The metabolic background was anaerobic
fermentation in mineral medium with glucose as the growth-limiting substrate and
with uracil supplemented. The setting of the genetic and metabolic background in the
model was done as described in the Methods section. Known experimental fluxes
which were predicted to be zero by the model, namely the pyruvate and acetate yields
92

Chapter 5
77
in all four strains and the isobutanol and glycerol yields in CEN.PK 113-5D, were
replaced with the experimental data in the model formulation. With these fixed yields,
the yields of other major metabolites, including biomass, ethanol, succinate, CO2,
isobutanol (not in wild type) and glycerol (not in wild type), were predicted again by
the model and compared with the experimental data (Table 5.2). It was shown that
most of the predicted data were close to the experimental data. This result indicates
that the model should have a fair prediction ability with these specific cultivation
conditions and the genetic background.
To further validate the pathway changes made to the metabolic model (see Figure
5.1), predictions of the effect of single gene overexpression on isobutanol yield were
performed to strain CEN.PK 113-5D with biomass yield as the objective function in
model iFF708 and iFF708_IDU. The simulation results showed that the
overexpression of gene BAT2, which encodes cytoplasmic branched-chain amino acid
aminotransferase catalyzing the first step of valine degradation in cytosol, had no
effect on isobutanol production according to the predictions of model iFF708.
However, this result does not agree with our earlier experimental observation that
overexpression of BAT2 enhanced isobutanol production yield by two-fold (Chapter
4). With the modified model, iFF708_IDU, increased isobutanol yield on BAT2
overexpression was achieved in silico.
5.3.2. Prediction of further genetic manipulation targets in ILV2356_XCY605
In order to further improve isobutanol production yield in S. cerevisiae, a study of the
effect of single gene overexpression or deletion on isobutanol production yield was
performed in model iFF708_IDU. Strain ILV2356_XCY605 was chosen for this
analysis due to the accurate predictions of the fluxes in this strain by iFF708_IDU in
the previous model prediction ability test (Table 5.2). In the formulation of the model,
the genetic and metabolic reference state was set as anaerobic fermentation in mineral
medium with glucose as the growth-limiting substrate and with the genes ILV2, ILV3,
and ILV5 overexpressed. The overexpressions and knockouts, which would be
feasible to perform and could give as much as 20% more isobutanol production yield
according to the prediction, are discussed in below.
93

Chapter 5
78
5.3.2.1 Overexpression targets in ILV2356_XCY605
Single gene overexpression prediction was performed with the built-in single gene
overexpression option of BioOpt by optimization for growth. The genes, which gave
more than 20% increased isobutanol production yield when it was overexpressed in
the model, together with the simulated isobutanol production yield and the growth of
the strain are listed in Table 5.3. Gene ILV3, ILV5, ILV2, and ILV6, which were
already overexpressed in ILV2356_XCY605, were suggested to be further
overexpressed by the model. Firstly, this is a further confirmation of the validity of
the predictions. Secondly, this suggests that stronger overexpression of these genes,
like insertion of multiple copies of these genes in S. cerevisiae genome, could be
applied in the future strain construction. BAT1, which catalyzes the bidirectional
reaction between 3-methyl-2-oxobutanoate and valine in mitochondria, was also
suggested as an overexpression target by the model. Overexpression of IDP3, the
isocitrate dehydrogenase, and CTP1, the mitochondrial inner membrane citrate
transporter, resulted in an increase of 2-oxoglutarate formation in the cytosol in the
simulation. Since 2-oxoglutarate is the co-factor needed for conversion of valine to 3-
methyl-2-oxobutanoate, overexpression of IDP3 and CTP1 could have the possibility
of facilitating the formation of isobutanol in the cell.
PUT2, encoding the enzyme that is involved in proline degradation pathway in
mitochondria, was also predicted as an overexpression target by the model. The
reaction catalyzed by PUT2 encoded enzyme generates NADPH and glutamate as by-
products in mitochondria, which are needed for valine biosynthesis from pyruvate. As
a result, overexpression of PUT2 could also probably facilitate the valine biosynthesis
in mitochondria, and thereby the isobutanol production in cytosol.
CDC21, encoding the thymidylate synthase, and CDC8, encoding the thymidylate and
uridylate kinase, which are used in the biosynthesis of pyrimidine
deoxyribonucleotides in cytosol, were also in the list of predicted overexpression
targets by the model. The analysis of the S. cerevisiae metabolic network showed that
overexpression of these genes facilitated the use of METTHF, and the METTHF
formation process generates NADH. NADH is used in the formation of isobutanol
94

Chapter 5
79
from isobutanal. In the model simulation, overexpression of CDC21 and CDC8
assisted the isobutanol production since more NADH was generated in the cytosol.
In summary, besides the genes directly involved in the isobutanol biosynthetic
pathway, ILV3, ILV5, ILV2, BAT2, and BAT1, the model preferred to generate more
glutamate and cofactor NADPH in mitochondria, and 2-oxoglutarate and reaction
cofactor NADH in cytosol, which are needed in isobutanol biosynthetic pathway, by
overexpressing genes, IDP3, CTP1, PUT2, CDC21, and CDC8 in order to facilitate
the isobutanol production.
5.3.2.2 Deletion targets in ILV2356_XCY605
Single gene deletion prediction was performed with the built-in single gene deletion
option of BioOpt by optimization for growth. The knockouts, which gave increased
isobutanol yield, together with their isobutanol production yield and the growth of the
strain (biomass yield) are listed in Table 5.4. The viability of these knockouts was
verified by examination of the Saccharomyces genome database
(http://www.yeastgenome.org).
In Table 5.4, gene MDH1, encoding mitochondrial malate dehydrogenase, gene LSC2,
encoding beta subunit of succinyl-CoA ligase, and gene KGD1, encoding component
of the mitochondrial alpha-ketoglutarate dehydrogenase complex, are involved in the
tricarboxylic acid (TCA) cycle in mitochondria and were all predicted to facilitate
isobutanol production with their deletions. Deletion of gene YAT1 encoding the outer
mitochondrial carnitine acetyl transferase, which is involved in transport of activated
acyl groups from the cytoplasm to the mitochondrial matrix needed for the TCA cycle,
was predicted by the model as well. All these single gene deletions would result in
the disruption of the TCA cycle and the decrease of the ATP formation rate in
mitochondria in S. cerevisiae, even though the cell still stays viable. Since the TCA
cycle is competing for pyruvate with the valine biosynthetic pathway in mitochondria
(Figure 5.1), the model suggests shuting down the TCA cycle to facilitate valine
biosynthesis in mitochondria, and thus isobutanol production in cytosol.
95

Chapter 5
80
According to the simulation results, deletion of gene GLY1, which encodes threonine
aldolase that catalyzes the cleavage of L-allo-threonine and L-threonine to glycine,
disrupted the formation of glycine and acetaldehyde from threonine, and resulted in
use of the reaction: L-threonine + NAD+ → acetate + glycine + NADH for glycine
production. In other words, deletion of GLY1 resulted in the increase of NADH level
in cytosol, and thus assisted the production of isobutanol in the model.
Table 5.2. Comparision of the anaerobic fermentation data of four S. cerevisiae strains with the in silico calculated data by iFF708_IDU
Yield (mmol/g glucose) Isobutanol Biomassc Ethanol Pyruvate Succinate Glycerol Acetate CO2
CEN.PK 113-5D
Experimental data 0.002 0.102 8.204 0.012 0.014 1.088 0.129 7.319
Modeling data 0.002 0.097 8.303 0.012 0.034 1.088 0.129 8.907
Deviation 5% 1% 147% 22%
ILV235_XCY561
Experimental data 0.013 0.105 8.092 0.018 0.005 0.942 0.149 8.75
Modeling data 0.085 0.086 8.303 0.018 0.114 0.79 0.149 8.876
Deviation 550% 18% 3% 1982% 16% 1%
ILV2356_XCY605
Experimental data 0.005 0.105 7.988 0.031 0.03 1.073 0.117 9.198
Modeling data 0.009 0.101 8.882 0.031 0.042 0.501 0.117 9.195
Deviation 92% 4% 11% 43% 53% 0%
ILV235BAT2_XCY715 /723
Experimental data 0.029 0.073 7.32 0.036 0.024 1.027 0.186 8.474
Modeling data 0.013 0.096 8.776 0.036 0.045 0.461 0.186 9.07
Deviation 56% 32% 20% 87% 55% 7%
aThe data in a yellow box were fixed with the experimental data since they were predicted as zero in the simulation. bThe data in a green box stands for the predicted data by the model. cThe biomass yield is presented as gram biomass per gram glucose.
96

Chapter 5
81
Table 5.3. The overexpression targets predicted by genome-scale model iFF708_IDU Overexpressed gene
Name Predicted isobutanol production (mmol/g glc)
Predicted growth (g/g glc)
/ No overexpression 0.0089 0.1010
ILV3 Dihydroxy-acid dehydratase, mitochondrial
0.0286 0.0973
ILV5 Ketol-acid reductoisomerase, mitochondrial
0.0286 0.0973
ILV2 Acetolactate synthase catalytic subunit, mitochondrial
0.0286 0.0973
BAT2 Branched-chain-amino-acid aminotransferase, cytosolic
0.0147 0.1001
BAT1 Branched-chain-amino-acid aminotransferase, mitochondrial
0.0208 0.0991
IDP3 Isocitrate dehydrogenase [NADP] 0.0104 0.0990
CTP1 Tricarboxylate transport protein, exchange of citrate and isocitrate from cytosol to mitochondrion
0.0104 0.0990
PUT2 Delta-1-pyrroline-5-carboxylate dehydrogenase, mitochondrial
0.0348 0.0968
CDC21 Thymidylate synthase 0.0864 0.0795
CDC19 Pyruvate kinase 1 0.0212 0.0847
CDC8 Thymidylate kinase 0.1176 0.0809
Table 5.4. The deletion targets predicted by genome-scale model iFF708_IDU
Gene Name Predicted isobutanol production (mmol/g glc)
Predicted growth (g/g glc)
/ No deletion 0.0089 0.1010
MDH1 Alpha-ketoglutarate dehydrogenase
0.0194 0.0871
LSC2 Beta subunit of succinyl-CoA ligase
0.0129 0.0957
KGD1 Component of the mitochondrial alpha-ketoglutarate dehydrogenase complex
0.0129 0.0957
YAT1 Putative mitochondrial carnitine O-acetyltransferase
0.0105 0.0988
GLY1 Low specificity L-threonine aldolase
0.0105 0.0989
97

Chapter 5
82
5.4. Conclusions and future perspectives
In this study, a genome-scale model of S. cerevisiae was applied to searching for
potential genetic manipulation targets for further improvement of isobutanol
production yield in the isobutanol-producing strain ILV2356_XCY605. To adjust the
original model iFF708 for isobutanol production study, several modifications were
made, such as integration of a cytosolic isobutanol biosynthetic pathway, and
substitution of 3-methyl-2-oxobutanoate transport reaction for L-valine transport
reaction from mitochondrion to cytosol in the model formulation. The modified model
was designated iFF708_IDU. With the modified model, an increase of isobutanol
yield was achieved when gene BAT2, which encodes the branched-chain amino acid
aminotransferase catalyzing the first step of valine degradation in cytosol, was
overexpressed in the model. This in silico simulation result was consistent with the
experimental one carried out in Chapter 4. The fact that the anaerobic fermentation
data of four S. cerevisiae strains was fairly consistent with their corresponding in
silico simulation, indicates that the genome-scale model has a reasonable prediction
capability under specific genetic and metabolic conditions.
In silico single gene overexpression and deletion analysis were carried out with
biomass yield as the objective function in the model iFF708_IDU using
ILV2356_XCY605 as the reference strain. The simulation results showed that further
overexpression genes, ILV3, ILV5, ILV2, BAT1, and BAT2, which are directly
involved in the isobutanol biosynthetic pathway, increased isobutanol production
yield. Moreover, overexpression of genes, IDP3, CTP1, PUT2, CDC21, and CDC8,
resulted in formation of more NADPH and glutamate in the mitochondria, and more
2-oxoglutarate and NADH in the cytosol, which are the cofactors used in valine and
isobutanol biosynthetic pathways. Increase of these cofactors facilitated the isobutanol
production. Simulation of single gene deletion showed that deletion of MDH1, LSC2,
KGD1, or YAT1, which are involved in the TCA cycle, disrupted the TCA cycle in
mitochondria, and released the pyruvate used for TCA cycle for valine biosynthesis,
and further enhanced the isobutanol biosynthesis. Deletion of gene GLY1 facilitated
the use of a NADH forming reaction for glycine biosynthesis, and thereby facilitated
isobutanol production in cytosol.
98

Chapter 5
83
All these in silico improvements of isobutanol production yield caused by the above
genetic manipulations suggested by the model should be verified through real
experiments in the future.
References
Costanzo MC, Crawford ME, Hirschman JE, Kranz JE, Olsen P, Robertson LS,
Skrzypek MS, Braun BR, Hopkins KL, Kondu P and others. 2001. YPD,
PombePD and WormPD: model organism volumes of the BioKnowledge
library, an integrated resource for protein information. Nucleic Acids Res
29(1):75-9.
DeRisi JL, Iyer VR, Brown PO. 1997. Exploring the metabolic and genetic control of
gene expression on a genomic scale. Science 278(5338):680-6.
Dickinson JR, Harrison SJ, Hewlins MJ. 1998. An investigation of the metabolism of
valine to isobutyl alcohol in Saccharomyces cerevisiae. J Biol Chem
273(40):25751-6.
Famili I, Forster J, Nielsen J, Palsson BO. 2003. Saccharomyces cerevisiae
phenotypes can be predicted by using constraint-based analysis of a genome-
scale reconstructed metabolic network. Proc Natl Acad Sci U S A
100(23):13134-9.
Forster J, Famili I, Fu P, Palsson BO, Nielsen J. 2003a. Genome-scale reconstruction
of the Saccharomyces cerevisiae metabolic network. Genome Res 13(2):244-
53.
Forster J, Famili I, Palsson BO, Nielsen J. 2003b. Large-scale evaluation of in silico
gene deletions in Saccharomyces cerevisiae. OMICS 7(2):193-202.
Goffeau A. 1997. The yeast genome directory. Nature 387(6632 Suppl):5.
Kim TY, Sohn SB, Kim HU, Lee SY. 2008. Strategies for systems-level metabolic
engineering. Biotechnol J 3(5):612-23.
Mewes HW, Frishman D, Guldener U, Mannhaupt G, Mayer K, Mokrejs M,
Morgenstern B, Munsterkotter M, Rudd S, Weil B. 2002. MIPS: a database for
genomes and protein sequences. Nucleic Acids Res 30(1):31-4.
Nevoigt E. 2008. Progress in metabolic engineering of Saccharomyces cerevisiae.
Microbiol Mol Biol Rev 72(3):379-412.
99
Chapter 5
84
Uetz P, Giot L, Cagney G, Mansfield TA, Judson RS, Knight JR, Lockshon D,
Narayan V, Srinivasan M, Pochart P and others. 2000. A comprehensive
analysis of protein-protein interactions in Saccharomyces cerevisiae. Nature
403(6770):623-7.
100

Chapter 6
85
Chapter 6. Conclusions and future perspectives
This thesis represents an effort for further developing S. cerevisiae as a cell factory
for production of two chemicals of industrial interest: δ-(L-α-aminoadipyl)–L-
cysteinyl–D-valine (LLD-ACV) as a nonribosomal peptide and isobutanol as biofuel.
Production of both chemicals was realized by metabolic engineering of the amino acid
metabolism in S. cerevisiase, which was chosen due to its several favourable traits for
a large scale industrial fermentation.
Conclusions regarding production of LLD-ACV
The Penicillium chrysogenum gene pcbAB encoding ACV synthetase was expressed
in S. cerevisiae from a high-copy plasmid together with phosphopantetheinyl
transferase (PPTase) encoding genes from Aspergillus nidulans, P. chrysogenum and
Bacillus subtilis, and in all the three cases production of ACV was observed.
Several factors were investigated to improve ACV synthesis. Codon optimization of
5' end of pcbAB did not significantly increase ACV production. However, a 30-fold
enhancement was achieved by lowering the cultivation temperature from 30 to 20 ºC.
When ACVS and PPTase encoding genes were integrated into the yeast genome a 6-
fold decrease in ACV production was observed, indicating that gene copy number
was one of the rate-limiting factors for ACV production in yeast.
Conclusions regarding production of isobutanol
By simultaneous overexpression of genes ILV2, ILV3, and ILV5 in valine metabolism
pathway in anaerobic fermentation of glucose in mineral medium in S. cerevisiae, the
isobutanol yield was improved from 0.16 to 0.97 mg per g glucouse. The yield was
further improved by two times by the additional expression of BAT2, encoding the
cytoplasmic branched-chain amino acid aminotransferase. However, overexpression
of ILV6, encoding the regulatory subunit of Ilv2, in the ILV2 ILV3 ILV5
overexpression strain decreased the yield by three times, presumably by increasing the
101
Chapter 6
86
sensitivity of Ilv2 to valine inhibition, thus weakening the positive impact of
overexpression of ILV2, ILV3, and ILV5 on isobutanol production.
Aerobic cultivations of the ILV2 ILV3 ILV5 overexpression strain and the reference
strain showed that the supply of amino acids in cultivation media gave a substantial
improvement in isobutanol yield for the reference strain, but not for the ILV2 ILV3
ILV5 overexpression strain, which implies that other constraints besides the enzyme
activities for the supply of 2-ketoisovalerate may become bottlenecks for isobutanol
production after ILV2, ILV3, and ILV5 have been overexpressed, and it most probably
includes the valine inhibition to Ilv2.
For further improvement of isobutanol production yield in the isobutanol-producing
strain ILV2356_XCY605, a genome-scale model of S. cerevisiae was applied to
searching for potential genetic manipulation targets. Several modifications were made
to adjust the original model iFF708 for isobutanol production study. The resulting
model iFF708_IDU was used for in silico simulation and the results were in fair
agreement with the experimental data. Analysis of single gene overexpression and
deletion was then carried out with biomass yield as the objective function in the
model iFF708_IDU. A number of genes to be overexpressed or deleted were
suggested while the predictions are subject to further verification by genetic
modification and fermentation study.
Future perspectives
Supply of L-α-aminoadipyl in S. cerevisiae could be a bottleneck in ACV production.
Increasing L-α-aminoadipyl biosynthesis in S. cerevisiae through metabolic
engineering of its biosynthetic pathway should be considered for further improvement
of ACV production.
The regulation of Ilv6 for valine biosynthesis may be a limiting factor for increasing
valine production in mitochondria, which can restrict the further improvement of
isobutanol production in cytosol. One possible solution is to move the pathway from
pyruvate to 2-keto-isovalerate from mitochondria to cytosol. The genome-scale model
should be modified accordingly and then used to predict genetic manipulation targets.
102

103
Center for Microbial Biotechnology
Department of Systems Biology
Technical University of Denmark
Building 223
DK-2800 Kgs. Lyngby
Denmark
Phone: +45 4525 26900
Fax: +45 4588 4148
www.cmb.dtu.dk
ISBN-nr: 9788791494994
CMB is an Engineering Center of Excellence funded by the Danish Research Agency. It is a collaboration between an acknowledged research manager, his/her institute and university, and the Research Agency. An Engineering Center of Excellence is a research institute of first-class quality with tradition for cooperation with industry.