metabolomic studies pn seabukthorn leaves … filemetabolomic studies pn seabukthorn leaves ......
TRANSCRIPT

Titlu slideDepartment of Agrifood Chemistry and Biochemistry
University of Agricultural Sciences and Veterinary MedicineCluj-Napoca, Romania
METABOLOMIC STUDIES PN SEABUKTHORN LEAVES AND FRUITS –
TOWARDS RAPID FINGERPRINT OF BIOLOGICAL AND GEOGRAPHICAL ORIGIN
Carmen SOCACIU & col.Department of Chemistry & Biochemistry,
Univ. Agr. Sciences & Vet. Med., Cluj-Napoca, ROMANIA

Titlu slideDepartment of Agrifood Chemistry and Biochemistry
University of Agricultural Sciences and Veterinary MedicineCluj-Napoca, Romania
OutlineI. Metabonomics in postgenomic era: fingerprint of phytochemicals vs quantitation of metabolites - NETWORK
II. Phytochemicals as indicators of seabuckthorn (SB) composition ( leaves vs. fruits)III. Analytical steps and advanced techniques -BIOMARKERS
IV. Case studies: determination of biological and geographical origin by metabolomic analysis + chemometrics
V. Impact of metabolomics studies
Conf.SB Potsdam 3 Dec.2010

Titlu slideDepartment of Agrifood Chemistry and Biochemistry
University of Agricultural Sciences and Veterinary MedicineCluj-Napoca, Romania
Metabolomics = systematic study of chemical fingerprint to realize a metabolite profiling ( small molecules) in a specific matrix ( plant, food)
Metabonomics = quantitative measurements to identify a specific metabolic response ( by key-molecules, e.g. phytochemicals)
METABOLOME = complement of all metabolites expressed in a cell, tissue or organism
Conf.SB Potsdam 3 Dec.2010
Organic + Analytical Chemistry
Biochemistry
FOOD

Metabolomics: An INTEGRATED Tool for Studying SYSTEMS BIOLOGY
Metabolites = end products of gene expression and enzymatic activities Metabolomics – reflect the activity of a certain NETWORKcomplementary method to the large-scale gene transcript analysis (transcriptomics) and proteins fingerprint (proteomics) explain and identify the differences between sets of organisms (e.g. differences in genotypes) CHEMOTAXONOMYelucidate environmental factors that influence biomolecules fingeprint
GENOTYPE + ENVIRONMENT PHENOTYPE
MetabolomeTranscriptomics
PrimaryProteomics Secondary
(small molecules)
METABOLITES
Conf.SB Potsdam 3 Dec.2010Conf.SB Potsdam 3 Dec.2010

CHEMOMETRICS

Titlu slideDepartment of Agrifood Chemistry and Biochemistry
University of Agricultural Sciences and Veterinary MedicineCluj-Napoca, Romania
Conf.SB Potsdam 3 Dec.2010
Chemistry
IsolationPurificationStructureElucidation
Individuals
Applied BIO-Chemistry
• Direct measurement of a physical property (e.g. color)•Selective solubilization from a complex matrix•Group identification and quantification ( spectrometry)•Fingerprint of a certain group (comparisons)•Individual characterization (MS, NMR)
IT
Advanced Statistics
High performance
Equipments
Plant metabolome ProcessingWHAT WE NEED
Fingerprint

Widely used methods for plant metabolite analysis:
GC /MS and LC/MS (Sumner, Mendes & Dixon (2003) and Dunn & Ellis (2005).
LC/PDA/MS (Huhman & Sumner, 2002),
Capillary electrophoresis/mass spectrometry (CE/MS (Soga et al., 2003; Sato et al., 2004)
Fourier Transformed IR Spectroscopy (Socaciu, 2009)Fourier-transform ion-cyclotron mass spectrometry (FT/MS) (Tohge et
al., 2005)
Nuclear magnetic resonance (NMR) (Ward et al., 2003; Wiklund et al., 2005)
Conf.SB Potsdam 3 Dec.2010

Titlu slideDepartment of Agrifood Chemistry and Biochemistry
University of Agricultural Sciences and Veterinary MedicineCluj-Napoca, Romania
1. Carotenoids & chlorophylls2. Vitamins C and E3. Unsaturated -fatty acids4. Phytosterols5. Polyphenols- flavonoids,
antocyanins, phenolic acids,tannins
Plant secondary metabolites (more than 10000 molecules known yet…)
Attraction/defence moleculesAntioxidant/antibiotic actionBeneficial for plant, animal & human health.
Functionality-dependent on solubility, stability, bioavailability &redox potential
Conf.SB Potsdam 3 Dec.2010
II. Phytochemicals as indicators of seabuckthorn (SB) composition ( leaves vs. fruits)-BIOMARKERS

AIMS – specific localization and stability of biomolecules related to their solubility
9
Lipophilic Hydrophilic
Comparative composition of H.r. ssp. carpaticavarieties from România and Germany (Hergo, Leikora)
Determination of metabolic profiles of carotenoids- polyphenols by HPLC-PDA, LC-MS, GC-MS, FTIR UV-Vis spectrometry

III. Analytical steps and advanced techniquesNEED FOR COMPLEMENTARY
METHODS/TECHNIQUES/KNOWLEDGE
Conf.SB Potsdam 3 Dec.2010

Titlu slideDepartment of Agrifood Chemistry and Biochemistry
University of Agricultural Sciences and Veterinary MedicineCluj-Napoca, Romania
Conf.SB Potsdam 3 Dec.2010
0,00E+00
5,00E-01
1,00E+00
1,50E+00
2,00E+00
2,50E+00
3,00E+00
200 300 400 500 600
Wavelength (nm )
Ab
so
rban
ce
455
260
0
1
0.2
0.4
0.6
0.8
200 750400 600
Abs
Wavelength [nm]
phenolics
carotenoidsChl
1st step = UV- VIs analysis ( for both LE and HE)
0,00
0,10
0,20
0,30
0,40
0,50
0,60
0,70
0,80
0,90
1,00
400 420 440 460 480 500
Wavelength (nm)
Abs
orba
nce
(A.U
.)
Sm SBm SJmLE – hexane HE- methanol-water
flavonoids
Biomarkers group identificationQuantitative evaluation

Titlu slideDepartment of Agrifood Chemistry and Biochemistry
University of Agricultural Sciences and Veterinary MedicineCluj-Napoca, Romania
Conf.SB Potsdam 3 Dec.2010
2nd STEP- advanced methods HPLC-PDA or LC-MS
BERRY Profiling
20 40 60
0
10000
20000
Abso
rption
units
Retention time ( min)
280 450 535Seabuckthorn fruits
ether extr.
Carotenoid esters
10 20 30 40
0
20
40
60
Abso
rptio
n un
its
Retention time (min)
Seabuckthorn fruitsPhenolics
LE HE
340 nm

Titlu slideDepartment of Agrifood Chemistry and Biochemistry
University of Agricultural Sciences and Veterinary MedicineCluj-Napoca, Romania
Conf.SB Potsdam 3 Dec.2010
2nd STEP- advanced methods HPLC-PDA or LC-MS
Profiling and quantitation of LE - carotenoids
0 10 20 30 40 50
0
200000
400000
A.U
.
Time (min)
Serbanesti
Sf Gheorghe
Ovidiu
SBB carotenoid fingerprint at 450 nm
0 10 20 30 40 500
50000
100000
150000
200000
250000
300000
350000
A.U.
Time (min)
Carotenoid fingerprint at 450 nm, Serbanesti variety
SBB
SBL
Lutein
β carotene Carotenoid esters
Fingerprint and quantitative evaluation – discrimination of variety and geographical env.
BERRIES

Titlu slideDepartment of Agrifood Chemistry and Biochemistry
University of Agricultural Sciences and Veterinary MedicineCluj-Napoca, Romania
Conf.SB Potsdam 3 Dec.2010
2nd STEP- advanced methods HPLC-PDA or LC-MS
Profiling and quantitation of LE - carotenoids
Fingerprint and quantitative evaluation – discrimination of variety and geographical env.
LEAVES
0 10 20 30
0
20000
40000
60000
80000
100000
120000
140000
A.U.
Time (min)
Serbanesti
Sf Gheorghe
Ovidiu
SBL carotenoid fingerprint at 450 nm
Lutein β caroteneChlorophylls
0 10 20 30
0
10000
20000
30000
40000
A.U
.
Time (min)
Chlorophylls fingerprint at 660 nm, Serbanesti variety
SBB
SBL
3 diff. varieties of leaves Chlorophyl ( leves vs berry) at Serbanesti variety
Titlu slideDepartment of Agrifood Chemistry and Biochemistry
University of Agricultural Sciences and Veterinary MedicineCluj-Napoca, Romania
Conf.SB Potsdam 3 Dec.2010
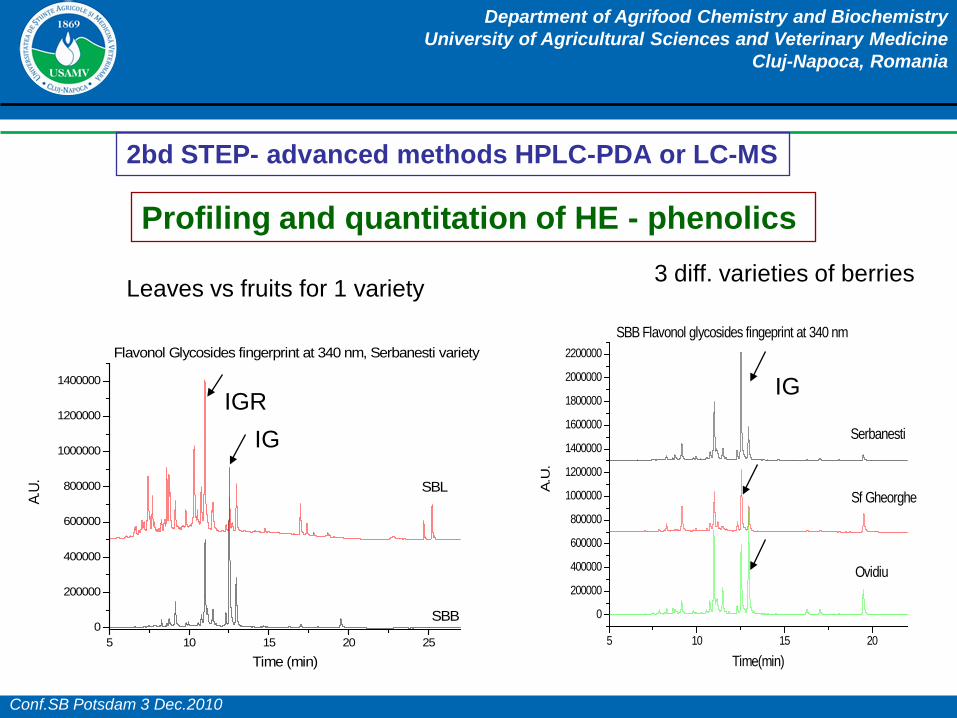
2bd STEP- advanced methods HPLC-PDA or LC-MS
Profiling and quantitation of HE - phenolics
5 10 15 20 250
200000
400000
600000
800000
1000000
1200000
1400000
A.U
.
Time (min)
SBB
SBL
Flavonol Glycosides fingerprint at 340 nm, Serbanesti variety
5 10 15 20
0
200000
400000
600000
800000
1000000
1200000
1400000
1600000
1800000
2000000
2200000
A.U
.
Time(min)
Serbanesti
Sf Gheorghe
Ovidiu
SBB Flavonol glycosides fingeprint at 340 nm
Leaves vs fruits for 1 variety3 diff. varieties of berries
IGR
IG
IG

Peack
tR (min) UV (nm) [M+H]+ m/z MS2 MS3 Structure Assignment
1 7.59 227,269, 350 627(100) 465(100), 303(24) 303(100) Q di glucoside
2 8.29 227, 351 733 (100) 611(20), 449(100), 303(35) 303 (100) Q sopho-rhamno
3 8.64 227, 350 641(100) 479(100), 317(20) 317(100) I diglucoside
4 8.77 227, 350 787(100) 641(38), 479(100), 317(36) 317(100) I diglucoside rhamnoside
5 9.14 227, 353 787(100) 625(22), 463(100), 317(54) 317(100) I sophoroside rhamnoside
6 9.77 227, 340 611(100) 465(2), 449(100), 303(27) 303(100) Q glucoside rhamnoside
7 10.74 227, 351 625(100) 479(7), 463(100), 317(28) 317(100) I glucoside rhamnoside
8 10.98 228, 254, 354 625(100) 463(92), 479(13), 317(100) 317(100) I glucoside rhamnoside
9 11.48 227, 254, 353 465 303(100) 257(100), 304(78), 229(68), 165(52), 286(45)
Q hexoside
10 12.31 226,352 625(100) 479(32), 463(3), 317(100) 302(100), 285(43), 317(14), 257(13)
I glucoside -rhamnoside
11 12.54 227,254,354 625(100) 479(19), 463(3) ,317(100) 302(100), 285(35), 314(14), 257(10)
I glucoside -rhamnoside
12 12.96 228, 254, 353 479(100) 317(100) 302(100), 285(40), 317(13), 153(4)
I glucoside
13 16.28 226,253,370 303(100) 257(100), 229(76), 303(59), 285(57), 165(55), 137(17), 153(15)
229(100) Q
14 17.04 226, 254, 370 463(100) 317(100) 302(100), 285(45), 257(10), 153(7)
I rhamnoside
15 18.08 226, 257, 354, 378
709(100) 574(100), 317(33) 317(100) I-acyl- glucoside-rhamnoside
16 19.51 226, 254, 370 317(100) 302(100), 285(45), 317(17), 257(12), 153(5)
274(100), 285(32), 153(25), 302(2)
I

ESI MS fragmentation pattern for I 3 glucoside 7 rhamnoside (IGR)
10 #1485 RT: 11.13 AV: 1 NL: 2.42E5T: ITMS + c ESI d Full ms2 [email protected] [160.00-640.00]
200 250 300 350 400 450 500 550 600m/z
0
10
20
30
40
50
60
70
80
90
100
Rel
ativ
e A
bund
ance
463.32
317.20
479.21359.23 607.17302.25 443.18 575.88257.23221.12
10 #1483 RT: 11.11 AV: 1 NL: 2.53E5T: ITMS + c ESI d Full ms3 [email protected] [email protected] [115.00-475.00]
150 200 250 300 350 400 450m/z
0
10
20
30
40
50
60
70
80
90
100
Rel
ativ
e A
bund
ance
317.13
445.23359.30146.95 403.41
10 #1484 RT: 11.12 AV: 1 NL: 6.32E5F: ITMS + c ESI Full ms [280.00-1000.00]
300 400 500 600 700 800 900 1000m/z
0
10
20
30
40
50
60
70
80
90
100
Rel
ativ
e A
bund
ance
625.27
503.31388.33331.32 548.34 771.31647.22 949.16496.38 910.05
[M+H-C6H12O6 ]+
[M+H-C6H12O6 – C6H12O5]+
Major biomarker for leaves

[ ]
300 400 500 600 700 800 900 1000m/z
0
10
20
30
40
50
60
70
80
90
100
Re
lativ
e A
bu
nd
an
ce
479.31
973.94871.35595.39501.31307.97 956.94391.45 738.03 819.35636.79
150 200 250 300 350 400 450m/z
0
10
20
30
40
50
60
70
80
90
100
Re
lativ
e A
bu
nd
an
ce
317.22
461.31359.23 413.23145.02 225.33 292.69185.25
100 150 200 250 300m/z
0
10
20
30
40
50
60
70
80
90
100
Re
lativ
e A
bu
nd
an
ce
302.20
285.18
317.21257.20139.10 165.07 243.21229.19201.17111.0495.06
ESI MS fragmentation pattern for Isorhamnetin glucoside (IG)
[M+H]+ [M+H-C6H12O6 ]+
Collaboration USAMV Cluj-Napoca & Wageningen University, NL ( Pop R.)
Fragmentation fingerprint
Individual identification of berries, together with IGH ( ratio 1-1.5)

Titlu slideDepartment of Agrifood Chemistry and Biochemistry
University of Agricultural Sciences and Veterinary MedicineCluj-Napoca, Romania
Conf.SB Potsdam 3 Dec.2010
2bd STEP- advanced methods HPLC-PDA or LC-MS
Profiling and quantitation of HE-phenolics
5 10 15 20
0
200000
400000
600000
800000
1000000
1200000
1400000
1600000
1800000
2000000
2200000
A.U
.
Time(min)
Serbanesti
Sf Gheorghe
Ovidiu
SBB Flavonol glycosides fingeprint at 340 nm
3 diff. varieties of berries
IGR IG IG
5 10 15 200
200000
400000
600000
800000
1000000
1200000
1400000
1600000
1800000
2000000
2200000
A.U.
Time (min)
Serbanesti
Sf Gheorghe
Ovidiu
SBL Flavonol glycosides fingerprint at 340nm
3 diff. varieties of leaves

-4000
6000
16000
0 20 40 60 80
Retention Time [min]
A.U
.
450
280
Carotenoid esters
10 20 30 400
20
40
60
80
100
120
140
160
180
Absorp
tion u
nits
Retention time (min)
Seabuckthorn juicePhenolics
10 20 30 40
0
20
40
60
Abso
rptio
n unit
s
Retention time (min)
Seabuckthorn fruitsPhenolics
Conf.SB Potsdam 3 Dec.2010
Juice OIL280 nm
CASE STUDY – SEABUCKTHORN PRODUCTS

Titlu slideDepartment of Agrifood Chemistry and Biochemistry
University of Agricultural Sciences and Veterinary MedicineCluj-Napoca, Romania
Conf.SB Potsdam 3 Dec.2010
3rd Step- FTIR Spectrometric Fingerprint
Carotenoids – 965, 1367 and 1450 cm-1
Chlorophylls –1587and 1725 cm-1
Phenolics – 694-849 cm-1
Lypophilic component fingerprint2800-2900 and 1000-1500 cm-1
Hydrophilic components–1030-1200 cm-1
Degradation of lipids – look at 3300-3500 cm-1
Rapid, non-destructive, need validation

0
0,1
0,2
0,3
0,4
0,5
0,6
0,7
0,8
0,9
700 1200 1700 2200 2700 3200 3700
Wavelength (cm-1)
Ab
so
rba
nc
e (
A.U
.)
SBm SBj lutein
1
24
3
6
5
7
Identification 1720-1734 cm-1 (1), 1620-1695 cm-1 (2), 1516-1550 cm-1 (3), 1238-1396 cm-1 (4), 1132-1134 cm-1 (5), 1024-1029 cm-1 (6), 961-964 cm-1(7).
Conf.SB Potsdam 3 Dec.2010
Glucosides
Polyene chain
Esters
Esters
FT(ATR)MIR fingerprint regions of SB fruitFT(ATR)MIR fingerprint of SB juices (raw vs clear)
1
6
5

Titlu slideDepartment of Agrifood Chemistry and Biochemistry
University of Agricultural Sciences and Veterinary MedicineCluj-Napoca, Romania
Conf.SB Potsdam 3 Dec.2010
0
500
1000
1500
2000
2500
3000
3500
4000
4500
5000
Seabuckthorn Aronia Black currant Bilberries
Total
polyp
heno
ls co
ntent
(mg/1
00g D
M)
0
20
40
60
80
100
120
140
Total
carot
enoid
conte
nt (m
g/100
g DM)
CASE STUDIES SEABUCKTHORN-ARONIA_BLACK CURRANT_BILBERRIES

800100012001400160018002000240028003200360040001/cm
-0
0.1
0.2
0.3
0.4
0.5
0.6
0.7
0.8
0.9
1
Abs
Coacaze Acizi Fenolici evaporat Afine Acizi Fenolici evaporat
Aronia Acizi Fenolici evaporatCatina Serbanesti Acizi Fenolici evaporat
Catina Serbanesti Acizi Fenolici evaporat
800100012001400160018002000240028003200360040001/cm
-0
0.15
0.3
0.45
0.6
0.75
0.9
1.05
1.2
Abs
R1 SERBANESTI evapAfine carotenoide evaporat
Aronia carotenoide evaporatCoacaze carotenoide evaporat
Coacaze carotenoide evaporat
FTIR comparative fingerprint – SB, Bilberry, Aronia, Black currant
HYDROPHILIC EXTRACT
LYPOPHILIC EXTRACT
Polyene chains
H2O and carbohydrates
Esters
Carbohydrates
Carbohydrates
Phenolics
Polyene chains

Titlu slideDepartment of Agrifood Chemistry and Biochemistry
University of Agricultural Sciences and Veterinary MedicineCluj-Napoca, Romania
Conf.SB Potsdam 3 Dec.2010
4th STEP = Statistical correlations = CHEMOMETRY
Profiling and quantitation = INTEGRATION of DATA
HPLC + FTIR ( PLS analysis) + PCA to see correlations
recognize biological / geographical origin
Technological impact on food quality and safety
Consequences

METABOLOMIC ANALYSIS CONCEPT =
COUPLING ANALYTICS + CHEMOMETRY
The analytical data are pre-processed and used for multivariate analysis
The differences between samples are used to identify metabolites and make biological interpretation.
C = Chromographic profilesP =peaksS = spectral profiles.Conf.SB Potsdam 3 Dec.2010

Titlu slideDepartment of Agrifood Chemistry and Biochemistry
University of Agricultural Sciences and Veterinary MedicineCluj-Napoca, Romania
Preprocessing by MetalignGenemathsSIMCAMathlabInfometrix: Pirouette 4.0
Cluster analysis PCA and PLS Analysis
Pattern recognition
Chemometrics
Conf.SB Potsdam 3 Dec.2010

Comp.1
Com
p.2
-0.6 -0.4 -0.2 0.0 0.2 0.4
-0.6
-0.4
-0.2
0.0
0.2
0.4
M2/S1M2/S2
M4/S1
M4/S2M3/S1M3/S2
M5/S1
M5/S2
M1/S1
M1/S2
-30000 -20000 -10000 0 10000 20000
-300
00-2
0000
-100
000
1000
020
000
p1p2p3
p4
p5
p6p7
p8
Comp.1
Com
p.2
-0.6 -0.4 -0.2 0.0 0.2 0.4 0.6
-0.6
-0.4
-0.2
0.0
0.2
0.4
0.6
M2/S1
M2/S2
M4/S1
M4/S1
M3/S1
M3/S2
M5/S1
M5/S2
M1/S1
M1/S2
-20 -10 0 10 20
-20
-10
010
20
chlorogeniccaffeic rosmarinic
Name Code Beta-carotene/zeaxanthin esters ratio
Chlorogenic Acid (1)(mg/g)
Rosmarinic Acid (4)(mg/g)
SB Transylvania RO Cluj M2/S1 0.9 0 21.66
SB Transylvania RO Cluj M2/S2 1.02 1.42 35.34
SB SouthWest RO Timisoara M4/S1 1.05 0 23.92
SB South West RO Timisoara M4/S2 0.8 1.24 39.44
SB Germany (Hergo) M3/S1 1.4 0 7.58
SB Germany (Leikora) M3/S2 1.32 1.42 18.45
SB North East RO M5/S1 1.2 0 29.08
SB North East RO M5/S2 1.83 1.83 21.49
SB Danube Delta RO M1/S1 0.7 0 24.56
SB Danube Delta RO M1/S2 0.9 1.40 20.52
Biological origin is stronger in SB
variability than the geographical
origin
PHENOLICS
CAROTENOIDS
G
B B
B
For bioactive molecules

Titlu slideDepartment of Agrifood Chemistry and Biochemistry
University of Agricultural Sciences and Veterinary MedicineCluj-Napoca, Romania
We are able to identify different, specific biomarkers realizing the berry vs leave fingerprint, discrimination of biological and geographical origin
The technological progress in development of new instruments (LC-MS, GC-MS, TOF/MS, FTIR, etc) allows the identification and quantification of each marker (1) as well the plant/food fingerprint/profile (2).
Combinations of different, complementary analytical techniques completed with chemometric analysis are required for comprehensive metabolomic studies.
Specific predictions can be established for routine analysis, cheaper and easy to perform
Experimental conclusions
Conf.SB Potsdam 3 Dec.2010

Titlu slideDepartment of Agrifood Chemistry and Biochemistry
University of Agricultural Sciences and Veterinary MedicineCluj-Napoca, Romania
Establishment of quality standards based on major biomarkers ( carotenoids, phenolics, vit. C) with antioxidant potential
Evaluation of technological flow, from raw material to intermediates and final products
Authenticity of products and their traceability (origin) Safety aspects ( PCH, pesticides) Use of rapid methods ( FTIR) which are in good
correlation with validated , expensive methods (HPLC, GC)
Specific predictions can be established for routine analysis, cheaper and easy to perform for many samples
IMPACT OF METABOLOMIC STUDIES
Conf.SB Potsdam 3 Dec.2010

Titlu slideDepartment of Agrifood Chemistry and Biochemistry
University of Agricultural Sciences and Veterinary MedicineCluj-Napoca, Romania
First Metabolomics program in Romania
Carmen SOCACIU - coordinator
Floricuta RANGA – UV-Vis, HPLC, and LC-MS (plants)
Florinela FETEA – FTIR (plants and food)Adela PINTEA & Andrea BUNEA- HPLC-
PDA (carotenoids and in vitro effects)Raluca PARLOG: LC-MS and TOF (food
metabolomics)Monica TRIF, PhD – FTIR and NMR
(functional oils)Loredana LEOPOLD: FTIR and Raman
spectroscopyFrancisc DULF, PhD : GC-FID and GC-MS
(phytosterols)Constantin BELE and Cristian Matea :GC-
FID (fatty acids)
MeT-RO : A major initiative to establish the Centre for Plant and Food Metabolomic AnalysisMetabolomics Society Reseaux Metabolomics and Fluxonomics –FranceMetaboP- EU Project META-PHOR

FOOD COLORANTS: Structural and Functional Properties
CRC Press, Taylor & Francis, 2008
Series editor: T. SikorskiEditor: Carmen Socaciu (USAMV Cluj, RO)
Contributors: Amiot-Carlin M-J.&coll. (INSERM,Marseille,FR) Caris Veyrat C.(INRA Avignon, FR)Diehl H.(Uni Bremen, DE)Dufosse L.(Uni La Reunion, FR)During A. (Res. Beltsville, USA)Lanfer Marquez U.M. ( Sao Paolo, BR)Luning P. (UR Wageningen, NL)Mercadante A. and coll. (Uni. Campinas, BR)Otles S.(Uni Izmir, TK)Pintea A. (USAMV Cluj, RO)Socaciu C (USAMV Cluj, RO)Stintzing F.and R.Carle (Uni Hohenheim, DE)Wuerzel E.and coll.( Lehman Coll, NY,USA)
More about pigments ….

Department of Chemistry & Biochemistry www.usamvcluj.ro/cercetarewww.biochim.usamvcluj.ro


TRADITIONand MODERNITY