metacognitive accuracy improves with the perceptual
TRANSCRIPT

fpsyg-10-01712 July 22, 2019 Time: 17:18 # 1
ORIGINAL RESEARCHpublished: 24 July 2019
doi: 10.3389/fpsyg.2019.01712
Edited by:Guido Hesselmann,
Psychologische Hochschule Berlin,Germany
Reviewed by:Manuel Rausch,
Catholic Universityof Eichstätt-Ingolstadt, Germany
Kristian Sandberg,Aarhus University, Denmark
*Correspondence:Benjamin Chen
Specialty section:This article was submitted to
Consciousness Research,a section of the journalFrontiers in Psychology
Received: 10 August 2018Accepted: 09 July 2019Published: 24 July 2019
Citation:Chen B, Mundy M and Tsuchiya N
(2019) Metacognitive AccuracyImproves With the Perceptual
Learning of a Low- but NotHigh-Level Face Property.Front. Psychol. 10:1712.
doi: 10.3389/fpsyg.2019.01712
Metacognitive Accuracy ImprovesWith the Perceptual Learning of aLow- but Not High-LevelFace PropertyBenjamin Chen1* , Matthew Mundy1,2 and Naotsugu Tsuchiya1,2
1 School of Psychological Sciences, Faculty of Biomedical and Psychological Sciences, Monash University, Melbourne, VIC,Australia, 2 Monash Institute of Cognitive and Clinical Neuroscience, Monash University, Melbourne, VIC, Australia
Experience with visual stimuli can improve their perceptual performance, a phenomenontermed visual perceptual learning (VPL). VPL has been found to improve metacognitivemeasures, suggesting increased conscious accessibility to the knowledge supportingperceptual decision-making. However, such studies have largely failed to controlobjective task accuracy, which typically correlates with metacognition. Here, using astaircase method to control this confound, we investigated whether VPL improvesthe metacognitive accuracy of perceptual decision-making. Across 3 days, subjectswere trained to discriminate faces based on their high-level identity or low-levelcontrast. Holding objective accuracy constant across training days, perceptualthresholds decreased in both tasks, demonstrating VPL in our protocol. However,whilemetacognitive accuracy was not affected by face contrast VPL, it was decreasedby face identity VPL. Our findings couldbe parsimoniously explained by a dual-stagesignal detection theory-based model involving an initial perceptual decision-makingstage and a second confidence judgment stage. Within this model, internal noisereductions for both stages accounts for our face contrast VPL result, while only firststage noise reductions accounts for our face identity VPL result. In summary, we foundevidence suggesting that conscious knowledge accessibility was improved by the VPLof face contrast but not face identity.
Keywords: conscious and unconscious memory, face perception and cognition, metacognition, perceptuallearning, memory and learning
INTRODUCTION
The relationship between conscious perception and learning remains a central topic in cognitiveneuroscience (Bayne et al., 2009). This topic has been investigated across various consciousperception and learning paradigms. For instance, within the visual perceptual learning (VPL)paradigm, the degree to which subjects improve perceptual performance in a visual task isdependent on their experience with the stimuli used in the task (Fahle and Poggio, 2002). In relationto conscious perception, one line of VPL research has investigated whether conscious experience ofvisual stimuli is necessary for their VPL, by employing consciously invisible stimuli as the target ofVPL (Watanabe et al., 2001; Seitz et al., 2009). In contrast, another line of research has investigated
Frontiers in Psychology | www.frontiersin.org 1 July 2019 | Volume 10 | Article 1712

fpsyg-10-01712 July 22, 2019 Time: 17:18 # 2
Chen et al. Metacognition and Face Perceptual Learning
whether VPL improves conscious accessibility to the learnedinformation supporting its perceptual decision-making.Addressing the latter, recent studies have found that the VPLof simple object properties (e.g., shape) improved subjects’confidence in their perceptual decisions (Schwiedrzik et al.,2011; Bertels et al., 2012; Schlagbauer et al., 2012). However,because VPL increased objective task accuracy in these studies,it remains possible that the improvements in confidencejudgements were a consequence of increased objective accuracy(Galvin et al., 2003; Maniscalco and Lau, 2012; Barrett et al.,2013), rather than improved conscious accessibility to theknowledge supporting perceptual decision-making (see however,Schwiedrzik et al., 2011).
Here, to address this potential confound, we use an adaptivestaircase procedure to hold objective task accuracy constant(e.g., 75% correct). Using such procedures, VPL is quantifiedas a decrease in the stimulus intensity needed to maintain afixed level of task accuracy (Gold et al., 2010). Within thisframework, the critical question now becomes whether or notVPL improves subjects’ ability to consciously access learnedperceptual information. Assuming that a high confidence ratingthat accompanies with a correct decision reflects high degreeof conscious accessibility of information for the decision, wequantify conscious accessibility as metacognitive accuracy ina Type-II signal detection task. In a Type-II task, subjectsdiscriminate their correct from incorrect responses usingconfidence ratings (Galvin et al., 2003).
In this paper, we first present a simple model whichsimulates a single stage for both perceptual decision-makingand confidence judgements. In this model, we relate stimulusdifference, objective task accuracy (or Type-I performance), andmetacognitive accuracy (or Type-II performance; Figure 1). Totest the prediction of this model, we performed two experimentswhere we trained subjects in the VPL of face identity (Experiment1) or face contrast (Experiment 2). We found that the predictionof the single-stage model was consistent with the results inExp. 2., but not those in Exp. 1. To resolve this inconsistency,we propose an alternative model, which simulates two separatestages, one for perceptual decision-making and the other forconfidence judgements, which can account for the results inboth Exp. 1 and 2.
MODEL I: SINGLE-STAGE NOISEREDUCTION MODEL
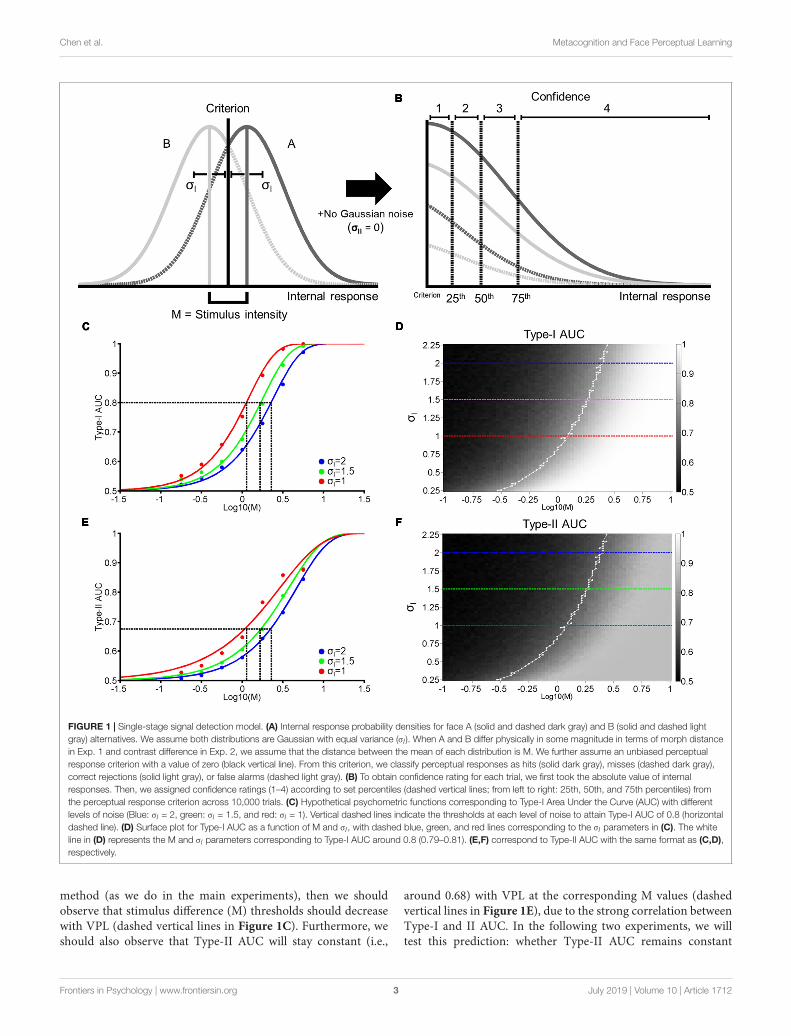
Using a framework based on signal detection theory (SDT;Macmillan and Creelman, 2005), we propose a generative modelthat relates stimulus difference and Type-I and II performance(Figure 1). Firstly, we construct two Gaussian probability densityfunctions. The functions depend on the strength of stimulusdifference (M), which generates a distribution of hypothesizedinternal responses (e.g., neural responses in the brain) for tworesponse alternatives. In our experimental task, these correspondto face A and B alternatives (see Exp. 1 and 2 Method). We definethe difference in the means of both distributions as M, with themean of the face A and B distributions located at+M/2 and –M/2
from 0, respectively. We assume that as the physical differencebetween the two stimulus alternatives increases, the greaterthe difference of the internal responses becomes. Furthermore,we assume that the two distributions have the same standarddeviation (σI), and that subjects adopt an unbiased and optimalperceptual decision criterion (i.e., a decision criterion value ofzero; Figure 1A).
Based on the value of M and σI (the 2 free parametersof this model), we generate around 5000 random values foreach response alternative (Figure 1A, Gaussian distributions).For each random value, we assign a perceptual response (i.e.,a response of A if a random value is more than the decisioncriterion, and a response of B otherwise). We then assign aconfidence rating from 1 to 4 to each perceptual responseaccording to the distance between a random value to thedecision criterion. Specifically, we took the absolute value ofrandom values from both A and B response distributions andcalculated the 25th, 50th, and 75th percentiles of the cumulateddistributions from the decision criterion. We then accordinglyassigned confidence ratings (1–4) in equal proportion (25% each)to random values based on these quantiles (Figure 1B). Thus,in this model, we assume that perceptual decision-making andconfidence judgements are based on the same signal (Galvinet al., 2003; Kepecs et al., 2008; Maniscalco and Lau, 2012;Barrett et al., 2013; Sanders et al., 2016). We term this model the‘single-stage model’.
Based on perceptual responses and confidence ratings over10,000 random values, we next compute objective accuracy as theArea Under the Type-I receiver operating characteristic (ROC)Curve, and metacognitive accuracy as Type-II Area Under theROC Curve (AUC; see Exp. 1 Method). Figure 1C demonstratesthe relationship between Type-I AUC (y-axis) and stimulusdifference, M (x-axis), at 3 different levels of noise (blue, green,and red for σI = 2, 1.5, and 1, respectively). Figure 1D encodesType-I AUC in color-scale (black for 0.5 and white for 1) as afunction of M (x-axis) and σI (y-axis). Psychometric functionsin Figure 1C correspond to the height of the surface plotin Figure 1D at respective levels of σI , indicated by dashedhorizontal lines (blue, green, and red for σI = 2, 1.5, and1, respectively).
Figure 1E demonstrates the relationship between Type-IIAUC and M at the same 3 noise levels as Figures 1C,F encodesType-II AUC in color-scale as a function of M and σI .
This model clarifies the relationship between stimulusdifference (M) and Type-I and II AUC, and demonstrateshow they are modulated by the internal noise associated withperceptual decision-making (σI). Firstly, both Type-I and II AUCmonotonically increase as a function of M or σI , when the othervariable is held constant (Figures 1D,F). Indeed, the correlationbetween Type-I and II AUC over the 4225 data points (65levels of M × 65 levels of σI) shown in Figures 1D,F was nearperfect, with a correlation coefficient of 0.99. From this strongcorrelation, we can derive a simple prediction about how VPLwould affect both Type-I and II AUC. Consider the hypothesisthat VPL decreases the internal noise (i.e., σI) associated withperceptual decision-making (Dosher and Lu, 1998). Under thishypothesis, if we maintain Type-I AUC at 0.8 using a staircase
Frontiers in Psychology | www.frontiersin.org 2 July 2019 | Volume 10 | Article 1712
fpsyg-10-01712 July 22, 2019 Time: 17:18 # 3
Chen et al. Metacognition and Face Perceptual Learning
FIGURE 1 | Single-stage signal detection model. (A) Internal response probability densities for face A (solid and dashed dark gray) and B (solid and dashed lightgray) alternatives. We assume both distributions are Gaussian with equal variance (σI ). When A and B differ physically in some magnitude in terms of morph distancein Exp. 1 and contrast difference in Exp. 2, we assume that the distance between the mean of each distribution is M. We further assume an unbiased perceptualresponse criterion with a value of zero (black vertical line). From this criterion, we classify perceptual responses as hits (solid dark gray), misses (dashed dark gray),correct rejections (solid light gray), or false alarms (dashed light gray). (B) To obtain confidence rating for each trial, we first took the absolute value of internalresponses. Then, we assigned confidence ratings (1–4) according to set percentiles (dashed vertical lines; from left to right: 25th, 50th, and 75th percentiles) fromthe perceptual response criterion across 10,000 trials. (C) Hypothetical psychometric functions corresponding to Type-I Area Under the Curve (AUC) with differentlevels of noise (Blue: σI = 2, green: σI = 1.5, and red: σI = 1). Vertical dashed lines indicate the thresholds at each level of noise to attain Type-I AUC of 0.8 (horizontaldashed line). (D) Surface plot for Type-I AUC as a function of M and σI, with dashed blue, green, and red lines corresponding to the σI parameters in (C). The whiteline in (D) represents the M and σI parameters corresponding to Type-I AUC around 0.8 (0.79–0.81). (E,F) correspond to Type-II AUC with the same format as (C,D),respectively.
method (as we do in the main experiments), then we shouldobserve that stimulus difference (M) thresholds should decreasewith VPL (dashed vertical lines in Figure 1C). Furthermore, weshould also observe that Type-II AUC will stay constant (i.e.,
around 0.68) with VPL at the corresponding M values (dashedvertical lines in Figure 1E), due to the strong correlation betweenType-I and II AUC. In the following two experiments, we willtest this prediction: whether Type-II AUC remains constant
Frontiers in Psychology | www.frontiersin.org 3 July 2019 | Volume 10 | Article 1712

fpsyg-10-01712 July 22, 2019 Time: 17:18 # 4
Chen et al. Metacognition and Face Perceptual Learning
as subjects are trained to discriminate face identity or facecontrast in a VPL task.
Experiment 1: Face Identity VPLMethodSubjectsTwenty subjects (13 female and 7 male, Mage = 24.5,SD = 5.47) were recruited from Monash University andmonetarily reimbursed for their participation. Subjects reportedno history of major medical or psychiatric conditions, andnormal or corrected-to-normal vision. All procedures wereapproved by the Monash University Human Research EthicsCommittee, and performed in accordance with the committee’sguidelines. Signed informed consent was obtained from allsubjects prior to testing.
StimuliFour pairs of emotionally neutral, front-facing Caucasian faces(two female and two male) were generated using Facegensoftware (v. 3.0; Singular Inversions). All faces were convertedto grayscale with a black oval mask applied to remove externalfeatures (e.g., ears), before normalizing each face pair on theirluminance and contrast (Willenbockel et al., 2010). Withinthe oval mask, faces subtended 9.76 degrees of visual angle(dva) vertically, and 5.9 dva horizontally (Figure 2B). Morpheussoftware (Morpheus Development) was then used to morphboth faces within a pair together by anchoring key features(e.g., eyes, nose), generating a morph continuum from 100%of one face (100%:0%), to 100% of the other face (0%:100%),in 2% increments.
ProcedureSubjects performed an unspeeded ABX task across 3 consecutivedays. In each trial, we presented a given face pair, and requiredsubjects to judge whether the third face (X) matched the first (A)or second (B) face’s identity (Figure 2A). Face A and face B werealways derived from a morph between a given face pair. Subjectssimultaneously provided both their perceptual response (X = Aor X = B), and their confidence in this decision from ‘not sure(1)’ to ‘sure (4)’, via a single mouse click. X was always identical toeither A or B, with equal probability. Subjects were encouraged torespond as accurately as possible, and to use the entire confidencescale. No feedback was provided.
All 3 faces (A, B, and X) were presented sequentially for200 ms each. To avoid biasing fixations toward a particular facialregion (e.g., eyes), each face had a random horizontal leftwardor rightward displacement between 0.78 and 1.56 dva, relativeto the screen’s center. The displacement of the first face (A) wasrandomly determined, with the displacement of the remaining 2faces (B and X) being opposite to the preceding face, such thatonly 2 sequences were possible (left (A), right (B), left (X); right(A), left (B), right (X)). Before the presentation of each face, acentral leftward- or rightward-pointing arrow (200 ms) reliablycued subjects to each faces’ subsequent displacement. After thepresentation of each face, a Gaussian noise mask (200 ms)appeared which covered the spatial extent of the preceding face.
The task was programmed and run using the Psychophysicstoolbox extension (Psychtoolbox-3) for Matlab (Brainard, 1997;Pelli, 1997). Stimuli were presented against a gray background ona 23-inch screen (1920x1080 pixels, 60 HZ refresh rate), whichsubjects viewed from a chinrest placed 75 cm away. Subjects weregiven the chance to take a short break after every 160 trials.
We estimated morph distance thresholds (%) correspondingto 75% accuracy (psychometric slope (β) = 0.1, lapse rate(δ) = 0.05, probability of a correct guessing response (γ) = 0.5),using quick estimation of threshold (QUEST; Watson and Pelli,1983). QUEST implements an adaptive staircase procedure usingBayesian principles and provides the most probable estimationof stimulus threshold via a posterior distribution function (PDF).In each trial, morph threshold estimates (rounded to the nearestmultiple of 2%, with a maximum of 100%) were halved andsubtracted from, and added to, the morph midpoint (50%:50%)of a particular face pair to select A and B faces along the morphcontinuum. The morph distance of A (and B) had an equalprobability of being the midpoint± (threshold/2).
The experiment consisted of three primary phases: Pre-training, training, and post-training (Figure 3A). There was noexplicit break between each phase within each experimentalsession. During pre- and post-training phases, subjectsperformed 2 separate blocks involving all 4 face pairs. Eachblock consisted of 4 randomly interleaved QUEST staircases,which followed the standard QUEST procedure (i.e., stimulusintensity updated from trial-to-trial). For each face pair, a singlestaircase (40 trials) was used to independently estimate themorph threshold that likely resulted in a discrimination accuracyof 75%. During these pre- and post-training blocks, we did notestimate Type-I or II AUC as these measures require multipletrials at a fixed stimulus intensity (see below).
Across 3 consecutive days, we trained half our subjects on faceset 1, and the remaining half on face set 2. Each face set consistedof a pair of male and female faces (Figure 2B). During dailytraining, subjects performed 12 blocks. Each block consisted of 20trials for one face pair and 20 trials for the other pair (i.e., a totalof 40 trials/block), presented in a randomized order (Figure 3A).
In these training blocks, we held the morph distance betweenface A and B constant, so that we could reliably calculate Type-Iand II AUC at a given morph distance for a particular face pair(Macmillan and Creelman, 2005). After each block, we adjustedthe stimulus intensity for each face pair so that the percentagecorrect was kept at around 75% across blocks. To achieve this,we updated the QUEST estimate of threshold at the end of eachblock by supplying the history of each face pair’s morph distanceand response accuracy over the last 80 trials. We defined the mostinformative PDF quantile obtained by QUEST as the thresholdestimate for each face pair, and used it for their correspondingtrials in the next training block.
For Day 1, we used the last 80 trials during the pre-trainingblocks for a given face pair to estimate its threshold for trainingblock 1. Then, we used the last 60 pre-training trials and the20 trials of training block 1 to update the threshold estimatefor training block 2, and so on. For Day 2 and 3, we ran 2baseline blocks of 80 trials (40 trials per trained face pair), inwhich we updated threshold from trial-to-trial using QUEST,
Frontiers in Psychology | www.frontiersin.org 4 July 2019 | Volume 10 | Article 1712

fpsyg-10-01712 July 22, 2019 Time: 17:18 # 5
Chen et al. Metacognition and Face Perceptual Learning
FIGURE 2 | Task and stimuli of Experiment 1: Face identity matching. (A) In each trial, subjects viewed a sequence of three faces (A, B, and X). Each face waspreceded by a cue corresponding to their on-screen displacement, and followed by a mask. Subjects judged whether the third face matched the identity of the firstor second face, corresponding to 1 or 2 in the response screen (last panel), respectively. Subjects also simultaneously reported the confidence of their perceptualdecision from 1 (not sure) to 4 (sure). (B) Subjects were trained on one face set, and untrained on the other, in a fully counterbalanced manner. Faces weregenerated using FaceGen software (v. 3.0; https://facegen.com/).
before subjects completed the 12 training blocks (Figure 3A).Note that this use of a block-to-block QUEST updating procedureis quite unlike the standard use of QUEST, in which the thresholdis updated from trial-to-trial, as we did for our baseline, pre-and post-training blocks. To make this point clear, we show anexemplar time course of morph distance and response accuracyfor one face pair over the 2 baseline blocks and the first 3 trainingblocks, for one subject (Figure 3B).
Data analysisPre- and post-training. Pre- and post-training consisted of 2blocks. Each block involved 4 randomly interleaved QUESTstaircases, with a single staircase (40 trials) for each face pair(i.e., 2 pre-training and 2 post-training staircases per face pair).For each QUEST staircase, we updated the threshold estimatefrom trial-to-trial. To measure training effects, we assessed themorph thresholds for all 4 face pairs before and after 3 daysof training, with subjects being trained on only 2 of these facepairs. For the 40 trials of each staircase, we defined the modeof its PDF as the threshold (Watson and Pelli, 1983). We thenaveraged staircase thresholds from the two corresponding facepairs to obtain thresholds for the trained and untrained face setfor each subject.
Training. Daily training consisted of 12 blocks. Each blockinvolved 20 trials for each trained face pair, which were presentedin a randomized order. Within a given block, stimulus intensityfor each face pair was held constant (Figure 3B). For each ofthe 12 training blocks, we separately calculated the followingmeasures for each face pair: threshold, objective accuracy (Type-IAUC), metacognitive accuracy (Type-II AUC), mean confidenceratings for correct and incorrect trials, and the variance ofconfidence ratings for correct and incorrect trials.
To estimate the threshold for a face pair in a given trainingblock of 20 trials, we used QUEST to construct a PDF from thesetrials, and defined its mode as the threshold (Watson and Pelli,1983). Note that we only used 20 trials in our offline data analysis(i.e., threshold, Type-I and II AUC, and confidence ratings), butwe used the previous 80 trials to update stimulus intensity in ouronline experiment (Figure 3B).
We calculated objective and metacognitive accuracy using areceiver operating characteristics (ROC) curve based on SDT.For objective accuracy, we constructed a Type-I ROC curve,which reflects the perceptual discriminability between face Aand B independent of response criteria. Given we held stimulusintensity constant within training blocks, Type-I ROC curveswere independently calculated on a block-by-block basis. To
Frontiers in Psychology | www.frontiersin.org 5 July 2019 | Volume 10 | Article 1712

fpsyg-10-01712 July 22, 2019 Time: 17:18 # 6
Chen et al. Metacognition and Face Perceptual Learning
FIGURE 3 | Task design for Experiment 1. (A) The paradigm consisted of pre-training, training, baseline, and post-training. We used QUEST to update stimulusdifference (intensity) after each trial in pre-training, baseline, and post-training blocks. We trained subjects on a single face set (1 male and 1 female face pair) over 3consecutive days in training and baseline blocks. In pre- and post-training blocks, which took place immediately before (Day 1) and after (Day 3) training,respectively, we tested subjects on the trained and untrained face set. (B) Exemplary time course of one of the two trained face pair’s morph distance and responseaccuracy for the 2 baseline blocks and the first 3 training blocks for one subject. Green and red circles correspond to correct and incorrect trials, respectively. Notethat we do not show the time course for the other trained face pair. This time course clarifies our trial-to-trial and block-to-block QUEST protocol: We hold morphdistance constant during each training block, and update it based on the previous 80 trials of a given training block. While we used 80 trials for our online QUESTupdating procedure, we used the 20 trials within each training block (with a fixed morph distance) to compute: threshold, Type-I and II AUC, and the mean andvariance of confidence ratings separately for correct and incorrect trials (offline data analysis). We used the same design for Experiment 2.
achieve this, we considered X = A trials as signal present trials,and X = B trials as signal absent trials. Hits and false alarms werethen estimated by systematically varying the response criterionin 7 steps. Firstly, we regarded a response as a ‘hit’ when thesignal was present, and subjects reported X = A with the highestconfidence (4). Similarly, we regarded a response as a ‘false alarm’when the signal was absent, and subjects reported X = A with thehighest confidence (4). We then shifted the criterion to include
X = A responses endorsed with a confidence of 3 and 4, andlikewise classified responses as hits or false alarms depending onwhether the signal was present or absent, respectively. We shiftedthe response criterion in this manner until we obtained hits andfalse alarms from the highest (4) to lowest (1) confidence ratingsfor X = A responses, and the lowest (1) to second highest (3)confidence ratings for X = B responses to obtain a ROC curvewith 7 inflection points. We use the Area Under the ROC Curve,
Frontiers in Psychology | www.frontiersin.org 6 July 2019 | Volume 10 | Article 1712

fpsyg-10-01712 July 22, 2019 Time: 17:18 # 7
Chen et al. Metacognition and Face Perceptual Learning
or Type-I AUC, as a non-parametric estimate of objective taskaccuracy (Macmillan and Creelman, 2005; Wilimzig et al., 2008;Kaunitz et al., 2016).
For metacognitive accuracy, we constructed a Type-II ROCcurve, which quantifies the discriminability of correct andincorrect decisions independent of response criterion. Wedecided to implement Type-II ROC curves over meta-d’(Maniscalco and Lau, 2012) as we found that the parametricassumptions of meta-d’ were not met when we examined theType-I distributions of our participants (see SupplementaryMaterial). As with Type-I ROC curves, Type-II ROC curveswere also independently calculated on a block-by-block basis,given stimulus intensity was held constant within training blocks.To achieve this, we considered trials where perceptual decisionswere correct (i.e., subjects reported X = A in X = A trials,and X = B in X = B trials) as signal present trials, and trialswhere perceptual decisions were incorrect as signal absent trials.Hits and false alarms were then estimated by systematicallyvarying the response criterion in 3 steps. Firstly, we regardeda response as a ‘hit’ when a signal present trial was endorsedwith the highest confidence (4), and a ‘false alarm’ when asignal absent trial was endorsed with the highest confidence(4). We then shifted the criterion to include responses endorsedwith a confidence of 3 and 4, and likewise classified responsesas hits or false alarms depending on whether the signal waspresent or absent, respectively. We shifted the criterion in thismanner until we obtained hits and false alarms from the highest(4) to second lowest (2) confidence ratings to obtain a ROCcurve with 3 inflection points. We use the Area Under theROC Curve, or Type-II AUC, as a non-parametric estimate ofmetacognitive accuracy (Galvin et al., 2003; Wilimzig et al., 2008;Kaunitz et al., 2016).
For confidence, we separately calculated the mean and thevariance of confidence ratings for correct and incorrect trials.
Statistical analysisPre- and post-training. To test whether post-training thresholdswere significantly lower than pre-training thresholds for thetrained and the untrained face set, we used one-tailed Wilcoxonsigned-rank tests.
To estimate the degree of VPL transfer from the trained tountrained set for each subject, we defined a transfer index (TI)as [threshold improvement for the untrained set / thresholdimprovement for the trained set], with TI = 1 corresponding tocomplete VPL transfer, and TI = 0 to no transfer (Bi et al., 2010).We defined threshold improvement as [(Thresholdpre−training –Thresholdpost−training)/Thresholdpre−training] × 100%. To testwhether TI was significantly greater than or less than T1 = 0 andTI = 1, respectively, we used one-tailed one-sample t-tests.
Training. To investigate the effects of daily training on threshold,Type-I and II AUC, and the mean and variance of confidenceratings (separately for correct and incorrect trials), we performedseparate linear mixed-effects analyses using lme4 package (Bateset al., 2015) within R software (R Foundation for StatisticalComputing). We constructed a 2x3 nested mixed design, withtrained face set (i.e., face set 1 or face set 2) as a between-subjectvariable, and daily training session (i.e., Day 1 to Day 3) as a
within-subject variable. We modeled daily training session as afixed effect. As random effects, we modeled an intercept for eachface set to account for variances in learning effects between thesets, as well as a by-subject intercept and slope for daily trainingsession to account for subject variability in learning effects, andthe rate of these effects across training sessions. We performedlikelihood ratio tests between the full model, as describedabove, and a reduced model, without daily training sessionsmodeled as a fixed effect, to obtain chi-squared statistics andassociated p-values.
ResultsThe psychophysical results of Experiment 1 are displayedin Figure 4. From pre- to post-training, morph thresholdsignificantly decreased for both the trained (Z =−3.51, p< 0.001)and the untrained (Z = −3.32, p < 0.001) face set (Figure 4A).Transfer index (see Method) was 0.67 (SD = 1.20), which wassignificantly greater than 0 (p = 0.011), but not less than 1(p = 0.11). This suggests that with training, subjects successfullydemonstrated identity-invariant VPL of face identity.
With daily training, morph threshold steadily decreased,confirmed by a significant main effect of training on threshold[χ2(1) = 27.06, p < 0.001; Figure 4B]. As intended by ourQUEST procedure however, no main effect of training onobjective accuracy (Type-I AUC) was observed [χ2(1) = 0.10,p = 0.75; Figure 4C]. Interestingly, metacognitive accuracy(Type-II AUC) decreased with training [χ2(1) = 4.52, p = 0.034;Figure 4D], arguing against improved metacognition aspredicted by our single-stage model (Figures 1E,F). Thisdecrease in metacognitive accuracy could not be simplyattributed to biases in the use of confidence ratings, aswe found no main effect of training on mean confidenceratings for correct [χ2(1) = 0.03, p = 0.87] and incorrect[χ2(1) = 1.29, p = 0.26] trials (Figure 4E), and no main effectof training on the variance of confidence ratings for correct[χ2(1) = 0.054, p = 0.46] and incorrect [χ2(1) = 0.24, p = 0.63]trials (Figure 4F).
In addition to the block-by-block analysis of Type-I and Type-II AUC reported above, we also tested the robustness of thisfinding by performing a secondary analysis where participants’daily training trials (n = 480 trials) were pooled across trainingblocks. We used these pooled trials to compute a single dailyestimate of Type-I and Type-II AUC for each participant usingthe same method described in our Data Analysis section,before testing for any training effects using repeated-measuresANOVAs. This secondary analysis revealed comparable findingsto our primary analysis, namely a statistically significant decreasein Type-II AUC with face identity VPL, while Type-I AUCremained constant (see Supplementary Material).
Experiment 2: Face Contrast VPLMethodSubjectsTwenty subjects (14 female and 6 male, Mage = 24.9,SD = 5.24), who did not participate in Experiment1, were recruited. All aspects of subject recruitment
Frontiers in Psychology | www.frontiersin.org 7 July 2019 | Volume 10 | Article 1712

fpsyg-10-01712 July 22, 2019 Time: 17:18 # 8
Chen et al. Metacognition and Face Perceptual Learning
FIGURE 4 | Results for Experiment 1. (A) Pre- and post-training effects measured as median morph threshold for trained and untrained face sets before (on Day 1)and after (on Day 3) training sessions. (∗∗∗ indicates p < 0.001). Threshold significantly decreased with training over 3 days (B), which was accompanied bydecreases in Type-II AUC (metacognitive accuracy, p = 0.015; (D) None of the following changed with training: Type-I AUC for objective accuracy (C), confidenceratings for correct (solid) and incorrect (dashed) trials (E), and the variance of confidence ratings for correct (solid) and incorrect (dashed) trials (F). All 5 variableswere independently estimated within each training block (see Exp. 1 Method). Error bars denote ± 1 within-subjects SEM (Cousineau, 2005).
were the same as those for Experiment 1. Below,we describe the methodological differences betweenExperiment 1 and 2.
StimuliFour emotionally neutral, front-facing Caucasian faces (2 femaleand 2 male) that differed in identity to the faces used inExperiment 1, were generated using FaceGen software. Using
the same method as Experiment 1, each face was converted tograyscale, and a black oval mask applied (Figure 5B).
ProcedureThe following summarizes the changes in Experiment 2. In eachtrial, we presented a face of the same identity as A, B, and X,and required subjects to judge whether the contrast of the thirdface matched that of the first or second face (Figure 5A). X was
Frontiers in Psychology | www.frontiersin.org 8 July 2019 | Volume 10 | Article 1712

fpsyg-10-01712 July 22, 2019 Time: 17:18 # 9
Chen et al. Metacognition and Face Perceptual Learning
FIGURE 5 | Task and stimuli of Experiment 2: Face contrast matching. (A) The task performed by subjects was identical to the task used in Experiment 1, except forthe nature of the face stimuli. (B) Subjects were trained on one face set, and untrained on the other, in a fully counterbalanced manner. Faces were generated usingFaceGen software (v. 3.0;https://facegen.com/).
always identical to either A or B, with equal probability. We definethe contrast of face A, B, and X as their normalized root meansquare (nRMS) contrast. To obtain nRMS contrast, we calculatedthe standard deviation of luminance within the oval mask of eachface, and normalized it by their mean luminance (set to 125 cd/m2
for all faces). We chose nRMS contrast based on its reliabilityin predicting human contrast sensitivity to natural images (Bexand Makous, 2002). We estimated nRMS contrast thresholds (inlog scale) corresponding to 75% accuracy using QUEST (β = 3.5,δ = 0.05, and γ = 0.5). In each trial, we first converted contrastthreshold estimates to linear scale (i.e., 10threshold), before halvingthe threshold and subtracting it from, and adding it to, the nRMScontrast midpoint (0.5 linear scale) for a particular face to derivethe contrast values for A and B faces. The contrast of A (and B)had an equal probability of being the midpoint± (threshold/2).
For both pre- and post-training phases, subjects were tested onall 4 faces. During training, we trained half our subjects on face set1, and the other on face set 2. Each face set consisted of a male andfemale face (Figure 5B). In all 3 phases of our task design, eachface was used in place of each face pair in Experiment 1.
Data and statistical analysisExperiment 2 followed the same data and statistical analysis asExperiment 1, with the exception of the following changes. Inboth analyses, each face was used in place of each face pair inExperiment 1. Furthermore, estimates of contrast threshold for
each face used the following QUEST parameters: β = 3.5, δ = 0.05and γ = 0.5.
Data availabilityThe psychophysical dataset analyzed in Exp. 1 and 2, andthe signal detection models generated in this study, areavailable in the Perceptual-learning-metacognition-studyrepository: https://github.com/DBenChen/Perceptual-learning-metacognition-study.
ResultsThe results of Experiment 2 are shown in Figure 6. Frompre- to post-training, contrast threshold significantly decreasedfor both the trained (Z = −2.17, p = 0.015) and untrained(Z = −2.54, p = 0.006) face set (Figure 6A). Transfer Indexwas 0.62 (SD = 1.25), which was significantly greater than 0(p = 0.02), but not less than 1 (p = 0.09). This suggests that withtraining, subjects successfully demonstrated identity-invariantVPL of face contrast.
With daily training, contrast threshold steadily decreased,confirmed by a significant main effect of training on threshold[χ2(1) = 12.62, p < 0.001; Figure 6B]. As intended by ourQUEST procedure however, no main effect of training onobjective accuracy (Type-I AUC) was observed [χ2(1) = 0.28,p = 0.60; Figure 6C]. Importantly, no main effect of trainingon metacognitive accuracy (Type-II AUC) was also found
Frontiers in Psychology | www.frontiersin.org 9 July 2019 | Volume 10 | Article 1712

fpsyg-10-01712 July 22, 2019 Time: 17:18 # 10
Chen et al. Metacognition and Face Perceptual Learning
FIGURE 6 | Results for Experiment 2. (A) Pre- and post-training effects measured as median contrast threshold for trained and untrained face sets before (on Day 1)and after (on Day 3) training sessions. (∗ and ∗∗ indicate p < 0.05 and p < 0.01, respectively). Although threshold significantly decreased with training over 3 days(B), none of the following changed with training: Type-I AUC for objective accuracy (C), Type-II AUC for metacognitive accuracy (D), confidence ratings for correct(solid) and incorrect (dashed) trials (E), and the variance of confidence ratings for correct (solid) and incorrect (dashed) trials (F). Error bars denote ± 1within-subjects SEM (Cousineau, 2005).
[χ2(1) = 0.34, p = 0.56; Figure 6D], consistent with improvedmetacognition as predicted by our single-stage model(Figures 1E,F). Similarly, we also found no main effect oftraining on mean confidence ratings for correct [χ2(1) = 0.003,p = 0.96] and incorrect [χ2(1) = 0.12, p = 0.73] trials (Figure 6E),and no main effect of training on the variance of confidenceratings for correct [χ2(1) = 2.16, p = 0.14] and incorrect[χ2(1) = 1.84, p = 0.18] trials (Figure 6F).
As with Experiment 1, we also tested the robustness ofour AUC findings by performing a secondary analysis whereparticipants’ daily training trials were pooled to compute a singledaily Type-I and Type-II AUC estimate for each participant
(in contrast to the block-by-block method of our primaryanalysis). This analysis revealed comparable results to theprimary analysis of Experiment 2, namely both Type-I andType-II AUC remaining constant with face contrast VPL (seeSupplementary Material).
MODEL II: DUAL-STAGE NOISEREDUCTION MODEL
While the metacognitive accuracy result in Experiment 2was consistent with our single-stage model, the metacognitive
Frontiers in Psychology | www.frontiersin.org 10 July 2019 | Volume 10 | Article 1712

fpsyg-10-01712 July 22, 2019 Time: 17:18 # 11
Chen et al. Metacognition and Face Perceptual Learning
accuracy result in Experiment 1 was not. The primary reason isthat the single-stage model derives Type-I and II AUC from thesame signal, resulting in a highly correlated Type-I and II AUC(r = 0.99). To reproduce the dissociation between Type-I and IIAUC in Experiment 1, it is necessary to decrease this correlationby considering a model where Type-I and II AUC are not derivedfrom the same signal.
Given recent evidence from studies of metacognition (Pleskacand Busemeyer, 2010; Ratcliff and Starns, 2013; Cortese et al.,2016), it is reasonable to assume a first stage for perceptualdecision-making, and a second stage for confidence judgementsthat inherits the signals used in perceptual decision-making,but also receives additional noise. Accordingly, we propose adifferent model that follows the same basic architecture andassumptions of our single-stage model (Figures 1A,B), with thefollowing exception. Prior to assigning confidence ratings tointernal response values, we added Gaussian noise (mean = 0,standard deviation = σII , where σII > 0) to the internal responses.Confidence ratings were then assigned to the noised internalresponses, using the same method as our single-stage model(Figure 1B). We term this model the ‘dual-stage model’.
In the dual-stage model, we consider the possibility thatVPL reduces the amount of noise (σII) added to internalresponses prior to assigning confidence judgements, independentof the amount of noise reduction for perceptual decision-making(σI). The key findings of Experiment 1 to be explained bythis model are: (i) decreased sensory thresholds, (ii) constantType-I AUC, and (iii) decreased Type-II AUC (Figures 4B,D).Figures 7A,B are exemplary modeling results that reproduce thepsychophysical results of Experiment 1. For this, we needed toassume that VPL decreases the noise associated with perceptualdecision-making (σI), but not the noise associated withconfidence judgements (σII). Figures 7C,D show an examplethat reproduces the results of Experiment 2 (Figures 6B–D). Toachieve this, we needed to assume that VPL decreases the noisefor both perceptual decision-making and confidence judgements.
Figure 8 displays a more extensive parameter searchin the dual-stage model and reveals how this modelcan disrupt the strong correlation between Type-I andII AUC. As the amount of σII increases from 0.5, 0.75,to 1, the correlation coefficient between Type-I and IIAUC decreases from 0.96, 0.92, to 0.89 for Figures 8Evs. 8F, 8C vs. 8D, and 8A vs. 8B, respectively. Notethat Type-I AUC is unaffected by the addition ofnoise (σII) to confidence judgements as the first-orderperceptual discriminations remain intact (i.e., proportionof hits:(hits+misses), and false alarms:(false alarms+correctrejections); Supplementary Figure S1).
In our Supplementary Material, we consider a model whereVPL enhances the internal signal magnitude (i.e., a signalenhancement model; Gold et al., 1999), rather than decreasingthe noise associated with perceptual decision-making (σI).However, to reproduce the results of Experiment 1, the signalenhancement model predicts that VPL should increase the noiseassociated with confidence judgements (σII). We found thisphysiologically implausible and therefore do not consider thismodel in further detail.
GENERAL DISCUSSION
We sought to investigate whether or not the metacognitiveaccuracy of perceptual decision-making could be improved byVPL, and whether learned stimulus complexity modulates thisrelationship. Across three consecutive days, subjects were trainedto discriminate faces based on either their high-level identity(Exp. 1) or low-level contrast (Exp. 2). We measured objectiveand metacognitive accuracy as Type-I and II AUC, respectively.To control for objective accuracy during training, we devised anovel QUEST procedure which updates stimulus intensity onlyat the end of each training block, allowing the measurement ofType-I and II AUC within each block.
Holding objective accuracy constant across training days, wefound that metacognitive accuracy decreased with face identityVPL (Figure 4D), which could not be attributed to changesin the mean or variance of confidence ratings (Figures 4E,F).According to our simple simulations, our face identity VPL resultis inconsistent with a model where perceptual decision-makingand confidence judgements are assumed to occur in a single stage(Figure 1). In the single-stage model, metacognitive accuracy isstrongly correlated with objective accuracy (r = 0.99). As a result,Type-II AUC has to remain constant when Type-I AUC is heldconstant (Figures 1E,F). In fact, this prediction is consistent withthe results of Experiment 2, in which Type-II AUC remainedconstant with face contrast VPL (Figure 6D).
To account for the decrease of metacognitive accuracy withface identity VPL (Figure 4D), we needed to dissociate Type-I and II AUC. We found that the correlation between Type-Iand II AUC can be reduced through the introduction of aseparate stage for confidence judgements, which inherits noisysignals from the perceptual decision-making stage (Figures 7,8). If we assume that VPL reduces the noise associated withperceptual decision-making (σI) but not confidence judgements(σII), we could reproduce the pattern of results we obtainedfor Type-I and II AUC with face identity VPL (Figures 7A,B).Over the larger parameter search space, we confirmed thatgreater noise added before confidence judgements disrupted thestrong correlation between Type-I and II AUC. This result isexpected from the architecture of the dual-stage model andwhat Type-I and II AUC are supposed to measure: Type-I AUC is supposed to measure the quality of perceptualdiscrimination independent of metacognition. Type-II AUC issupposed to measure the accuracy of metacognition, whichshould degrade if the confidence judgment stage receives noisyperceptual signals.
Taken together, our results can be interpreted asdemonstrating that when subjects improve the discriminationof high-level face identity, they do not improve consciousaccessibility to the learned information supporting theirenhanced perceptual decision-making. Conversely, consciousaccessibility to such information is improved after trainingsubjects to discriminate low-level face contrast. To ourknowledge, this study is the first to obtain such a dissociativefinding. If one presupposes that the processing of high-levelvisual properties should be more strongly associated withthe conscious accessibility of information, our findings may
Frontiers in Psychology | www.frontiersin.org 11 July 2019 | Volume 10 | Article 1712

fpsyg-10-01712 July 22, 2019 Time: 17:18 # 12
Chen et al. Metacognition and Face Perceptual Learning
FIGURE 7 | Dual-stage signal detection model: Psychometric functions. We added Gaussian noise (mean = 0, standard deviation = σII ) to the internal responses inour single-stage model (Figure 1) prior to assigning confidence ratings. (A) Hypothetical psychometric functions corresponding to Type-I AUC at different levels of σI
noise (blue: σI = 2, green: σI = 1.5, and red: σI = 1) at constant noise for confidence judgements (σII = 1). Vertical dashed lines indicate thresholds at each level ofnoise to attain a Type-I AUC of 0.8 (horizontal dashed line). (B) Hypothetical Type-II AUC psychometric function with the same format as (A). (A,B) Correspond to theresults of Experiment 1: Face indentity VPL, where Type-I AUC remained constant (A) but Type-II AUC decreased (B) over 3 training days. (C,D) Type-I and II AUCpsychometric functions where we modulated the noise associated with perceptual decision-making (blue: σI = 2, green: σI = 1.5, and red: σI = 1) and confidencejudgements (blue: σII = 1, green: σII = 0.75, and red: σII = 0.5). (C,D) Correspond to the results of Experiment 2: Face contrast VPL, where both Type-I (C) and II (D)AUC remained constant over 3 training days.
appear counterintuitive. However, there are some hints inthe literature (Hochstein and Ahissar, 2002; Ahissar andHochstein, 2004) that are consistent with our findings, wherethe VPL of high-level visual properties are proposed to bemediated by unconscious mechanisms, while the VPL of lower-level properties are proposed to involve both conscious andunconscious mechanisms. If this is the case, this may havemanifested as improvements in conscious accessibility withlow-level face contrast VPL, but not high-level face identity VPL.
In the context of current views of metacognition, our key faceidentity VPL finding is not consistent with single-stage modelsfor perceptual decision-making and confidence judgements(Galvin et al., 2003; Kepecs et al., 2008; Sanders et al., 2016). Aswe have demonstrated (Figure 1), such models should predict astrong correlation between Type-I and II AUC, and is thereforeinconsistent with our face identity VPL result. With face contrastVPL on the other hand, metacognitive accuracy improved, whichis consistent with single-stage perceptual decision-making andconfidence models (Galvin et al., 2003; Kepecs et al., 2008;Sanders et al., 2016). Although one possible interpretation of ourfindings as a whole is that low-level VPL improves metacognitionwhile high-level VPL does not, this requires further research
to address whether these findings can be generalized to otherVPL paradigms. Critical to such investigations is the use of ourVPL protocol, which fixes objective accuracy by updating QUESTfrom block-to-block, allowing training effects on metacognitiveaccuracy to be reliably measured.
Furthermore, our protocol also addresses a key limitationwithin the VPL literature. VPL is generally assumed to produceknowledge of the learned stimuli that is independent of consciousexperience (Fahle and Poggio, 2002). However, this conclusionhas been largely inferred using objective measures of VPLperformance (Manns and Squire, 2001; Fahle and Daum, 2002),rather than from subjective measures of VPL performance(e.g., confidence ratings). By measuring subjective confidencejudgements and holding objective accuracy constant, we foundthat face contrast VPL improved metacognitive accuracy,suggesting subjects were conscious rather than non-conscious ofthe knowledge guiding their perceptual decision-making. Thus,our protocol can be used in future studies to more reliablyinvestigate the relationship between VPL and consciousness.
In considering our study’s limitations, we acknowledge thatthe simulated psychometric functions of our models, whichestimated performance (Type-I and II AUC) at a single stimulus
Frontiers in Psychology | www.frontiersin.org 12 July 2019 | Volume 10 | Article 1712

fpsyg-10-01712 July 22, 2019 Time: 17:18 # 13
Chen et al. Metacognition and Face Perceptual Learning
FIGURE 8 | Dual-stage signal detection model: Surface plots. Surface plots for Type-I (A,C,E) and Type-II (B,D,F) AUC as a function of M and σI with σII = 1 (A,B),σII = 0.75 (C,D), and σII = 0.5 (E,F). The white lines represent the points where Type-I AUC is around 0.8 (0.79–0.81). Type-I AUC is unaffected by the addition ofnoise (σII ) to confidence judgements as the first-order perceptual discriminations remain intact.
difference, may not fully concur with the empirical estimationof the full psychometric function (Shen, 2013). Future studiesshould therefore seek to measure the full psychometric function,which may provide further insights into the effects of training onmetacognition (e.g., changes in the slope of Type-II psychometricfunctions) which could not be discerned in the present study.However, if such studies were to be performed, we wouldpredict that our conclusions here would remain unchanged,with metacognition improving with the VPL of face contrastbut not face identity. Furthermore, although confidence ratingshave been widely used as an index of conscious informationaccessibility (e.g., Galvin et al., 2003; Fleming et al., 2010),the relationship between confidence ratings and conscious
accessibility remains controversial (Charles et al., 2013; Rauschand Zehetleitner, 2016). It would therefore be of interest forfuture research to attempt to replicate our present findings usingalternative measures of consciousness, such as post-decisionwagering (Sandberg et al., 2010).
In conclusion, we found evidence suggesting that consciousaccess to the information supporting perceptual decision-makingis improved by the VPL of a low- but not high-level face property.Beyond VPL, our study can open new avenues to explorethe relationship between metacognition and other learningparadigms, such as artificial grammar learning (Scott et al., 2014),and perceptual learning in non-visual modalities (Ahissar et al.,2009). Understanding the relationship between learning and
Frontiers in Psychology | www.frontiersin.org 13 July 2019 | Volume 10 | Article 1712

fpsyg-10-01712 July 22, 2019 Time: 17:18 # 14
Chen et al. Metacognition and Face Perceptual Learning
consciousness in turn, constrains how our conscious experienceis shaped by learned information, a central question in cognitiveneuroscience (Bayne et al., 2009).
ETHICS STATEMENT
All procedures were approved by the Monash University HumanResearch Ethics Committee, and performed in accordancewith the committee’s guidelines. Signed informed consent wasobtained from all subjects prior to testing.
AUTHOR CONTRIBUTIONS
BC and NT developed the study concept and design, anddrafted the manuscript. BC performed the testing, datacollection, data analysis, interpreted the results under thesupervision of NT, and prepared the Figures 1–5. MM providedcomments on the manuscript. All authors approved the finalversion for submission.
FUNDING
NT was supported by Precursory Research for Embryonic Scienceand Technology project from the Japan Science and TechnologyAgency (3630), the Future Fellowship (FT120100619), andthe Discovery Project (DP130100194) from the AustralianResearch Council.
ACKNOWLEDGMENTS
We are very grateful to Lisandro Kaunitz and Roger Koenigfor their Matlab programming advice. An earlier version of thismanuscript was previously submitted to the BioRxiv pre-printserver as Chen et al. (2016).
SUPPLEMENTARY MATERIAL
The Supplementary Material for this article can be foundonline at: https://www.frontiersin.org/articles/10.3389/fpsyg.2019.01712/full#supplementary-material
REFERENCESAhissar, M., and Hochstein, S. (2004). The reverse hierarchy theory of visual
perceptual learning. Trends Cogn. Sci. 8, 457–464. doi: 10.1016/j.tics.2004.08.011
Ahissar, M., Nahum, M., Nelken, I., and Hochstein, S. (2009). Reverse hierarchiesand sensory learning. Philos. Trans. R. Soc. Lond. B Biol. Sci. 364, 285–299.doi: 10.1098/rstb.2008.0253
Barrett, A. B., Dienes, Z., and Seth, A. K. (2013). Measures of metacognition onsignal-detection theoretic models. Psychol. Methods 18, 535–552. doi: 10.1037/a0033268
Bates, D., Mächler, M., Bolker, B., and Walker, S. (2015). Fitting linearmixed-effects models using lme4. J. Stat. Softw. 67:48. doi: 10.18637/jss.v067.i01
Bayne, T., Cleeremans, A., and Wilken, P. (2009). The Oxford Companion toConsciousness. New York, NY: Oxford University Press.
Bertels, J., Franco, A., and Destrebecqz, A. (2012). How implicit is visual statisticallearning? J. Exp. Psychol. Learn. Mem. Cogn. 38, 1425–1431. doi: 10.1037/a0027210
Bex, P. J., and Makous, W. (2002). Spatial frequency, phase, and the contrast ofnatural images. J. Opt. Soc. Am. A Opt. Image Sci. Vis. 19, 1096–1106.
Bi, T., Chen, N., Weng, Q., He, D., and Fang, F. (2010). Learning to discriminateface views. J. Neurophysiol. 104, 3305–3311. doi: 10.1152/jn.00286.2010
Brainard, D. H. (1997). The psychophysics toolbox. Spat. Vis. 10, 433–436.doi: 10.1163/156856897x00357
Charles, L., Van Opstal, F., Marti, S., and Dehaene, S. (2013). Distinct brainmechanisms for conscious versus subliminal error detection. Neuroimage 73,80–94. doi: 10.1016/j.neuroimage.2013.01.054
Chen, B., Mundy, M., and Tsuchiya, N. (2016). Learning improves conscious accessat the bottom, but not the top: reverse hierarchical effects in perceptual learningand metacognition. BioRxiv 073130. doi: 10.1101/073130
Cortese, A., Amano, K., Koizumi, A., Kawato, M., and Lau, H. (2016). Multivoxelneurofeedback selectively modulates confidence without changing perceptualperformance. Nat. Commun. 7:13669. doi: 10.1038/ncomms13669
Cousineau, D. (2005). Confidence intervals in within-subject designs: a simplersolution to Loftus and Masson’s method. Tutor. Quan. Methods Psychol. 1,42–45. doi: 10.20982/tqmp.01.1.p042
Dosher, B. A., and Lu, Z.-L. (1998). Perceptual learning reflects external noisefiltering and internal noise reduction through channel reweighting. Proc. Natl.Acad. Sci. U.S.A. 95, 13988–13993. doi: 10.1073/pnas.95.23.13988
Fahle, M., and Daum, I. (2002). Perceptual learning in amnesia. Neuropsychologia40, 1167–1172. doi: 10.1016/s0028-3932(01)00231-7
Fahle, M., and Poggio, T. (2002). Perceptual Learning. Cambridge: MIT Press.Fleming, S. M., Weil, R. S., Nagy, Z., Dolan, R. J., and Rees, G. (2010). Relating
introspective accuracy to individual differences in brain structure. Science 329,1541–1543. doi: 10.1126/science.1191883
Galvin, S. J., Podd, J. V., Drga, V., and Whitmore, J. (2003). Type 2 tasksin the theory of signal detectability: discrimination between correct andincorrect decisions. Psychon. Bull. Rev. 10, 843–876. doi: 10.3758/bf03196546
Gold, J., Bennett, P. J., and Sekuler, A. B. (1999). Signal but not noise changes withperceptual learning. Nature 402, 176–178. doi: 10.1038/46027
Gold, J. I., Law, C. T., Connolly, P., and Bennur, S. (2010). Relationships betweenthe threshold and slope of psychometric and neurometric functions duringperceptual learning: implications for neuronal pooling. J. Neurophysiol. 103,140–154. doi: 10.1152/jn.00744.2009
Hochstein, S., and Ahissar, M. (2002). View from the top: hierarchies and reversehierarchies in the visual system. Neuron 36, 791–804.
Kaunitz, L. N., Rowe, E. G., and Tsuchiya, N. (2016). Large capacity of consciousaccess for incidental memories in natural scenes. Psychol. Sci. 27, 1266–1277.doi: 10.1177/0956797616658869
Kepecs, A., Uchida, N., Zariwala, H. A., and Mainen, Z. F. (2008). Neural correlates,computation and behavioural impact of decision confidence. Nature 455, 277–331. doi: 10.1038/nature07200
Macmillan, N. A., and Creelman, C. D. (2005). Detetion Theory: A user’s Guide, 2ndEdn. Cambridge: Cambridge University Press.
Maniscalco, B., and Lau, H. (2012). A signal detection theoretic approach forestimating metacognitive sensitivity from confidence ratings. Conscious. Cogn.21, 422–430. doi: 10.1016/j.concog.2011.09.021
Manns, J. R., and Squire, L. R. (2001). Perceptual learning, awareness, and thehippocampus. Hippocampus 11, 776–782. doi: 10.1002/hipo.1093
Pelli, D. G. (1997). The videotoolbox software for visual psychophysics:transforming numbers into movies. Spat. Vis. 10, 437–442. doi: 10.1163/156856897x00366
Pleskac, T. J., and Busemeyer, J. R. (2010). Two-stage dynamic signal detection:a theory of choice, decision time, and confidence. Psychol. Rev. 117, 864–901.doi: 10.1037/a0019737
Ratcliff, R., and Starns, J. J. (2013). Modeling confidence judgments, responsetimes, and multiple choices in decision making: recognition memory andmotion discrimination. Psychol. Rev. 120, 697–719. doi: 10.1037/a0033152
Frontiers in Psychology | www.frontiersin.org 14 July 2019 | Volume 10 | Article 1712

fpsyg-10-01712 July 22, 2019 Time: 17:18 # 15
Chen et al. Metacognition and Face Perceptual Learning
Rausch, N., and Zehetleitner, M. (2016). Visibility is not equivalent to confidencein a low contrast orientation discrimination task. Front. Psychol. 7:591. doi:10.3389/fpsyg.2016.00591
Sandberg, K., Timmermans, B., Overgaard, M., and Cleeremans, A. (2010).Measuring consciousness: is one measure better than the other? Conscious.Cogn. 19, 1069–1078. doi: 10.1016/j.concog.2009.12.013
Sanders, J. I., Hangya, B., and Kepecs, A. (2016). Signatures of a statisticalcomputation in the human sense of confidence. Neuron 90, 499–506. doi: 10.1016/j.neuron.2016.03.025
Schlagbauer, B., Muller, H. J., Zehetleitner, M., and Geyer, T. (2012). Awarenessin contextual cueing of visual search as measured with concurrent access- andphenomenal-consciousness tasks. J. Vis. 12:25. doi: 10.1167/12.11.25
Schwiedrzik, C. M., Singer, W., and Melloni, L. (2011). Subjective and objectivelearning effects dissociate in space and in time. Proc. Natl. Acad. Sci. U.S.A. 108,4506–4511. doi: 10.1073/pnas.1009147108
Scott, R. B., Dienes, Z., Barrett, A. B., Bor, D., and Seth, A. K. (2014). Blind insight:metacognitive discrimination despite chance task performance. Psychol. Sci. 25,2199–2208. doi: 10.1177/0956797614553944
Seitz, A. R., Kim, D., and Watanabe, T. (2009). Rewards evoke learning ofunconsciously processed visual stimuli in adult humans. Neuron 61, 700–707.doi: 10.1016/j.neuron.2009.01.016
Shen, Y. (2013). Comparing adaptive procedures for estimating the psychometricfunction for an auditory gap detection task. Attent. Percept. Psychophys. 75,771–780. doi: 10.3758/s13414-013-0438-439
Watanabe, T., Nanez, J. E., and Sasaki, Y. (2001). Perceptual learningwithout perception. Nature 413, 844–848. doi: 10.1038/35101601
Watson, A. B., and Pelli, D. G. (1983). Quest: a bayesian adaptivepsychometric method. Percept. Psychophys. 33, 113–120. doi: 10.3758/BF03202828
Wilimzig, C., Tsuchiya, N., Fahle, M., Einhauser, W., and Koch, C.(2008). Spatial attention increases performance but not subjectiveconfidence in a discrimination task. J. Vis. 8, 1–10. doi: 10.1167/8.5.7
Willenbockel, V., Javid, S., Daniel, F., Greg, O. H., Frédéric, G., James, W. T., et al.(2010). Controlling low-level image properties: the SHINE toolbox. Behav. Res.Methods 42, 671–684. doi: 10.3758/brm.42.3.671
Conflict of Interest Statement: The authors declare that the research wasconducted in the absence of any commercial or financial relationships that couldbe construed as a potential conflict of interest.
Copyright © 2019 Chen, Mundy and Tsuchiya. This is an open-access articledistributed under the terms of the Creative Commons Attribution License (CC BY).The use, distribution or reproduction in other forums is permitted, provided theoriginal author(s) and the copyright owner(s) are credited and that the originalpublication in this journal is cited, in accordance with accepted academic practice. Nouse, distribution or reproduction is permitted which does not comply with these terms.
Frontiers in Psychology | www.frontiersin.org 15 July 2019 | Volume 10 | Article 1712