metafraud: a meta-learning framework for detecting ... · a meta-learning framework for detecting...
TRANSCRIPT

SPECIAL ISSUE: BUSINESS INTELLIGENCE RESEARCH
METAFRAUD: A META-LEARNING FRAMEWORK FORDETECTING FINANCIAL FRAUD1
Ahmed AbbasiMcIntire School of Commerce, University of Virginia,
Charlottesville, VA 22908 U.S.A. {[email protected]}
Conan Albrecht, Anthony Vance, and James HansenInformation Systems Department, Marriott School of Management, Brigham Young University,
Provo, UT 84606 U.S.A. {[email protected]} {[email protected]} {[email protected]}
Financial fraud can have serious ramifications for the long-term sustainability of an organization, as well asadverse effects on its employees and investors, and on the economy as a whole. Several of the largestbankruptcies in U.S. history involved firms that engaged in major fraud. Accordingly, there has beenconsiderable emphasis on the development of automated approaches for detecting financial fraud. However,most methods have yielded performance results that are less than ideal. In consequence, financial frauddetection continues as an important challenge for business intelligence technologies.
In light of the need for more robust identification methods, we use a design science approach to developMetaFraud, a novel meta-learning framework for enhanced financial fraud detection. To evaluate the pro-posed framework, a series of experiments are conducted on a test bed encompassing thousands of legitimateand fraudulent firms. The results reveal that each component of the framework significantly contributes to itsoverall effectiveness. Additional experiments demonstrate the effectiveness of the meta-learning frameworkover state-of-the-art financial fraud detection methods. Moreover, the MetaFraud framework generatesconfidence scores associated with each prediction that can facilitate unprecedented financial fraud detectionperformance and serve as a useful decision-making aid. The results have important implications for severalstakeholder groups, including compliance officers, investors, audit firms, and regulators.
Keywords: Fraud detection, financial statement fraud, feature construction, meta-learning, businessintelligence, design science
Introduction1
Financial fraud has important implications for investors,regulators, auditors, and the general public. In recent years,
several high-profile frauds have been uncovered. Thesefrauds have had a significant negative impact on the economyand stock markets worldwide, and have resulted in a generalloss of confidence in the integrity of businesses (Albrecht,Albrecht, and Albrecht 2008; Carson 2003). For instance,major frauds at Enron, WorldCom, and several other firmswere the principal catalyst of a 78 percent drop in theNASDAQ Index between 2000 and 2002. Despite theresulting changes to basic accounting and internal control pro-cedures, the problem has not abated, as the number of known
1Hsinchun Chen, Roger Chiang, and Veda Storey were the accepting senioreditors for this paper. Gediminas Adomavicius served as the associateeditor.
The appendix for this paper is located in the “Online Supplements” sectionof the MIS Quarterly’s website (http://www.misq.org).
MIS Quarterly Vol. 36 No. 4, pp. 1293-1327/December 2012 1293

Abbasi et al./A Meta-Learning Framework for Detecting Financial Fraud
Table 1. Largest Bankruptcies in U.S. History
Company Assets (Billions) When Filed Fraud Involved?
1. Lehman Brothers, Inc. $691.0 September 2008 Yes
2. Washington Mutual, Inc. $327.9 September 2008 Not yet determined
3. WorldCom, Inc. $103.9 July 2002 Yes
4. General Motors Corp. $91.0 June 2009 Not yet determined
5. CIT Group, Inc. $80.4 November 2009 Not yet determined
6 Enron Corp. $65.5 December 2001 Yes
7. Conseco, Inc. $61.4 December 2002 Yes
8. Chrysler, LLC $39.3 April 2009 Not yet determined
9. Thornburg Mortgage, Inc. $36.5 May 2009 Not yet determined
10. Pacific Gas & Electric Co. $36.2 April 2001 No
Source: Bankruptcydata.com (2010)
frauds in the United States has increased considerably in thepast 10 years (Dechow et al. 2011). According to the Asso-ciation of Certified Fraud Examiners (2010), the typicalorganization loses an estimated 5 percent of its total annualrevenue to fraud. Moreover, many of the fraud schemesresponsible for these losses span several years, underscoringthe ineffectiveness of existing fraud prevention mechanisms.
Financial fraud has also contributed to the bankruptcy ofmajor organizations. Table 1 shows that 4 of the 10 largestbankruptcies in U.S. history were associated with majorfinancial frauds (in bold). Three other major bankruptcies,Refco, Global Crossing, and Adelphia (the 13th, 15th, and 21st
largest bankruptcies), were also associated with financialfrauds. There has not been sufficient time to know whethersome of the other recent bankruptcies involved fraudulentactivities.
Moreover, the problem appears to have global reach. Forexample, major incidents in Australia (Harris Scarfe andHIH), Italy (Parmalat), France (Vivendi), the Netherlands(Royal Ahold), Korea, (SKGlobal), China (YGX), Japan(Livedoor Co.), and India (Satyam) indicate that financialfraud is occurring not just in the United States, but throughoutthe world (Albrecht, Albrecht, and Albrecht 2008). TheAssociation of Certified Fraud Examiners estimates that everyyear, worldwide financial fraud losses exceed a trilliondollars. This estimate is based on hundreds of documentedfinancial fraud cases every year in Europe, Asia, Africa,South America, and Oceania, coupled with the reality thatmany frauds (and resulting losses) go undetected.
In addition to the large-scale economic implications, threestakeholders in particular stand to benefit from enhanced
financial fraud detection capabilities: investors, audit firms,and government regulators (Cecchini et al. 2010; Lin et al.2003). Investors—a term we use broadly to include indi-viduals, investment firms, rating agencies, and others—oftenhave little inside information on potential fraud risk. Frauddetection tools could allow investors to make better informeddecisions (Albrecht, Albrecht, and Dunn 2001). The secondgroup, audit firms, could benefit by using a fraud risk assess-ment during the client acceptance period, as well as duringroutine audits (Albrecht, Albrecht, and Albrecht 2008;Cecchini et al. 2010). Finally, enhanced fraud detection toolscould help a third group, government regulators. Sinceregulators are typically limited in terms of their available timeand resources, effective fraud detection tools could allowthem to better prioritize and focus their investigatory efforts(Albrecht, Albrecht, and Dunn 2001; Dechow et al. 2011).
Despite these needs, existing methods for financial frauddetection have been unable to provide adequate fraud detec-tion capabilities, with most studies on U.S. firms attainingdetection rates of less than 70 percent (Cecchini et al. 2010;Green and Choi 1997; Lin et al. 2003). Moreover, many priorstudies utilized internal (i.e., non-public) data, which is morecostly and time-consuming to acquire, and is generallyunavailable to many of the aforementioned stakeholders(Cecchini et al. 2010). For instance, even audit firms andregulators do not have access to internal data until an audit/investigation is already taking place (Albrecht, Albrecht, andAlbrecht 2008). A need remains for techniques capable ofproviding enhanced detection of financial fraud using publiclyavailable information. While financial fraud can never beconfirmed without a full investigation, advances in frauddetection methods may provide red flags that warn stake-holders of the likelihood of fraud (Bay et al. 2006).
1294 MIS Quarterly Vol. 36 No. 4/December 2012

Abbasi et al./A Meta-Learning Framework for Detecting Financial Fraud
Recent developments in business intelligence (BI) tech-nologies have elevated the potential for discovering patternsassociated with complex problem domains (Watson andWixom 2007), such as fraud (Bolton and Hand 2002).Broadly, BI technologies facilitate historical, current, andpredictive views of business operations (Shmueli et al. 2007),and may suggest innovative and robust methods for predictingthe occurrence of fraud (Anderson-Lehman et al. 2004). Infact, fraud detection is recognized as an important applicationarea for predictive BI technologies (Brachman et al. 1996;Michalewicz et al. 2007). Since BI tools facilitate an im-proved understanding of organizations’ internal and externalenvironments (Chung et al. 2005), enhanced financial frauddetection methods could greatly benefit the aforementionedstakeholder groups: investors, audit firms, and regulators.The research objective of this study is to develop a businessintelligence framework for detecting financial fraud usingpublicly available information with demonstratively betterperformance than that achieved by previous efforts.
To achieve this objective, we adopted the design science para-digm to guide the development of the IT artifact, theMetaFraud framework (Hevner et al. 2004). In doing so, weselected meta-learning as the kernel theory to guide the designof the IT artifact. Meta-learning is a specialized form ofmachine learning that is able to learn about the learningprocess itself to increase the quality of results obtained(Brazdil et al. 2008). This ability was especially useful in ourcontext because of the complexities and nuances associatedwith fraud detection (Abbasi et al. 2010; Virdhagriswaran andDakin 2006). The MetaFraud framework encompasses fourcomponents that advocate the use of a rich set of measuresderived from publicly available financial statements, coupledwith robust classification mechanisms. We rigorously eval-uated our framework in a series of experiments that demon-strate the utility of each individual component of the frame-work, as well as the framework’s overall effectiveness incomparison to existing state-of-the-art financial fraud detec-tion methods.
The research contribution of this paper is the MetaFraudframework, which demonstrates that BI techniques (Shmueliet al. 2010; Vercellis 2009) based on meta-learning can beintegrated via a design science artifact to detect financialfraud with substantially higher performance than that obtainedby previous research. Important aspects of the architectureand process of MetaFraud include (1) robust feature construc-tion, which includes organizational and industry contextualinformation and the use of quarterly and annual data, and (2) amethod of fusing stacked generalization, semi-supervisedlearning, and adaptive/active learning. We demonstrate in thepaper how these two facets of the framework substantially
enhance fraud detection capabilities over existing techniques.Further, we provide (3) a confidence-level measure that iden-tified a large subset of fraud cases at over 90 percent legiti-mate and fraud recall, making fraud detection using publicinformation practicable for various stakeholders.
The remainder of this paper is organized as follows. The nextsection reviews previous efforts to identify financial fraud,and shows the need for more robust methods. The subsequentsection introduces the meta-learning kernel theory, anddescribes its usefulness in the context of financial fraud. Italso introduces six hypotheses by which the design artifactwas evaluated. The design of the MetaFraud framework isthen outlined, and details of the financial measures derivedfrom publicly available information used to detect fraud arepresented. The fifth section describes the experiments usedto evaluate the MetaFraud framework, and reports the resultsof the hypothesis testing. A discussion of the experimentalresults and their implications follows. Finally, we offer ourconclusions.
Literature Review
While prior financial fraud detection research has occa-sionally utilized internal data (e.g., auditor–client relation-ships, personal and behavioral characteristics, internal controloverrides), most recent studies recognized that this strategy isproblematic for most stakeholders because internal datasources are not readily available to investors, auditors, orregulators (Albrecht, Albrecht, and Albrecht 2008; Cecchiniet al. 2010; Dechow et al. 2011). Accordingly, we limit ourdiscussion of prior financial fraud detection research tostudies that have used publicly available (i.e., external) infor-mation. These studies have generally used measures derivedfrom public financial statements in combination with statis-tical and/or machine learning-based classification methods.A summary of related fraud detection research using externaldata is presented in Table 2, which shows the author and theyear of publication, a brief description of the feature set, themethod used, the data set, and the resulting overall classi-fication accuracy and fraud detection rate. From Table 2, wesee that the time line of prior studies spans a 15-year periodfrom Persons (1995) to Dikmen and Küçükkocaoğlu (2010),which underscores the continuing importance of financialfraud detection to both academics and practitioners.
With respect to the feature sets utilized, prior studies un-varyingly employed data taken from annual financial reports. Most studies used 8 to 10 financial measures (e.g., Beneish1999a; Green and Choi 1997; Kirkos et al. 2007; Persons
MIS Quarterly Vol. 36 No. 4/December 2012 1295

Abbasi et al./A Meta-Learning Framework for Detecting Financial Fraud
Table 2. Prior Financial Fraud Detection Studies Using Financial Statement Data
StudyAnnual Statement-based Feature Set Classification Method(s) Data Set Results
Persons (1995) 10 financial measuresfrom previous year
Logistic regression 200 firm-years;100 fraud,100 non-fraud
Overall: 71.5%;Fraud: 64.0%
Green and Choi(1997)
5 financial and 3accounting measures
Neural net 95 firm-years;46 fraud,49 non-fraud
Overall: 71.7%;Fraud: 68.4%
Fanning and Cogger(1998)
26 financial and 36accounting measures
Discriminant analysis,Logistic regression, Neuralnet
204 firm-years;102 fraud,102 non-fraud
Overall: 63.0%;Fraud: 66.0%
Summers andSweeney (1998)
6 financial measures Logistic regression 102 firm-years;51 fraud,51 non-fraud
Overall: 59.8%;Fraud: 67.8%
Beneish (1999a) 8 financial measures Probit regression 2,406 firm-years; 74 fraud,2,332 non-fraud
Overall: 89.5%;Fraud: 54.2%
Spathis (2002)a 10 financial measures Logistic regression 76 firm-years;38 fraud,38 non-fraud
Overall: 84.2%;Fraud: 84.2%
Spathis et al. (2002)a 10 financial measures Logistic regression,UTADIS
76 firm-years;38 fraud,38 non-fraud
Overall: 75.4%;Fraud: 64.3%
Lin et al. (2003) 6 financial and 2accounting measures
Logistic regression,Neural net
200 firm-years;40 fraud,160 non-fraud
Overall: 76.0%;Fraud: 35.0%
Kaminski et al.(2004)
21 financial measures Discriminant analysis 158 firm-years;79 fraud,79 non-fraud
Overall: 53.8%;Fraud: 21.7%
Kirkos et al. (2007)a 10 financial measures Bayesian net, ID3 decision tree, Neuralnet
76 firm-years;38 fraud,38 non-fraud
Overall: 90.3%;Fraud: 91.7%
Gaganis (2009)a 7 financial measures Discriminant analysis,Logistic regressionNearest neighbor, Neuralnet, SVM, UTADIS
398 firm-years;199 fraud,199 non-fraud
Overall: 87.2%;Fraud: 87.8%
Cecchini et al. (2010) 23 financial variablesused to generate ratios
SVM using customfinancial kernel
3,319 firm-years;132 fraud,3,187 non-fraud
Overall: 90.4% Fraud: 80.0%
Dikmen andKüçükkocaoğlu(2010)b
10 financial measures Three-phase cutting planealgorithm
126 firm-years;17 fraud,109 non-fraud
Overall: 67.0%;Fraud: 81.3%
Dechow et al. (2011) 7 financial measures Logistic regression 79,651 firm-years;293 fraud79,358 non-fraud
Overall: 63.7%;Fraud: 68.6%
aData taken from Greek firms. bData taken from Turkish firms.
1296 MIS Quarterly Vol. 36 No. 4/December 2012

Abbasi et al./A Meta-Learning Framework for Detecting Financial Fraud
1995; Spathis 2002; Summers and Sweeney 1998). Whilemost prior studies using larger feature sets did not attain goodresults (e.g., Fanning and Cogger 1997; Kaminski et al. 2004),Cecchini et al. (2010) had greater success using 23 seedfinancial variables to automatically generate a large set offinancial ratios.
The most commonly used classification methods were logisticregression, neural networks, and discriminant analysis, whiledecision trees, Bayesian networks, and support vector mach-ines (SVM) have been applied in more recent studies(Cecchini et al. 2010; Gaganis 2009; Kirkos et al. 2007). Thenumber of fraud firms in the data sets ranged from 38 firms to293 firms. Most studies used a pair-wise approach in whichthe number of non-fraud firms was matched with the numberof fraud firms (Fanning and Cogger 1998; Gaganis 2009;Kirkos et al. 2007; Persons 1995; Spathis 2002; Summers andSweeney 1998). However, a few studies had significantlylarger sets of non-fraud firms (Beneish 1999a; Cecchini et al.2010; Dechow et al. 2011).
In terms of results, the best performance values were achievedby Cecchini et al. (2010), Gaganis (2009), Kirkos et al.(2007), and Spathis (2002). Only these four studies had over-all accuracies and fraud detection rates of more than 80percent. The latter three were all conducted using a data setcomposed of Greek firms (mostly in the manufacturingsector), which were governed by Greek legislation and AthensStock Exchange regulations regarding what is classified asunusual behavior by a firm. Given the differences in auditingand reporting standards between Greece and the UnitedStates, as well as the larger international community (Barth etal. 2008), it is unclear how well those methods generalize/translate to other settings. Cecchini et al. used an SVMclassifier that incorporated a custom financial kernel. Thefinancial kernel was a graph kernel that used input financialvariables to implicitly derive numerous financial ratios. Theirapproach attained a fraud detection rate of 80 percent on a 25fraud-firm test set.
With respect to the remaining studies, Beneish (1999a) at-tained an overall accuracy of 89.5 percent, but this wasprimarily due to good performance on non-fraud firms,whereas the fraud detection rate was 54.2 percent. With theexception of Cecchini et al. no other prior study on U.S. firmshas attained a fraud detection rate of more than 70 percent.
Our analysis of these studies motivated several refinementsthat are incorporated in our meta-learning framework, namely(1) the inclusion of organizational and industry-level contextinformation, (2) the utilization of quarterly and annualstatement-based data, and (3) the adoption of more robust
fraud classification methods. The MetaFraud framework andits components are discussed in detail in the followingsections.
Using Meta-Learning as a Kernel Theoryfor Financial Fraud Detection
As mentioned in the previous section, and evidenced byTable 2, prior studies using data from U.S. firms have gener-ally attained inadequate results, with fraud detection ratestypically less than 70 percent. These results have causedsome to suggest that data based on financial statements isincapable of accurately identifying financial fraud (at least inthe context of U.S. firms). In one of the more recent studieson U.S. firms, Kaminski et al. (2004, p. 17) attained resultsonly slightly better than chance, causing the authors to state,“These results provide empirical evidence of the limitedability of financial ratios to detect fraudulent financialreporting.” A more recent study conducted by researchers atPricewaterhouse Coopers attained fraud detection rates of 64percent or lower (Bay et al. 2006). The limited performanceof these and other previous studies suggests that the financialmeasures and classification methods employed were insuffi-cient. Prior studies have generally relied on 8 to 10 financialratios, coupled with classifiers such as logistic regression orneural networks. In light of these deficiencies, more robustapproaches for detecting financial fraud are needed (Cecchiniet al. 2010).
Design science is a robust paradigm that provides concreteprescriptions for the development of IT artifacts, includingconstructs, models, methods, and instantiations (March andSmith 1995). In the design science paradigm, “Methodsdefine processes. They provide guidance on how to solveproblems, that is, how to search the solution space” (Hevneret al. 2004, p. 79). Several prior studies have utilized a designscience approach to develop BI technologies encompassingmethods and instantiations (Abbasi and Chen 2008a; Chunget al. 2005). Accordingly, we were motivated to develop aframework for enhanced financial fraud detection (i.e., amethod).
When creating IT artifacts in the absence of sufficient designguidelines, many studies have emphasized the need for designtheories to help govern the development process (Abbasi andChen 2008a; Markus et al. 2002; Storey et al. 2008; Walls etal. 1992). We used meta-learning as a kernel theory to guidethe development of the proposed financial fraud detectionframework (Brazdil et al. 2008). In the remainder of thissection, we present an overview of meta-learning and discuss
MIS Quarterly Vol. 36 No. 4/December 2012 1297

Abbasi et al./A Meta-Learning Framework for Detecting Financial Fraud
how meta-learning concepts can be utilized to address theaforementioned research gaps, resulting in enhanced financialfraud detection capabilities. Testable research hypotheses arealso presented. A framework based on meta-learning forfinancial fraud detection is then described and evaluated.
Meta-Learning
Meta-learning is a specialized form of machine learning thatuses the expertise acquired through machine learning or datamining processes to increase the quality of results obtained infuture applications (Brazdil et al. 2008). While machinelearning provides a multitude of algorithms to complete a taskwithout offering guidance about which particular algorithmsto use in a given context, in contrast, meta-learning providesa way to learn about the learning process itself to obtainknowledge about which underlying features and algorithmscan be most efficiently applied (Brazdil et al. 2008). We positthat a meta-learning approach is especially appropriate forfinancial fraud detection because of the complex, dynamic,and adversarial nature of this problem domain (Virdhagris-waran and Dakin 2006).
Meta-learning was developed in the late 1980s and early1990s by a number of researchers who sought to integrateseveral machine learning strategies to enhance overall accu-racy (e.g., Wolpert 1992). The term meta-learning wascoined by Chan and Stolfo (1993), who proposed a methodfor combining the outputs of multiple machine-learning tech-niques in a self-adaptive way to improve accuracy. Themethod has since evolved into several active streams ofresearch in a variety of application domains (Brazdil et al.2008; Vilalta and Drissi 2002). Collectively, meta-learningprovides an array of prescriptions for improving machinelearning capabilities pertaining to a particular problem task.
In machine learning, learning bias refers to any preference forchoosing one hypothesis that explains the data over otherequally acceptable hypotheses (Mitchell 1997). Meta-learning can be defined as the ability to learn from experiencewhen different biases are appropriate for a particular problem(Brazdil et al. 2008; Rendell et al. 1987). Meta-learning,therefore, differs from conventional or base-learning tech-niques in that it enriches the model hypothesis space, whichincreases the likelihood of finding good models. Yet, thespace itself is of fixed form: no dynamic selection of biastakes place. A critical need in the BI area is to devisemethods of bias selection that can adapt to changes that mayoccur in the problem domain (Vilalta and Drissi 2000).
At another level, two key facets of meta-learning are declara-tive and procedural bias (Brazdil et al. 2008). Declarative
bias specifies the representation of the space of hypotheses;it is governed by the quantity and type of attributesincorporated (i.e., the feature space). Procedural bias pertainsto the manner in which classifiers impose constraints on theordering of the inductive hypotheses.
An effective meta-learning strategy dynamically identifiesappropriate levels of declarative and procedural bias for agiven classification task (Vilalta and Drissi 2002). Declara-tive bias can be manipulated by altering the feature space (i.e.,via expansion or contraction), while procedural bias can beimproved by selecting a suitable predictive model orcombination of models (Giraud-Carrier et al. 2004; Vilaltaand Drissi 2002). In the remainder of this section, wedescribe how declarative bias can be improved by supple-menting existing measures based on annual statements withcontext-based features and quarterly data. We also discusshow procedural bias can be enhanced by using stackedgeneralization and adaptive learning.
Improving Declarative Bias by IncorporatingContext-Based Features and Quarterly Data
Prior financial fraud detection studies have typically utilizedfeature sets composed of fewer than 30 financial measures(with most using fewer than 10). Moreover, prior studieshave relied on measures derived exclusively from annualstatements. Consequently, the feature sets incorporatedlacked representational richness and were simply not largeenough to generate appropriate hypothesis spaces for theclassification methods utilized. Meta-learning approaches forexpanding the feature space in order to improve declarativebias include feature construction (i.e., the use of seed featuresto generate additional features) as well as the extraction ofnew and existing features from additional (parallel) data sets(Brazdil et al. 2008; Vilalta et al. 2004). Both of theseapproaches are discussed below.
Industry-Level and OrganizationalContext-Based Features
Financial fraud detection relies on identification of financialirregularities. Prior studies have used measures derived fromfirms’ financial statements ( Kaminski et al. 2004; Lin et al.2003; Summers and Sweeney 1998). While there is strongtheoretical evidence justifying the use of financial measures(Beneish 1999a; Dikmen and Küçükkocaoğlu 2010), themanner in which they have been utilized merely provides anon-holistic snapshot, without appropriate consideration ofthe context surrounding these measures. Two important types
1298 MIS Quarterly Vol. 36 No. 4/December 2012

Abbasi et al./A Meta-Learning Framework for Detecting Financial Fraud
of contextual information generally omitted by previousstudies are organizational and industry-level contexts.
Organizational context information can be derived by com-paring a firm’s financial performance relative to its perfor-mance in prior periods. Auditors commonly compare firms’financial measures across consecutive time periods in order toidentify potential irregularities (Ameen and Strawser 1994;Green and Choi 1997). Further, prior financial fraud detec-tion studies suggest that utilizing measures from the precedingyear can provide useful information (Cecchini et al. 2010;Fanning and Cogger 1998; Persons 1995; Virdhagriswaranand Dakin 2006). Consideration of data across multiple timeperiods can reveal organizational trends and anomalies thatare often more insightful than information derived fromsingle-period snapshots (Chen and Du 2009; Coderre 1999;Green and Calderon 1995; Kinney 1987).
Industry-level context information can be derived by com-paring a firm’s financial performance relative to the perfor-mance of its industry peers. Prior studies have found thatcertain industries have financial statement irregularity patternsthat are unique and distinctly different from other industries(Maletta and Wright 1996). Beasley et al. (2000) analyzedfinancial fraud cases arising in three industries over a two-decade period. They found that technology companies andfinancial-service firms differed considerably in terms of theirvalues for accounting measures as well as the categories offraud that were pervasive in the two industries. Thesefindings suggest that industry-level context information couldbe highly useful for automated financial fraud detection.
Despite the potential of industry-level context information toaid in fraud detection, thus far this information has not beenutilized in fraud detection research. Fanning and Cogger(1998) noted that industry-level context information repre-sented an important and unexplored future research direction:“Certain variables may become useful classifiers when ex-amined in a sample stratified by industry” (p. 37). Similarly,Spathis (2002, p. 218) claimed that “Industry standing prob-ably would provide additional valuable information.” In thisstudy we extend and exploit relevant contextual information.
The use of financial measures without appropriate contextualinformation results in parsimonious input feature spaces. Accordingly, we posit that feature sets utilizing yearly orquarterly financial measures in conjunction with organiza-tional and industry-level context information will result inimproved financial fraud detection performance in terms ofoverall accuracy and class-level f-measure, precision, andrecall.
H1a: Combining yearly financial measures with organi-zational context features will outperform the use ofyearly financial measures alone.
H1b: Combining yearly financial measures with industry-level context features will outperform the use ofyearly financial measures alone.
H1c: Combining yearly financial measures with industry-level and organizational context features willoutperform the use of yearly financial measuresalone.
H1d: Combining quarterly financial measures withorganizational context features will outperform theuse of quarterly financial measures alone.
H1e: Combining quarterly financial measures withindustry-level context features will outperform theuse of quarterly financial measures alone.
H1f: Combining quarterly financial measures withindustry-level and organizational context featureswill outperform the use of quarterly financialmeasures alone.
Quarterly Statement-Based Features
Most prior studies of financial fraud used only informationbased on annual statements (Yue et al. 2007). However,using both quarterly and annual data can provide a morerobust feature space for financial fraud detection (Albrecht,Albrecht, and Albrecht 2004). On the practice side, Putraprovided an extended argument for including an examinationof both quarterly and annual data in assessments of financialstatement fraud (Accounting Financial and Tax 2009). Thishas been affirmed by several recent research studies. Dechowet al. (2011) proposed an F-score designed to detect ac-counting fraud from misrepresentations made on quarterly orannual financial statements. Dull and Tegarden (2004) in-cluded quarterly financial data in their development of acontrol-chart approach to monitoring key financial processes.Chai et al. (2006) used quarterly financial statements as thebasis for developing rankings of the degree to which firmsmatch rules associated with financial fraud.
Albrecht, Albrecht, and Albrecht (2004) argued that annualnumbers are often too aggregated to reveal significant differ-ences, and that concealment methods differ dramaticallybetween the end of the first three quarters and the end of theyear-end quarter. In their analysis, one large company thatmanipulated its financial statements used unsupported topside
MIS Quarterly Vol. 36 No. 4/December 2012 1299

Abbasi et al./A Meta-Learning Framework for Detecting Financial Fraud
(a) Yearly (b) Quarterly
Figure 1. Yearly and Quarterly Cash Flow Earnings Differences (CFED) Ratios for the Enron Fraud
entries—entries that remove the discrepancy between actualoperating results and published financial reports—as themajor way to commit fraud at the end of the first three quar-ters, but harder-to-detect, sophisticated revenue and expensefrauds at the end of the year. Another company used topsideentries at the end of the first three quarters but shifted lossesand debt to unconsolidated, related entities at the end of theyear.
As a specific example, consider the cash flow earnings differ-ence ratio for the Enron fraud (Figure 1). Figure 1a showsthis ratio for Enron and its industry model, over a two-yearperiod, using only annual numbers. While Enron’s values areslightly lower than the industry model’s, the graph exhibits norecognizable pattern. Figure 1b shows this ratio for Enronand its industry model on a quarterly basis. Enron’s figuresare primarily positive for the first three quarters, and thensharply negative in the fourth quarter. Throughout the firstthree quarters, Enron’s management was using various ac-counting manipulations to make their income statement lookbetter (Albrecht, Albrecht, and Albrecht 2004; Kuhn andSutton 2006). At the end of the year, Enron’s management“corrected” the discrepancy by shifting those losses to off-balance sheet, nonconsolidated special purpose entities (nowcalled variable interest entities). This difference in manipula-tion methods between quarters is not apparent when analyzingannual data, but it shows up in the cash flow earnings differ-ence ratio when used with quarterly data.
The above evidence supports the argument that incorporatingdifferent levels of information granularity is important indetecting financial fraud. Accordingly, we believe that usingcontext-based features taken from both annual and quarterlystatements will improve financial fraud detection performanceover using features from either category alone.
H2a: Combining yearly and quarterly statement-basedfeatures will outperform the use of only yearlyfeatures in terms of fraud detection performance.
H2b: Combining yearly and quarterly statement-basedfeatures will outperform the use of only quarterlyfeatures in terms of fraud detection performance.
Improving Procedural Bias Using StackedGeneralization and Adaptive Learning
Prior financial fraud detection studies have used several dif-ferent classification methods, with logistic regression, neuralnetworks, and discriminant analysis being the most common.However, no single classifier has emerged as a state-of-the-arttechnique for detecting financial fraud (Fanning and Cogger1998; Gaganis 2009; Kirkos et al. 2007). Therefore, the needremains for enhanced classification approaches capable ofimproving procedural bias. Meta-learning strategies forenhancing procedural bias include stacked generalization andadaptive learning (Brazdil et al. 2008). Stacked generaliza-tion involves the use of a top-level learner capable ofeffectively combining information from multiple base learners(Vilalta and Drissi 2002; Wolpert 1992). Adaptive learningentails constant relearning and adaptation (i.e., dynamic biasselection) to changes in the problem environment, includingconcept drift (Brazdil et al. 2008).
Stacked Generalization
Classifiers are often diverse with respect to their categori-zation performance, patterns, and biases (Kuncheva andWhitaker 2003; Lynam and Cormack 2006). In addition,
1300 MIS Quarterly Vol. 36 No. 4/December 2012

Abbasi et al./A Meta-Learning Framework for Detecting Financial Fraud
classifiers frequently provide complementary information thatcould be useful if exploited in unison (Tsoumakas et al.2005). Prior financial fraud detection studies utilizingmultiple classification methods have also observed somelevels of noncorrelation between the classifiers’ predictions,even when overall accuracies were equivalent. For instance,Fanning and Cogger (1998) attained the best overall accuracyusing a neural network, yet the fraud detection rates were con-siderably higher (i.e., 12 percent) when using discriminantanalysis. While comparing logistic regression and neuralnetwork classifiers, Lin et al. (2003) noted that the two classi-fiers achieved somewhat comparable overall accuracies;however, logistic regression had 11 percent better perfor-mance on non-fraudulent firms, while the neural networkobtained 30 percent higher fraud detection rates. Similarly,Gaganis (2009) observed equally good overall results using aUTADIS scoring method and a neural network; however, therespective false positive and false negative rates for the twomethods were exact transpositions of one another. Thesefindings suggest that methods capable of conjunctively lever-aging the strengths of divergent classifiers could yieldimproved financial fraud detection performance.
Stacked generalization (also referred to as stacking) providesa mechanism for harnessing the collective discriminatorypower of an ensemble of heterogeneous classificationmethods (Wolpert 1992). Stacking involves the use of a top-level classification model capable of learning from thepredictions (and classification biases) of base-level models inorder to achieve greater classification power (Brazdil et al.2008; Hansen and Nelson 2002; Ting and Witten 1997;Wolpert 1992). As Sigletos et al. (2005, p. 1751) noted, “Thesuccess of stacking arises from its ability to exploit thediversity in the predictions of base-level classifiers and thuspredicting with higher accuracy at the meta-level.” Thisability to learn from underlying classifiers makes stackingmore effective than individual classifier-based approaches oralternate fusion strategies that typically combine base-levelclassifications using a simple scoring or voting scheme(Abbasi and Chen 2009; Dzeroski et al. 2004; Hu andTsoukalas 2003; Lynam and Cormack 2006; Sigletos et al.2005). Consequently, stacking has been effectively utilizedin related studies on insurance and credit card fraud detection,outperforming the use of individual classifiers (Chan et al.1999; Phua et al. 2004).
Given the performance diversity associated with fraud detec-tion classifiers employed in prior research, the use of stackedgeneralization is expected to be highly beneficial, facilitatingenhanced financial fraud detection capabilities over thoseachieved by individual classifiers. We predict this perfor-mance gain will be actualized irrespective of the specificcontext-based feature set utilized.
H3a: When yearly context-based features are used, stackclassifiers will outperform individual classifiers interms of fraud detection performance.
H3b: When quarterly context-based features are used,stack classifiers will outperform individualclassifiers in terms of fraud detection performance.
Adaptive Learning
While fraud lies behind many of the largest bankruptcies inhistory, there are considerable differences between the typesof frauds committed and the specific obfuscation tacticsemployed by previous firms. For instance, the $104 billionWorldCom fraud utilized a fairly straightforward expensecapitalization scheme (Zekany et al. 2004). In contrast, the$65 billion Enron fraud was highly complex and quite unique;the use of special-purpose entities as well as various othertactics made detection very difficult (Kuhn and Sutton 2006).These examples illustrate how financial fraud cases can bestrikingly different in terms of their complexity and nature. Effective financial fraud detection requires methods capableof discovering fraud across a wide variety of industries,reporting styles, and fraud types over time.
Fraud detection is a complex, dynamic, and evolving problem(Abbasi et al. 2010; Bolton and Hand 2002). Given theadversarial nature of fraud detection, the classification mech-anisms used need constant revision (Abbasi et al. 2010).Adaptive learning methods have the benefit of being able torelearn, in either a supervised or semi-supervised capacity, asnew examples become available (Brazdil et al. 2008; Fawcettand Provost 1997). The ability to adaptively learn is espe-cially useful in the context of financial fraud because the riskenvironment surrounding fraud is expected to change, makingit more difficult to detect (Deloitte 2010). Virdhagriswaranand Dakin (2006, p. 947) noted that adaptive learning couldgreatly improve fraud detection capabilities by “identifyingcompensatory behavior” by fraudsters “trying to camouflagetheir activities.” Similarly, Fawcett and Provost (1997, p. 5)observed that “it is important that a fraud detection systemadapt easily to new conditions. It should be able to noticenew patterns of fraud.” An adaptive, learning-based classifierthat is aware of its changing environment and able to con-stantly retrain itself accordingly, should outperform its staticcounterpart.
H4: The use of an adaptive learning mechanism, capable ofrelearning as new information becomes available, willoutperform its static counterpart in terms of frauddetection performance.
MIS Quarterly Vol. 36 No. 4/December 2012 1301

Abbasi et al./A Meta-Learning Framework for Detecting Financial Fraud
Collective Impact Attributable to ImprovingDeclarative and Procedural Bias
Based on the previous four hypotheses, we surmise that finan-cial fraud detection methods incorporating meta-learningprinciples pertaining to the improvement of declarative andprocedural bias are likely to provide enhanced discriminatorypotential (Brazdil et al. 2008). Specifically, we expect thatthe use of industry and organizational context informationderived from both yearly and quarterly statements for declara-tive bias improvement (H1–H2), coupled with stackedgeneralization and adaptive learning for procedural biasimprovement (H3–H4), will facilitate improvements in overallfinancial fraud detection capabilities. Accordingly, wehypothesized that, collectively, a meta-learning frameworkthat incorporates these principles will outperform existingstate-of-the art financial fraud detection methods.
H5: A meta-learning framework that includes appropriateprovisions for improving declarative and procedural biasin concert will outperform existing methods in terms offraud detection performance.
Prior studies have effectively used ensemble approaches inconcert with semi-supervised learning (Balcan et al. 2005;Ando and Zhang 2007; Zhou and Goldman 2004). Forinstance, Zhou and Li (2005) markedly improved the per-formance of underlying classifiers on several test beds, invarious application domains, by using a three-classifierensemble in a semi-supervised manner. It is, therefore, con-ceivable that such ensemble-based semi-supervised methodscould also facilitate improved procedural bias for financialfraud detection. However, given the reliance of such methodson voting schemes across base classifiers (Balcan et al. 2005;Zhou and Li 2005), we believe that ensemble semi-supervisedlearning methods will underperform meta-learning strategiesthat harness the discriminatory potential of stacked generali-zation and adaptive learning. H6: A meta-learning framework that includes stacked gener-
alization and adaptive learning will provide improvedprocedural bias over existing ensemble-based semi-supervised learning methods, resulting in enhancedfinancial fraud detection performance.
A Meta-Learning Framework forFinancial Fraud Detection
We propose a meta-learning framework for detecting financialfraud to address the research gaps and related hypotheses
presented in the previous section, namely (1) the use oforganizational and industry contextual information, (2) theuse of quarterly and annual data, and the use of more robustclassification methods using (3) stacked generalization and(4) adaptive learning. In this section, we demonstrate howour meta-learning framework fulfills each of these require-ments to enhance financial fraud detection.
The MetaFraud framework utilizes a rich feature set,numerous classification methods at the base and stack level,and an adaptive learning algorithm. Each component of theframework (shown in Figure 2) is intended to enhancefinancial fraud detection capabilities. Beginning with a set ofyearly and quarterly seed ratios, industry-level and organi-zational context-based features are derived to create the yearlyand quarterly feature sets (bottom of Figure 2). These featuresets are intended to improve declarative bias. The features areused as inputs for the yearly and quarterly context-basedclassifiers. The classifications from these two categories ofclassifiers are then used as input for a series of stack classi-fiers. The adaptive, semi-supervised learning algorithm,shown at the top of Figure 2, uses the stack classifiers’predictions to iteratively improve classification performance. The stack classifiers and adaptive learning algorithm areintended to improve procedural bias.
As a simple example, think of Stack_Classifier1 as an SVM,which takes input from bottom (1) yearly context-basedclassifiers and (2) quarterly context-based classifiers; such asSVM, J48, BayesNet, NaiveBayes etc. Stack_Classifier2might be a J48 classifier, which accepts inputs from the samebottom yearly and quarterly context-based classifiers: SVM,J48, BayesNet, NaiveBayes etc. Output from the stack classi-fiers is aggregated and input to the adaptive learner. The fourcomponents of the framework are closely related to theresearch hypotheses. Each of these components is explainedbelow.
Financial Fraud Detection Feature Sets
The framework uses two feature sets based on yearly andquarterly information, respectively. The yearly feature setuses 12 seed financial ratios derived from annual statementsto generate additional organizational and industry-level con-text features. The quarterly feature set uses the quarterlyversions of the same 12 ratios, resulting in 48 seed measures,to generate additional quarterly organizational and industry-level context features. In the ensuing sections, we describethe financial ratios utilized followed by a discussion of theyearly and quarterly feature sets.
1302 MIS Quarterly Vol. 36 No. 4/December 2012

Abbasi et al./A Meta-Learning Framework for Detecting Financial Fraud
Figure 2. The MetaFraud Framework
Financial Ratios
Our selection of the seed financial ratios was influenced byprior financial fraud detection studies. These 12 ratios aredescribed below.
1. Asset Quality Index (AQI): AQI is the ratio of non-current assets other than property, plant, and equipment,to total assets, for time period t relative to time period t-1. An AQI greater than 1 indicates that the firm haspotentially increased its involvement in cost deferral, apossible indicator of asset overstatement fraud (Beneish1999a; Dikman and Küçükkocaoğlu 2010).
2. Asset Turnover (AT): AT is the ratio of net sales to totalassets. When revenue fraud is being committed, net salesare often increased artificially and rapidly, resulting in alarge AT value (Cecchini et al. 2010; Kirkos et al. 2007;Spathis 2002; Spathis et al. 2002).
3. Cash Flow Earnings Difference (CFED): CFEDassesses the impact of accruals on financial statements(Beneish 1999a; Dechow et al. 2011). This ratio is oftenpositive when revenue fraud is occurring or whenemployees are engaging in cash theft.
4. Days Sales in Receivables (DSIR): DSIR is the ratio ofday sales in receivables in period t to the correspondingmeasure in period t-1. Firms engaging in revenue fraudoften add fictitious receivables, causing DSIR to increase(Green and Choi 1997; Kaminski 2004; Lin 2003).
5. Depreciation Index (DEPI): DEPI is the ratio of the rateof depreciation in period t-1 as compared to period t.Fictitious assets accelerate the depreciation rate, resultingin smaller values for DEPI (Beneish 1999a; Cecchini etal. 2010; Dikman and Küçükkocaoğlu 2010).
6. Gross Margin Index (GMI): GMI is the ratio of the grossmargin in period t-1 to the gross margin in period t. AGMI greater than 1 suggests that gross margins havedeteriorated, a condition rarely encountered when a firmis engaging in revenue fraud (Beneish 1999a; Lin 2003).
7. Inventory Growth (IG): IG assesses whether inventoryhas grown in period t as compared to period t-1. IG isused to detect whether ending inventory is being over-stated to decrease cost of goods sold and increase grossmargin (Cecchini et al. 2010; Dikman, and Küçük-kocaoğlu 2010; Persons 1995).
MIS Quarterly Vol. 36 No. 4/December 2012 1303

Abbasi et al./A Meta-Learning Framework for Detecting Financial Fraud
8. Leverage (LEV): LEV is the ratio of total debt tototal assets in period t relative to period t-1. LEV isused to detect whether firms are fictitiouslyincluding assets on the balance sheet without anycorresponding debt (Cecchini et al. 2010; Beneish1999a; Kirkos, et al 2007; Persons 1995; Spathis2002; Spathis et al. 2002).
9. Operating Performance Margin (OPM): OPM iscalculated by dividing net income by net sales. When fraudulent firms add fictitious sales revenues,they often fall to the bottom line without additionalcosts, thus inflating the value of OPM (Cecchini etal. 2010; Persons 1995; Spathis 2002; Spathis et al.2002).
10. Receivables Growth (RG): RG is the amount ofreceivables in period t divided by the amount inperiod t-1. Firms engaging in revenue fraud oftenadd fictitious revenues and receivables, therebyincreasing RG (Cecchini et al. 2010; Dechow et al.2011; Summers and Sweeney 1998).
11. Sales Growth (SG): SG is equal to net sales inperiod t divided by net sales in period t-1. In thepresence of revenue fraud, the value of SG generallyincreases (Beneish 1999a; Cecchini et al. 2010;Gaganis 2009; Dikman and Küçükkocaoğlu 2010;Persons 1995; Summers and Sweeney 1998).
12. SGE Expense (SGEE): SGEE is calculated bydividing the ratio of selling and general administra-tive expenses to net sales in period t by the sameratio in period t-1. When firms are engaging inrevenue fraud, SGE expenses represent a smallerpercentage of the artificially inflated net sales, there-by causing SGEE to decrease (Beneish 1999a;Cecchini et al. 2010; Dikman and Küçükkocaoğlu2010).
Yearly and Quarterly Context-Based Feature Sets
The yearly and quarterly context-based feature sets used theaforementioned seed ratios to derive industry-level andorganizational context features. The context features weredeveloped using feature construction: the process of applyingconstructive operators to a set of existing features in order togenerate new features (Matheus and Rendell 1989). Featureconstruction facilitates the fusion of data and domain knowl-edge to construct features with enhanced discriminatorypotential (Dybowski et al. 2003). In meta-learning, featureconstruction is recommended as a mechanism for improving
declarative bias in situations where the hypothesized setgenerated by a particular feature set needs to be expanded(Brazdil et al. 2008). In prior BI studies, feature constructionwas used to derive complex and intuitive financial ratios andmetrics from (simpler) seed accounting variables (Piramuthuet al. 1998; Zhao et al. 2009). These new features were oftengenerated by combining multiple seed measures using arith-metic operators such as multiplication and division (Langleyet al. 1986; Zhao et al. 2009).
We used subtraction and division operators to construct newfeatures indicative of a firm’s position relative to its own priorperformance (organizational context) or its industry (industry-level context). First, the organizational context features wereconstructed by computing the difference between (–) and theratio of (/) the firms’ seed financial ratios (described in theprevious section) in the current time period relative to theirvalues for the same ratios in the previous time period.
Second, to generate the industry-level context features, wedeveloped industry-representative models designed to charac-terize what is normal for each industry. Each firm’s industryaffiliation was defined by its North American IndustryClassification System (NAICS) code. NAICS was used sinceit is now the primary way Compustat and other standardsbodies reference industries. Two types of models were devel-oped. Top-5 models were created by averaging the data fromthe five largest companies in each industry-year (in terms ofsales), and then generating the 12 seed financial ratios fromthese averaged values. Hence, each industry had a singlecorresponding top-5 model. Closest-5 models were createdfor each firm by averaging the data from the five companiesfrom the same industry-year that were most similar in termsof sales. Hence, each firm had a corresponding closest-5model. The intuition behind using these two types of modelswas that the top-5 models represent the industry memberswith the greatest market share (and therefore provide a singlereference model for all firms in the industry), while closest-5models represent the firms’ industry peers. As revealed in theevaluation section, both types of models had a positive impacton fraud detection performance.
For a given model, total assets were calculated as the averageof total assets of the five companies, while the accountsreceivable was the average accounts receivable of the samecompanies. Multiple firms were used to construct each modelin order to smooth out any non-industry-related fluctuationsattributable to individual firms (Albrecht, Albrecht, and Dunn2001). On the other extreme, using too many firms producedmodels that were too aggregated. Therefore, in our prelimi-nary analysis, we explored the use of different numbers offirms and found that using five provided the best balance.The industry-level context features were then constructed bycomputing the difference between (–) and the ratio of (/) the
1304 MIS Quarterly Vol. 36 No. 4/December 2012

Abbasi et al./A Meta-Learning Framework for Detecting Financial Fraud
Table 3. Yearly Context-Based Feature Set
Type Description Quantity
Yearly financial ratios R1, R2,…R12 12
Industry-level context: Top-5 ModelR1-T1, R2-T2,…R12-T12 12
R1/T1, R2/T2,…R12/T12 12
Industry-level context: Closest-5 ModelR1-C1, R2-C2,…R12-C12 12
R1/C1, R2/C2,…R12/C12 12
Organizational contextR1-P1, R2-P2,…R12-P12 12
R1/P1, R2/P2,…R12/P12 12
Total 84
Table 4. Quarterly Context-Based Feature Set
Type Description Quantity
Quarterly financial ratios R1Q1, R2Q1,…R12Q4 48
Industry-level context: Top-5 ModelR1Q1-T1Q1, R2Q1-T2Q1,…R12Q4-T12Q4 48
R1Q1/T1Q1, R2Q1/T2Q1,…R12Q4/T12Q4 48
Industry-level context: Closest-5Model
R1Q1-C1Q1, R2Q1-C2Q1,…R12Q4-C12Q4 48
R1Q1/C1Q1, R2Q1/C2Q1,…R12Q4/C12Q4 48
Organizational context R1Q2-R1Q1, R1Q3-R1Q2,…R12Q4-R12Q3 48
R1Q2/R1Q1, R1Q3/R1Q2,…R12Q4/R12Q3 48
Total 336
firms’ seed financial ratios and those of their respective top-5and closest-5 industry models.
Table 3 shows the yearly context-based feature set. For eachfirm, we used the 12 seed year-level ratios (R1–R12) as wellas 48 industry-level context features derived using the firms’corresponding top-5 (T1–T12) and closest-5 (C1–C12)industry models. For instance, the industry-level contextfeature R1-C1 signifies the difference between a firm’s AssetQuality Index and that of its closest-5 industry model. Anadditional 24 organizational context features were constructedusing the firms’ ratios from the previous year (P1–P12). Thisresulted in a feature set composed of 84 attributes.
Table 4 shows the quarterly context-based feature set. Eachof the 12 seed financial ratios was derived from all fourquarterly statements, resulting in 48 core features (R1Q1–R12Q4). These were used to generate 96 top-5 model-basedindustry-level context features (e.g., R1Q1–T1Q1 andR1Q1/T1Q1), and 96 closest-5 model-based features (e.g.,R1Q1–C1Q1 and R1Q1/C1Q1). Furthermore, 96 organiza-tional context features were constructed by comparing the
firms’ ratios in a particular quarter against those from the pre-vious quarter (e.g., R1Q2/R1Q1 denotes the ratio of a firm’sAsset Quality Index in quarter 2 as compared to quarter 1). This resulted in a quarterly feature set composed of 336attributes.
Yearly and Quarterly Context-Based Classifiers
The yearly and quarterly context-based feature sets werecoupled with an array of supervised learning classificationmethods. Prior studies have mostly used logistic regressionand neural network classifiers (Fanning and Cogger 1998;Green and Choi 1997; Lin et al. 2003; Persons 1995; Spathis2002). However, additional classification methods have alsoattained good results for financial fraud detection (e.g., Kirkoset al. 2007), as well as related fraud detection problems (e.g.,Abbasi and Chen 2008b; Abbasi et al. 2010), includingsupport vector machines, tree classifiers, and Bayesianmethods. Given the lack of consensus on best methods, asdescribed earlier, a large number of classifiers were used inorder to improve overall fraud detection performance. More-
MIS Quarterly Vol. 36 No. 4/December 2012 1305

Abbasi et al./A Meta-Learning Framework for Detecting Financial Fraud
over, the use of a large set of classifiers also provided a highlyuseful confidence-level measure, which is described in theevaluation section.
Accordingly, we incorporated several classifiers in additionto logistic regression and neural networks. Three supportvector machines (SVM) classifiers were utilized: linear,polynomial, and radial basis function (RBF) kernels (Vapnik1999). Two Bayesian classifiers were used: Naïve Bayes andBayesian Networks (Bayes 1958). Various tree-based classi-fiers were employed, including the J48 decision tree, NaïveBayes Tree (NBTree), ADTree, Random Forest, and REPTree(Breiman 2001; Freund and Mason 1999; Kohavi 1996;Quinlan 1986). Two rule-based classifiers were alsoincluded: nearest neighbor (NNge) and JRip (Cohen 1995;Martin 1995). These 14 classifiers were each run using theyearly and quarterly feature sets, resulting in 28 classifiers intotal: 14 yearly context-based classifiers and 14 quarterlycontext-based classifiers.
Stacked Generalization
In the third component of the framework, we utilized stackedgeneralization to improve procedural bias, where the classi-fications from the underlying individual classifiers were usedas input features for a top-level classifier (Brazdil et al. 2008;Hansen and Nelson 2002; Hu and Tsoukalas 2003). All 14classifiers described in the previous section were run as top-level classifiers, resulting in 14 different stack arrangements. Stacking can be highly effective when incorporating largequantities of predictions from underlying classifiers as inputfeatures (Lynam and Cormack 2006). Accordingly, for eachstack, we utilized all 28 individual classifiers as inputs for thetop-level classifier: 14 yearly context-based classifiers and 14quarterly context-based classifiers.
The testing data for the top-level classifiers was composed ofthe individual (i.e., bottom-level) classifiers’ classifications onthe testing instances. The training data for the top-levelclassifiers was generated by running the bottom-level classi-fiers using 10-fold cross-validation on the training instances(Dzeroski and Zenko 2004; Ting and Witten 1997). In otherwords, the training data was split into 10 segments. In eachfold, a different segment was used for testing, while theremaining 9 segments were used to train the bottom-levelclassifiers. The bottom-level classifiers’ classifications fromthe test instances associated with these 10 secondary foldscollectively constituted the top-level classifiers’ training data.This approach was necessary to ensure that feature values inthe training and testing instances of the stack classifiers wereconsistent and comparable (Abbasi and Chen 2009; Wittenand Frank 2005).
Adaptive Learning
The ability of adaptive learning approaches to dynamicallyimprove procedural bias are a distinct advantage of meta-learning (Brazdil et al. 2008), particularly for complex andevolving problems such as fraud detection (Fawcett andProvost 1997). We propose an adaptive semi-supervisedlearning (ASL) algorithm that uses the underlying generalizedstacks. ASL is designed to exploit the information providedby the stack classifiers in a dynamic manner; classificationsare revised and improved as new information becomesavailable. When semi-supervised learning is used, a criticalproblem arises when misclassified instances are added to thetraining data (Tian et al. 2007). This is a major concern in thecontext of financial fraud detection, where models need to beupdated across years (i.e., semi-supervised active learning),since classification models can incorporate incorrect rules andassumptions, resulting in amplified error rates over time. ASL addresses this issue in two ways. First, the expansionprocess is governed by the stack classifiers’ predictions. Onlytest instances that have strong prediction agreement across thetop-level classifiers in the generalized stacks are added to thetraining data. Second, during each iteration, the training dataset is reset and all testing instances are reclassified in order toprovide error correction.
A high-level description of ASL’s steps is as follows:
1. Train the bottom-level classifiers and run them on theentire test bed.
2. Train the top-level classifiers in the generalized stack,using the training and testing data generated by thebottom-level classifiers.
3. Reset the training data to include only the originaltraining instances.
4. Rank the test instances based on the top-level classifiers’predictions.
5. If the stopping rule has not been satisfied, add the d testinstances with the highest rank to the training data (withclass labels congruent with the top-level classifiers’predictions) and increment d. Otherwise go to step 7.
6. If d is less than the number of instances in the test bed,repeat steps 1–5, using the expanded training data forsteps 1 and 2.
7. Output the predictions from the top-level classifiers inthe generalized stacks.
1306 MIS Quarterly Vol. 36 No. 4/December 2012

Abbasi et al./A Meta-Learning Framework for Detecting Financial Fraud
Given training examples T = [t1, t2, …, tn], training class labels L = [ll1, l2, …, ln], and testing instances R = [r1, r2, …, rm]Let c denote the number of classification algorithms utilized (in this study, c = 14)Initialize variable d to track number of items from R to add to T, where p is a predefined constant and d = pWhile d < m
Derive yearly classifiers’ test prediction matrix Y = [y1 = Yearly1(T, L, R), …, yc = Yearlyc(T, L, R)] and training data cross-validation prediction matrix W = [w1 = Yearly1(T, L), …, wc = Yearlyc(T, L)]
Derive quarterly classifiers’ test prediction matrix QW = [q1 = Quarterly(T, L, R), …, qc = Quarterlyc(T, L, R)] and training datacross-validation prediction matrix V = [v1 = Quarterly1(T, L), …, vc = Quarterlyc(T, L)]
Derive top-level stack classifiers’ prediction matrix S = [s1 = Stack1([W, V], L, [Y, Q]), …, sc = Stackc([W, V], L, [Y, Q])]Reset training data to original set of instances T = [t1, t2, …, tn], training class labels L = [l1, l2, …, ln]
Compute test instance prediction scores P p s p sc m cmi
c
i
c
= = =
==1 1
11
,...,
Compute test instance weights X = [x1, …, xm] where xif p c
otherwisei i=
=
1
0
,
,
If x dii
m
≥=
1
Compute descending order rank of values in X:J = [j1 = arg max(a0 = X), j2 = arg max(a1 = a0(1:j1 – 1, j1 + 1:m)), …, jm = arg max(am–1)]Set the d test instances with the highest rank V = [v1 = j1, …,vd = jd]
Determine the instances’ class labels Z = [z1, …, zd] where zif p
otherwisei
vi=>
1 0
0
,
,
Add selected test instances to training data T = [t1, t2, …, tn, V], l = [l1, l2, …, ln, Z]Increment selection quantity variable d = d + p
ElseExit Loop
End IfLoopOutput S
Figure 3. Adaptive Semi-Supervised Learning Algorithm
During each iteration, the training set is used to train (and run)the bottom-level classifiers on the entire test bed. The top-level classifiers are then run using the training and testinginstance feature values generated by the bottom-level classi-fiers. The testing instances are ranked based on the top-levelclassifiers’ predictions, where instances with greater predic-tion agreement across the classifiers are given a higher rank.The selected instances are added to the original training data,where the number of instances added is proportional to theiteration number (i.e., an increasing number of test instancesare added during each subsequent iteration). Test instancesare added with the predicted class label (as opposed to theactual label), since we must assume that the actual labels ofthe test instances are unknown (Chapelle et al. 2006). Theinstances added in one iteration are not carried over to thenext one. The steps are repeated until all testing instances areadded during an iteration or the stopping rule has beenreached.
Figure 3 shows the detailed mathematical formulation of theASL algorithm. In each iteration, the yearly and quarterlycontext-based classifiers are run with the training data T andclass labels Y. These yearly and quarterly classifiers are eachrun in two ways. First, they are trained on T and run on thetesting data R to generate the two m × c test data predictionmatrices Y and Q. Next, they are run on T using 10-fold crossvalidation in order to generate the two n × c training datamatrices (W and V) for the generalized stacks’ top-levelclassifiers (as described earlier). The predictions from thetop-level classifiers are used to construct the stack predictionmatrix S. Once the stack predictions have been made, thetraining set is reset to its original instances in order to allowerror correction in subsequent iterations in the event that anerroneous classification has been added to the training set.Next, the top-level classifiers’ predictions for each instanceare aggregated across classifiers (in P), and only thoseinstances with unanimous agreement (i.e., ones deemed
MIS Quarterly Vol. 36 No. 4/December 2012 1307

Abbasi et al./A Meta-Learning Framework for Detecting Financial Fraud
legitimate or fraudulent by all top-level classifiers) are givena weight of 1 in X. If the number of instances in X with avalue of 1 is greater than or equal to the selection quantityvariable d, we add d of these test instances to our training setT with class labels that correspond to the top-level classifiers’predictions (Z). We then increment d so that a larger numberof instances will be added in the following iteration. If thereare insufficient unanimous agreement instances in X, we donot continue since adding ones where the top-level classifiersdisagree increases the likelihood of inserting misclassifiedinstances into the training set. Otherwise, the process isrepeated until all testing instances have been added to thetraining set (i.e., d > m).
Evaluation
Consistent with Hevner et al. (2004), we rigorously evaluatedour design artifact. We conducted a series of experiments toassess the effectiveness of our proposed financial frauddetection framework; each assessed the utility of a differentfacet of the framework. Experiment 1 evaluated the proposedyearly and quarterly context-based feature sets in comparisonwith a baseline features set composed of annual statement-based financial ratios (H1). Experiment 2 assessed the effec-tiveness of using stacked classifiers. We tested the efficacyof combining yearly and quarterly information over usingeither information level alone (H2) and also compared stackedclassifiers against individual classifiers (H3). Experiment 3evaluated the performance of adaptive learning versus a staticlearning model (H4). Experiments 4 and 5 assessed theoverall efficacy of the proposed meta-learning framework incomparison with state-of-the-art financial fraud detectionmethods (H5) and existing ensemble semi-supervised learningtechniques (H6).
We tested the hypotheses using a test bed derived frompublicly available annual and quarterly financial statements.The test bed encompassed 9,006 instances (815 fraudulentand 8,191 legitimate), where each instance was composed ofthe information for a given firm, for a particular year. Hence,for each instance in the test bed, the 12 financial ratios(described earlier in the section “Financial Fraud DetectionFeature Sets”) were derived from the annual and quarterlyfinancial statements for that year.
The data collection approach undertaken was consistent withthe approaches employed in previous studies (e.g., Cecchiniet al. 2010; Dechow et al. 2011). The fraudulent instanceswere identified by analyzing all of the SEC Accounting andAuditing Enforcement Releases (AAERs) posted between
1995 and 2010. Based on these AAERs, fraudulent instancesfor the fiscal years ranging from 1985 to 2008 were identified. The information gathered from the AAERs was verified withother public sources (e.g., business newspapers) to ensure thatthe instances identified represented bona fide financial state-ment fraud cases. Consistent with prior research, firms com-mitting fraud over a two-year period were treated as twoseparate instances (Cecchini et al. 2010; Dikmen andKüçükkocaoğlu 2010; Persons 1995). Thus, the 815 fraudu-lent instances were associated with 307 distinct firms.
The legitimate instances encompassed all firms from the sameindustry-year as each of the fraud instances (Beneish 1999a;Cecchini et al. 2010). After removing all non-fraud firm-yearinstances in which amendments/restatements had been filedas well as ones with missing statements (Cecchini et al. 2010),8,191 legitimate instances resulted. As noted by prior studies,although the legitimate instances included did not appear inany AAERs or public sources, there is no way to guaranteethat none of them have engaged in financial fraud (Bay et al.2006; Dechow et al. 2011; Kirkos et al. 2007).
Consistent with prior work (Cecchini et al. 2010), the test bedwas split into training and testing data based on chronologicalorder (i.e., firm instance years). All instances prior to 2000were used for training, while data from 2000 onward wasused for testing. The training data was composed of 3,862firm-year instances (406 fraudulent and 3,456 legitimate),while the testing data included 5,144 firm-year instances (409fraudulent and 4,735 legitimate). All 14 classifiers describedin the section “Yearly and Quarterly Context-Based Classi-fications” were employed. For all experiments, the classifierswere trained on the training data and evaluated on the 5,144-instance test set.
For financial fraud detection, the error costs associated withfalse negatives (failing to detect a fraud) and false positives(considering a legitimate firm fraudulent) are asymmetric.Moreover, these costs also vary for different stakeholdergroups. For investors, prior research has noted that investingin a fraudulent firm results in losses attributable to decreasesin stock value when the fraud is discovered, while failing toinvest in a legitimate firm comes with an opportunity cost(Beneish 1999a). Analysis has revealed that the median dropin stock value attributable to financial fraud is approximately20 percent, while the average legitimate firm’s stock appre-ciates at a rate of 1 percent, resulting in an investor cost ratioof 1:20 (Beneish 1999a, 1999b; Cox and Weirich 2002).From the regulator perspective, failing to detect fraud canresult in significant financial losses (Albrecht, Albrecht, andDunn 2001; Dechow et al. 2011). On the other hand, falsepositives come with unnecessary audit costs. According to
1308 MIS Quarterly Vol. 36 No. 4/December 2012

Abbasi et al./A Meta-Learning Framework for Detecting Financial Fraud
the Association of Certified Fraud Examiners (2010), themedian loss attributable to undetected financial statementfraud is $4.1 million (i.e., cost of false negatives), while themedian audit cost (i.e., cost of false positives) is $443,000(Charles et al. 2010). For regulators, this results in anapproximate cost ratio of 1:10. Accordingly, in this study weused cost ratios of 1:20 and 1:10 to reflect the respectivesituations encountered by investors and regulators.
It is important to note that, consistent with prior work, weonly consider error costs (Beneish 1999a; Cecchini et al.2010). In the case of the regulator setting, the cost breakdownis as follows:
• True Negatives: Legitimate firms classified as legitimate(no error cost)
• True Positives: Fraudulent firms classified as fraudulent(no error cost since the audit was warranted)
• False Negatives: Fraudulent firms classified as legiti-mate (fraud-related costs of $4.1 million)
• False Positives: Legitimate firms classified as fraudulent(unnecessary audit costs of $443,000)
Due to space constraints, in the following three subsectionswe only reported performance results for the investor situa-tion, using a cost ratio of 1:20. Appendices A, B, and C con-tain results for the regulator situation (i.e., using a cost settingof 1:10). However, in the final two subsections, when com-paring MetaFraud against other methods, results for bothstakeholder groups’ cost settings are reported. The evaluationmetrics employed included legitimate and fraud recall for thetwo aforementioned cost settings (Abbasi et al. 2010;Cecchini et al. 2010). Furthermore, area under the curve(AUC) was used in order to provide an overall effectivenessmeasure for methods across cost settings. Receiver operatingcharacteristic (ROC) curves were generated by varying thefalse negative cost between 1 and 100 in increments of 0.1,while holding the false positive cost constant at 1 (e.g., 1:1,1:1.1, 1:1.2, etc.), resulting in 991 different cost settings. Foreach method, AUC was derived from these ROC curves.Moreover, all hypothesis testing results in the paper alsoincorporated multiple cost settings (including the investor andregulator settings).
Comparing Context-Based Classifiersagainst Baseline Classifiers
Most prior studies have utilized 8 to 10 financial ratios devoidof organizational or industry-level context information (e.g.,Beneish 1999a; Dikmen and Küçükkocaoğlu 2010; Lin et al.2003; Persons 1995; Spathis 2002). Accordingly, we eval-
uated the effectiveness of the yearly and quarterly context-based feature sets (described earlier and in Tables 3 and 4) incomparison with a baseline feature set composed of the 12ratios described earlier. For the baseline, these 12 ratios werederived from the annual statements, as done in prior research(Kaminski et al. 2004; Kirkos et al. 2007; Summers andSweeney 1998). The three feature sets were run using all 14classifiers described in the previous section.
Table 5 shows the results for the baseline classifiers. Tables6 and 7 show the results for the yearly and quarterly context-based classifiers (i.e., the 14 classifiers coupled with the 84and 336 yearly and quarterly context-based features, respec-tively). Due to space limitations, we report only the overallAUC and legitimate/fraud recall (shaded columns) andlegitimate/fraud precision when using the 1:20 investor costsetting (Cecchini et al. 2010). Results for the regulator costsetting can be found in Appendix A.
For all three feature sets, the best AUC results were attainedusing NBTree and Logit. These methods also provided thebest balance between legitimate/fraud recall rates for theinvestor cost setting. In comparison with the baseline classi-fiers, the yearly and quarterly context-based classifiers hadhigher overall AUC values, with an average improvement ofover 10 percent. For the quarterly and yearly context-basedclassifiers, the most pronounced gains were attained in termsof fraud recall (17 percent and 23 percent higher on average,respectively). The results for the various yearly and quarterlycontext-based classifiers were quite diverse: six of the quar-terly classifiers had fraud recall rates over 80 percent whilethree others had legitimate recall values over 90 percent.Classifiers such as SVM-Linear and REPTree were able toidentify over 85 percent of the fraud firms (but with falsepositive rates approaching 40 percent). Conversely, tree-based classifiers such as J48, Random Forest, and NBTreehad false positive rates below 10 percent, but with fraud recallrates of only 25 to 50 percent. This diversity in classifier per-formance would prove to be highly useful when using stackedgeneralization (see the subsection “Evaluating StackedClassifiers”).
Context-Based Classifiers VersusBaseline Classifiers
We conducted paired t-tests to compare the performance ofour yearly and quarterly context-based classifiers against thebaseline. Consistent with H1, three different settings wereevaluated at the yearly and quarterly level: organizational,industry, and organizational plus industry (i.e., the contextclassifiers from Tables 6 and 7). The t-tests were conducted
MIS Quarterly Vol. 36 No. 4/December 2012 1309

Abbasi et al./A Meta-Learning Framework for Detecting Financial Fraud
Table 5. Baseline Results Using 12 Yearly Ratios
Classifier AUC
Legit Fraud
Classifier AUC
Legit Fraud
Prec. Rec. Prec. Rec. Prec. Rec. Prec. Rec.
SVM-Lin 0.522 91.3 59.9 6.8 34.0 ADTree 0.612 94.1 55.0 10.7 57.5
LogitReg 0.703 96.1 67.0 16.6 65.0 RandForest 0.695 95.2 67.5 14.8 59.2
J48 0.664 95.2 68.5 14.9 58.7 NBTree 0.687 95.8 84.5 30.0 54.8
BayesNet 0.673 95.5 74.0 18.2 58.2 REPTree 0.606 94.6 65.5 13.3 54.0
NaiveBayes 0.551 92.4 51.6 8.4 49.6 JRip 0.557 94.1 80.0 17.5 39.6
SVM-RBF 0.452 89.8 64.7 3.5 14.7 NNge 0.665 93.1 72.0 11.2 33.3
SVM-Poly 0.538 91.3 52.0 7.1 38.9 NeuralNet 0.591 91.9 56.0 7.8 42.8
Table 6. Yearly Context-Based Classifiers Using Organizational and Industry Context Features
Classifier AUC
Legit Fraud
Classifier AUC
Legit Fraud
Prec. Rec. Prec. Rec. Prec. Rec. Prec. Rec.
SVM-Lin 0.694 99.3 36.9 11.7 96.8 ADTree 0.773 97.7 58.5 14.9 84.1
LogitReg 0.791 97.0 70.1 17.8 74.8 RandForest 0.785 96.4 71.3 17.2 69.2
J48 0.669 94.1 82.0 16.3 40.6 NBTree 0.814 96.6 73.6 18.6 69.7
BayesNet 0.752 96.5 73.4 18.3 68.7 REPTree 0.624 96.0 61.1 13.5 70.2
NaiveBayes 0.716 98.2 55.2 14.6 88.5 JRip 0.626 95.3 69.7 14.6 60.2
SVM-RBF 0.645 94.2 63.3 11.5 55.3 NNge 0.703 94.2 70.3 12.7 50.1
SVM-Poly 0.729 98.5 52.5 14.2 90.7 NeuralNet 0.619 95.9 59.2 13.1 70.9
Table 7. Quarterly Context-Based Classifiers Using Organizational and Industry Context Features
Classifier AUC
Legit Fraud
Classifier AUC
Legit Fraud
Prec. Rec. Prec. Rec. Prec. Rec. Prec. Rec.
SVM-Lin 0.733 98.7 60.3 16.5 90.7 ADTree 0.741 98.0 53.9 14.1 87.3
LogitReg 0.780 96.5 69.4 16.6 70.7 RandForest 0.689 93.6 93.4 25.0 25.7
J48 0.739 95.5 90.8 31.9 49.9 NBTree 0.724 93.7 92.3 24.1 28.4
BayesNet 0.645 95.6 67.4 14.5 64.1 REPTree 0.761 97.9 52.4 13.6 86.8
NaiveBayes 0.724 96.7 50.7 12.3 80.2 JRip 0.670 95.6 63.3 13.4 66.0
SVM-RBF 0.745 98.2 60.3 16.0 87.5 NNge 0.703 93.2 80.6 12.3 31.5
SVM-Poly 0.742 97.1 55.0 13.4 80.7 NeuralNet 0.652 94.4 65.6 12.1 55.0
on legitimate and fraud recall. We ran paired t-tests usingcost settings of 1:5 to 1:50 (in increments of 5) across the 14classifiers. For each test, this resulted in 140 controlled pairs:10 cost settings multiplied by 14 classifiers. This particularrange of costs was chosen since it incorporated the two costsettings used in this study as well as those employed in priorstudies (e.g., Beneish 1999a; Cecchini et al. 2010), and there-fore represented a reasonable range of costs for various stake-holder groups. Costs and classifiers were controlled in the t-test in order to isolate the impact of the input features (asdescribed in H1).
Table 8 shows the t-test results. The three yearly settingseach significantly outperformed the baseline classifiers onfraud recall/precision and legit precision. However, the per-formance gains for legitimate recall were not significant foralpha set to 0.05, with p-values of 0.211, 0.056, and 0.065. This was due to the imbalanced performance of the baselineratios (high legit recall and very low fraud recall). Neverthe-less, the yearly organizational, industry, and context featuresets all improved legitimate recall (with the latter two signifi-cant at alpha = 0.1). The three quarterly settings significantlyoutperformed the baseline classifiers in terms of legitimate
1310 MIS Quarterly Vol. 36 No. 4/December 2012
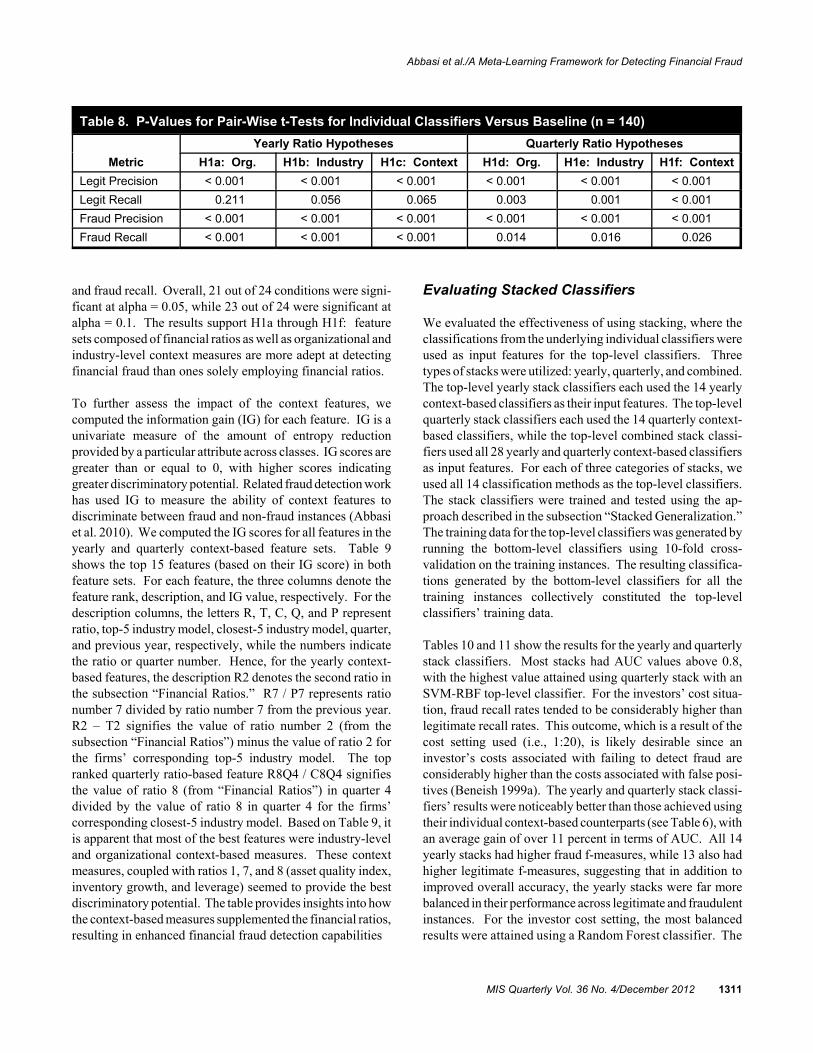
Abbasi et al./A Meta-Learning Framework for Detecting Financial Fraud
Table 8. P-Values for Pair-Wise t-Tests for Individual Classifiers Versus Baseline (n = 140)
Metric
Yearly Ratio Hypotheses Quarterly Ratio Hypotheses
H1a: Org. H1b: Industry H1c: Context H1d: Org. H1e: Industry H1f: Context
Legit Precision < 0.001 < 0.001 < 0.001 < 0.001 < 0.001 < 0.001
Legit Recall 0.211 0.056 0.065 0.003 0.001 < 0.001
Fraud Precision < 0.001 < 0.001 < 0.001 < 0.001 < 0.001 < 0.001
Fraud Recall < 0.001 < 0.001 < 0.001 0.014 0.016 0.026
and fraud recall. Overall, 21 out of 24 conditions were signi-ficant at alpha = 0.05, while 23 out of 24 were significant atalpha = 0.1. The results support H1a through H1f: featuresets composed of financial ratios as well as organizational andindustry-level context measures are more adept at detectingfinancial fraud than ones solely employing financial ratios.
To further assess the impact of the context features, wecomputed the information gain (IG) for each feature. IG is aunivariate measure of the amount of entropy reductionprovided by a particular attribute across classes. IG scores aregreater than or equal to 0, with higher scores indicatinggreater discriminatory potential. Related fraud detection workhas used IG to measure the ability of context features todiscriminate between fraud and non-fraud instances (Abbasiet al. 2010). We computed the IG scores for all features in theyearly and quarterly context-based feature sets. Table 9shows the top 15 features (based on their IG score) in bothfeature sets. For each feature, the three columns denote thefeature rank, description, and IG value, respectively. For thedescription columns, the letters R, T, C, Q, and P representratio, top-5 industry model, closest-5 industry model, quarter,and previous year, respectively, while the numbers indicatethe ratio or quarter number. Hence, for the yearly context-based features, the description R2 denotes the second ratio inthe subsection “Financial Ratios.” R7 / P7 represents rationumber 7 divided by ratio number 7 from the previous year. R2 – T2 signifies the value of ratio number 2 (from thesubsection “Financial Ratios”) minus the value of ratio 2 forthe firms’ corresponding top-5 industry model. The topranked quarterly ratio-based feature R8Q4 / C8Q4 signifiesthe value of ratio 8 (from “Financial Ratios”) in quarter 4divided by the value of ratio 8 in quarter 4 for the firms’corresponding closest-5 industry model. Based on Table 9, itis apparent that most of the best features were industry-leveland organizational context-based measures. These contextmeasures, coupled with ratios 1, 7, and 8 (asset quality index,inventory growth, and leverage) seemed to provide the bestdiscriminatory potential. The table provides insights into howthe context-based measures supplemented the financial ratios,resulting in enhanced financial fraud detection capabilities
Evaluating Stacked Classifiers
We evaluated the effectiveness of using stacking, where theclassifications from the underlying individual classifiers wereused as input features for the top-level classifiers. Threetypes of stacks were utilized: yearly, quarterly, and combined. The top-level yearly stack classifiers each used the 14 yearlycontext-based classifiers as their input features. The top-levelquarterly stack classifiers each used the 14 quarterly context-based classifiers, while the top-level combined stack classi-fiers used all 28 yearly and quarterly context-based classifiersas input features. For each of three categories of stacks, weused all 14 classification methods as the top-level classifiers.The stack classifiers were trained and tested using the ap-proach described in the subsection “Stacked Generalization.”The training data for the top-level classifiers was generated byrunning the bottom-level classifiers using 10-fold cross-validation on the training instances. The resulting classifica-tions generated by the bottom-level classifiers for all thetraining instances collectively constituted the top-levelclassifiers’ training data.
Tables 10 and 11 show the results for the yearly and quarterlystack classifiers. Most stacks had AUC values above 0.8,with the highest value attained using quarterly stack with anSVM-RBF top-level classifier. For the investors’ cost situa-tion, fraud recall rates tended to be considerably higher thanlegitimate recall rates. This outcome, which is a result of thecost setting used (i.e., 1:20), is likely desirable since aninvestor’s costs associated with failing to detect fraud areconsiderably higher than the costs associated with false posi-tives (Beneish 1999a). The yearly and quarterly stack classi-fiers’ results were noticeably better than those achieved usingtheir individual context-based counterparts (see Table 6), withan average gain of over 11 percent in terms of AUC. All 14yearly stacks had higher fraud f-measures, while 13 also hadhigher legitimate f-measures, suggesting that in addition toimproved overall accuracy, the yearly stacks were far morebalanced in their performance across legitimate and fraudulentinstances. For the investor cost setting, the most balancedresults were attained using a Random Forest classifier. The
MIS Quarterly Vol. 36 No. 4/December 2012 1311

Abbasi et al./A Meta-Learning Framework for Detecting Financial Fraud
Table 9. IG Measures for Top 15 Attributes in Yearly and Quarterly Context-Based Feature Sets
Yearly Context-Based Features Quarterly Context-Based Features
Rank Description IG Value Rank Description IG Value
1 R2 0.0276 1 R8Q4 / C8Q4 0.0619
2 R7 / P7 0.0249 2 R7Q2 0.0505
3 R3 0.0249 3 R7Q3 - C7Q3 0.0503
4 R9 0.0234 4 R8Q3 - T8Q3 0.0499
5 R2 - T2 0.0231 5 R7Q1 / T7Q1 0.0489
6 R8 - C8 0.0193 6 R8Q4 – R8Q3 0.0486
7 R2 - C2 0.0188 7 R1Q3 – R1Q2 0.0482
8 R1 / P1 0.0182 8 R8Q2 / C8Q2 0.0480
9 R7 - T7 0.0173 9 R8Q3 / T8Q3 0.0474
10 R8 - P8 0.0168 10 R8Q1 / R8PQ4 0.0473
11 R7 0.0168 11 R8Q1 / C8Q1 0.0470
12 R7 / T7 0.0163 12 R7Q1 – C7Q1 0.0458
13 R1 - C1 0.0162 13 R8Q1 - C8Q1 0.0452
14 R8 / T8 0.0149 14 R12Q3 – C12Q3 0.0441
15 R8 - T8 0.0147 15 R8Q4 / T8Q4 0.0427
Table 10. Yearly Stack Classifiers
Classifier AUC
Legit Fraud
Classifier AUC
Legit Fraud
Prec. Rec. Prec. Rec. Prec. Rec. Prec. Rec.
SVM-Lin 0.843 98.2 68.7 19.0 85.1 ADTree 0.823 97.9 73.0 20.6 81.4
LogitReg 0.827 97.9 72.0 20.2 81.9 RandForest 0.836 96.9 81.1 24.1 69.4
J48 0.828 97.1 74.2 19.8 73.8 NBTree 0.863 98.5 72.9 21.8 87.3
BayesNet 0.850 97.2 76.3 21.4 74.6 REPTree 0.812 97.2 71.8 18.8 75.8
NaiveBayes 0.814 97.1 81.2 24.9 72.1 JRip 0.817 97.0 79.4 23.1 71.6
SVM-RBF 0.853 97.9 72.0 20.2 82.4 NNge 0.827 96.7 77.0 20.8 69.7
SVM-Poly 0.797 97.5 71.7 19.3 78.5 NeuralNet 0.823 97.5 73.9 20.6 78.2
Table 11. Quarterly Stack Classifiers
Classifier AUC
Legit Fraud
Classifier AUC
Legit Fraud
Prec. Rec. Prec. Rec. Prec. Rec. Prec. Rec.
SVM-Lin 0.864 98.4 66.6 18.4 87.3 ADTree 0.838 99.8 66.6 20.2 98.0
LogitReg 0.837 98.3 70.5 20.1 85.6 RandForest 0.856 97.8 75.2 21.9 80.4
J48 0.821 98.5 68.5 19.5 88.3 NBTree 0.873 99.0 65.9 19.0 92.4
BayesNet 0.874 98.8 67.6 19.4 90.2 REPTree 0.866 99.3 65.9 19.4 94.9
NaiveBayes 0.805 97.7 67.6 17.9 81.9 JRip 0.837 99.2 66.9 19.7 93.9
SVM-RBF 0.881 99.5 69.9 21.6 96.1 NNge 0.805 98.0 72.1 20.4 82.6
SVM-Poly 0.862 98.9 66.6 19.1 91.2 NeuralNet 0.794 98.0 67.2 18.2 84.4
1312 MIS Quarterly Vol. 36 No. 4/December 2012

Abbasi et al./A Meta-Learning Framework for Detecting Financial Fraud
Table 12. Combined Stack Classifiers
Classifier AUCLegit Fraud
Classifier AUCLegit Fraud
Prec. Rec. Prec. Rec. Prec. Rec. Prec. Rec.
SVM-Lin 0.904 98.0 80.0 26.0 81.2 ADTree 0.896 99.2 76.0 25.0 92.4
LogitReg 0.875 97.8 84.9 30.9 78.2 RandForest 0.857 96.7 95.2 53.0 62.8
J48 0.839 97.2 77.6 22.3 74.3 NBTree 0.887 98.8 77.0 25.0 89.0
BayesNet 0.893 98.1 77.9 24.3 82.2 REPTree 0.888 98.6 75.3 23.5 88.0
NaiveBayes 0.851 97.4 90.6 39.8 71.6 JRip 0.870 98.8 80.2 27.9 88.8
SVM-RBF 0.894 98.9 74.5 23.3 90.0 NNge 0.865 96.5 88.4 32.1 63.3
SVM-Poly 0.865 97.5 88.9 36.5 73.8 NeuralNet 0.865 98.7 80.3 27.8 88.0
Table 13. P-Values for Pair-Wise t-Tests for Combined Versus Yearly/Quarterly Stack Classifiers(n = 140)
Metrics
Legit Fraud
Precision Recall Precision Recall
H2a: Combined versus Yearly < 0.001 < 0.001 < 0.001 < 0.001
H2b: Combined versus Quarterly < 0.001 0.001 < 0.001 < 0.001†
†Opposite to hypothesis
quarterly stack classifiers had considerably better fraud recallrates than the individual quarterly context-based classifiers(see Table 7), outperforming them by nearly 25 percent onaverage. However, this improved fraud recall was coupledwith reduced legitimate recall for four of the classifiers.
When compared to the yearly stacks, the quarterly stacksyielded higher fraud recall rates (12 percent higher on aver-age); every quarter stack classifier identified at least 80percent of the fraud firms, albeit with false positive ratesgenerally above 30 percent. However, both the yearly andquarterly stacks had comparable average AUC values. Thiswas attributable to the yearly stacks’ 6 percent higher averageperformance on legitimate firms, which resulted in con-siderably lower false positive rates.
Table 12 shows the results for the combined stack classifiers,which used the yearly and quarterly context-based classifiers’classifications as input. The overall AUC values ranged from0.839 to 0.904, with the best results attained using a SVM-Linear classifier. All 14 combined stacks outperformed theiryearly and quarterly stack counterparts, with an average AUCgain of 3 to 5 percent. For the investor cost setting, whilesome of the combined stacks had higher legitimate/fraudrecall rates, they were generally more balanced than theyearly and quarterly stacks in terms of their classifications(e.g., SVM-Linear, Logistic Regression, J48, BayesianNetwork, JRip, and Neural Network). This suggests that the
enhanced performance of the combined stacks was attribu-table to their ability to leverage the complementary infor-mation provided by the yearly and quarterly context-basedclassifiers.
H2: Combined Stack Classifiers Versus Yearlyand Quarterly Stack Classifiers
We conducted paired t-tests to compare the performance ofthe combined stacks against the yearly (H2a) and quarterly(H2b) stack classifiers using the same setup as the previoushypothesis test (H1). Table 13 shows the t-test results. Thecombined stack classifiers significantly outperformed theyearly stack classifiers on legitimate and fraud precision/recall(with all four p-values < 0.01). The combined stacks alsooutperformed the quarterly stacks on legitimate precision/recall and fraud precision. However, the quarter stacks hadsignificantly better performance gain on fraud recall (denotedby a plus sign). Overall, seven out of eight tests were signi-ficant; the t-test results support H2a–b and suggest that com-bining yearly and quarterly information can facilitateenhanced financial fraud detection capabilities.
To further assess the effectiveness of combining yearly andquarterly information, we performed an instance-level analy-sis of the classifications made by all 14 combined stack classi-fiers. For each of the instances in our test bed, we aggregated
MIS Quarterly Vol. 36 No. 4/December 2012 1313

Abbasi et al./A Meta-Learning Framework for Detecting Financial Fraud
Sum ofStack
Scores|
Legit Fraud Cumulative%of Total Inst.% Prec. % Rec. % Inst. % Prec. % Rec. % Inst.
14 99.4 96.5 33.4 61.8 90.8 24.0 32.7
12 99.4 94.6 14.4 66.4 94.8 18.8 47.5
10 98.2 93.5 12.6 67.8 89.1 22.5 60.9
8 98.5 89.6 9.5 48.4 88.0 12.2 70.6
6 98.9 84.2 8.7 27.0 85.7 6.9 79.2
4 97.7 80.3 9.0 20.0 72.4 7.1 88.0
2 94.6 65.9 6.1 13.2 57.7 6.4 94.2
Figure 4. Instance-Level Analysis of Combined Stack Classifiers’ Aggregated Classifications
that particular instance’s 14 classification scores. Since theclassifiers assigned a “-1” to instances classified as fraudulentand “1” to instances considered legitimate, the aggregatedscores varied from -14 to 14 (in intervals of 2). Hence, a scoreof 12 meant that 13 classifiers considered the instancelegitimate and 1 deemed it fraudulent. The absolute value |x|of an aggregated score x represents the degree of agreementbetween stack classifiers. For each |x|, class-level precisionand recall measures were computed as follows: All instanceswith positive aggregated scores (i.e., x > 0) were consideredlegitimate (i.e., scores of 2, 4, 6, 8, 10, 12, and 14) whilethose with negative scores (i.e., x < 0) were consideredfraudulent. These score-based predictions were comparedagainst the actual class labels to generate a confusion matrixfor each |x|. From each confusion matrix, legit/fraud precisionand recall were computed, resulting in performance measuresfor every level of classifier agreement (i.e., minimal agree-ment of |x| = 2 to maximal agreement |x| = 14). It is importantto note that the 5.8 percent of instances in the test bed that hadan aggregated score of 0 were excluded from the analysis(i.e., test instances where the classifiers were evenly splitbetween predictions of legitimate and fraudulent).
Figure 4 shows the analysis results. The first column shows|x|; the absolute value of the aggregated score x for aninstance. Columns two, three, five, and six show legitimate/fraud precision and recall percentages attained on instanceswith that particular score. Columns four, seven, and eightdepict the percentage of the legit, fraud, and total instances inthe test bed covered by that score, respectively. The chart atthe bottom left shows plots of the precision rates (i.e.,columns 2 and 5) and recall rates (columns 3 and 6) forinstances with that score. The chart at the bottom right showscumulative precision and recall rates if using that score as athreshold. The results can be interpreted as follows: 32.7percent of all instances in the test set had a score of -14 or 14.These instances accounted for 33.4 percent of all legitimatetest instances and 24 percent of all fraud test instances. Ofthese instances, 96.5 percent of the legitimate instances werecorrectly classified (i.e., x = 14) while the remaining 3.5 per-cent were misclassified as fraudulent (i.e., x = -14).
The results reveal that these aggregated scores provide a nicemechanism for assessing the confidence level of a particularclassification. When all 14 combined stacks agreed (i.e., the
0
20
40
60
80
100
14 12 10 8 6 4 2
Perc
enta
ge
|Sum of Stack Scores|Legit Precision Legit RecallFraud Precision Fraud Recall
40
52
64
76
88
100
14 12 10 8 6 4 2
Perc
enta
ge
|Sum of Stack Scores|Cumulative Legit Precision Cumulative Legit RecallCumulative Fraud Precision Cumulative Fraud Recall
1314 MIS Quarterly Vol. 36 No. 4/December 2012

Abbasi et al./A Meta-Learning Framework for Detecting Financial Fraud
NAICSCode Description
#Firms
%Recall
31–33 Manufacturing 129 94.57
51 Information 72 77.78
52 Finance and Insurance 57 73.68
54 Professional Services 33 87.88
42 Wholesale Trade 23 95.65
23 Construction 17 88.24
21 Mining 15 93.33
44–45 Retail Services 13 100.00
56 Waste Management 11 81.82
Figure 5. Analysis of Combined Stack Classifiers’ Fraud Recall Rates for Various Business Sectors
absolute value of the sum of their classification scores was14), the legit and fraud recall rates were 96.5 and 90.8 per-cent, respectively. Moreover, this accounted for 32 percent ofthe test instances. Looking at the chart on the left, as ex-pected, lower scores generally resulted in diminished recallrates (one exception was fraud recall, which increased whenusing a score of 12). Based on the chart on the right, theperformance degradation was quite gradual for thresholdsgreater than 4. For example, using a threshold of 6 or betterresulted in legitimate and fraud recall rates of over 90 percenton instances encompassing 79.2 percent of the test bed.Using the aggregated scores as a confidence-level measurecan be useful for prioritizing regulator or investor resources.Moreover, the stack scores can also be exploited in a semi-supervised learning manner to further improve performance,as discussed in the next subsection.
We also analyzed the combined stack classifiers’ fraud detec-tion rates for different sectors by categorizing the 409 fraudfirm-years in the test set based on their top-level NAICSclassifications (also referred to as business sectors). Whilethe 20 top-level classifications (e.g., manufacturing, whole-sale, retail, construction, mining, etc.) are more general thanthe 1,017 bottom-level industry classifications in the NAICShierarchy, which were used to build the industry-level models,aggregating results at the top-level provided interesting in-sights. Figure 5 shows the results for all top-level NAICScodes with at least 10 fraud firm-years in the test set. Thetable on the left lists the results for the combined stack classi-fiers, while the chart on the right shows the combined stacks’results relative to the yearly context and baseline classifiers.The combined stacks performed best on merchandise firms at
various stages of the supply chain (e.g., manufacturing,wholesale, retail), with fraud recall of between 94 and 100percent on such firms. The yearly context and baseline classi-fiers also performed best on these sectors, although withlower detection rates. The enhanced performance on manu-facturing firms is consistent with previous work that has alsoattained good fraud detection rates on such data ( Kirkos et al.2007; Spathis 2002). The combined stacks had relativelylower fraud recall rates on firms in the information andfinance/insurance sectors (73 percent and 77 percent),although still higher than the yearly context (approximately60 percent) and baseline classifiers (less than 50 percent).Analysis of the test bed revealed that fraud firms in these twosectors were 25 percent more prevalent in the test set, ascompared to the training data. Since fraud is often linked tofinancial distress (Chen and Du 2009; Zhao et al. 2009), theincreased number of fraud firms from the information sectorappearing in the year 2000 onward could be related to the dot-com bubble burst. Similarly, fraud in the financial sectorcontinues to grow and play a pivotal role in the economy(Stempel 2009). Such temporal changes in fraud patternsattributable to overall economic and industry-level conditionsfurther underscore the importance of adaptive learningapproaches (discussed in the next subsection).
H3: Yearly and Quarterly Stack ClassifiersVersus Context-Based Classifiers
We conducted paired t-tests to compare the performance ofthe yearly stacks against the yearly context-based classifiers(H3a) and the quarterly stacks against the quarterly context-
0
20
40
60
80
100
31-33 51 52 54 42 23 21 44-45 56
% R
ecal
l
NAICS Code
Combined Stack Yearly Context Baseline
MIS Quarterly Vol. 36 No. 4/December 2012 1315

Abbasi et al./A Meta-Learning Framework for Detecting Financial Fraud
Table 14. P-Values for Pair-Wise t-Tests for Stack Versus Individual Classifiers (n = 140)
Metrics
Legit Fraud
Precision Recall Precision Recall
H3a: Yearly Stack-Individual < 0.001 < 0.001 < 0.001 0.011
H3b: Quarterly Stack-Individual < 0.001 0.482 0.008 < 0.001
based classifiers (H3b) (see Table 14). The yearly stackssignificantly outperformed the yearly context-based classifierson legitimate and fraud precision/recall, with all four p-valuesless than 0.01. With respect to H3b, the quarterly stackssignificantly outperformed the quarterly context-based classi-fiers on legitimate precision and fraud precision/recall. Whilethe quarterly stacks also had higher legitimate recall rates, thegains were not significant. Overall, three of the four condi-tions were significant. The results support our hypothesis thatstack classifiers can improve financial fraud detectioncapabilities over simply using individual classifiers, irrespec-tive of whether yearly or quarterly features are beingemployed.
Figure 6 depicts the mean and range of the yearly stack (leftchart) and yearly context (right chart) ROC curves. The solidblack lines show the mean ROC curves (taken as the averageacross the 14 classifiers’ curves), which depict the tradeoffsbetween true and false positives. Here, false positives indi-cate legitimate firms misclassified as being fraudulent.Curves situated closer to the top left corner signify betterresults, since they denote high ratios of true to false positives.The shaded areas indicate the ROC curve range (minimumand maximum values) across the 14 yearly stack and context-based classifiers. The two values on the bottom right cornerof the charts indicate the mean AUC (i.e., the AUC for thesolid black lines) and the mean range (i.e., the area of theshaded regions). Looking at the charts, we can see that theyearly context-based classifiers had greater variability acrossclassifiers; the larger shaded region is indicative of classifiersthat varied considerably in terms of their true/false positiverates (with some providing better legitimate recall, and othersspecializing in fraud recall). In contrast, the stacks providedbetter performance and also exhibited less variation; theircurves were situated closer to one another (as evidenced bythe smaller shaded region), while the results of the context-based classifiers are relatively sporadic. The AUC valuesvaried 6 percent across the yearly stacks and 19 percentacross the yearly context-based classifiers. Although notdepicted here, a similar trend was observed with the quarterlystack and context classifiers. These results are consistent withprior research, which has suggested that stacked generali-zation can improve performance, generalization ability, and
reliability when applied to a diverse set of complementaryunderlying classifiers (Lynam and Cormack 2006; Sigletos etal. 2005; Wolpert 1992).
Evaluating Adaptive Semi-Supervised Learning
We ran the ASL algorithm on top of the base and stackclassifiers, as described in the “Adaptive Learing” subsection.During each iteration, we incremented d by 10 (i.e., p = 10).The test instances were evaluated in chronological order. Inother words, ASL was first run on the data from 2000. Onceall of the instances from 2000 had been processed (i.e.,assigned final predictions), ASL moved on to the firms from2001. Once the algorithm had finished running, the predictionvalues in the S matrix were used to compute the performanceof the 14 classifiers. Table 15 shows the results. All 14classifiers had AUC values above 0.866, with many classifiersattaining values over 0.900. The most balanced results wereattained using an NBTree top-level classifier, which yieldedthe highest AUC and attained legitimate and fraud recall ratesabove 88 percent for the investor cost setting. The results ofall 14 ASL classifiers were better than those achieved usingtheir combined stack counterparts (i.e., static supervisedlearning). The biggest gains were achieved when the Baye-sian Network classifier was used.
H4: ASL Versus Combined Stack Classifiers
We conducted paired t-tests (n = 140) to compare the perfor-mance of the adaptive semi-supervised learning classifiersagainst the combined stack classifiers (H4). The adaptivesemi-supervised learning classifiers significantly outper-formed the combined stack classifiers on legitimate precision/recall (both p-values < 0.001) and fraud precision/recall (p-values < 0.001 and 0.049, respectively). The t-test resultssupport H4 and suggest that adaptive learning can furtherenhance financial fraud detection performance over staticsupervised learning models.
The two solid lines in Figure 7 show the legitimate and fraudrecall performance of ASL in comparison with the combined
1316 MIS Quarterly Vol. 36 No. 4/December 2012
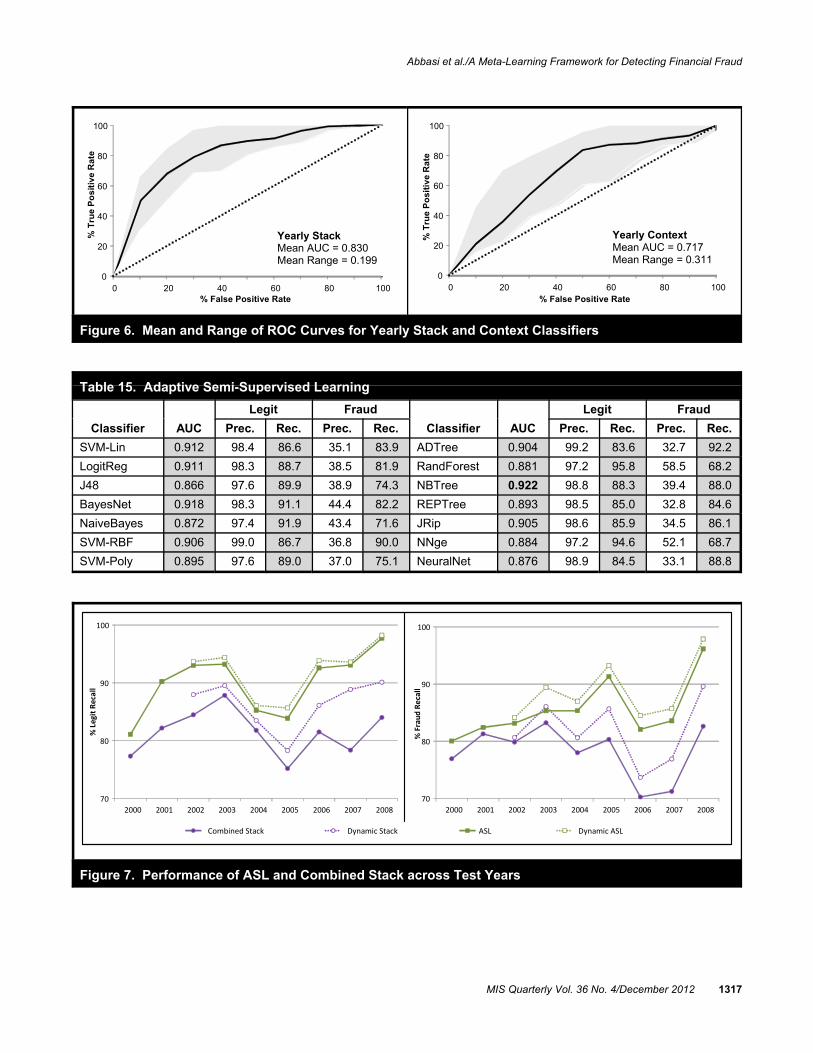
Abbasi et al./A Meta-Learning Framework for Detecting Financial Fraud
Figure 6. Mean and Range of ROC Curves for Yearly Stack and Context Classifiers
Table 15. Adaptive Semi-Supervised Learning
Classifier AUC
Legit Fraud
Classifier AUC
Legit Fraud
Prec. Rec. Prec. Rec. Prec. Rec. Prec. Rec.
SVM-Lin 0.912 98.4 86.6 35.1 83.9 ADTree 0.904 99.2 83.6 32.7 92.2
LogitReg 0.911 98.3 88.7 38.5 81.9 RandForest 0.881 97.2 95.8 58.5 68.2
J48 0.866 97.6 89.9 38.9 74.3 NBTree 0.922 98.8 88.3 39.4 88.0
BayesNet 0.918 98.3 91.1 44.4 82.2 REPTree 0.893 98.5 85.0 32.8 84.6
NaiveBayes 0.872 97.4 91.9 43.4 71.6 JRip 0.905 98.6 85.9 34.5 86.1
SVM-RBF 0.906 99.0 86.7 36.8 90.0 NNge 0.884 97.2 94.6 52.1 68.7
SVM-Poly 0.895 97.6 89.0 37.0 75.1 NeuralNet 0.876 98.9 84.5 33.1 88.8
Figure 7. Performance of ASL and Combined Stack across Test Years
0
20
40
60
80
100
0 20 40 60 80 100
% T
rue
Po
sit
ive
Ra
te
% False Positive Rate
Yearly StackMean AUC = 0.830Mean Range = 0.199
0
20
40
60
80
100
0 20 40 60 80 100
% T
rue
Po
siti
ve
Ra
te
% False Positive Rate
Yearly ContextMean AUC = 0.717Mean Range = 0.311
Combined Stack Dynamic Stack ASL Dynamic ASL
70
80
90
100
2000 2001 2002 2003 2004 2005 2006 2007 2008
% L
egit
Reca
ll
70
80
90
100
2000 2001 2002 2003 2004 2005 2006 2007 2008
% F
raud
Rec
all
MIS Quarterly Vol. 36 No. 4/December 2012 1317
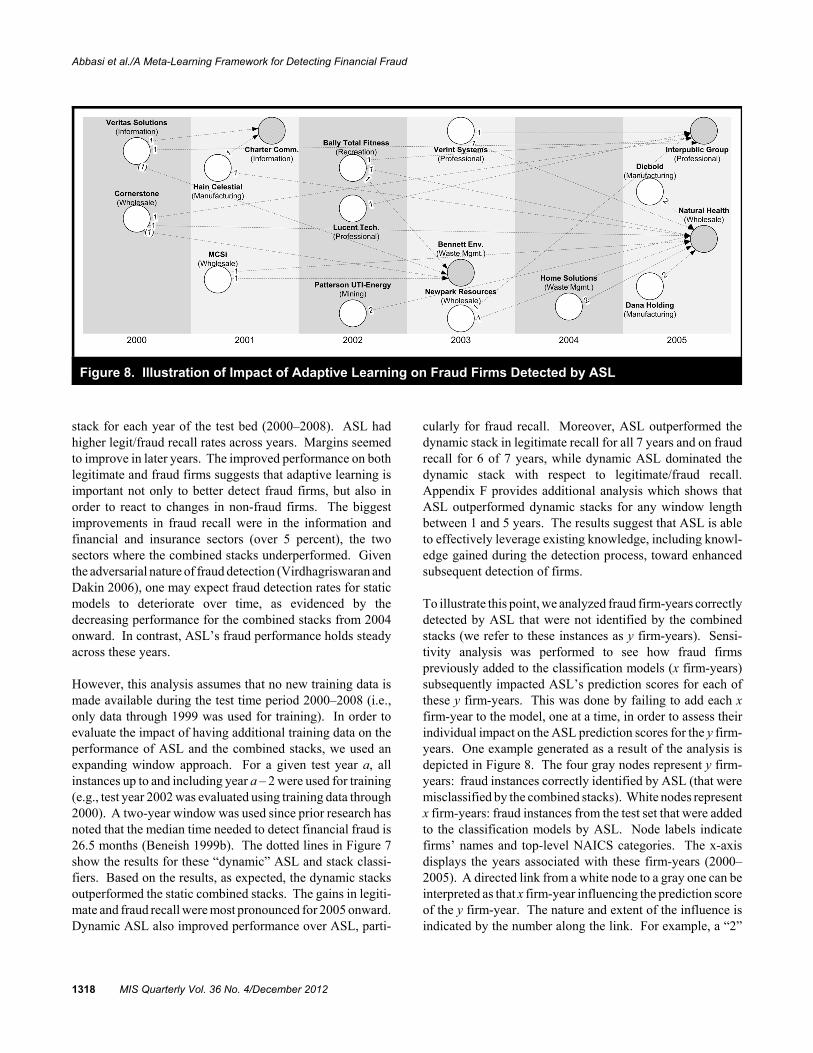
Abbasi et al./A Meta-Learning Framework for Detecting Financial Fraud
Figure 8. Illustration of Impact of Adaptive Learning on Fraud Firms Detected by ASL
stack for each year of the test bed (2000–2008). ASL hadhigher legit/fraud recall rates across years. Margins seemedto improve in later years. The improved performance on bothlegitimate and fraud firms suggests that adaptive learning isimportant not only to better detect fraud firms, but also inorder to react to changes in non-fraud firms. The biggestimprovements in fraud recall were in the information andfinancial and insurance sectors (over 5 percent), the twosectors where the combined stacks underperformed. Giventhe adversarial nature of fraud detection (Virdhagriswaran andDakin 2006), one may expect fraud detection rates for staticmodels to deteriorate over time, as evidenced by thedecreasing performance for the combined stacks from 2004onward. In contrast, ASL’s fraud performance holds steadyacross these years.
However, this analysis assumes that no new training data ismade available during the test time period 2000–2008 (i.e.,only data through 1999 was used for training). In order toevaluate the impact of having additional training data on theperformance of ASL and the combined stacks, we used anexpanding window approach. For a given test year a, allinstances up to and including year a – 2 were used for training(e.g., test year 2002 was evaluated using training data through2000). A two-year window was used since prior research hasnoted that the median time needed to detect financial fraud is26.5 months (Beneish 1999b). The dotted lines in Figure 7show the results for these “dynamic” ASL and stack classi-fiers. Based on the results, as expected, the dynamic stacksoutperformed the static combined stacks. The gains in legiti-mate and fraud recall were most pronounced for 2005 onward.Dynamic ASL also improved performance over ASL, parti-
cularly for fraud recall. Moreover, ASL outperformed thedynamic stack in legitimate recall for all 7 years and on fraudrecall for 6 of 7 years, while dynamic ASL dominated thedynamic stack with respect to legitimate/fraud recall.Appendix F provides additional analysis which shows thatASL outperformed dynamic stacks for any window lengthbetween 1 and 5 years. The results suggest that ASL is ableto effectively leverage existing knowledge, including knowl-edge gained during the detection process, toward enhancedsubsequent detection of firms.
To illustrate this point, we analyzed fraud firm-years correctlydetected by ASL that were not identified by the combinedstacks (we refer to these instances as y firm-years). Sensi-tivity analysis was performed to see how fraud firmspreviously added to the classification models (x firm-years)subsequently impacted ASL’s prediction scores for each ofthese y firm-years. This was done by failing to add each xfirm-year to the model, one at a time, in order to assess theirindividual impact on the ASL prediction scores for the y firm-years. One example generated as a result of the analysis isdepicted in Figure 8. The four gray nodes represent y firm-years: fraud instances correctly identified by ASL (that weremisclassified by the combined stacks). White nodes representx firm-years: fraud instances from the test set that were addedto the classification models by ASL. Node labels indicatefirms’ names and top-level NAICS categories. The x-axisdisplays the years associated with these firm-years (2000–2005). A directed link from a white node to a gray one can beinterpreted as that x firm-year influencing the prediction scoreof the y firm-year. The nature and extent of the influence isindicated by the number along the link. For example, a “2”
1318 MIS Quarterly Vol. 36 No. 4/December 2012

Abbasi et al./A Meta-Learning Framework for Detecting Financial Fraud
means that the absence of that particular x firm-year from theclassification model worsened the y firm-year’s ASL score bytwo. For example, the addition of MCSi in 2002 improvedthe prediction score for Natural Health in 2005 by one.
Figure 8 provides several important insights regarding theadaptive learning component of the MetaFraud framework. It reveals that new fraud firm-year detections were not neces-sarily attained simply by adding one or two additional fraudcases. Rather, they were sometimes the result of a complexseries of modifications to the training models. In some cases,these correct predictions were the culmination of modifica-tions spanning several years of data. For example, the detec-tion of Interpublic Group and Natural Health in 2005leveraged 6–10 x firm-years between 2000 and 2005. How-ever, firms from the same year also played an important role,as evidenced by the positive impact Diebold and DanaHolding had on Natural Health in 2005. Interestingly, busi-ness sector affiliations also seemed to play a role in the adap-tive learning process: several of the links in the figure arebetween firms in the same sector. For example, three of thefirms that influenced Natural Health were also from thewholesale trade sector, while one or two of the firms thatimpacted Charter Communications and Interpublic Groupwere from the information and professional services sectors,respectively. It is also important to note that not all x firm-years’ additions to the models had a positive impact. Forexample, both Veritas Solutions and Cornerstone (from 2000)worsened Bennett Environmental’s prediction score by one.Thus, Figure 8 sheds light on how ASL was able to improvethe detection of fraudulent firms. It is important to note thatin our analysis, consistent with prior work, we represent eachfraud firm based on the year in which the fraud occurred(Cecchini et al. 2011). An interesting future direction wouldbe to also consider when the fraud was actually discovered,and to use this information to retrospectively identify pre-viously undetected frauds committed in earlier years.
Evaluating MetaFraud in Comparison withExisting Fraud Detection Methods
We evaluated MetaFraud in comparison with three priorapproaches that attained state-of-the-art results: Kirkos et al.(2007), Gaganis (2009), and Cecchini et al. (2010). Each ofthese three approaches was run on our test bed, in comparisonwith the overall results from the proposed meta-learningframework. Kirkos et al. and Gaganis each attained goodresults on Greek firms, with overall accuracies ranging from73 to 90 percent and 76 to 87 percent, respectively. Cecchiniet al. attained excellent results on U.S. firms, with frauddetection rates as high as 80 percent. In comparison, prior
studies using public data all had fraud detection rates of lessthan 70 percent. The details regarding the three comparisonapproaches are as follows.
Kirkos et al. used a set of 10 ratios/measures in combinationwith three classifiers: ID3 decision tree, neural network, andBayesian network. We replicated their approach by includingthe same 10 ratios/measures: debt to equity, sales to totalassets, sales minus gross margin, earnings before income tax,working capital, Altman’s Z score, total debt to total assets,net profit to total assets, working capital to total assets, andgross profit to total assets. We also tuned the three classi-fication algorithms as they did in their study (e.g., the numberof hidden layers and nodes on the neural network).
Gaganis used 7 financial ratios in combination with 10 classi-fication algorithms. We replicated his approach by includingthe same seven ratios: receivables to sales, current assets tocurrent liabilities, current assets to total assets, cash to totalassets, profit before tax to total assets, inventories to totalassets, and annual change in sales. We ran many of his classi-fication methods that had performed well, including neuralnetwork, linear/polynomial/RBF SVMs, logistic regression,k-Nearest neighbor, and different types of discriminantanalysis. The parameters of all techniques were tuned as wasdone in the original study. We included the results for thethree methods with the best performance: linear SVM, NeuralNet, and Logit.
Cecchini et al. used an initial set of 40 variables. After pre-processing, the remaining 23 variables were used as input intheir financial kernel. Following their guidelines, we beganwith the same 40 variables and removed 19 after prepro-cessing, resulting in 21 input variables for the financialkernel.
All comparison techniques were run using the same trainingand testing data used in our prior experiments. ROC curveswere generated, and AUC for the ROC curves was computed(as with the previous experiments). For MetaFraud, wegenerated a final prediction for each test case by aggregatingthe predictions of the 14 ASL classifiers to derive a singlestack score for each instance (as described earlier). We usedthe results of the ASL classifiers since these results are basedon the amalgamation of all four phases of MetaFraud andtherefore signify the final output of the meta-learning frame-work.
Table 16 and Figure 9 show the experiment results. Table 16depicts the results for MetaFraud (MF) and the comparisonmethods using both the regulator (1:10) and investor (1:20)cost settings. In addition to legitimate and fraud recall, we
MIS Quarterly Vol. 36 No. 4/December 2012 1319
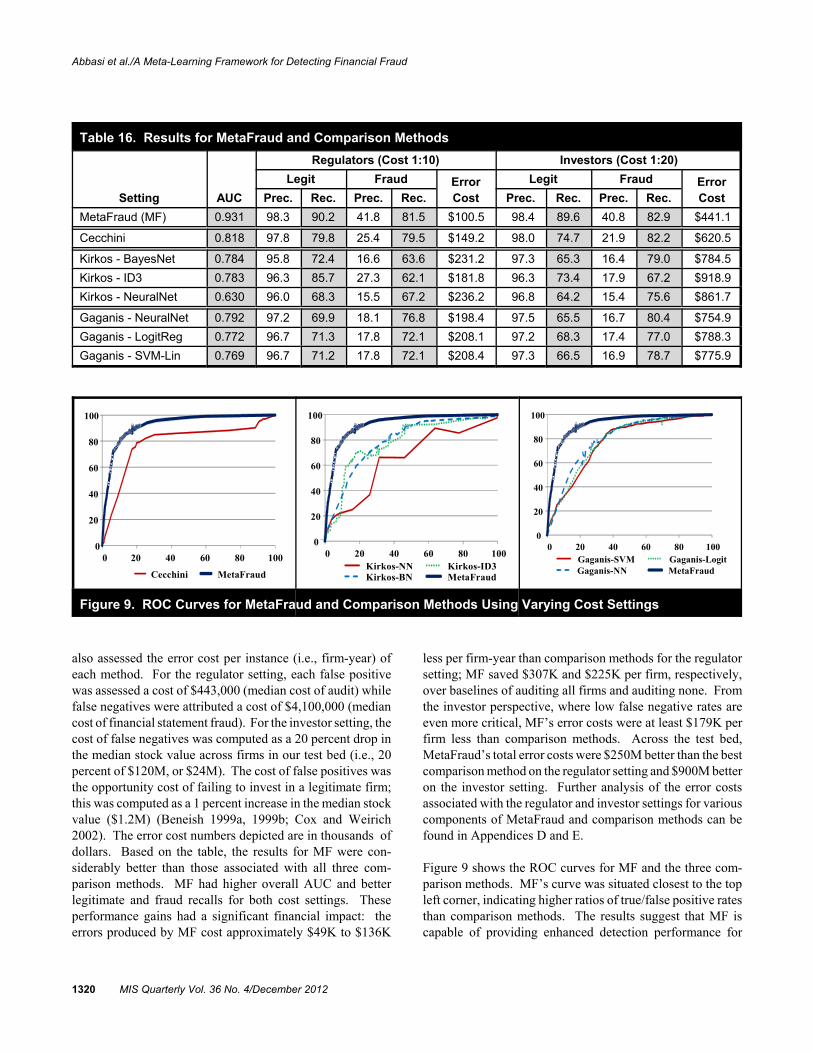
Abbasi et al./A Meta-Learning Framework for Detecting Financial Fraud
Table 16. Results for MetaFraud and Comparison Methods
Setting AUC
Regulators (Cost 1:10) Investors (Cost 1:20)
Legit Fraud ErrorCost
Legit Fraud ErrorCostPrec. Rec. Prec. Rec. Prec. Rec. Prec. Rec.
MetaFraud (MF) 0.931 98.3 90.2 41.8 81.5 $100.5 98.4 89.6 40.8 82.9 $441.1
Cecchini 0.818 97.8 79.8 25.4 79.5 $149.2 98.0 74.7 21.9 82.2 $620.5
Kirkos - BayesNet 0.784 95.8 72.4 16.6 63.6 $231.2 97.3 65.3 16.4 79.0 $784.5
Kirkos - ID3 0.783 96.3 85.7 27.3 62.1 $181.8 96.3 73.4 17.9 67.2 $918.9
Kirkos - NeuralNet 0.630 96.0 68.3 15.5 67.2 $236.2 96.8 64.2 15.4 75.6 $861.7
Gaganis - NeuralNet 0.792 97.2 69.9 18.1 76.8 $198.4 97.5 65.5 16.7 80.4 $754.9
Gaganis - LogitReg 0.772 96.7 71.3 17.8 72.1 $208.1 97.2 68.3 17.4 77.0 $788.3
Gaganis - SVM-Lin 0.769 96.7 71.2 17.8 72.1 $208.4 97.3 66.5 16.9 78.7 $775.9
Figure 9. ROC Curves for MetaFraud and Comparison Methods Using Varying Cost Settings
also assessed the error cost per instance (i.e., firm-year) ofeach method. For the regulator setting, each false positivewas assessed a cost of $443,000 (median cost of audit) whilefalse negatives were attributed a cost of $4,100,000 (mediancost of financial statement fraud). For the investor setting, thecost of false negatives was computed as a 20 percent drop inthe median stock value across firms in our test bed (i.e., 20percent of $120M, or $24M). The cost of false positives wasthe opportunity cost of failing to invest in a legitimate firm;this was computed as a 1 percent increase in the median stockvalue ($1.2M) (Beneish 1999a, 1999b; Cox and Weirich2002). The error cost numbers depicted are in thousands ofdollars. Based on the table, the results for MF were con-siderably better than those associated with all three com-parison methods. MF had higher overall AUC and betterlegitimate and fraud recalls for both cost settings. Theseperformance gains had a significant financial impact: theerrors produced by MF cost approximately $49K to $136K
less per firm-year than comparison methods for the regulatorsetting; MF saved $307K and $225K per firm, respectively,over baselines of auditing all firms and auditing none. Fromthe investor perspective, where low false negative rates areeven more critical, MF’s error costs were at least $179K perfirm less than comparison methods. Across the test bed,MetaFraud’s total error costs were $250M better than the bestcomparison method on the regulator setting and $900M betteron the investor setting. Further analysis of the error costsassociated with the regulator and investor settings for variouscomponents of MetaFraud and comparison methods can befound in Appendices D and E.
Figure 9 shows the ROC curves for MF and the three com-parison methods. MF’s curve was situated closest to the topleft corner, indicating higher ratios of true/false positive ratesthan comparison methods. The results suggest that MF iscapable of providing enhanced detection performance for
0
20
40
60
80
100
0 20 40 60 80 100
Cecchini MetaFraud
0
20
40
60
80
100
0 20 40 60 80 100Kirkos-NN Kirkos-ID3Kirkos-BN MetaFraud
0
20
40
60
80
100
0 20 40 60 80 100Gaganis-SVM Gaganis-LogitGaganis-NN MetaFraud
1320 MIS Quarterly Vol. 36 No. 4/December 2012

Abbasi et al./A Meta-Learning Framework for Detecting Financial Fraud
various cost settings. With respect to the comparisonmethods, the financial kernel outperformed Kirkos et al. andGaganis in terms of overall AUC and legit/fraud recall forboth cost settings, as evidenced by Table 16. While the bestresults for the financial kernel were somewhat lower thanthose attained in the Cecchini et al. study, the overall ac-curacy results for the Kirkos et al. and Gaganis methods weresignificantly lower than those reported in their studies (i.e.,15–20 percent). As previously alluded to, this is likely due tothe application of these approaches on an entirely different setof data: U.S. firms from various sectors as opposed to Greekmanufacturing firms (Barth et al. 2008).
In order to further assess the effectiveness of the MetaFraudframework, we ran MetaFraud using the ratios/measuresutilized by Kirkos et al., Gaganis, and Cecchini et al. Wecalled these MF-Kirkos, MF-Gaganis, and MF-Cecchini. Forall three feature sets, we derived the industry and organiza-tional context measures from the quarterly and annual state-ments. For instance, the 7 Gaganis ratios were used to gener-ate 49 annual and 196 quarterly attributes (see Tables 3 and4 for details). Similarly, the 21 Cecchini et al. measures wereused to develop 147 annual and 588 quarterly features. Wethen ran the combined stack and ASL modules and computeda single performance score for all 991 cost settings (i.e., 1:1to 1:100), as done in the previous experiment. Table 17 andFigure 10 show the experiment results.
Based on the table, the results for MF-Cecchini, MF-Gaganis,and MF-Kirkos were considerably better than the best com-parison results reported in Table 16 for both cost settings. Figure 10 shows the ROC curves for MF-Cecchini, MF-Kirkos, and MF-Gaganis and the comparison techniques. MFis also included to allow easier comparisons with the resultsfrom Table 16 and Figure 9. Using MetaFraud improved per-formance for all three feature sets over the best techniquesadopted in prior studies. MF-Cecchini outperformed MF-Kirkos and MF-Gaganis. The lower performance of MF-Kirkos and MF-Gaganis relative to MF-Cecchini was attribu-table to the fact that the ratios of these methods were lesseffective on nonmanufacturing firms. Interestingly, the MF-Cecchini ROC curve was very similar to the one generatedusing MetaFraud with the 12 ratios (i.e., MF). This is becausethe measures employed by Cecchini et al. (2010) includemany of these baseline ratios. Their financial kernel impli-citly developed 8 of the 12 ratios (see “Financial Ratios” fordetails): asset turnover (R2), depreciation index (R5), inven-tory growth (R7), leverage (R8), operating performancemargin (R9), receivables growth (R10), sales growth (R11),and SGE expense (R12). Moreover, they also used variationsof asset quality index (R1) and gross margin index (R6). Onthe flip side, while the larger input feature space for MF-
Cecchini did garner slightly better fraud recall rates (relativeto MF), the legitimate recall values were 4 to 5 percent lowerfor both cost settings. Consequently, MF had a better finan-cial impact than MF-Cecchini. Overall, the results demon-strate the efficacy of MetaFraud as a viable mechanism fordetecting financial fraud.
H5: MetaFraud Versus Comparison Methods
We conducted paired t-tests to compare the performance ofMetaFraud against the seven comparison settings shown inTable 16. We compared cost settings of 5 through 50 inincrements of 1 (n = 46). MetaFraud significantly outper-formed the comparison methods on precision and recall (all p-values < 0.001). We also ran t-tests to compare MF-Kirkos,MF-Gaganis, and MF-Cecchini against their respectivesettings from Table 16. Once again, using MetaFraud signifi-cantly improved performance, with all p-values less than0.001. The t-test results support H5 and suggest that the pro-posed meta-learning framework can enhance fraud detectionperformance over the results achieved by existing methods.
Evaluating MetaFraud in Comparison withExisting Semi-Supervised Learning Methods
In order to demonstrate the effectiveness of the proceduralbias improvement mechanisms incorporated by MetaFraudover existing ensemble-based semi-supervised learningmethods, we compared MetaFraud against Tri-Training (Zhouand Li 2005). Tri-Training has outperformed existing semi-supervised learning methods on several test beds, acrossvarious application domains. It uses an ensemble of threeclassifiers. In each iteration, the predictions of all testinstances where two classifiers j and k agree are added to thethird classifier’s training set (i.e., classifier i) with the pre-dicted class labels, provided that the estimated error rates forinstances where j and k agree has improved since the previousiteration. We ran Tri-Training on the base ratios as well asthose proposed by the three comparison studies. In order toisolate the impact of MetaFraud’s procedural bias improve-ment methods, we ran Tri-Training using the context-basedfeatures for all four sets of ratios (as done with MetaFraud). For Tri-Training, we evaluated various combinations ofclassifiers and found that the best results were generallyattained when using Bayes Net, Logit, and J48 in conjunction. For these three classifiers, we then ran all 991 cost settings asdone in the H5 experiments. Consistent with the settings usedby MetaFraud’s ASL algorithm, Tri-Training was run on testinstances in chronological order (i.e., all year 2000 instanceswere evaluated before moving on to the 2001 data).
MIS Quarterly Vol. 36 No. 4/December 2012 1321

Abbasi et al./A Meta-Learning Framework for Detecting Financial Fraud
Table 17. Results for MetaFraud Using Comparison Methods’ Ratios
Setting AUC
Regulators (Cost 1:10) Investors (Cost 1:20)
Legit Fraud ErrorCost
Legit Fraud ErrorCostPrec. Rec. Prec. Rec. Prec. Rec. Prec. Rec.
MF – Cecchini 0.922 98.2 86.0 33.6 81.7 $116.7 98.3 84.8 32.1 83.4 $485.7
MF – Kirkos 0.851 97.8 80.3 25.9 79.5 $147.1 97.8 71.0 19.5 81.4 $674.9
MF – Gaganis 0.864 97.7 83.0 28.2 77.3 $143.5 98.1 81.1 27.2 81.7 $558.9
Figure 10. ROC Curves for MetaFraud Using Comparison Methods’ Ratios and Comparison Techniques
Table 18. Best Results for Tri-Training Using Four Different Sets of Ratios
Setting AUC
Regulators (Cost 1:10) Investors (Cost 1:20)
Legit Fraud ErrorCost
Legit Fraud ErrorCostPrec. Rec. Prec. Rec. Prec. Rec. Prec. Rec.
TT-Cecchini-BN 0.882 97.7 86.0 32.0 76.0 $135.0 97.9 81.2 26.8 79.7 $594.9
TT-Kirkos-Logit 0.769 97.3 70.9 18.6 77.0 $193.4 97.6 68.2 18.0 80.9 $715.5
TT-Gaganis-J48 0.808 97.1 76.3 21.1 73.3 $183.4 97.7 66.8 17.5 81.4 $721.5
TT-Base-BN 0.845 97.5 84.2 29.1 75.1 $145.6 97.6 79.4 24.5 77.5 $657.2
Figure 11. ROC Curves for MetaFraud and Tri-Training Using Comparison Methods’ Ratios
0
20
40
60
80
100
0 20 40 60 80 100
Cecchini MF-Cecchini MetaFraud
0
20
40
60
80
100
0 20 40 60 80 100Kirkos-NN Kirkos-ID3 Kirkos-BNMF-Kirkos MetaFraud
0
20
40
60
80
100
0 20 40 60 80 100Gaganis-SVM Gaganis-Logit Gaganis-NNMF-Gaganis MetaFraud
0
20
40
60
80
100
0 20 40 60 80 100
TT-Cecchini-LogitTT-Cecchini-BN
TT-Cecchini-J48MF-Cecchini
0
20
40
60
80
100
0 20 40 60 80 100TT-Kirkos-LogitTT-Kirkos-BN
TT-Kirkos-J48MF-Kirkos
TT-Gaganis-LogitTT-Gaganis-BN
TT-Gaganis-J48MF-Gaganis
0
20
40
60
80
100
0 20 40 60 80 100
1322 MIS Quarterly Vol. 36 No. 4/December 2012

Abbasi et al./A Meta-Learning Framework for Detecting Financial Fraud
Table 18 and Figure 11 show the experiment results, in-cluding overall AUC, legit/fraud recall, and error cost perfirm-year for both cost settings. Figure 11 shows the ROCcurves for MF-Cecchini, MF-Kirkos, and MF-Gaganis incomparison with the three Tri-Training classifiers. Based onthe results, it is evident that MetaFraud outperformed Tri-Training, both in terms of best performance results (see thetop of Table 16 and Table 17, versus Table 18) and acrosscost settings. While some settings of Tri-Training improvedperformance over the original methods run with those fea-tures, the performance gains were small in comparison to theimprovements garnered by MF-Cecchini, MF-Gaganis, MF-Kirkos, and MF.
H6: MetaFraud Versus Comparison Ensemble-Based Semi-Supervised Learning Methods
Paired t-tests were used to evaluate the performance ofMetaFraud relative to the Tri-Training results presented inTable 18. P-values for all four evaluation metrics weresignificant across the four feature sets (with all p-values <0.001). The results illustrate how MetaFraud’s utilization ofan elaborate stacked generalization scheme comprised ofseveral top-level classifiers in conjunction with the ASLalgorithm facilitated enhanced procedural bias improvement,and consequently resulted in better fraud detection per-formance, over existing ensemble-based semi-supervisedlearning methods.
Discussion
In this study, we proposed a meta-learning framework forenhanced detection of financial fraud. Our research objectivefor this study was to develop a BI framework that detectedfraud from publicly available financial information withdemonstratively better performance than that obtained byexisting methods. To achieve this objective, we developed adesign artifact—the MetaFraud framework—using principlesfrom meta-learning. We also incorporated ex post sensitivityanalysis as part of the iterative evaluation and refinementprocess in artifact development. This is consistent with thedesign science guideline, “design as a search process”(Hevner et al. 2004, p. 83). Our evaluation of the framework,including the detailed results for H1–H6 as well as theanalyses presented in the appendices, shows the efficacy ofeach component of the MetaFraud framework and demon-strates that the complete framework substantially improvesperformance over existing state-of-the-art methods.
The results from experiment 1 (and H1) demonstrated thatincorporating industry-level and organizational context infor-
mation, whether at the yearly or quarterly level, can improveperformance over just using annual-statement-based ratiosdevoid of context information. In experiment 2, combiningyearly and quarterly information yielded the best results asthey provide complementary information (H2). Experiment2 also supported the notion that the ability of stack classifiersto exploit disparate underlying classifiers enables them to im-prove classification performance (H3). Experiment 3 re-vealed that the proposed adaptive semi-supervised learningalgorithm further improved performance by leveraging theunderlying classifications with the highest confidence levels(H4). Experiments 4 and 5 showed that, collectively, theproposed meta-learning framework was able to outperformcomparison state-of-the-art methods (H5 and H6).
Each phase of the MetaFraud framework is intended toimprove financial fraud detection performance while simul-taneously serving as an input refinement mechanism for theensuing phase of the framework. The first two phasesenhanced declarative bias, while the latter two improvedprocedural bias. For instance, the 12 financial fraud ratios(i.e., the baseline features) were used to generate the yearlyand quarterly context-based feature sets (phase A). Thesefeatures were then used as inputs into the yearly and quarterlycontext-based classifiers (phase B). The classifications fromthese base classifiers were used as input features in thecombined stack classifiers (phase C). The combined stackclassifiers’ classifications were used to inform the adaptivesemi-supervised learning algorithm (phase D). Collectively,the MetaFraud framework improved overall accuracy by 27percent on average as compared to the baseline classifiers,and by 7 to 20 percent over state-of-the-art methods, witheach phase contributing significantly as evidenced by thehypotheses test results.
Conclusions
Consistent with design science, we used a series of experi-ments to rigorously test each component of the MetaFraudframework, as well as to compare the framework to existingstate-of-the-art methods. The experimental results revealedthat the MetaFraud framework was remarkably effective, withlegitimate and fraud recall of over 80 percent for differentstakeholder cost settings (Table 15). The results also showedthat MetaFraud markedly improved performance over existingmethods. Overall, the results confirm the viability of usingmeta-learning methods for enhanced financial fraud detection.
Our research contribution is the development of an innovativeframework for financial fraud detection, which integrates BI
MIS Quarterly Vol. 36 No. 4/December 2012 1323

Abbasi et al./A Meta-Learning Framework for Detecting Financial Fraud
methods into a meta-learning artifact. The MetaFraud frame-work encompasses several important aspects that each con-tribute to its overall effectiveness. The use of organizationaland industry contextual information, taken from quarterly andannual data, provides an effective mechanism for expandingthe fraud detection feature space. Although stacking andsemi-supervised learning have been used previously, we areunaware of any prior work that has similarly integrated anextensive stacked generalization scheme, semi-supervisedlearning, and adaptive/active learning. The unique combina-tion of these elements in our framework (i.e., through the ASLalgorithm) constitutes an important contribution to the frauddetection and BI literature. Specifically, the results ofHypothesis 6 show the effectiveness of this approach overexisting methods. MetaFraud outperformed the Tri-Trainingadaptive-learning approach (Zhou and Li 2005), which hasbeen successfully applied to a dozen problem domains,including credit card approval, credit screening, and web pageclassification.
Another contribution to the domain of fraud detection is theconfidence scores generated by MetaFraud (Figure 4). Forinstance, the proposed approach was able to attain over 90percent legitimate and fraud recall on the 79.2 percent of testinstances with the highest confidence scores. These confi-dence scores can provide a useful decision aid for variousstakeholder groups, analogous to the credit-worthiness ratingsthat are currently available for commercial and governmententities. For instance, investors may wish to shy away fromfirms that are considered fraudulent with a high confidencelevel. Audit firms can leverage these recommendations inorder to better assess the risk associated with new potentialclients. Regulators can use such scores to aid in the appro-priation and prioritization of investigatory resources.
The MetaFraud framework could also influence the designand development of financial fraud detection systems thatintegrate predictive and analytical business intelligence tech-nologies, thereby allowing analysts to draw their ownconclusions (Bay et al. 2006; Coderre 1999; Virdhagriswaranand Dakin 2006). By combining a rich feature set with arobust classification mechanism that incorporates adaptivelearning, meta-learning-based systems could provide fraudrisk ratings, real-time alerts, analysis and visualization offraud patterns (using various financial ratios in the featuresets), and trend analyses of fraud detection patterns over time(utilizing the adaptive learning component). As businessintelligence technologies continue to become more pervasive(Watson and Wixom 2007), such systems could represent agiant leap forward, allowing fraud detection tools to performat their best, when they are combined with human expertise.
References
Abbasi, A., and Chen, H. 2008a. “CyberGate: A Design Frame-work and System for Text Analysis of Computer-MediatedCommunication,” MIS Quarterly (32:4), pp. 811-837.
Abbasi, A., and Chen, H. 2008b. “Writeprints: A StylometricApproach to Identity-level Identification and Similarity Detectionin Cyberspace,” ACM Transactions on Information Systems(26:2), no. 7.
Abbasi, A., and Chen, H. 2009. “A Comparison of Fraud Cues andClassification Methods for Fake Escrow Website Detection,”Information Technology and Management (10), pp. 83-101.
Abbasi, A., Zhang, Z., Zimbra, D., Chen, H., and Nunamaker, Jr.,J. F. 2010. “Detecting Fake Websites: The Contribution ofStatistical Learning Theory,” MIS Quarterly (34:3), pp. 435-461.
Accounting Financial and Tax. 2009. “Using Ratios to DetectFraud and Financial Misstatement,” October 10 (http://accounting-financial-tax.com/2009/10/using-ratios-to-detect-fraud-and-financial-misstatement; accessed July 8, 2010).
Albrecht, C. C., Albrecht, W. S., and Dunn, G. 2001. “CanAuditors Detect Fraud: A Review of the Research Evidence,”Journal of Forensic Accounting (2), pp. 1-12.
Albrecht, W. S., Albrecht, C. C., and Albrecht, C. O. 2004. “Fraudand Corporate Executives: Agency, Stewardship, and BrokenTrust,” Journal of Forensic Accounting (5:1), pp. 109-130.
Albrecht, W. S., Albrecht, C. O., and Albrecht, C. C. 2008.“Current Trends in Fraud and its Detection,” InformationSecurity Journal: A Global Perspective (17), pp. 2-12.
Ameen, E. C., and Strawser, J. R. 1994. “Investigating the Use ofAnalytical Procedures: An Update and Extension,” Auditing: AJournal of Theory and Practice (13:2), pp. 69-76.
Anderson-Lehman, R., Watson, H. J., Wixom, B. H., and Hoffer,J. A. 2004. “Continental Airlines Flies High with Real-TimeBusiness Intelligence,” MIS Quarterly Executive (3:4), pp.163-176.
Ando, R. K., and Zhang, T. 2007. “Two-View Feature GenerationModel for Semi-Supervised Learning,” in Proceedings of the 24th
International Conference on Machine Learning, Corvallis, OR,June 20-24.
Association of Certified Fraud Examiners. 2010. “2010 GlobalFraud Study: Report to the Nations on Occupational Fraud andAbuse,” Association of Certified Fraud Examiners, Austin, TX.
Balcan, M. F., Blum, A., and Yang, K. 2005. “Co-Training andExpansion: Towards Bridging Theory and Practice,” in Ad-vances in Neural Information Processing Systems 17, L. K. Saul,Y. Weiss, and L. Bottou (eds.), Cambridge, MA: MIT Press, pp.89-96.
Bankruptcydata.com. “20 Largest Public Domain Company Bank-rutcy Filings 1980–Present (http://www.bankruptcydata.com/Research/Largest_Overall_All-Time; accessed July 8, 2010).
Barth, M., Landsman, W., and Lang, M. 2008. “InternationalAccounting Standards and Accounting Quality,” Journal ofAccounting Research (46:3), pp. 467-498.
Bay, S., Kumaraswamy, K., Anderle, M. G., Kumar, R., and Steier,D. M. 2006. “Large Scale Detection of Irregularities in Ac-
1324 MIS Quarterly Vol. 36 No. 4/December 2012
Abbasi et al./A Meta-Learning Framework for Detecting Financial Fraud
counting Data,” in Proceedings of the 6th IEEE InternationalConference on Data Mining, Hong Kong, December 18-22,pp. 75-86.
Bayes, T. 1958. “Studies in the History of Probability andStatistics: XI. Thomas Bayes’ Essay Towards Solving a Problemin the Doctrine of Chances,” Biometrika (45), pp. 293-295.
Beasley, M. S., Carcello, C. V., Hermanson, D. R., and Lapides,P. D. 2000. “Fraudulent Financial Reporting: Consideration ofIndustry Traits and Corporate Governance Mechanisms,”Accounting Horizons (14:4), pp. 441-454.
Beneish, M. D. 1999a. “The Detection of Earnings Manipulation,”Financial Analysts Journal (55:5), pp. 24-36.
Beneish, M. D. 1999b. “Incentives and Penalties Related toEarnings Overstatements that Violate GAAP,” The AccountingReview (74:4), pp. 425-457.
Bolton, R. J., and Hand, D. J. 2002. “Statistical Fraud Detection: A Review,” Statistical Science, (17:3), pp. 235-255.
Brachman, R. J., Khabaza, T., Kloesgen, W., Piatetsky-Shapiro, G.,and Simoudis, E. 1996. “Mining Business Databases,” Commu-nications of the ACM (39:11), pp. 42-48.
Brazdil, P., Giraud-Carrier, C., Soares, C., and Vilalta, R. 2008. Metalearning: Applications to Data Mining, Berlin: Springer-Verlag.
Breiman, L. 2001. “Random Forests,” Machine Learning (45:1),pp. 5-32.
Carson, T. 2003. “Self-Interest and Business Ethics: Some Lessonsof the Recent Corporate Scandals,” Journal of Business Ethics(43:4), pp. 389-394.
Cecchini, M., Aytug, H., Koehler, G., and Pathak, P. 2010.“Detecting Management Fraud in Public Companies,”Management Science (56:7), pp. 1146-1160.
Chai, W., Hoogs, B., and Verschueren, B. 2006. “Fuzzy Rankingof Financial Statements for Fraud Detection,” in Proceedings ofthe IEEE International Conference on Fuzzy Systems,Vancouver, BC, July 16-21, pp. 152-158.
Chan, P. K., Fan, W., Prodromidis, A. L., and Stolfo, S. J. 1999. “Distributed Data Mining in Credit Card Fraud Detection,” IEEEIntelligent Systems (14:6), pp. 67-74.
Chan, P., and Stolfo, S. 1993. “Toward Parallel and DistributedLearning by Meta-Learning,” in Proceedings of the KnowledgeDiscovery in Databases Workshop, pp. 227-240.
Chapelle, O., Schölkopf, B., and Zien, A. 2006. Semi-SupervisedLearning, Cambridge, MA: MIT Press.
Charles, S. L., Glover, S. M., and Sharp, N. Y. 2010. “The Asso-ciation Between Financial Reporting Risk and Audit Fees Beforeand After the Historic Events Surrounding SOX,” Auditing: AJournal of Practice and Theory (29:1), pp. 15-39.
Chen, W., and Du, Y. 2009. “Using Neural Networks and DataMining Techniques for the Financial Distress Prediction Model,”Expert Systems with Applications (36), pp. 4075-4086.
Chung, W., Chen, H., and Nunamaker Jr., J. F. 2005. “A VisualFramework for Knowledge Discovery on the Web: An EmpiricalStudy of Business Intelligence Exploration,” Journal of Manage-ment Information Systems (21:4), pp. 57-84.
Coderre, D. 1999. “Computer-Assisted Techniques for FraudDetection,” The CPA Journal (69:8), pp. 57-59.
Cohen, W. W. 1995. “Fast Effective Rule Induction,” in Pro-ceedings of the 12th International Conference on MachineLearning, Tahoe City, CA, July 9-12, pp. 115-123.
Cox, R. A. K., and Weirich, T. R. 2002. “The Stock MarketReaction to Fraudulent Financial Reporting,” ManagerialAuditing Journal (17:7), pp. 374-382.
Dechow, P., Ge, W., Larson, C., and Sloan, R. 2011. “PredictingMaterial Accounting Misstatements,” Contemporary AccountingResearch (28:1), pp. 1-16.
Deloitte. 2010. “Deloitte Poll: Majority Expect More FinancialStatement Fraud Uncovered in 2010 2011,” April 27(http://www.deloitte.com/view/en_US/us/Services/Financial-Advisory-Services/7ba0852e4de38210VgnVCM200000bb42f00aRCRD.htm; accessed July 8, 2010).
Dikmen, B., and Küçükkocaoğlu, G. 2010. “The Detection ofEarnings Manipulation: The Three-Phase Cutting Plane Algo-rithm Using Mathematical Programming,” Journal of Fore-casting (29:5), pp. 442-466.
Dull, R., and Tegarden, D. 2004. “Using Control Charts to MonitorFinancial Reporting of Public Companies,” International Journalof Accounting Information Systems (5:2), pp. 109-127.
Dybowski, R., Laskey, K. B., Myers, J. W., and Parsons, S. 2003. “Introduction to the Special Issue on the Fusion of DomainKnowledge with Data for Decision Support,” Journal of MachineLearning Research (4), pp. 293-294.
Dzeroski, S., and Zenko, B. 2004. “Is Combining Classifiers withStacking Better than Selecting the Best One?” Machine Learning(54:3), pp. 255-273.
Fanning, K. M., and Cogger, K. O. 1998. “Neural Network Detec-tion of Management Fraud Using Published Financial Data,”International Journal of Intelligent Systems in Accounting andFinance Management (7), pp. 21-41.
Fawcett, T., and Provost, F. 1997. “Adaptive Fraud Detection,”Data Mining and Knowledge Discovery (1), pp. 291-316.
Freund, Y., and Mason, L. 1999. “The Alternating Decision TreeLearning Algorithm,” in Proceedings of the 16th InternationalConference on Machine Learning, Bled, Slovenia, June 27-30,pp. 124-133.
Gaganis, C. 2009. “Classification Techniques for the Identificationof Falsified Financial Statements: A Comparative Analysis,”International Journal of Intelligent Systems in Accounting andFinance Management (16), pp. 207-229.
Giraud-Carrier, C., Vilalta, R., and Brazdil, P. 2004. “Introductionto the Special Issue on Meta-Learning,” Machine Learning (54),pp. 187-193.
Green, B. P., and Calderon, T. G. 1995. “Analytical Proceduresand the Auditor’s Capacity to Detect Management Fraud,”Accounting Enquiries: A Research Journal (5:2), pp. 1-48.
Green, B. P., and Choi, J. H. 1997. “Assessing the Risk ofManagement Fraud through Neural Network Technology,”Auditing (16:1), pp. 14-28.
Hansen, J. V., and Nelson, R. D. 2002. “Data Mining of TimeSeries Using Stacked Generalizers,” Neurocomputing (43), pp.173-184.
Hevner, A. R., March, S. T., Park, J., and Ram, S. 2004. “DesignScience in Information Systems Research,” MIS Quarterly(28:1), pp. 75-105.
MIS Quarterly Vol. 36 No. 4/December 2012 1325

Abbasi et al./A Meta-Learning Framework for Detecting Financial Fraud
Hu, M. Y., and Tsoukalas, C. 2003. “Explaining Consumer Choicethrough Neural Networks: The Stacked Generalization Ap-proach,” European Journal of Operational Research (146:3), pp.650-660.
Kaminski, K. A., Wetzel, T. S., and Guan, L. 2004. “Can FinancialRatios Detect Fraudulent Financial Reporting,” ManagerialAuditing Journal (19:1), pp. 15-28.
Kinney, W. R., Jr. 1987. “Attention-Directing Analytical ReviewUsing Accounting Ratios: A Case Study,” Auditing: A Journalof Practice and Theory, Spring, pp. 59-73.
Kirkos, E., Spathis, C., and Manolopoulos, Y. 2007. “Data MiningTechniques for the Detection of Fraudulent Financial State-ments,” Expert Systems with Applications (32), pp. 995-1003.
Kohavi, R. 1996. “Scaling Up the Accuracy of Naïve BayesClassifiers: A Decision Tree Hybrid,” in Proceedings of the 2nd
International Conference on Knowledge Discovery and DataMining, Portland, OR, August 2-4, pp. 202-207.
Kuhn, J. R., Jr., and Sutton, S. G. 2006. “Learning fromWorldCom: Implications for Fraud Detection and ContinuousAssurance,” Journal of Emerging Technologies in Accounting(3), pp. 61-80.
Kuncheva, L. I., and Whitaker, C. J. 2003. “Measures of Diversityin Classifier Ensembles and Their Relationship with theEnsemble Accuracy,” Machine Learning (51:2), pp. 181-207.
Langley, P., Zytkow, J. M., Simon, H. A., and Bradshaw, G. L. 1986. “The Search for Regularity: Four Aspects of ScientificDiscovery,” in Machine Learning: An Artificial IntelligenceApproach, Vol. II, S. R. Michalski, G. J. Carbonell, and M. T.Mitchell (eds.), San Francisco: Morgan Kaufman, pp. 425-470.
Lin, J. W., Hwang, M. I., and Becker, J. D. 2003. “A Fuzzy NeuralNetwork for Assessing the Risk of Fraudulent FinancialReporting,” Managerial Auditing Journal (18:8), pp. 657-665.
Lynam, T. R., and Cormack, G. V. 2006. “On-line Spam FilteringFusion,” in Proceedings of the 29th Annual International ACMSIGIR Conference on Research and Development in InformationRetrieval, Seattle, WA, August 6-11, pp. 123-130.
Maletta, M., and Wright, A. 1996. “Audit Evidence Planning: AnExamination of Industry Error Characteristics,” Auditing: AJournal of Practice and Theory (15), pp. 71-86.
March, S. T., and Smith, G. 1995. “Design and Natural ScienceResearch on Information Technology,” Decision Support Systems(15:4), pp. 251-266.
Markus, M. L., Majchrzak, A., and Gasser, L. 2002. “A DesignTheory for Systems That Support Emergent Knowledge Pro-cesses,” MIS Quarterly (26:3), pp. 179-212.
Martin, B. 1995. “Instance-Based Learning: Nearest Neighborwith Generalization,” unpublished Master’s Thesis, University ofWaikato, Computer Science Department, Hamilton, NewZealand.
Matheus, C. J., and Rendell, L. A. 1989. “Constructive Inductionon Decision Trees,” in Proceedings of the 11th International JointConference on Artificial Intelligence, San Mateo, CA: MorganKaufman, pp. 645-650.
Michalewicz, Z., Schmidt, M., Michalewicz, M., and Chiriac, C.2007. Adaptive Business Intelligence, New York: Springer.
Mitchell, T. M. 1997. Machine Learning, New York: McGraw-Hill.
Persons, O. S. 1995. “Using Financial Statement Data to IdentifyFactors Associated with Fraudulent Financial Reporting,”Journal of Applied Business Research (11:3), pp. 38-46.
Phua, C., Alahakoon, D., and Lee, V. 2004. “Minority Report inFraud Detection: Classification of Skewed Data,” ACM SIGKDDExplorations Newsletter (6:1), pp. 50-59.
Piramuthu, S., Ragavan, H., and Shaw, M. J. 1998. “Using FeatureConstruction to Improve the Performance of Neural Networks,”Management Science (44:3), pp. 416-430.
Quinlan, R. 1986. “Induction of Decision Trees,” MachineLearning (1:1), pp. 81-106.
Rendell, L., Seshu, R., and Tcheng, D. 1987. “Layered Concept-Learning and Dynamically-Variable Bias Management,” in Pro-ceedings of the 10th International Joint Conference on ArtificialIntelligence, San Francisco: Morgan Kaufmann, pp. 308-314.
Shmueli, G., Patel, N., and Bruce, P. 2010. Data Mining forBusiness Intelligence (2nd ed.), Hoboken, NJ: Wiley & Sons.
Sigletos, G., Paliouras, G., Spyropoulos, C. D., and Hatzopoulos, M.2005. “Combining Information Extraction Systems Using Votingand Stacked Generalization,” Journal of Machine LearningResearch (6), pp. 1751-1782.
Spathis, C. T. 2002. “Detecting False Financial Statements UsingPublished Data: Some Evidence from Greece,” ManagerialAuditing Journal (17:14), pp. 179-191.
Spathis, C. T., Doumpos, M., and Zopounidis, C. 2002. “DetectingFalsified Financial Statements: A Comparative Study UsingMulticriteria Analysis and Multivariate Statistical Techniques,”The European Accounting Review (11:3), pp. 509-535.
Stempel, J. 2009. “Fraud Seen Growing Faster in Financial Sec-tor,” Reuters, October 19 (http://www.reuters.com/article/2009/10/19/businesspro-us-fraud-study-idUSTRE59I55920091019).
Storey, V., Burton-Jones, A., Sugumaran, V., and Purao, S. 2008.“CONQUER: A Methodology for Context-Aware Query Pro-cessing on the World Wide Web,” Information Systems Research(19:1), pp. 3-25.
Summers, S. L., and Sweeney, J. T. 1998. “Fraudulently MisstatedFinancial Statements and Insider Trading: An EmpiricalAnalysis,” The Accounting Review (73:1), pp. 131-146.
Tian, Y., Weiss, G. M., and Ma, Q. 2007. “A Semi-SupervisedApproach for Web Spam Detection Using Combinatorial Feature-Fusion,” in Proceedings of the ECML Graph Labeling Work-shops’ Web Spam Challenge, Warsaw, Poland, September 17-21,pp. 16-23.
Ting, K. M., and Witten, I. H. 1997. “Stacked Generalization:When Does It Work?” in Proceedings of the 15th Joint Interna-tional Conference on Artificial Intelligence, San Francisco:Morgan Kaufmann., pp. 866-871.
Tsoumakas, G., Angelis, L., and Vlahavas, I. 2005. “SelectiveFusion of Heterogeneous Classifiers,” Intelligent Data Analysis(9), pp. 511-525.
Vapnik, V. 1999. The Nature of Statistical Learning Theory,Berlin: Springer-Verlag.
Vercellis, C. 2009. Business Intelligence: Data Mining and Opti-mization for Decision Making, Hoboken, NJ: Wiley.
1326 MIS Quarterly Vol. 36 No. 4/December 2012

Abbasi et al./A Meta-Learning Framework for Detecting Financial Fraud
Vilalta, R., and Drissi, Y. 2002. “A Perspective View and Surveyof Meta-Learning,” Artificial Intelligence Review (18), pp. 77-95.
Vilalta, R., Giraud-Carrier, C., Brazdil, P., and Soares, C. 2004.“Using Meta-Learning to Support Data Mining,” InternationalJournal of Computer Science and Applications (1:1), pp. 31-45.
Virdhagriswaran, S., and Dakin, G. 2006. “Camouflaged FraudDetection in Domains with Complex Relationships,” in Pro-ceedings of the 12th ACM SIGKDD Conference on KnowledgeDiscovery and Data Mining, New York: ACM, pp. 941-947.
Walls, J. G., Widmeyer, G. R., and El Sawy, O. A. 1992. “Buildingan Information System Design Theory for Vigilant EIS,”Information Systems Research (3:1), pp. 36-59.
Watson, H. J., and Wixom, B. H. 2007. “The Current State of Busi-ness Intelligence,” IEEE Computer (40:9), pp. 96-99.
Witten, I. H., and Frank, E. 2005. Data Mining: PracticalMachine Learning Tools and Techniques (2nd ed.), San Francisco:Morgan Kaufmann.
Wolpert, D. H. 1992. “Stacked Generalization,” Neural Networks(6), pp. 241-259.
Yue, D., Wu, X., Wang, Y., and Li, Y. 2007. “A Review of DataMining-Based Financial Fraud Detection Research,” inProceedings of the International Conference on Wireless Com-munications Networking and Mobile Computing, Shanghai,September 21-25, pp. 5519-5522.
Zekany, K., Braun, L., and Warder, Z. 2004. “Behind ClosedDoors at WorldCom: 2001,” Issues in Accounting Education(19:10), pp. 101-117.
Zhao, H., Sinha, A. P., and Ge, W. 2009. “Effects of FeatureConstruction on Classification Performance: An Empirical Studyin Bank Failure Prediction,” Expert Systems with Applications(36), pp. 2633-2644.
Zhou, Y., and Goldman, S. 2004. “Democratic Co-learning,” inProceedings of the 16th IEEE International Conference on Toolswith Artificial Intelligence, pp. 594-202.
Zhou, Z. and Li, M. 2005. “Tri-Training: Exploiting UnlabeledData Using Three Classifiers,” IEEE Transactions on Knowledgeand Data Engineering (17:11), pp. 1529-1541.
About the Authors
Ahmed Abbasi is an assistant professor of Information Technologyin the McIntire School of Commerce at the University of Virginia.He received his Ph.D. in MIS from the University of Arizona and anM.B.A. and B.S. in Information Technology from Virginia Tech.His research interests include fraud detection, online security, andtext mining. Ahmed’s projects on Internet fraud and social mediaanalytics have been funded by the National Science Foundation. Hisresearch has appeared, among other outlets, in MIS Quarterly,Journal of Management Information Systems, IEEE Transactions onKnowledge and Data Engineering, IEEE Intelligent Systems, and
ACM Transactions on Information Systems. He is a member of theAIS and IEEE.
Conan C. Albrecht is an associate professor in the InformationSystems Department at the Marriott School of Management,Brigham Young University. He received his Ph.D. in MIS from theUniversity of Arizona and his Master’s of Accountancy fromBrigham Young University. His research is focused on algorithmsand data structures that support computer-based fraud detection.Conan has been involved in fraud detection systems at BritishPetroleum, the World Bank, and the State of North Carolina, and hehas trained auditors and fraud detectives for the Association ofCertified Fraud Examiners. His work is published in ComputationalIntelligence, Decision Support Systems, Communications of theACM, Information & Management, and IEEE Transactions onSystems, Man, and Cybernetics. Conan is the author of the Picaloopen source fraud detection system, available athttp://www.picalo.org.
Anthony Vance is as an assistant professor in the InformationSystems Department at the Marriott School of Management, Brig-ham Young University. He has earned Ph.D. degrees in InformationSystems from Georgia State University, USA; the University ofParis–Dauphine, France; and the University of Oulu, Finland. Hereceived a Master’s of Information Systems Management fromBrigham Young University, during which he was also enrolled in theIS Ph.D. preparation program. His previous experience includesworking as a visiting research professor in the Information SystemsSecurity Research Center at the University of Oulu, where heremains a research fellow. He also worked as an informationsecurity consultant and fraud analyst for Deloitte. His work ispublished in MIS Quarterly, Journal of Management InformationSystems, European Journal of Information Systems, Journal of theAmerican Society for Information Science and Technology, Infor-mation & Management, Journal of Organizational and End UserComputing, and Communications of the AIS. His research interestsare information security and trust in information systems.
James V. Hansen is the J. Owen Cherrington Professor of Infor-mation Systems in the Information Systems Department at theMarriott School of Management, Brigham Young University. Hereceived his Ph.D. in Computer Science (Machine Learning) fromthe University of Washington, Seattle. He is an associate editor forIEEE Intelligent Systems and a former associate editor forAccounting Review. His research focus is on machine learning anddata mining, with related publications appearing in ManagementScience, MIS Quarterly, ACM Computing Surveys, ComputationalIntelligence, IEEE Transactions on Neural Networks and Learning,IEEE Transactions on Knowledge and Data Engineering, Commu-nications of the ACM, Decision Support Systems, and DecisionSciences, among others.
MIS Quarterly Vol. 36 No. 4/December 2012 1327

1328 MIS Quarterly Vol. 36 No. 4/December 2012

SPECIAL ISSUE: BUSINESS INTELLIGENCE RESEARCH
METAFRAUD: A META-LEARNING FRAMEWORK FORDETECTING FINANCIAL FRAUD
Ahmed AbbasiMcIntire School of Commerce, University of Virginia,
Charlottesville, VA 22908 U.S.A. {[email protected]}
Conan Albrecht, Anthony Vance, and James HansenInformation Systems Department, Marriott School of Management, Brigham Young University,
Provo, UT 84606 U.S.A. {[email protected]} {[email protected]} {[email protected]}
Appendix A
Comparing Context-Based Classifiers Against Baseline ClassifiesUsing Regulators’ Cost Settings
This appendix reports the results for the baseline and yearly/quarterly context-based classifiers when using the 1:10 regulator cost setting. Sincethe AUC values are computed across different cost settings (and are therefore the same for the investor and regulator situations), we report onlythe legitimate/fraud recall rates. Overall AUC values as well as results for the investor cost setting (1:20) can be found in the subsection“Comparing Context-Based Classifiers Against Baseline Classifiers” of the main paper.
Table A1 shows the results for the baseline classifiers. Tables A2 and A3 show the results for the yearly and quarterly context-based classifiers(i.e., the 14 classifiers coupled with the 84 and 336 yearly/quarterly context-based features, respectively). For all three feature sets, the mostbalanced results were attained using Logit. In comparison with the baseline classifiers, the yearly and quarterly context-based classifiers hadfraud recall rates that were over 20 percent higher on average, coupled with slightly higher average legit recall values. Similar to the investorsituation, even when using regulators’ cost settings, the yearly and quarterly context-based classifiers’ results were quite diverse with respectto their legit and fraud recall rates.
Table A1. Baseline Results
Classifier
Legit Fraud
Classifier
Legit Fraud
Prec. Rec. Prec. Rec. Prec. Rec. Prec. Rec.
SVM-Lin 91.0 60.1 6.4 31.5 ADTree 93.8 58.7 10.3 55.0
LogitReg 95.9 71.0 16.1 64.6 RandForest 95.1 72.7 15.3 57.0
J48 94.9 71.0 14.3 56.2 NBTree 95.0 89.8 27.7 45.2
BayesNet 95.3 77.6 17.7 55.8 REPTree 93.6 70.4 11.4 44.3
NaiveBayes 92.1 53.3 8.0 47.2 JRip 93.3 84.7 14.5 30.1
SVM-RBF 89.4 65.5 2.6 10.5 NNge 92.2 78.1 8.6 23.7
SVM-Poly 91.1 56.0 6.7 36.4 NeuralNet 92.1 60.0 8.0 40.1
MIS Quarterly Vol. 36 No. 4—Appendices/December 2012 A1

Abbasi et al./A Meta-Learning Framework for Detecting Financial Fraud
Table A2. Yearly Context-Based Classifiers
Classifier
Legit Fraud
Classifier
Legit Fraud
Prec. Rec. Prec. Rec. Prec. Rec. Prec. Rec.
SVM-Lin 98.7 50.0 13.7 92.2 ADTree 97.6 65.5 16.9 81.2
LogitReg 96.7 83.5 26.0 67.0 RandForest 96.2 73.4 17.7 66.3
J48 93.6 84.1 15.2 33.0 NBTree 95.9 82.4 22.7 59.7
BayesNet 96.0 75.5 18.3 63.3 REPTree 95.5 63.2 13.3 65.5
NaiveBayes 97.6 61.0 15.5 82.9 JRip 94.6 70.7 13.5 53.1
SVM-RBF 94.1 64.9 11.4 52.6 NNge 93.9 74.7 13.1 44.0
SVM-Poly 97.9 60.0 15.5 85.1 NeuralNet 94.3 68.0 12.3 52.1
Table A3. Quarterly Context-Based Classifiers
Classifier
Legit Fraud
Classifier
Legit Fraud
Prec. Rec. Prec. Rec. Prec. Rec. Prec. Rec.
SVM-Lin 98.1 65.6 17.6 85.1 ADTree 97.7 55.4 14.1 85.1
LogitReg 96.0 71.5 16.5 65.3 RandForest 93.6 95.5 32.0 24.7
J48 95.3 92.9 36.2 46.7 NBTree 93.6 93.9 26.6 25.7
BayesNet 95.2 69.5 14.4 59.7 REPTree 96.7 57.0 13.5 77.5
NaiveBayes 96.7 52.3 12.6 79.5 JRip 95.0 64.1 12.8 61.1
SVM-RBF 97.7 62.2 16.0 83.4 NNge 93.0 82.7 12.3 28.1
SVM-Poly 96.2 76.3 19.2 65.3 NeuralNet 94.1 67.0 11.9 51.6
Appendix B
Evaluating Stacked Classifiers Using Regulators’ Cost Settings
Rhis appendix reports the results for the yearly, quarterly, and combined stack classifiers when using the 1:10 regulator cost setting. TablesB1 and B2 show the legitimate and fraud recall results for the yearly and quarterly stack classifiers. Not surprisingly, the increased cost of falsepositives (as compared to false negatives) for the regulator setting resulted in higher legitimate recall rates relative to the investor setting (seethe subsection “Evaluating Stacked Classifiers” for the investor setting results). For instance, the annual stack using a top-level Logit classifierimproved its legitimate recall rate by over 20 percent when using the regulator cost setting. This is important since it would result in 20 percentfewer unnecessary audits (over 900 fewer based on our test bed), albeit with 13 percent fewer frauds detected. On average, the quarterlycontext-based classifiers had 15 percent higher fraud recall and 7 percent lower legitimate recall rates.
Table B1. Yearly Stack Classifiers
Classifier
Legit Fraud
Classifier
Legit Fraud
Prec. Rec. Prec. Rec. Prec. Rec. Prec. Rec.
SVM-Lin 98.3 69.8 19.8 86.1 ADTree 74.2 33.3 21.1 79.7
LogitReg 97.1 93.5 47.4 68.2 RandForest 82.5 35.2 24.2 64.5
J48 96.9 82.5 25.4 68.9 NBTree 82.7 36.2 24.9 66.5
BayesNet 96.8 85.7 28.9 67.5 REPTree 73.0 30.7 19.3 74.8
NaiveBayes 96.9 82.0 25.1 69.7 JRip 81.5 36.8 24.8 70.9
SVM-RBF 97.2 84.4 28.4 71.6 NNge 79.1 33.4 22.1 68.5
SVM-Poly 96.8 77.5 21.2 70.2 NeuralNet 75.0 32.7 20.8 76.0
A2 MIS Quarterly Vol. 36 No. 4—Appendices/December 2012

Abbasi et al./A Meta-Learning Framework for Detecting Financial Fraud
Table B2. Quarterly Stack Classifiers
Classifier
Legit Fraud
Classifier
Legit Fraud
Prec. Rec. Prec. Rec. Prec. Rec. Prec. Rec.
SVM-Lin 98.2 68.5 19.0 85.8 ADTree 99.6 67.7 20.6 96.8
LogitReg 97.4 86.9 32.8 73.6 RandForest 97.7 77.2 23.1 79.2
J48 98.3 70.7 20.2 85.8 NBTree 99.0 71.7 21.8 91.4
BayesNet 98.4 82.3 29.1 84.1 REPTree 98.8 68.0 19.6 90.5
NaiveBayes 97.4 68.5 17.8 79.0 JRip 99.0 67.9 19.9 92.4
SVM-RBF 99.2 84.5 33.9 92.2 NNge 97.5 74.2 20.7 78.0
SVM-Poly 98.7 69.5 20.3 89.7 NeuralNet 97.9 77.0 23.4 81.2
Table B3 shows the results for the combined stack classifiers, which used the yearly and quarterly context-based classifiers’ classifications asinput. As with the investor cost setting, the combined stacks using the regulator cost setting leveraged the enhanced legitimate recall rates fromthe yearly stacks and the improved fraud recall associated with the quarter stacks for enhanced, and generally more balanced performance.For instance, the combined stack using a Logit top-level classifier improved fraud recall by 4 percent over the annual stack, while providingsomewhat comparable legitimate recall.
Table B3. Combined Stack Classifiers
Classifier
Legit Fraud
Classifier
Legit Fraud
Prec. Rec. Prec. Rec. Prec. Rec. Prec. Rec.
SVM-Lin 97.8 80.3 25.7 79.0 ADTree 99.1 82.0 30.5 91.4
LogitReg 97.5 93.1 47.4 72.2 RandForest 96.4 96.1 56.4 57.9
J48 97.2 85.0 29.1 71.5 NBTree 98.8 79.9 27.6 88.5
BayesNet 97.7 86.1 32.1 76.0 REPTree 98.6 79.9 27.2 87.3
NaiveBayes 97.3 91.4 41.7 70.9 JRip 98.7 82.3 29.8 87.0
SVM-RBF 98.4 85.4 33.2 83.9 NNge 95.3 94.4 41.2 45.7
SVM-Poly 97.2 93.0 46.1 69.2 NeuralNet 98.6 82.0 29.4 86.6
Appendix C
Evaluating Adaptive Semi-supervised Learning using Regulators’ Cost Settings
This appendix reports the results for the adaptive semi-supervised learning (ASL) classifiers when using the 1:10 regulator cost setting. TableC1 shows the legitimate and fraud recall rates. On average, using ASL improved legitimate and fraud recall by 4.7 percent and 2.2 percent,respectively. Many of the classifiers attained legitimate recall rates over 90 percent. For instance, running ASL with the Logit classifierresulted in the correct classification of approximately 95 percent of the legitimate firm instances. These settings could provide a morepracticable decision aid for regulators since the number of false positives would be more manageable (5 percent, or 237 of our legitimate testinstances), while still identifying a fair amount of fraud (77 percent, or 315 of our fraud test instances).
MIS Quarterly Vol. 36 No. 4—Appendices/December 2012 A3

Abbasi et al./A Meta-Learning Framework for Detecting Financial Fraud
Table C1. Adaptive Semi-Supervised Learning
Classifier
Legit Fraud
Classifier
Legit Fraud
Prec. Rec. Prec. Rec. Prec. Rec. Prec. Rec.
SVM-Lin 98.2 88.1 36.9 80.9 ADTree 99.2 89.3 42.5 91.4
LogitReg 98.0 95.0 57.1 77.0 RandForest 97.1 96.5 62.2 66.7
J48 97.5 92.2 44.5 72.6 NBTree 98.7 89.5 41.6 86.8
BayesNet 98.1 92.0 46.2 79.2 REPTree 98.4 88.0 37.5 83.6
NaiveBayes 97.5 92.4 45.4 72.9 JRip 98.6 88.0 38.1 85.6
SVM-RBF 98.7 87.9 38.3 87.0 NNge 96.1 98.5 75.7 54.0
SVM-Poly 97.6 92.8 46.9 73.3 NeuralNet 98.7 86.1 35.0 87.0
Appendix D
Analysis of Error Costs and Savings for the Regulators’ Cost Setting
We conducted in-depth analysis of the financial impact of various components of MetaFraud relative to the baseline and comparison classifiersfor the regulator cost setting (1:10). Applying a cost of $443,000 to each false positive and $4,100,000 to each false negative, we computedthe error cost per firm-year for each technique evaluated in the first three subsections of the “Evaluation” section of the main paper (H1–H4),including the baseline, context-based classifiers, stack classifiers, and ASL. Table D1 shows the mean error cost results (in thousands ofdollars), averaged across the 14 classifiers, for each of the aforementioned approaches. The first three columns depict the mean cost of falsepositives, mean cost of false negatives, and mean error cost per firm-year. In order to provide context, we also computed two naïve baselines: the error costs of auditing every firm (or none) in our test bed. For the former, this cost would simply be $443,000 multiplied by the 4,735 legitinstances, while for the latter, it would be $4,100,000 multiplied by the 409 fraud cases in the test set. In both cases, these total costs weredivided by the total number of test firm-years to give the costs per case. These values are presented in the first two rows of Table D1 whilethe last two columns provide an indication of how cost effective various approaches were relative to these two basic situations.
Based on the table, it is evident that each subsequent component of MetaFraud further improved error costs (and savings) over the baselineclassifiers as well as the two basic situations. Interestingly, the baseline classifiers only provided a savings of $120.9M over not auditing anyfirms, underscoring the potentially grave financial ramifications of using highly inaccurate fraud detection methods as decision aids. In contrast,using ASL provided savings of $1.1B over not auditing at all.
Table D1. Mean Error Costs and Savings for Various Approaches
Approach
Cost ofFalse
PositivesCost of False
NegativesTotal Error Cost
Per InstanceSavings vs.
Audit AllSavings vs. Audit None
Audit All $407.8 $0.0 $407.8 $0.0 ($81.8)
Audit None $0.0 $326.0 $326.0 $81.8 $0.0
Baseline Classifiers $122.7 $186.2 $308.9 $98.9 $17.1
Yearly Context-based $122.6 $113.9 $236.5 $171.2 $89.4
Quarterly Context-based $113.3 $128.6 $241.9 $165.9 $84.1
Yearly Stacks $78.9 $93.5 $172.4 $235.4 $153.6
Quarterly Stacks $107.4 $45.5 $152.9 $254.9 $173.1
Combined Stacks $53.7 $80.1 $133.8 $274.0 $192.2
ASL $34.5 $71.4 $102.1 $305.7 $223.9
A4 MIS Quarterly Vol. 36 No. 4—Appendices/December 2012
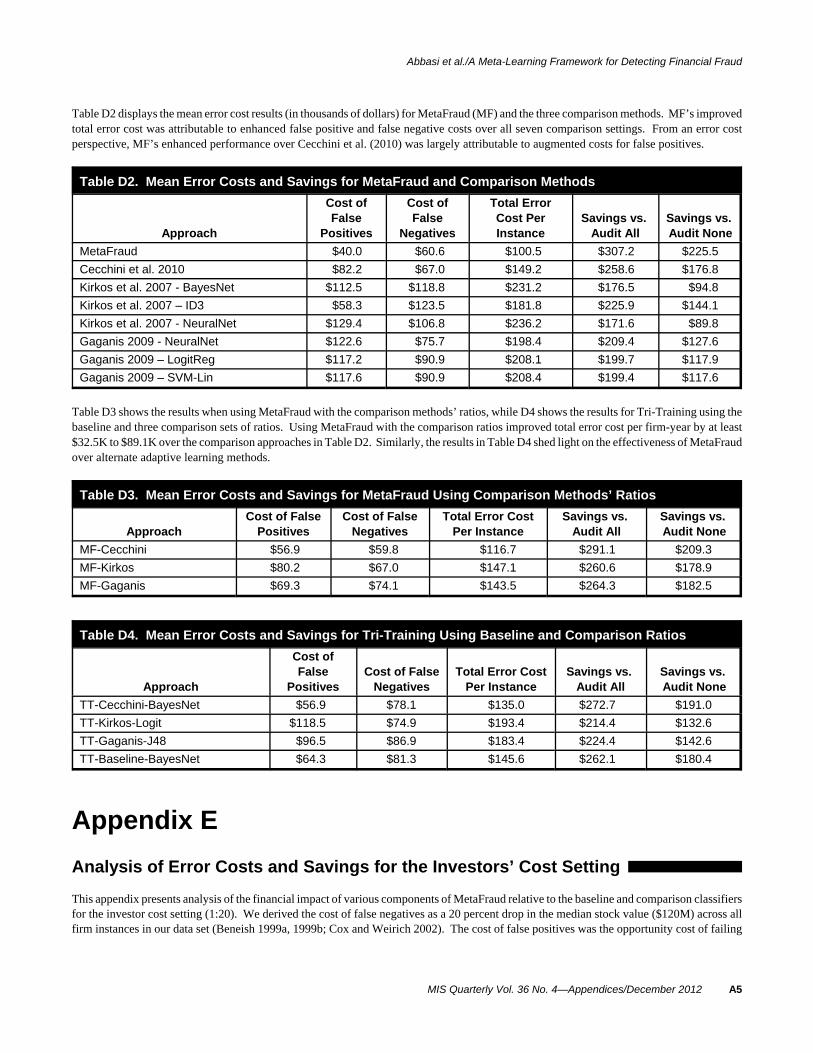
Abbasi et al./A Meta-Learning Framework for Detecting Financial Fraud
Table D2 displays the mean error cost results (in thousands of dollars) for MetaFraud (MF) and the three comparison methods. MF’s improvedtotal error cost was attributable to enhanced false positive and false negative costs over all seven comparison settings. From an error costperspective, MF’s enhanced performance over Cecchini et al. (2010) was largely attributable to augmented costs for false positives.
Table D2. Mean Error Costs and Savings for MetaFraud and Comparison Methods
Approach
Cost ofFalse
Positives
Cost ofFalse
Negatives
Total ErrorCost PerInstance
Savings vs. Audit All
Savings vs. Audit None
MetaFraud $40.0 $60.6 $100.5 $307.2 $225.5
Cecchini et al. 2010 $82.2 $67.0 $149.2 $258.6 $176.8
Kirkos et al. 2007 - BayesNet $112.5 $118.8 $231.2 $176.5 $94.8
Kirkos et al. 2007 – ID3 $58.3 $123.5 $181.8 $225.9 $144.1
Kirkos et al. 2007 - NeuralNet $129.4 $106.8 $236.2 $171.6 $89.8
Gaganis 2009 - NeuralNet $122.6 $75.7 $198.4 $209.4 $127.6
Gaganis 2009 – LogitReg $117.2 $90.9 $208.1 $199.7 $117.9
Gaganis 2009 – SVM-Lin $117.6 $90.9 $208.4 $199.4 $117.6
Table D3 shows the results when using MetaFraud with the comparison methods’ ratios, while D4 shows the results for Tri-Training using thebaseline and three comparison sets of ratios. Using MetaFraud with the comparison ratios improved total error cost per firm-year by at least$32.5K to $89.1K over the comparison approaches in Table D2. Similarly, the results in Table D4 shed light on the effectiveness of MetaFraudover alternate adaptive learning methods.
Table D3. Mean Error Costs and Savings for MetaFraud Using Comparison Methods’ Ratios
ApproachCost of False
PositivesCost of False
NegativesTotal Error Cost
Per InstanceSavings vs.
Audit AllSavings vs. Audit None
MF-Cecchini $56.9 $59.8 $116.7 $291.1 $209.3
MF-Kirkos $80.2 $67.0 $147.1 $260.6 $178.9
MF-Gaganis $69.3 $74.1 $143.5 $264.3 $182.5
Table D4. Mean Error Costs and Savings for Tri-Training Using Baseline and Comparison Ratios
Approach
Cost ofFalse
PositivesCost of False
NegativesTotal Error Cost
Per InstanceSavings vs.
Audit AllSavings vs. Audit None
TT-Cecchini-BayesNet $56.9 $78.1 $135.0 $272.7 $191.0
TT-Kirkos-Logit $118.5 $74.9 $193.4 $214.4 $132.6
TT-Gaganis-J48 $96.5 $86.9 $183.4 $224.4 $142.6
TT-Baseline-BayesNet $64.3 $81.3 $145.6 $262.1 $180.4
Appendix E
Analysis of Error Costs and Savings for the Investors’ Cost Setting
This appendix presents analysis of the financial impact of various components of MetaFraud relative to the baseline and comparison classifiersfor the investor cost setting (1:20). We derived the cost of false negatives as a 20 percent drop in the median stock value ($120M) across allfirm instances in our data set (Beneish 1999a, 1999b; Cox and Weirich 2002). The cost of false positives was the opportunity cost of failing
MIS Quarterly Vol. 36 No. 4—Appendices/December 2012 A5

Abbasi et al./A Meta-Learning Framework for Detecting Financial Fraud
to invest in a legitimate firm; this was computed as a 1 percent increase in the median stock value. Hence, for the investor setting, we usedfalse negative costs of $24 million and false positive costs of $1.2 million. It is important to note that these values are approximations of themedian total costs for such firm instances, across all investors. Costs for individual investors would vary depending upon the percentage oftotal stock acquired in a specific firm.
Using these two values, we computed the error cost for each technique evaluated in the first three subsections of the “Evaluation” section ofthe main paper (H1–H4), including the baseline, context-based classifiers, stack classifiers, and ASL. Table E1 shows the mean error costresults (in thousands of dollars), averaged across the 14 classifiers, for each of the aforementioned approaches. The first three columns depictthe mean cost of false positives, mean cost of false negatives, and mean total error cost per firm-year.
From the table, it is apparent that the various components of MetaFraud improved error costs over the baseline classifiers. In general, errorcosts decreased with each subsequent phase of MetaFraud with the exception of the quarterly stack classifiers, which had lower false negativerates as compared to the combined stacks. This was largely attributable to the fact that five of the quarterly stack classifiers had fraud recallrates above 90 percent (see Table B2 in Appendix B for details). Given the hefty costs exacted by false negatives on investors, these classifiers’high fraud recall rates caused the quarterly stacks to have the lowest mean total false negative costs in Table E1. However, ASL still had thebest total error cost, due to a relatively better balance between false positive and false negative costs. ASL provided cost savings of over $880Kper instance over the baseline classifiers.
Table E1. Mean Error Costs and Savings for Various Approaches
ApproachCost of False
PositivesCost of False
NegativesTotal Error Cost Per
Instance
Baseline Classifiers $372.0 $1,002.0 $1,374.0
Yearly Context-based $392.6 $559.5 $952.2
Quarterly Context-based $348.7 $661.4 $1,010.1
Yearly Stacks $279.3 $435.0 $714.3
Quarterly Stacks $348.7 $201.3 $550.0
Combined Stacks $198.6 $388.0 $586.5
ASL $121.3 $371.8 $493.2
Table E2 displays the mean error cost per firm-year results (in thousands of dollars) for MetaFraud (MF) and the three comparison methods. MF had the lowest false positive and false negative costs as compared to the seven comparison setting. From an error cost perspective, MF’senhanced performance over Cecchini et al. (2010) was once again largely attributable to augmented costs for false positives (approximately$165K lower per instance).
Table E2. Mean Error Costs and Savings for MetaFraud and Comparison Methods
ApproachCost of False
PositivesCost of False
NegativesTotal Error Cost Per
Instance
MetaFraud $114.5 $326.6 $441.1
Cecchini et al. 2010 $279.9 $340.6 $620.5
Kirkos et al. 2007 - BayesNet $383.3 $401.2 $784.5
Kirkos et al. 2007 – ID3 $293.7 $625.2 $918.9
Kirkos et al. 2007 - NeuralNet $395.2 $466.6 $861.7
Gaganis, 2009 - NeuralNet $381.6 $373.3 $754.9
Gaganis, 2009 – LogitReg $349.7 $438.6 $788.3
Gaganis, 2009 – SVM-Lin $370.0 $405.9 $775.9
Table E3 shows the results when using MetaFraud with the comparison methods’ ratios, while E4 shows the results for Tri-Training using thebaseline and three comparison sets of ratios. Using MetaFraud with the comparison ratios improved total error cost by at least $109K per firm-year over the comparison results presented in Table E2. Similarly, based on the results presented in Table E4, MetaFraud outperformed Tri-Training by $40K to over $162K in terms of error costs. The results in Table E4 shed light on the effectiveness of MetaFraud over alternateadaptive learning methods.
A6 MIS Quarterly Vol. 36 No. 4—Appendices/December 2012
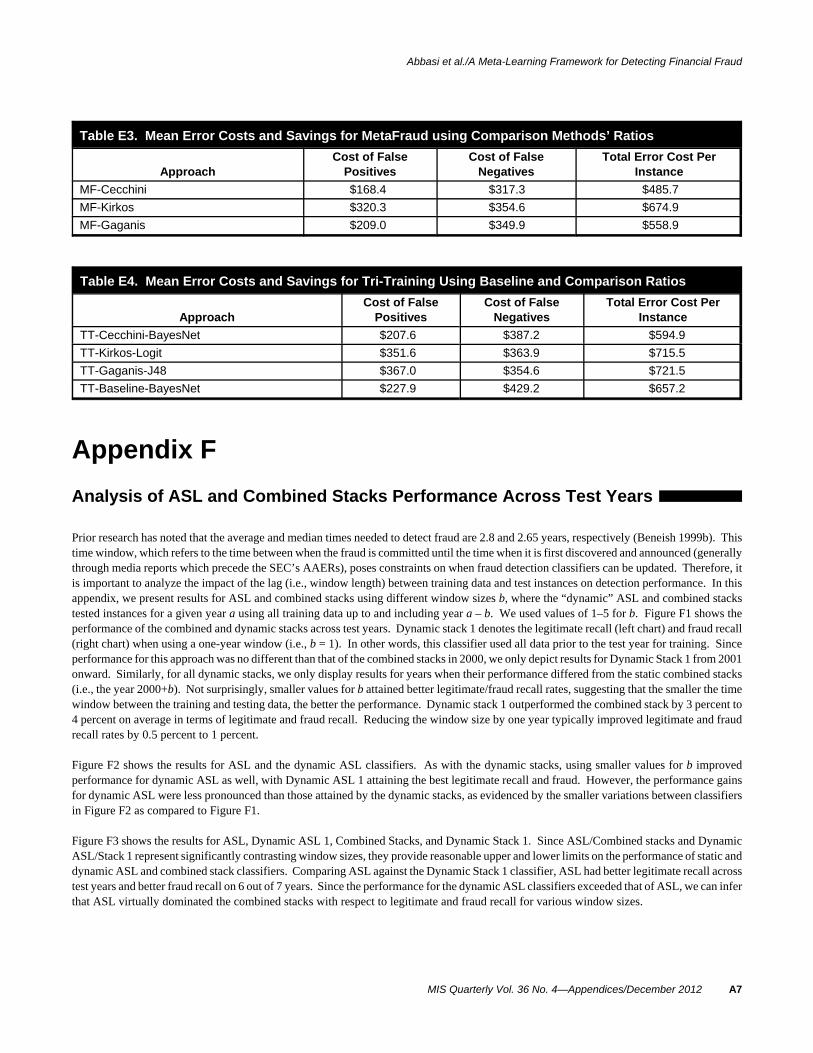
Abbasi et al./A Meta-Learning Framework for Detecting Financial Fraud
Table E3. Mean Error Costs and Savings for MetaFraud using Comparison Methods’ Ratios
ApproachCost of False
PositivesCost of False
NegativesTotal Error Cost Per
Instance
MF-Cecchini $168.4 $317.3 $485.7
MF-Kirkos $320.3 $354.6 $674.9
MF-Gaganis $209.0 $349.9 $558.9
Table E4. Mean Error Costs and Savings for Tri-Training Using Baseline and Comparison Ratios
ApproachCost of False
PositivesCost of False
NegativesTotal Error Cost Per
Instance
TT-Cecchini-BayesNet $207.6 $387.2 $594.9
TT-Kirkos-Logit $351.6 $363.9 $715.5
TT-Gaganis-J48 $367.0 $354.6 $721.5
TT-Baseline-BayesNet $227.9 $429.2 $657.2
Appendix F
Analysis of ASL and Combined Stacks Performance Across Test Years
Prior research has noted that the average and median times needed to detect fraud are 2.8 and 2.65 years, respectively (Beneish 1999b). Thistime window, which refers to the time between when the fraud is committed until the time when it is first discovered and announced (generallythrough media reports which precede the SEC’s AAERs), poses constraints on when fraud detection classifiers can be updated. Therefore, itis important to analyze the impact of the lag (i.e., window length) between training data and test instances on detection performance. In thisappendix, we present results for ASL and combined stacks using different window sizes b, where the “dynamic” ASL and combined stackstested instances for a given year a using all training data up to and including year a – b. We used values of 1–5 for b. Figure F1 shows theperformance of the combined and dynamic stacks across test years. Dynamic stack 1 denotes the legitimate recall (left chart) and fraud recall(right chart) when using a one-year window (i.e., b = 1). In other words, this classifier used all data prior to the test year for training. Sinceperformance for this approach was no different than that of the combined stacks in 2000, we only depict results for Dynamic Stack 1 from 2001onward. Similarly, for all dynamic stacks, we only display results for years when their performance differed from the static combined stacks(i.e., the year 2000+b). Not surprisingly, smaller values for b attained better legitimate/fraud recall rates, suggesting that the smaller the timewindow between the training and testing data, the better the performance. Dynamic stack 1 outperformed the combined stack by 3 percent to4 percent on average in terms of legitimate and fraud recall. Reducing the window size by one year typically improved legitimate and fraudrecall rates by 0.5 percent to 1 percent.
Figure F2 shows the results for ASL and the dynamic ASL classifiers. As with the dynamic stacks, using smaller values for b improvedperformance for dynamic ASL as well, with Dynamic ASL 1 attaining the best legitimate recall and fraud. However, the performance gainsfor dynamic ASL were less pronounced than those attained by the dynamic stacks, as evidenced by the smaller variations between classifiersin Figure F2 as compared to Figure F1.
Figure F3 shows the results for ASL, Dynamic ASL 1, Combined Stacks, and Dynamic Stack 1. Since ASL/Combined stacks and DynamicASL/Stack 1 represent significantly contrasting window sizes, they provide reasonable upper and lower limits on the performance of static anddynamic ASL and combined stack classifiers. Comparing ASL against the Dynamic Stack 1 classifier, ASL had better legitimate recall acrosstest years and better fraud recall on 6 out of 7 years. Since the performance for the dynamic ASL classifiers exceeded that of ASL, we can inferthat ASL virtually dominated the combined stacks with respect to legitimate and fraud recall for various window sizes.
MIS Quarterly Vol. 36 No. 4—Appendices/December 2012 A7

Abbasi et al./A Meta-Learning Framework for Detecting Financial Fraud
Figure F1. Performance for Combined and Dynamic Stack Across Test Years
Figure F2. Performance for ASL and Dynamic Stack Across Test Years
Figure F3. Performance of ASL and Combined Stack Across Test Years Using a Window Size of OneYear (b = 1) for Dynamic Classifiers
A8 MIS Quarterly Vol. 36 No. 4—Appendices/December 2012

Abbasi et al./A Meta-Learning Framework for Detecting Financial Fraud
Appendix G
Analysis of MetaFraud’s Base, Stack, and ASL Classifiers
In this study, MetaFraud was run using the expanded feature space (comprised of organizational and industry context features), 28 contextclassifiers (14 quarterly and 14 yearly), 14 stack classifiers, and ASL. In this appendix, we evaluate the impact of model tuning on overall frauddetection performance. The most obvious areas where model tuning could be performed would be to (1) tune the input (base) context-basedclassifiers used by the combined stacks, in terms of quantity and composition; (2) similarly tune the stack classifiers used by ASL as input;and (3) tune the threshold used by ASL to guide inclusion of test cases in the training set during the next iteration. We focused on all threeareas. For each, we attempted to retrospectively derive near-optimal performance levels using results on the test cases, in order to gain insightsinto potential optimal performance levels attainable using model tuning.
1. Tuning the Quantity and Composition of Context-Based Classifiers Utilized by the Stacks
For #2, we performed analysis to see which of the 28 base context-based classifiers were useful to the 14 stack classifiers’ performance. Eachof the 14 stack classifiers was run using different combinations of underlying context-based classifiers. Due to computational constraints, wecould not evaluate every single combination. With 2n – 1 possible combinations, setting n to 28 would have resulted in over 268 millioncombinations for each stack classifier. Therefore, we set n to 14, and treated both the yearly and quarterly context-based classifiers as a pairthat were always simultaneously included or excluded. For instance, assuming that each combination could be represented as a binary string,where a “1” indicated that a particular classifier was included while a “0” signified exclusion, in the combination “01111111111111,” the firstcontext-based classifier (SVM-Lin) would be excluded while the remaining 13 would be included. This would result in 26 classifiers included(13 yearly and 13 quarterly), while both the yearly and quarterly SVM-Lin classifiers would be omitted. We ran all 16,383 resultingcombinations separately for each of the 14 stack classifiers. For each stack, the single setting that yielded the best performance on the testinstances, across both the regulator and investor cost settings, was reported. We refer to these results as local optima since considering theyearly and quarterly classifiers as a dependent pair in the solution space causes us to exclude many viable solutions.
Tables G1 and G2 show the analysis results. Table G1 depicts the number of underlying context-based classifiers employed by each combinedstack, as well as the resulting legitimate and fraud recall rates for the investor and regulator cost settings. Table G2 shows the performancegains with respect to legitimate and fraud recall when using the local optima settings, as compared to using all 28 underlying context-basedclassifiers. As depicted in Table G2, these local optima resulted in average gains in legitimate recall of 1 percent to 2 percent and improvementsin fraud recall of 2 percent to 4 percent across the two cost settings. Based on Table G1, it is evident that the ideal quantity of underlyingcontext classifiers varied from 8 to 20, depending on the top-level classifier employed in the stack.
Table G1. Local Optima Performance of Combined Stack Classifiers for Investor and Regulator Settings
Investor Cost Setting (1:20) Regulator Cost Setting (1:10)
ClassifierNo. of
Classifiers
Legit Fraud Legit Fraud
Prec. Rec. Prec. Rec. Prec. Rec. Prec. Rec.
SVM-Lin 14 98.4 88.4 38.3 83.6 97.7 87.8 35.0 76.0
LogitReg 18 98.2 89.1 39.1 81.2 98.1 90.5 42.2 80.2
J48 10 98.6 77.1 24.8 87.8 98.3 83.4 30.2 83.1
BayesNet 16 98.5 81.2 28.3 85.8 98.5 85.7 34.0 85.1
NaiveBayes 14 98.3 84.7 31.9 83.1 97.7 91.2 42.4 74.8
SVM-RBF 12 99.0 76.9 25.4 91.0 98.3 86.0 33.9 83.1
SVM-Poly 20 97.5 88.9 36.6 74.1 98.1 87.7 36.2 80.7
ADTree 16 98.0 84.7 31.1 80.2 98.9 87.1 37.3 88.5
RandForest 8 98.5 81.8 28.8 85.3 98.2 84.5 31.5 82.4
NBTree 8 98.3 84.0 30.9 83.1 98.4 87.7 36.9 83.1
REPTree 8 98.5 81.1 28.1 85.3 98.3 88.1 37.3 82.2
JRip 14 98.7 82.0 29.6 87.5 98.4 86.3 34.6 84.1
NNge 16 97.3 87.9 33.8 71.4 97.4 90.1 38.7 72.1
NeuralNet 8 98.7 83.0 30.7 87.0 98.7 84.0 32.1 87.5
MIS Quarterly Vol. 36 No. 4—Appendices/December 2012 A9
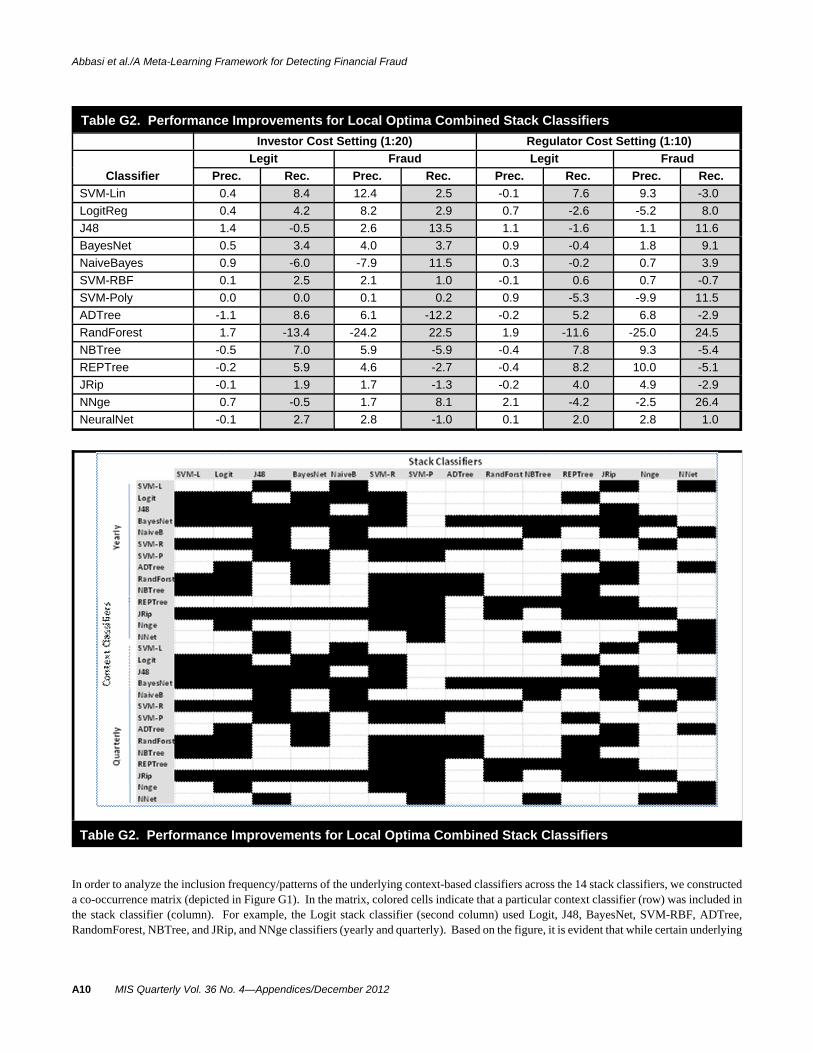
Abbasi et al./A Meta-Learning Framework for Detecting Financial Fraud
Table G2. Performance Improvements for Local Optima Combined Stack Classifiers
Investor Cost Setting (1:20) Regulator Cost Setting (1:10)
Classifier
Legit Fraud Legit Fraud
Prec. Rec. Prec. Rec. Prec. Rec. Prec. Rec.
SVM-Lin 0.4 8.4 12.4 2.5 -0.1 7.6 9.3 -3.0
LogitReg 0.4 4.2 8.2 2.9 0.7 -2.6 -5.2 8.0
J48 1.4 -0.5 2.6 13.5 1.1 -1.6 1.1 11.6
BayesNet 0.5 3.4 4.0 3.7 0.9 -0.4 1.8 9.1
NaiveBayes 0.9 -6.0 -7.9 11.5 0.3 -0.2 0.7 3.9
SVM-RBF 0.1 2.5 2.1 1.0 -0.1 0.6 0.7 -0.7
SVM-Poly 0.0 0.0 0.1 0.2 0.9 -5.3 -9.9 11.5
ADTree -1.1 8.6 6.1 -12.2 -0.2 5.2 6.8 -2.9
RandForest 1.7 -13.4 -24.2 22.5 1.9 -11.6 -25.0 24.5
NBTree -0.5 7.0 5.9 -5.9 -0.4 7.8 9.3 -5.4
REPTree -0.2 5.9 4.6 -2.7 -0.4 8.2 10.0 -5.1
JRip -0.1 1.9 1.7 -1.3 -0.2 4.0 4.9 -2.9
NNge 0.7 -0.5 1.7 8.1 2.1 -4.2 -2.5 26.4
NeuralNet -0.1 2.7 2.8 -1.0 0.1 2.0 2.8 1.0
Table G2. Performance Improvements for Local Optima Combined Stack Classifiers
In order to analyze the inclusion frequency/patterns of the underlying context-based classifiers across the 14 stack classifiers, we constructeda co-occurrence matrix (depicted in Figure G1). In the matrix, colored cells indicate that a particular context classifier (row) was included inthe stack classifier (column). For example, the Logit stack classifier (second column) used Logit, J48, BayesNet, SVM-RBF, ADTree,RandomForest, NBTree, and JRip, and NNge classifiers (yearly and quarterly). Based on the figure, it is evident that while certain underlying
A10 MIS Quarterly Vol. 36 No. 4—Appendices/December 2012

Abbasi et al./A Meta-Learning Framework for Detecting Financial Fraud
context classifiers were utilized more than others, all underlying context-based classifiers were used by at least four stack classifiers. Classifierssuch as BayesNet and JRip were each used by more than 10 stack classifiers. On average, each underlying context-based classifier was usedby 6.5 stack classifiers. The results suggest that a large variety of diverse underlying context-based classifiers are essential to the success ofthe stack classifiers in MetaFraud.
2. Tuning the Quantity and Composition of Stack Classifiers
Having identified a set of local optima solutions for each stack classifier by evaluating different combinations of underlying (base) context-based classifiers, we turned our attention to exploring the impact of utilizing different quantities of stack classifiers on MetaFraud’s overallperformance (#3). We repeated the procedure taken in the previous analysis; all 2n – 1 stack combinations were evaluated. Each of the 14stacks was run using the local optima settings described in Table G1 and Figure G1. All 16,383 combined stack combinations were evaluated. The setting yielding the best overall results for MetaFraud was retained. We labeled this setting “MF-BC/SC” since both the base and stackclassifier arrangements had been tuned.
The results are depicted in Table G4. MetaFraud (MF) denotes the default setting where all 14 stack classifiers were incorporated, each usingthe 28 underlying context-based classifiers as input. MF-BC indicates the setting where all 14 local optima stack classifiers were incorporated. MF –BC/SC represents the setting where the subset of the 14 local optima stacks providing the best performance were retained (using theapproach described in the previous paragraph). The performance gap between MF-BC and MetaFraud signifies the net gain attributable totuning the base classifier arrangement, while the gap between MF-BC/SC and MF-BC indicates the marginal gain attributable to using the bestarrangement of stack classifiers. The results indicate that configuring the set of context-base classifiers used with each stack, as well as thearrangement of stack classifiers employed, both improve performance. Comparing MF-BC/SC against MF, the net gains in legitimate recallwere between 1.5 percent and 2 percent, while fraud recall improved by 0.5 percent to 1.5 percent. These gains resulted in error cost reductionsof $13K per firm-year for the regulator setting and $25K per instance for the investor setting.
Table G4. Performance of MetaFraud With and Without Tuning
SettingNo.
of SC
Regulators (Cost 1:10) Investors (Cost 1:20)
Legit Fraud Cost PerInstance
Legit Fraud Cost PerInstancePrec. Rec. Prec. Rec. Prec. Rec. Prec. Rec.
MetaFraud (MF) 14 98.3 90.2 41.8 81.5 $100.5 98.4 89.6 40.8 82.9 $441.1
MF - BC 14 98.3 90.5 42.9 82.4 $96.1 98.4 90.5 42.9 83.1 $427.4
MF - BC/SC 10 98.4 92.1 47.6 83.1 $87.3 98.4 91.1 44.8 83.4 $415.5
3. Evaluating the Impact of Different ASL Thresholds on Fraud Detection Performance
MetaFraud was run using an ASL threshold of 14. In other words, all 14 combined stack classifiers had to agree on each instance added to thetraining model during the following iteration of the adaptive semi-supervised learning mechanism. We explored the impact of using fourdifferent thresholds: n, n-2, n-4, and n-6. These four thresholds were applied to MF as well as MF-BC/SC. Hence, MF was run using thresholdsof 14, 12, 10, and 8, while MF-BC/SC (which only used 10 stack classifiers) was run using thresholds of 10, 8, 6, and 4.
The results are displayed in Table G5. For MF, using an ASL threshold of 10 yielded the best performance in terms of legitimate and fraudrecall as well as error cost per instance, for both the investor and regulator settings. Using an ASL threshold of 8 provided the best performancefor MF-BC/SC; this setting resulted in the best overall performance across all settings investigated in the appendix, with legitimate and fraudrecall rates above 92 percent and 84 percent, respectively. MF – BC/SC with an ASL threshold of 8 improved legit recall by over 3 percentand fraud recall by over 2 percent and lowered regulator and investor costs by approximately $19,000 and $68,000 per firm-year, respectively,over MF using an ASL threshold of
MIS Quarterly Vol. 36 No. 4—Appendices/December 2012 A11

Abbasi et al./A Meta-Learning Framework for Detecting Financial Fraud
Table G5. Impact of ASL Threshold on Performance
SettingASL
Thresh
Regulators (Cost 1:10) Investors (Cost 1:20)
Legit Fraud Cost PerInstance
Legit Fraud Cost PerInstancePrec. Rec. Prec. Rec. Prec. Rec. Prec. Rec.
MetaFraud(MF)
14 98.3 90.2 41.8 81.5 $100.5 98.4 89.6 40.8 82.9 $441.1
12 98.3 89.8 41.0 82.2 $99.8 98.3 89.2 39.7 82.4 $455.4
10 98.4 91.8 46.6 82.6 $90.0 98.5 90.0 42.0 83.6 $422.9
8 98.3 89.5 40.1 81.7 $102.7 98.3 89.1 39.6 82.6 $451.6
MF - BC/SC
10 98.4 92.1 47.6 83.1 $87.3 98.4 91.1 44.8 83.4 $415.5
8 98.5 92.8 50.2 84.1 $81.2 98.6 92.4 49.1 84.8 $373.3
6 98.3 91.5 45.5 82.2 $92.8 98.4 91.0 44.4 82.9 $425.7
4 98.4 91.0 44.4 83.1 $91.7 98.4 90.8 43.7 82.4 $437.4
The analysis performed in this appendix suggests that tuning the base classifier and stack classifier arrangements as well as selecting a thresholdfor ASL can collectively further improve detection performance by 2 percent to 3 percent. However, the results presented for MF-BC/SC withan ASL threshold of 8 were attained by retrospectively fitting the model configurations to the test data. Hence, they represent atheoretical/potential local optima level of performance. In practice, tuning the base and stack classifiers on the training data without over-fittingthe data represents an interesting and important future research direction. Similarly, identifying methods for configuring the ASL thresholdto better exploit new information signifies a worthwhile future endeavor. However, it is important to note that even in the absence of extensivetuning, MetaFraud attained excellent performance results. Given that the proposed framework provides enhanced fraud detection capabilitieswithout considerable model tuning suggests that MetaFraud is highly robust and not overly sensitive to different configuration issues orparameter settings.
References
Beneish, M. D. 1999a. “The Detection of Earnings Manipulation,” Financial Analysts Journal (55:5), pp. 24-36.Beneish, M. D. 1999b. “Incentives and Penalties Related to Earnings Overstatements that Violate GAAP,” The Accounting Review (74:4),
pp. 425-457.Cecchini, M., Aytug, H., Koehler, G., and Pathak, P. 2010. “Detecting Management Fraud in Public Companies,” Management Science (56:7),
pp. 1146-1160.Cox, R. A. K., and Weirich, T. R. 2002. “The Stock Market Reaction to Fraudulent Financial Reporting,” Managerial Auditing Journal (17:7),
pp. 374-382.Gaganis, C. 2009. “Classification Techniques for the Identification of Falsified Financial Statements: A Comparative Analysis,” International
Journal of Intelligent Systems in Accounting and Finance Management (16), pp. 207-229.Kirkos, E., Spathis, C., and Manolopoulos, Y. 2007. “Data Mining Techniques for the Detection of Fraudulent Financial Statements,” Expert
Systems with Applications (32), pp. 995-1003.Zhou, Z. and Li, M. 2005. “Tri-Training: Exploiting Unlabeled Data Using Three Classifiers,” IEEE Transactions on Knowledge and Data
Engineering (17:11), pp. 1529-1541.
A12 MIS Quarterly Vol. 36 No. 4—Appendices/December 2012