metal foams as novel catalyst support in environmental
TRANSCRIPT

catalysts
Article
Metal Foams as Novel Catalyst Support inEnvironmental Processes
Anna Gancarczyk 1,* , Katarzyna Sindera 1, Marzena Iwaniszyn 1, Marcin Piatek 1,Wojciech Macek 1 , Przemysław J. Jodłowski 2 , Sebastian Wronski 3, Maciej Sitarz 4,Joanna Łojewska 5 and Andrzej Kołodziej 1,6
1 Institute of Chemical Engineering, Polish Academy of Sciences, Bałtycka 5, 44-100 Gliwice, Poland2 Faculty of Chemical Engineering and Technology, Cracow University of Technology, Warszawska 24,
31-155 Kraków, Poland3 Faculty of Physics and Applied Computer Science, AGH University of Science and Technology, Al.
Mickiewicza 30, 30-059 Kraków, Poland4 Faculty of Materials Science and Ceramics, AGH University of Science and Technology, Al. Mickiewicza 30,
30-059 Kraków, Poland5 Faculty of Chemistry, Jagiellonian University, Gronostajowa 2, 30-387 Kraków, Poland6 Faculty of Civil Engineering and Architecture, Opole University of Technology, Katowicka 48,
45-061 Opole, Poland* Correspondence: [email protected]; Tel.: +48-32-234-6915
Received: 11 June 2019; Accepted: 3 July 2019; Published: 5 July 2019�����������������
Abstract: Metal foams are considered as promising catalyst carriers due to their high porosity,large specific surface area, and satisfactory thermal and mechanical stability. The study presentsheat transfer and pressure drop experiments performed for seven foams of different pore densitiesmade from diverse metals. Mass transfer characteristics are derived using the Chilton–Colburnanalogy. It was found that the foams display much more intense heat/mass transfer than a monolith,comparable to packed bed. Next, the foams’ efficiencies have been compared, using 1D reactormodeling, in catalytic reactions displaying either slower (selective catalytic reduction of NOx) orfaster kinetics (catalytic methane combustion). For the slow kinetics, the influence of carrier specificsurface area at which catalyst can be deposited (i.e., catalyst amount) was decisive to achieve highprocess conversion and short reactor. For this case, monolith appears as the best choice assuming it’sthe lowest pressure drop. For the fast reaction, the mass transfer becomes the limiting parameter,thus solid foams are the best solution.
Keywords: metal foams; heat transfer; reactor modelling
1. Introduction
It seems usually acceptable that the catalyst is a key element of the catalytic reactor. Indeed,the catalyst enables enhanced reaction kinetics, thus, the reaction rate may be significantly increasedwhen comparing with that of noncatalytic reactions. However, only as many molecules may reactas reach the catalyst surface. Hence, the reaction rate depends on the substrate concentration at thecatalyst surface (more exactly, at the active centers), not on the concentration in the bulk reactantsstream. The concentration at the surface depends, in turn, on the reaction kinetics and the mass transfercoefficient. In fact, the mass transfer rate is as important as the kinetics, being a possible limitation ofthe process yield. Mass transfer is strictly bound with the heat transfer by the Chilton–Colburn analogy:
Nu
Pr1/3=
Sh
Sc1/3(1)
Catalysts 2019, 9, 587; doi:10.3390/catal9070587 www.mdpi.com/journal/catalysts

Catalysts 2019, 9, 587 2 of 13
where dimensionless Sherwood (Sh) and Nusselt (Nu) numbers describe mass and heat transfer,respectively. Therefore, in many cases, the mass transfer characteristic can be derived based on theheat transfer experiments, and vice versa. Based on the Chilton–Colburn analogy, the relationshipbetween heat and mass transfer coefficients (h and kC, respectively) is:
h(Ts − T) = kC(CA −CAs)(−∆HR) (2)
where ∆HR is the reaction enthalpy. It means, that for reactor design the knowledge of the heat andmass transfer characteristics of the reactor internals is as necessary as the kinetics of the reaction.Usually, the better the transport characteristics, the better reactor performance, especially for fastcatalytic reactions.
Another parameter characterizing the reactor internals, which is very important for the reactorfunctioning, is the flow resistance. It is not a process limitation, however high pressure drop meanshigh pumping costs. Hence, the ratio of the flow resistance to the transport intensity is an importantfactor for the catalytic reactor optimization [1,2].
The classic solution in many processes, especially in the area of environmental protection,is a monolith with a catalyst deposited on its surface (usually through an intermediate layer,the “washcoat”). The undoubted advantage of such a solution, in addition to the reproduciblestructure of the channels, is the low flow resistance and the relative ease of forming and depositingthe catalyst. However, serious disadvantages are the low mass and heat transfer rates, which areparticularly important for fast catalytic reactions. On the other side is the packed bed characterized bythe high mass transfer, but also high flow resistance.
Solid, open-cellular foams offer significantly higher mass [3] and heat [2] transfer coefficientscompared with those of monoliths and lower pressure drop in comparison with that of the packedbed [2,3]. Moreover, solid foams are being manufactured from diverse materials. Ceramic foams areapplied as molten metal filters and high-temperature thermal insulations. Metal foams are used inlight constructions, as elements of aircraft, and as absorbers of energy, in heat exchangers (as porousfins) or heat recuperators. Thinner struts of metal foams, measuring less than one millimeter, enablethe manufacture of foams of larger specific surface area (over 1000 m2/m3) and higher porosity incomparison with that of ceramic ones. Moreover, metal foams show good mechanical properties, highthermal conductivity, and resistance to thermal and mechanical shocks. The above characteristicsmake metal solid foams attractive for catalytic applications. They have been studied in, for example,the neutralization of air pollutants from automotive exhaust gases [4], the selective catalytic reductionof nitrogen oxides (SCR deNOx) [5,6], the catalytic oxidation of CO [1,7–10], the catalytic combustionand steam reforming of methane [9,11,12], or the catalytic oxidation of hydrocarbons [13,14].
Because knowledge of the heat and mass transfer parameters is as important as the kinetics,therefore, this study presents the heat transfer experimental results for aluminum (Al), nickel (Ni),nickel–chromium (NC), and Fecralloy foams, differing in the pore densities. Next, in order to checkthe usefulness of metal foams as the catalyst carriers, NC foams were compared with classicalcatalyst supports—packed beds and monoliths. The removal of NOx by selective catalytic reduction(SCR deNOx) and the catalytic combustion of methane were chosen as the model processes. Theseprocesses display relatively slow and fast reaction kinetics, respectively. In addition, they are veryimportant for environmental protection, hence any improvement in their efficiency is highly desirable.
2. Results
2.1. Heat and Mass Transfer
The heat transfer coefficients were experimentally determined for several metal foams, namelyaluminum (Al), nickel (Ni), nickel–chromium (NC), and Fecralloy. Moreover, the chosen foams differin the pore densities (pores per inch, PPI) (see Section 4 Materials and Methods). Experimentalresults of heat and mass transfer for tested metal foams are presented in Figure 1, in the term of

Catalysts 2019, 9, 587 3 of 13
Nu/Pr1/3 (describing the heat transfer) and in equivalent mass transfer term (Sh/Sc1/3), according to theChilton–Colburn analogy (Equation (1)).This approach is applied in this paper. Because, for comparison,the results for monolith and packed bed are also presented in Figure 1, therefore, the hydraulic diameter,dh, for all presented catalyst carriers was chosen as the characteristic one. As can be seen, the heatand mass transport properties for solid foams are comparable with packed bed and much higher thanfor monolith.
Catalysts 2019, 9, x FOR PEER REVIEW 3 of 13
Nu/Pr1/3 (describing the heat transfer) and in equivalent mass transfer term (Sh/Sc1/3), according to the Chilton–Colburn analogy (equation (1)).This approach is applied in this paper. Because, for comparison, the results for monolith and packed bed are also presented in Figure 1, therefore, the hydraulic diameter, dh, for all presented catalyst carriers was chosen as the characteristic one. As can be seen, the heat and mass transport properties for solid foams are comparable with packed bed and much higher than for monolith.
Figure 1. Heat and mass transfer experimental results vs. Reynolds number for tested solid foams. The monoliths and packed bed are shown for comparison.
In the literature, many correlations describing the heat (e.g., [15–18]) and mass transfer coefficient (e.g., [1,19–21]) for solid foams can be found. A comparison between experimental results in terms of Nu/Pr1/3 (according to the Chilton–Colburn analogy) and calculated based on the selected literature correlations for heat transfer for Al 10 (Figure 2a) and Ni 0610 (Figure 2b) is presented. For the same foams, a similar comparison of mass transfer coefficient obtained experimentally (i.e., based on the Nu number using Chilton–Colburn analogy) and calculated using selected literature correlations is presented in Figure 3 in the form of Sh/Sc1/3. Because literature correlations describing heat and mass transfer coefficient defined dimensionless number (Re, Nu, Sh) with different characteristic dimensions, therefore they were recalculated using strut diameter, ds, (see Section 4 Materials and Methods) as characteristic one. As can be noticed, for both, the heat (Figure 2) and the mass (Figure 3), when a given correlation describes quite well the results obtained for one foam, it very often fails for the others [22]. A similar situation was also observed for flow resistance [23,24].
(a) (b)
Figure 2. Experimental heat transfer results and those calculated based on the literature correlations for (a) Al 10 and (b) Ni 0610 foams.
Figure 1. Heat and mass transfer experimental results vs. Reynolds number for tested solid foams.The monoliths and packed bed are shown for comparison.
In the literature, many correlations describing the heat (e.g., [15–18]) and mass transfer coefficient(e.g., [1,19–21]) for solid foams can be found. A comparison between experimental results in terms ofNu/Pr1/3 (according to the Chilton–Colburn analogy) and calculated based on the selected literaturecorrelations for heat transfer for Al 10 (Figure 2a) and Ni 0610 (Figure 2b) is presented. For the samefoams, a similar comparison of mass transfer coefficient obtained experimentally (i.e., based on theNu number using Chilton–Colburn analogy) and calculated using selected literature correlations ispresented in Figure 3 in the form of Sh/Sc1/3. Because literature correlations describing heat and masstransfer coefficient defined dimensionless number (Re, Nu, Sh) with different characteristic dimensions,therefore they were recalculated using strut diameter, ds, (see Section 4 Materials and Methods) ascharacteristic one. As can be noticed, for both, the heat (Figure 2) and the mass (Figure 3), when a givencorrelation describes quite well the results obtained for one foam, it very often fails for the others [22].A similar situation was also observed for flow resistance [23,24].
Catalysts 2019, 9, x FOR PEER REVIEW 3 of 13
Nu/Pr1/3 (describing the heat transfer) and in equivalent mass transfer term (Sh/Sc1/3), according to the Chilton–Colburn analogy (equation (1)).This approach is applied in this paper. Because, for comparison, the results for monolith and packed bed are also presented in Figure 1, therefore, the hydraulic diameter, dh, for all presented catalyst carriers was chosen as the characteristic one. As can be seen, the heat and mass transport properties for solid foams are comparable with packed bed and much higher than for monolith.
Figure 1. Heat and mass transfer experimental results vs. Reynolds number for tested solid foams. The monoliths and packed bed are shown for comparison.
In the literature, many correlations describing the heat (e.g., [15–18]) and mass transfer coefficient (e.g., [1,19–21]) for solid foams can be found. A comparison between experimental results in terms of Nu/Pr1/3 (according to the Chilton–Colburn analogy) and calculated based on the selected literature correlations for heat transfer for Al 10 (Figure 2a) and Ni 0610 (Figure 2b) is presented. For the same foams, a similar comparison of mass transfer coefficient obtained experimentally (i.e., based on the Nu number using Chilton–Colburn analogy) and calculated using selected literature correlations is presented in Figure 3 in the form of Sh/Sc1/3. Because literature correlations describing heat and mass transfer coefficient defined dimensionless number (Re, Nu, Sh) with different characteristic dimensions, therefore they were recalculated using strut diameter, ds, (see Section 4 Materials and Methods) as characteristic one. As can be noticed, for both, the heat (Figure 2) and the mass (Figure 3), when a given correlation describes quite well the results obtained for one foam, it very often fails for the others [22]. A similar situation was also observed for flow resistance [23,24].
(a) (b)
Figure 2. Experimental heat transfer results and those calculated based on the literature correlations for (a) Al 10 and (b) Ni 0610 foams.
Figure 2. Experimental heat transfer results and those calculated based on the literature correlationsfor (a) Al 10 and (b) Ni 0610 foams.

Catalysts 2019, 9, 587 4 of 13Catalysts 2019, 9, x FOR PEER REVIEW 4 of 13
(a) (b)
Figure 3. Experimental mass transfer results and those calculated based on the literature correlations for (a) Al 10 and (b) Ni 0610 foams.
The heat transfer for solid foams is very often described by the correlation of the form:
Nu=aRebPr1/3 (3)
that originally was proposed for the bundle of tubes [25], where coefficient a and exponent b depends on the Reynolds number value. As can be seen in Figure 1, all experimental results of heat/mass transfer of solid foams tested are similar. Therefore, for all the foams’, tested parameters a and b from equation (1) were estimated, based on experimental results, obtaining a = 0.489 and b = 0.552. Because heat transfer for the solid foams depends mainly on the specific surface area and strut diameter [15], therefore strut diameter was chosen as the characteristic diameter in the definition of the Reynolds and Nusselt number. The correlation describes the experimental results with average relative error, ey ≈ 9.3%, as presented in Figure 4.
Figure 4. Experimentally determined heat/mass transfer and that calculated based on equation (3) with a = 0.489 and b = 0.552 and ds as characteristic diameter.
2.2. Assessment of Solid Foams as Catalyst Carriers
Solid foams can be adapted to process requirements in terms of amount of catalyst due to the wide range of the specific surface area available. The next important benefit of solid foams is a wide range of porosity that offers relatively low flow resistance. Moreover, the complicated three-dimensional (3D) structure of a foam skeleton ensures intense mixing of the flowing fluids, thus intense heat and mass transfer.
Figure 3. Experimental mass transfer results and those calculated based on the literature correlationsfor (a) Al 10 and (b) Ni 0610 foams.
The heat transfer for solid foams is very often described by the correlation of the form:
Nu = aRebPr1/3 (3)
that originally was proposed for the bundle of tubes [25], where coefficient a and exponent b dependson the Reynolds number value. As can be seen in Figure 1, all experimental results of heat/masstransfer of solid foams tested are similar. Therefore, for all the foams’, tested parameters a and b fromEquation (1) were estimated, based on experimental results, obtaining a = 0.489 and b = 0.552. Becauseheat transfer for the solid foams depends mainly on the specific surface area and strut diameter [15],therefore strut diameter was chosen as the characteristic diameter in the definition of the Reynoldsand Nusselt number. The correlation describes the experimental results with average relative error,ey ≈ 9.3%, as presented in Figure 4.
Catalysts 2019, 9, x FOR PEER REVIEW 4 of 13
(a) (b)
Figure 3. Experimental mass transfer results and those calculated based on the literature correlations for (a) Al 10 and (b) Ni 0610 foams.
The heat transfer for solid foams is very often described by the correlation of the form:
Nu=aRebPr1/3 (3)
that originally was proposed for the bundle of tubes [25], where coefficient a and exponent b depends on the Reynolds number value. As can be seen in Figure 1, all experimental results of heat/mass transfer of solid foams tested are similar. Therefore, for all the foams’, tested parameters a and b from equation (1) were estimated, based on experimental results, obtaining a = 0.489 and b = 0.552. Because heat transfer for the solid foams depends mainly on the specific surface area and strut diameter [15], therefore strut diameter was chosen as the characteristic diameter in the definition of the Reynolds and Nusselt number. The correlation describes the experimental results with average relative error, ey ≈ 9.3%, as presented in Figure 4.
Figure 4. Experimentally determined heat/mass transfer and that calculated based on equation (3) with a = 0.489 and b = 0.552 and ds as characteristic diameter.
2.2. Assessment of Solid Foams as Catalyst Carriers
Solid foams can be adapted to process requirements in terms of amount of catalyst due to the wide range of the specific surface area available. The next important benefit of solid foams is a wide range of porosity that offers relatively low flow resistance. Moreover, the complicated three-dimensional (3D) structure of a foam skeleton ensures intense mixing of the flowing fluids, thus intense heat and mass transfer.
Figure 4. Experimentally determined heat/mass transfer and that calculated based on Equation (3) witha = 0.489 and b = 0.552 and ds as characteristic diameter.
2.2. Assessment of Solid Foams as Catalyst Carriers
Solid foams can be adapted to process requirements in terms of amount of catalyst due to the widerange of the specific surface area available. The next important benefit of solid foams is a wide rangeof porosity that offers relatively low flow resistance. Moreover, the complicated three-dimensional(3D) structure of a foam skeleton ensures intense mixing of the flowing fluids, thus intense heat andmass transfer.

Catalysts 2019, 9, 587 5 of 13
Comparison of heat and mass transfer coefficients of solid foams with classic packed bed andmonolith, as presented in Figure 1, shows that transport intensity for the foams is close to that ofpacked bed and much higher than that of the monolith. However, in order to test the applicabilityof solid foam as a catalyst carrier instead of a monolith or packed bed, the reactor performance wascompared for catalytic combustion of methane and SCR deNOx, selected as model catalytic reactions.The catalyst carriers chosen were NC 0610 foam, the 100 cpsi monolith (200 mm long), and packed bedof 3 mm spherical particles (egg-shell type), that displayed a similar specific surface area, defined asthe external surface area per unit volume of bed (see Table 1). Moreover, NC 2733 was also taken intoaccount in order to check the effect of foam morphology on the process yield.
The correlations describing the heat, mass transfer, and flow resistance for the solid foams(based on the experimental results), as well as the literature correlation for the monolith [26] andpacked bed [27,28], are presented in Table 1. Because the compared catalyst carriers significantly differin their geometry, therefore the hydraulic diameter was used as the characteristic dimension.
To assist in the evaluation and selection of the most favorable catalyst support for a givencatalytic process, different criteria are defined in the literature. The criteria take into account differentparameters, such as technological (length of reactor, flow resistance) or process selectivity, yield, etc.Choice of the appropriate criterion depends on which parameter is the most important for the designer(operating cost, selectivity, or conversion), or on the available data. Different criteria commonly yieldsimilar results, which is not surprising, especially given that criteria are usually based on similardependencies [2].
Table 1. Correlations and characteristic parameters for tested catalyst carriers.
Catalyst Support Sv (m2/m3) dh (m) Correlations 1
NC 0610 1298 2.73 × 10⁻³∆P/L = 443.1w2 + 256.8w
Nu = 0.489Re0.552 Pr1/3
Sh = 0.489Re0.552 Sc1/3
NC 2733 3616 9.61 × 10⁻³∆P/L = 1791.9w2 + 2719.4w
Nu = 0.489Re0.552 Pr1/3
Sh = 0.489Re0.552 Sc1/3
monolith [26] 1339 2.15 × 10⁻³(fRe) = 14.23
(1 + 0.045/L+
)0.5
Nu = 3.608(1 + 0.095/L∗)0.45
Sh = 3.608(1 + 0.095/L∗M
)0.45
packed bed [27,28] 1240 1.23 × 10⁻³∆P/L = 150µw
D2(1−ε)2
ε3 + 1.75 %w2
D(1−ε)ε3
Nu = 2 + 1.1Re0.6Pr1/3
Sh = 2 + 1.1Re0.6Sc1/3
1 Defined with dh as the characteristic diameter.
In this work, the performance for SCR deNOx and the catalytic combustion of methane weremodelled using the one-dimensional (1D) plug flow reactor model, in accordance with the procedurechecked for n-hexane catalytic combustion [29], assuming steady state conditions:
• the material balance in the gas phase:
d(CAw)
dz+ Svkc(CA −CAS) = 0, (4)
with boundary conditions: z = 0; CA = CA0.
• the heat balance for the gas phase:
w%cpdTdz
+ Svh(T− TS) = 0, (5)
Catalysts 2019, 9, 587 6 of 13
with boundary conditions: z = 0; T = T0, and assuming no heat losses.• the material balance at the catalyst surface:
kc(CA −CAS) = η(−RA) = ηkrCAS, (6)
• the heat balance at the catalyst surface:
h(TS − T) = −∆HRη(−RA), (7)
• the influence of axial dispersion on the final conversion is neglected [29,30].
Kinetic data for considering processes are presented in Table 2. As can be seen, deNOx reactiondisplays rather slow kinetics, while methane combustion is a very fast reaction.
Table 2. Catalyst preparation and kinetic data.
Catalyst Metal Content (wt %) Pre-ExponentialFactor, k∞ (m/s)
Activation Energy,Ea, (kJ/mol)
EffectivenessFactor, η 1
Cu/USY/s [31] 3.70 ± 0.04 3.32 36.21 1Pd/Al2O3 [2] 3.43 ± 0.9 1.07 × 10¹⁰ 110.4 0.32
1 calculated for 723 K and catalyst layer thickness l = 20 µm.
The modelling was performed in two ways:
1. reaction conversion was calculated along the reactor axis (z) for T = const. and w = const.;2. necessary reactor length to reach 90% conversion was calculated for given flow velocity at
T = const.
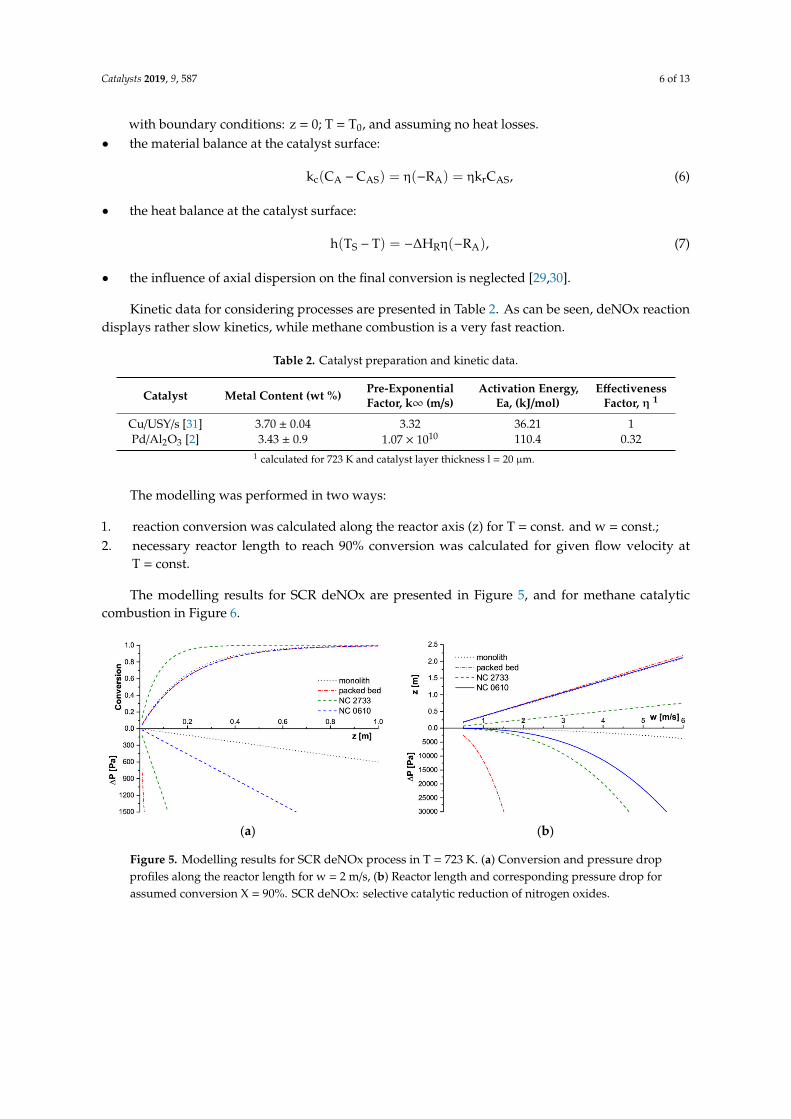
The modelling results for SCR deNOx are presented in Figure 5, and for methane catalyticcombustion in Figure 6.
Catalysts 2019, 9, x FOR PEER REVIEW 6 of 13
• the heat balance for the gas phase:
wρcpdTdz+Svh T-TS =0, (5)
with boundary conditions: z = 0; T = T0, and assuming no heat losses. • the material balance at the catalyst surface:
kc CA-CAS =η -RA =ηkrCAS, (6)
• the heat balance at the catalyst surface:
h TS-T =-ΔHRη -RA , (7)
• the influence of axial dispersion on the final conversion is neglected [29,30]. Kinetic data for considering processes are presented in Table 2. As can be seen, deNOx reaction
displays rather slow kinetics, while methane combustion is a very fast reaction.
Table 2. Catalyst preparation and kinetic data.
Catalyst Metal Content (wt %)
Pre-Exponential Factor, k∞ (m/s)
Activation Energy, Ea,
(kJ/mol)
Effectiveness Factor, η 1
Cu/USY/s [31] 3.70 ± 0.04 3.32 36.21 1 Pd/Al2O3 [2] 3.43 ± 0.9 1.07 × 10¹⁰ 110.4 0.32
1 calculated for 723 K and catalyst layer thickness l = 20 µm.
The modelling was performed in two ways: 1. reaction conversion was calculated along the reactor axis (z) for T = const. and w = const.; 2. necessary reactor length to reach 90% conversion was calculated for given flow velocity at T
= const. The modelling results for SCR deNOx are presented in Figure 5, and for methane catalytic
combustion in Figure 6.
(a) (b)
Figure 5. Modelling results for SCR deNOx process in T = 723 K. (a) Conversion and pressure drop profiles along the reactor length for w = 2 m/s, (b) Reactor length and corresponding pressure drop for assumed conversion X = 90%. SCR deNOx: selective catalytic reduction of nitrogen oxides.
Figure 5. Modelling results for SCR deNOx process in T = 723 K. (a) Conversion and pressure dropprofiles along the reactor length for w = 2 m/s, (b) Reactor length and corresponding pressure drop forassumed conversion X = 90%. SCR deNOx: selective catalytic reduction of nitrogen oxides.

Catalysts 2019, 9, 587 7 of 13Catalysts 2019, 9, x FOR PEER REVIEW 7 of 13
(a) (b)
Figure 6. Modelling results for CH4 combustion process in T = 773 K. (a) Conversion and pressure drop profiles along the reactor length for w = 2 m/s, (b) Reactor length and corresponding pressure drop for assumed conversion X = 90%.
Considering the slow deNOx reaction, carriers of close specific surface area (i.e., NC 0610 foam, a 100 cpsi monolith, and a packed bed of 3 mm grains) achieved similar conversion along the reactor axis (Figure 5a). Therefore, also the reactor length necessary to achieve 90% conversion is almost the same for them in a wide range of flow velocities (Figure 5b). On the other hand, flow resistances for those carriers differ greatly. The highest pressure drop is always displayed by the packed bed, and the lowest by the monolith. The NC 0610 foam is in between. The NC 2733 foam has achieved higher conversion along the reactor length, so also 90% conversion of NO requires a much shorter reactor. This is the result of a much larger specific surface area of NC 2733 foam available to catalyst deposition, hence the mass of catalyst (assuming the same catalyst layer thickness) in comparison with that of other tested catalyst supports.
For the fast reaction of the methane catalytic combustion, the behavior is quite different (Figure 6). The lowest conversion is offered by the monolith, somewhat higher is that of NC 0610 foam. Packed bed and NC 2733 foam reach close conversion (Figure 6a), although the NC 2733 foam displays a higher specific surface area. The characteristics presented in Figure 6b are similar: the shortest reactor to achieve 90% conversion is required for packed bed and NC 28733, while the longest one for the monolith. Flow resistance for both the tested foams is similar, and only moderately higher than that of monolith (Figure 6b).
3. Discussion
For processes characterized by rather slow kinetics (SCR deNOx), the conversion achieved (Figure 5a) and the reactor length (Figure 5b) is proportional to the surface area of the catalyst carriers, thus to the catalyst mass, therefore, NC 2733 shows much higher conversion and much shorter reactor length needed to achieve 90% conversion. This results from the slow kinetics of the reaction. For all the carriers considered, the mass transfer is much more intense than the reaction rate. Thus, the process is strictly kinetic dependent. In such a situation, the rational choice of carrier from among those having a comparable Sv is, of course, a monolith, with the lowest flow resistance and reactor length similar to the others. The same results were also obtained for the methane combustion carried out on the palladium catalyst prepared by the incipient wetness method, displaying “slow” kinetics [2].
For processes with fast kinetics (catalytic combustion of methane), the reaction is strongly limited by insufficient mass transfer rate. In this case, the mass transfer becomes the limiting factor for the process yield. Specific surface area and catalyst amount play less important roles. Therefore, foams and packed bed needed much shorter reactor than monolith (Figure 6b), especially for higher fluid velocity. That agrees with the results presented in Figure 1: transport intensity for foams and packed bed is close and much higher than for monolith. The consequence is not only shorter reactor
Figure 6. Modelling results for CH4 combustion process in T = 773 K. (a) Conversion and pressuredrop profiles along the reactor length for w = 2 m/s, (b) Reactor length and corresponding pressuredrop for assumed conversion X = 90%.
Considering the slow deNOx reaction, carriers of close specific surface area (i.e., NC 0610 foam,a 100 cpsi monolith, and a packed bed of 3 mm grains) achieved similar conversion along the reactoraxis (Figure 5a). Therefore, also the reactor length necessary to achieve 90% conversion is almost thesame for them in a wide range of flow velocities (Figure 5b). On the other hand, flow resistances forthose carriers differ greatly. The highest pressure drop is always displayed by the packed bed, and thelowest by the monolith. The NC 0610 foam is in between. The NC 2733 foam has achieved higherconversion along the reactor length, so also 90% conversion of NO requires a much shorter reactor.This is the result of a much larger specific surface area of NC 2733 foam available to catalyst deposition,hence the mass of catalyst (assuming the same catalyst layer thickness) in comparison with that ofother tested catalyst supports.
For the fast reaction of the methane catalytic combustion, the behavior is quite different (Figure 6).The lowest conversion is offered by the monolith, somewhat higher is that of NC 0610 foam. Packedbed and NC 2733 foam reach close conversion (Figure 6a), although the NC 2733 foam displaysa higher specific surface area. The characteristics presented in Figure 6b are similar: the shortest reactorto achieve 90% conversion is required for packed bed and NC 28733, while the longest one for themonolith. Flow resistance for both the tested foams is similar, and only moderately higher than that ofmonolith (Figure 6b).
3. Discussion
For processes characterized by rather slow kinetics (SCR deNOx), the conversion achieved(Figure 5a) and the reactor length (Figure 5b) is proportional to the surface area of the catalyst carriers,thus to the catalyst mass, therefore, NC 2733 shows much higher conversion and much shorter reactorlength needed to achieve 90% conversion. This results from the slow kinetics of the reaction. For all thecarriers considered, the mass transfer is much more intense than the reaction rate. Thus, the process isstrictly kinetic dependent. In such a situation, the rational choice of carrier from among those havinga comparable Sv is, of course, a monolith, with the lowest flow resistance and reactor length similarto the others. The same results were also obtained for the methane combustion carried out on thepalladium catalyst prepared by the incipient wetness method, displaying “slow” kinetics [2].
For processes with fast kinetics (catalytic combustion of methane), the reaction is strongly limitedby insufficient mass transfer rate. In this case, the mass transfer becomes the limiting factor for theprocess yield. Specific surface area and catalyst amount play less important roles. Therefore, foams andpacked bed needed much shorter reactor than monolith (Figure 6b), especially for higher fluid velocity.That agrees with the results presented in Figure 1: transport intensity for foams and packed bed isclose and much higher than for monolith. The consequence is not only shorter reactor (the smaller

Catalysts 2019, 9, 587 8 of 13
volume), but also lower catalyst mass. In this case, the rational choice is the solid foam offering shorterreactor and low flow resistance, that is only slightly higher compared to the monolith.
Importance of the heat transfer is equal for both the fast and slow reactions. Each of them bringsa certain energetic effect, thus the reaction heat (or enthalpy ∆HR) has to be transferred betweencatalyst surface and the bulk reactant stream. The problem is of special importance for highlyexothermic reactions like, for example, catalytic combustion. Insufficient heat transfer can lead to thecatalyst overheating. This can be avoided by lowering process temperature or substrate concentration,according to Equation (2), but also, to some extent, by choosing (or designing) the reactor internalcharacterized by desirable heat and mass transfer characteristics.
4. Materials and Methods
4.1. Foam Morphology
The commercially available metal foams used in this study were made of aluminum (ERG Materialsand Aerospace Corp., Oakland, CA, USA), nickel and nickel–chromium (Recemat BV, Dodevaard, TheNetherlands), and Fecralloy (Goodfellow Cambridge Ltd., Huntingdon, England) with pore densityfrom 10 to 40 PPI (pores per inch).
The porosity and specific surface area for the foams were obtained using X-ray microcomputedtomography (micro-CT). The foam samples had a cylindrical shape with a height and diameter ofabout 10 mm. For aluminum (Al), nickel (Ni), and nickel–chromium (NC) foam, the microtomographymeasurements were performed using a SkyScan 1172 micro-CT scanner (Bruker, Kontich, Belgium),while for the Fecralloy foam, the “nanotom 180N” (GE Sensing & Inspection Technologies phoenix|X-rayGmbh) was used. During the scanning process of each foam, the sample rotated slowly and projectionimages were acquired for each rotation angle. The obtained 2D shadow projections were preprocessedusing iMorph software. First, using the global thresholding method, binarization was performed(Figure 7A). Next, to exclude potential internal discontinuities in the foam skeleton, which can causelarge errors in the designated external porosity accessible for fluid flow and the external surface onwhich the catalyst may be deposited, the dilatation (Figure 7B) and erosion (Figure 7C) operations wereperformed for the selected region of interest (ROI) (for details see [22,32]). For such postprocessedimages, a 3D reconstruction of the ROI was carried out (Figure 7D) and porosity and specific surfacearea were determined. The procedure is schematically presented in Figure 7.
Catalysts 2019, 9, x FOR PEER REVIEW 8 of 13
(the smaller volume), but also lower catalyst mass. In this case, the rational choice is the solid foam offering shorter reactor and low flow resistance, that is only slightly higher compared to the monolith.
Importance of the heat transfer is equal for both the fast and slow reactions. Each of them brings a certain energetic effect, thus the reaction heat (or enthalpy ΔHR) has to be transferred between catalyst surface and the bulk reactant stream. The problem is of special importance for highly exothermic reactions like, for example, catalytic combustion. Insufficient heat transfer can lead to the catalyst overheating. This can be avoided by lowering process temperature or substrate concentration, according to Equation (2), but also, to some extent, by choosing (or designing) the reactor internal characterized by desirable heat and mass transfer characteristics.
4. Materials and Methods
4.1. Foam Morphology
The commercially available metal foams used in this study were made of aluminum (ERG Materials and Aerospace Corp., Oakland, CA, USA), nickel and nickel–chromium (Recemat BV, Dodevaard, The Netherlands), and Fecralloy (Goodfellow Cambridge Ltd., Huntingdon, England) with pore density from 10 to 40 PPI (pores per inch).
The porosity and specific surface area for the foams were obtained using X-ray microcomputed tomography (micro-CT). The foam samples had a cylindrical shape with a height and diameter of about 10 mm. For aluminum (Al), nickel (Ni), and nickel–chromium (NC) foam, the microtomography measurements were performed using a SkyScan 1172 micro-CT scanner (Bruker, Kontich, Belgium), while for the Fecralloy foam, the “nanotom 180N” (GE Sensing & Inspection Technologies phoenix|X-ray Gmbh) was used. During the scanning process of each foam, the sample rotated slowly and projection images were acquired for each rotation angle. The obtained 2D shadow projections were preprocessed using iMorph software. First, using the global thresholding method, binarization was performed (Figure 7A). Next, to exclude potential internal discontinuities in the foam skeleton, which can cause large errors in the designated external porosity accessible for fluid flow and the external surface on which the catalyst may be deposited, the dilatation (Figure 7B) and erosion (Figure 7C) operations were performed for the selected region of interest (ROI) (for details see [22,32]). For such postprocessed images, a 3D reconstruction of the ROI was carried out (Figure 7D) and porosity and specific surface area were determined. The procedure is schematically presented in Figure 7.
Figure 7. Region of interest (ROI) after (A) binarization, (B) dilatation operation, (C) erosion operation, (D) three-dimensional (3D) reconstruction.
The strut diameter (i.e., solid elements of foam skeleton, depicted in Figure 7D) was determined using optical microscopy. The results are presented in Table 3.
Figure 7. Region of interest (ROI) after (A) binarization, (B) dilatation operation, (C) erosion operation,(D) three-dimensional (3D) reconstruction.
The strut diameter (i.e., solid elements of foam skeleton, depicted in Figure 7D) was determinedusing optical microscopy. The results are presented in Table 3.

Catalysts 2019, 9, 587 9 of 13
Table 3. Morphological parameters of foams tested.
Foam PPI 1 ds (m) dh (m) ε Sv (m2/m3)
Al 10 10 4.49 × 10⁻⁴ 4.12 × 10⁻³ 0.89 860.98Al 20 20 3.73 × 10⁻⁴ 3.94 × 10⁻³ 0.91 926.49Al 40 40 3.04 × 10⁻⁴ 3.19 × 10⁻³ 0.91 1139.6
Fecralloy 20 8 PPC 2 2.17 × 10⁻⁴ 1.55 × 10⁻³ 0.83 2084.63Ni 0610 6 . . . 10 4.71 × 10⁻⁴ 4.05 × 10⁻³ 0.92 908.73NC 0610 6 . . . 10 5.29 × 10⁻⁴ 2.73 × 10⁻³ 0.88 1297.72NC 2733 27 . . . 33 1.35 × 10⁻⁴ 9.61 × 10⁻³ 0.87 3615.7
1 Pores per inch, according to producer. 2 Pores per centimeter
4.2. Heat and Mass Transfer
The experimental setup is shown in Figure 8. The main part is the heat exchanger, in which the foamsamples were tested. The foam specimen, placed in the central part of the exchanger, had a rectangularshape (45 mm × 30 mm) and was oriented perpendicular to the air flow direction. Metal foamsamples were heated by the current flowing directly through the foam body (Imax ≈ 150 A ± 0.1 A).The temperatures of the foam sample and the flowing gas were measured by means of thermocouplesplaced on the inlet and outlet side of the sample and heat exchanger, respectively. Air flow velocitywas changed in the velocity range of 0.2–11 m/s (for more details see [22,33]).
Catalysts 2019, 9, x FOR PEER REVIEW 9 of 13
Table 3. Morphological parameters of foams tested.
Foam PPI 1 ds (m) dh (m) ε Sv (m2/m3) Al 10 10 4.49 × 10⁻⁴ 4.12 × 10⁻³ 0.89 860.98 Al 20 20 3.73 × 10⁻⁴ 3.94 × 10⁻³ 0.91 926.49 Al 40 40 3.04 × 10⁻⁴ 3.19 × 10⁻³ 0.91 1139.6
Fecralloy 20 8 PPC 2 2.17 × 10⁻⁴ 1.55 × 10⁻³ 0.83 2084.63 Ni 0610 6…10 4.71 × 10⁻⁴ 4.05 × 10⁻³ 0.92 908.73 NC 0610 6…10 5.29 × 10⁻⁴ 2.73 × 10⁻³ 0.88 1297.72 NC 2733 27…33 1.35 × 10⁻⁴ 9.61 × 10⁻³ 0.87 3615.7
1 Pores per inch, according to producer. 2 Pores per centimeter
4.2. Heat and Mass Transfer
The experimental setup is shown in Figure 8. The main part is the heat exchanger, in which the foam samples were tested. The foam specimen, placed in the central part of the exchanger, had a rectangular shape (45 mm × 30 mm) and was oriented perpendicular to the air flow direction. Metal foam samples were heated by the current flowing directly through the foam body (Imax ≈ 150 A ± 0.1 A). The temperatures of the foam sample and the flowing gas were measured by means of thermocouples placed on the inlet and outlet side of the sample and heat exchanger, respectively. Air flow velocity was changed in the velocity range of 0.2–11 m/s (for more details see [22,33]).
Figure 8. Experimental setup: 1—blower, 2—rotameter, 3—reactor, 4—electric power generation and control system, 5—solid foam, 6—thermocouple, 7—data acquisition system.
The heat transfer coefficient, h, and Nusselt number, Nu, were determined as:
h= QF·∆T (8)
Nu=h·dh
k (9)
where the hydraulic diameter is defined as:
dh= 4εSv (10)
Mass transfer coefficients were not determined experimentally. According to the Chilton–Colburn analogy, the mechanism of heat and mass transfer are essentially the same (see Equation (1)).
This analogy was experimentally confirmed for solid foams [15,21]. Therefore, for the purpose of this work, mass transfer coefficients were calculated based only on the heat transfer experiments.
Moreover, flow resistance experiments for the foams were also performed. The results were correlated for each foam separately (Table 1).
Figure 8. Experimental setup: 1—blower, 2—rotameter, 3—reactor, 4—electric power generation andcontrol system, 5—solid foam, 6—thermocouple, 7—data acquisition system.
The heat transfer coefficient, h, and Nusselt number, Nu, were determined as:
h =Q
F·∆T(8)
Nu =h·dh
k(9)
where the hydraulic diameter is defined as:
dh =4εSv
(10)
Mass transfer coefficients were not determined experimentally. According to the Chilton–Colburnanalogy, the mechanism of heat and mass transfer are essentially the same (see Equation (1)).
This analogy was experimentally confirmed for solid foams [15,21]. Therefore, for the purpose ofthis work, mass transfer coefficients were calculated based only on the heat transfer experiments.
Moreover, flow resistance experiments for the foams were also performed. The results werecorrelated for each foam separately (Table 1).

Catalysts 2019, 9, 587 10 of 13
4.3. Kinetic Tests
First, the appropriate catalysts were prepared. For selective catalytic reduction of NO withNH3 (SCR deNOx), ultrastabilized Y-type zeolite (USY) was synthesized under rigorous conditions,then subjected to the sonochemical irradiation with 0.5 M aqueous copper nitrate solutions (for detailssee [31]), denoted as Cu/USY/s. For CH4 combustion, a palladium catalyst (Pd/ZrO2) was prepared byimpregnation, also using a sonochemically irradiated catalyst precursor (for details see [34]). Kinetictests for both catalysts were performed using a Catlab (Hiden Analytical, Warrington, UK) fixed-bedquartz tubular test reactor. For SCR deNOx, the experiments were carried out at atmospheric pressurewithin a temperature range of 50–550 ◦C using a gas mixture containing 2500 ppm of NO, 2500 ppm ofNH3, and 25,000 ppm of O2 balanced by helium, with a total flow rate of 40 mL/min [31]. For methanecatalytic combustion tests, the temperature ranged from 100 ◦C to 550 ◦C and gas composition was setto 2000 ppm CH4/Air [35].
5. Conclusions
The experimental results show that the heat/mass transfer intensity for solid foams is much moreintense than that of monoliths and similar to that of packed beds. In turn, performance modellingindicated that, for slow kinetics, when the impact of mass transfer intensity is weak; specific surfacearea (or catalyst amount) is the decisive factor. For fast kinetics, mass transfer plays a more importantrole, being the limiting parameter of the process. For carriers of intense mass transfer, such as solidfoams, the reactor length is much shorter than for the others and flow resistance can be much lowerdue to reactor shortening.
Depending on the reaction enthalpy, inlet concentration, and temperature, heat transfer ratebetween catalyst surface and the bulk reactant stream may be insufficient. The remedy is lowering inlettemperature or substrate concentration, as well as the selection of the catalyst carrier with the mostfavorable transport parameters. As was presented, the heat and mass transport properties of solidfoams are comparable to packed bed and much higher than those of monoliths. Moreover, solid foamsoffer much lower flow resistance than packed bed. Therefore, solid foams are very promising catalystcarriers, especially for fast reaction.
Author Contributions: Conceptualization, A.G.; Investigation, K.S., M.I., M.P., W.M., P.J. and S.W.; Methodology,P.J., S.W., M.S. and J.Ł.; Supervision, A.G. and A.K.; Writing—original draft, A.G.; Writing—review & editing, A.K.
Funding: The research was supported by the National Science Centre (Projects No. DEC-2011/03/B/ST8/05455,DEC-2016/21/B/ST8/00496, and DEC-2016/23/B/ST8/02024).
Conflicts of Interest: The authors declare no conflict of interest.
List of Symbols
CA reagent concentration in gas stream, mol/m3
cp specific heat, J/(kg·K)D diameter, mDA diffusivity, m2/sdc cell diameter, mdh hydraulic diameter, mds strut diameter, m
ey average relative error, =
∑ni>1|Nuexp−Nucorr |·100
Nuexp
n , %F heat transfer area, m2
f Fanning friction factor, ∆PL = 2 f ρw2
ε2Dh heat transfer coefficient, W/(m2
·K)k thermal conductivity, W/(m·K)kC mass transfer coefficient, m/skr reaction rate constant

Catalysts 2019, 9, 587 11 of 13
k∞ pre-exponential coefficient in Arrhenius equation, m/sL bed or channel length, mL+ dimensionless length for the hydrodynamic entrance region, = L/(D·Re)L* dimensionless length for the thermal entrance region, = L/(D·Re·Pr)L*M dimensionless length for the mass transfer entrance region, = L/(D·Re·Sc)Nu Nusselt number, = h·D/kPr Prandtl number, = Cp· µ/kQ heat flow rate, W(−RA) reaction rate, mol/(m2
·s)Re Reynolds number, = w·D·%/(µ·ε)Sc Schmidt number, = µ/(%·DA)Sh Sherwood number, = kC·D/DASv specific surface area (external surface area per unit volume of bed) m2/m3
T temperature, Kw superficial velocity, m/s∆HR standard heat of reaction, J/mol∆P pressure drop, Pa
∆Tlogarithmic mean temperature difference between gas and structure surface at the inletand outlet sides
z reactor axis, mε porosityη effectiveness factor for catalystµ dynamic viscosity (Pa·s)% density (kg/m3)
Subscripts
ds based on strut diameters refers to the catalyst surface
References
1. Giani, L.; Groppi, G.; Tronconi, E. Mass-transfer characterization of metallic foams as supports for structuredcatalysts. Ind. Eng. Chem. Res. 2005, 44, 4993–5002. [CrossRef]
2. Gancarczyk, A.; Iwaniszyn, M.; Piatek, M.; Korpys, M.; Sindera, K.; Jodlowski, P.J.; Lojewska, J.; Kolodziej, A.Catalytic combustion of low-concentration methane on structured catalyst supports. Ind. Eng. Chem. Res.2018, 57, 10281–10291. [CrossRef]
3. Patcas, F.C.; Garrido, G.I.; Kraushaar-Czarnetzki, B. Co oxidation over structured carriers: A comparison ofceramic foams, honeycombs and beads. Chem. Eng. Sci. 2007, 62, 3984–3990. [CrossRef]
4. Pestryakov, A.N.; Yurchenko, E.N.; Feofilov, A.E. Foam-metal catalysts for purification of waste gases andneutralization of automotive emissions. Catal. Today 1996, 29, 67–70. [CrossRef]
5. Ochonska-Kryca, J.; Iwaniszyn, M.; Piatek, M.; Jodłowski, P.J.; Thomas, J.; Kołodziej, A.; Łojewska, J.Mass transport and kinetics in structured steel foam reactor with cu-zsm-5 catalyst for scr of nox withammonia. Catal. Today 2013, 216, 135–141. [CrossRef]
6. Liu, Y.; Xu, J.; Li, H.R.; Cai, S.X.; Hu, H.; Fang, C.; Shi, L.Y.; Zhang, D.S. Rational design and in situ fabricationof MnO2@NiCO2O4 nanowire arrays on ni foam as high-performance monolith de-nox catalysts. J. Mater.Chem. A 2015, 3, 11543–11553. [CrossRef]
7. Giani, L.; Cristiani, C.; Groppi, G.; Tronconi, E. Washcoating method for pd/γ-Al2O3 deposition on metallicfoams. Appl. Catal. B 2006, 62, 121–131. [CrossRef]
8. Cimino, S.; Lisi, L.; Totarella, G.; Barison, S.; Musiani, M.; Verlato, E. Highly stable core–shell pt-CeO2
nanoparticles electrochemically deposited onto fecralloy foam reactors for the catalytic oxidation of co. J. Ind.Eng. Chem. 2018, 66, 404–410. [CrossRef]
9. Cimino, S.; Gerbasi, R.; Lisi, L.; Mancino, G.; Musiani, M.; Vázquez-Gómez, L.; Verlato, E. Oxidation ofco and ch4 on pd–fecralloy foam catalysts prepared by spontaneous deposition. Chem. Eng. J. 2013, 230,422–431. [CrossRef]

Catalysts 2019, 9, 587 12 of 13
10. Ambrosetti, M.; Balzarotti, R.; Cristiani, C.; Groppi, G.; Tronconi, E. The influence of the washcoat depositionprocess on high pore density open cell foams activation for co catalytic combustion. Catalysts 2018, 8, 510.[CrossRef]
11. Podyacheva, O.Y.; Ketov, A.A.; Ismagilov, Z.R.; Ushakov, V.A.; Bos, A.; Veringa, H.J. Metal foam supportedperovskite catalysts. React. Kinet. Catal. Lett. 1997, 60, 243–250. [CrossRef]
12. Balzarotti, R.; Beretta, A.; Groppi, G.; Tronconi, E. A comparison between washcoated and packed copperfoams for the intensification of methane steam reforming. React. Chem. Eng. 2019. [CrossRef]
13. Pestryakov, A.N.; Fyodorov, A.A.; Shurov, V.A.; Gaisinovich, M.S.; Fyodorova, I.V. Foam metal catalystswith intermediate support for deep oxidation of hydrocarbons. React. Kinet. Catal. Lett. 1994, 53, 347–352.[CrossRef]
14. Pestryakov, A.N.; Fyodorov, A.A.; Gaisinovich, M.S.; Shurov, V.P.; Fyodorova, I.V.; Gubaydulina, T.A. Metalfoam catalysts with supported active phase for deep oxidation of hydrocarbons. React. Kinet. Catal. Lett.1995, 54, 167–172. [CrossRef]
15. Giani, L.; Groppi, G.; Tronconi, E. Heat transfer characterization of metallic foams. Ind. Eng. Chem. Res. 2005,44, 9078–9085. [CrossRef]
16. Das, S.; Deen, N.G.; Kuipers, J.A.M. Direct numerical simulation for flow and heat transfer through randomopen-cell solid foams: Development of an ibm based cfd model. Catal. Today 2016, 273, 140–150. [CrossRef]
17. Calmidi, V.V.; Mahajan, R.L. Forced convection in high porositymetal foams. J. Heat Transf. 2000, 122, 557–565.[CrossRef]
18. Mancin, S.; Zilio, C.; Diani, A.; Rossetto, L. Air forced convection through metal foams: Experimental resultsand modeling. Int. J. Heat Mass Transf. 2013, 62, 112–123. [CrossRef]
19. Huu, T.T.; Lacroix, M.; Huu, C.P.; Schweich, D.; Edouard, D. Towards a more realistic modeling of solid foam:Use of the pentagonal dodecahedron geometry. Chem. Eng. Sci. 2009, 64, 5131–5142. [CrossRef]
20. Garrido, G.I.; Kraushaar-Czarnetzki, B. A general correlation for mass transfer in isotropic and anisotropicsolid foams. Chem. Eng. Sci. 2010, 65, 2255–2257. [CrossRef]
21. Groppi, G.; Giani, L.; Tronconi, E. Generalized correlation for gas/solid mass-transfer coefficients in metallicand ceramic foams. Ind. Eng. Chem. Res. 2007, 46, 3955–3958. [CrossRef]
22. Gancarczyk, A.; Iwaniszyn, M.; Piatek, M.; Sindera, K.; Korpys, M.; Jodłowski, P.J.; Łojewska, J.; Kołodziej, A.Interfacial heat and momentum transfer relation for porous media. Int. J. Therm. Sci. 2018, 132, 42–51.[CrossRef]
23. Gancarczyk, A.; Piatek, M.; Iwaniszyn, M.; Jodlowski, P.J.; Lojewska, J.; Kowalska, J.; Kolodziej, A. In searchof governing gas flow mechanism through metal solid foams. Catalysts 2017, 7, 124. [CrossRef]
24. Piatek, M.; Gancarczyk, A.; Iwaniszyn, M.; Jodlowski, P.J.; Lojewska, J.; Kolodziej, A. Gas-phase flowresistance of metal foams: Experiments and modeling. ALChE J. 2017, 63, 1799–1803. [CrossRef]
25. Žkauskas, A. Heat transfer from tubes in crossflow. Adv. Heat Transf. 1987, 18, 87–159.26. Hawthorne, R.D. Afterburner catalysis—Effects of heat and mass transfer between gas and catalyst surface.
ALChE Symp. Ser. 1974, 70, 428–438.27. Bird, R.B. Transport Phenomena; Wiley: New York, NY, USA, 1960; 780p.28. Wakao, N.; Kaguei, S. Heat and Mass Transfer in Packed Beds; Gordon and Breach Science Publisher: New York,
NY, USA, 1982.29. Kołodziej, A.; Łojewska, J.; Tyczkowski, J.; Jodłowski, P.; Redzynia, W.; Iwaniszyn, M.; Zapotoczny, S.;
Kustrowski, P. Coupled engineering and chemical approach to the design of a catalytic structured reactorfor combustion of vocs: Cobalt oxide catalyst on knitted wire gauzes. Chem. Eng. J. 2012, 200, 329–337.[CrossRef]
30. Kolodziej, A.; Lojewska, J. Prospect of compact afterburners based on metallic microstructures. Design andmodelling. Top. Catal. 2007, 42, 475–480. [CrossRef]
31. Jodlowski, P.J.; Kuterasinski, L.; Jedrzejczyk, R.J.; Chlebda, D.; Gancarczyk, A.; Basag, S.; Chmielarz, L.Deno(x) abatement modelling over sonically prepared copper usy and zsm5 structured catalysts. Catalysts2017, 7, 205. [CrossRef]
32. Leszczynski, B.; Gancarczyk, A.; Wróbel, A.; Piatek, M.; Łojewska, J.; Kołodziej, A.; Pedrys, R. Global andlocal thresholding methods applied to x-ray microtomographic analysis of metallic foams. J. Nondestruc. Eval.2016, 35, 35. [CrossRef]

Catalysts 2019, 9, 587 13 of 13
33. Kołodziej, A.; Łojewska, J.; Ochonska, J.; Łojewski, T. Short-channel structured reactor: Experiments versusprevious theoretical design. Chem. Eng. Process. 2011, 50, 869–876. [CrossRef]
34. Jodlowski, P.J.; Jedrzejczyk, R.J.; Chlebda, D.K.; Dziedzicka, A.; Kuterasinski, L.; Gancarczyk, A.;Sitarz, M. Non-noble metal oxide catalysts for methane catalytic combustion: Sonochemical synthesisand characterisation. Nanomaterials 2017, 7, 174. [CrossRef] [PubMed]
35. Jodłowski, P.J.; Jedrzejczyk, R.J.; Gancarczyk, A.; Łojewska, J.; Kołodziej, A. New method of determination ofintrinsic kinetic and mass transport parameters from typical catalyst activity tests: Problem of mass transferresistance and diffusional limitation of reaction rate. Chem. Eng. Sci. 2017, 162, 322–331. [CrossRef]
© 2019 by the authors. Licensee MDPI, Basel, Switzerland. This article is an open accessarticle distributed under the terms and conditions of the Creative Commons Attribution(CC BY) license (http://creativecommons.org/licenses/by/4.0/).