metal forming january machinery 2010 industry in india
TRANSCRIPT
METAL
JANUARY
METAL FORMING
JANUARY 2010
MACHINERY 2010 INDUSTRY
IN INDIAPRESSES SHEET METAL SECTIONS
IN INDIAPRESSES SHEET METAL SECTIONS
Indian Machine Tool Manufacturers’ Associationwww.imtma.in1
Forward by the President of IMTMA
• Metal forming plays a major role in the production of diverse products starting with large formed parts inthe automobile industry to high precision components for the instrumentation and electronics industries,and everywhere in-between. The defence and aerospace industries use formed parts in variousapplications from missile components to ordnance items. Progress in metal forming technologies haspp p g g gbeen rapid, keeping pace with the need to improve productivity, precision and volumes. Metal formingaccounts for nearly 40 percent of total machine tools consumption in India, pointing to its growingimportance.
• The metal forming machinery industry in India has been serving the need for formed parts through themanufacture of a variety of metal forming presses, sheet working machinery and others. However, theindustry has yet to meet the demand for higher technology machines. As a result the market share forIndian machines is low, and imports meet a large part of the demand for metal forming machines.
• IMTMA has commissioned this study of the metal forming machinery industry in India to gain anunderstanding of its potentials and prospects which will be valuable inputs for machinery manufacturersin developing new technologies, products and markets. The report brings out:
– The global and Indian position in metal forming machinesThe global and Indian position in metal forming machines– A profile of the metal forming machinery industry in India– Expectations of users in technology and product capabilities– Anticipated demand for metal forming machinery in India, by major product types and user
segmentssegments– User perceptions about Indian machines and areas requiring attention
2
Forward by the President of IMTMA
• The report has been developed for IMTMA by Feedback Business Consulting Services, Bangalore. I would like to thank their research team for their work in taking up and completing this report in time for its publication at IMTEX Forming 2010.
• IMTMA would like to acknowledge the suggestions and inputs received from the following in the course of preparing this report:
• Mr.Shailesh Sheth, Past President, IMTMA• Mr R D Madan President ISGEC YamunanagarMr.R.D.Madan, President, ISGEC, Yamunanagar• Ms.Ingrid Rasquinha, Director, Production, Electropneumatics and Hydraulics (India) Private Ltd., Pune• Mr.P.J.Mohanram, Senior Adviser (Technology), IMTMA, Bangalore
• This study report is a valuable reference work which can help manufacturers of metal forming machinesThis study report is a valuable reference work which can help manufacturers of metal forming machinesin India to develop strategies and plans to meet the potentially large requirement for such machines. Iam sure this report will be of use to the existing metal forming machinery manufacturers in guiding theirfurther expansion and development plans, as well as in attracting new investment to this growing field.
M.Lokeswara Rao
President
BangaloreJanuary 21, 2010
3
Table of Contents
Definitions
Approach & Methodology, Coverage
Objectives, Deliverables
BACKGROUNDI
Definitions
OVERVIEW OF INDIAN ECONOMYII
INDIAN MANUFACTURING SECTOR OVERVIEWIII
GLOBAL METAL FORMING INDUSTRY DETAILSIV
Global trends and markets – Production, consumption trends by country
Technology trends and developments
INDIAN METAL FORMING MACHINERY INDUSTRY V
Comparison of Indian and International machinery manufacturers
Industry structure, Products offered, Geographical clusters
Customer perceptions, Verbatim
INDIAN METAL FORMING MACHINERY MARKET ESTIMATES VI
Market estimates by type of Machinery, Segments
Approach and Methodology, Future market estimates
INDIAN METAL FORMING MACHINERY FUTURE ESTIMATES VII
Opportunity areas and Action points
OPPORTUNITY ASSESSMENT AND RECOMMENDATIONSVIII
4
Engagement backgroundEngagement background
5
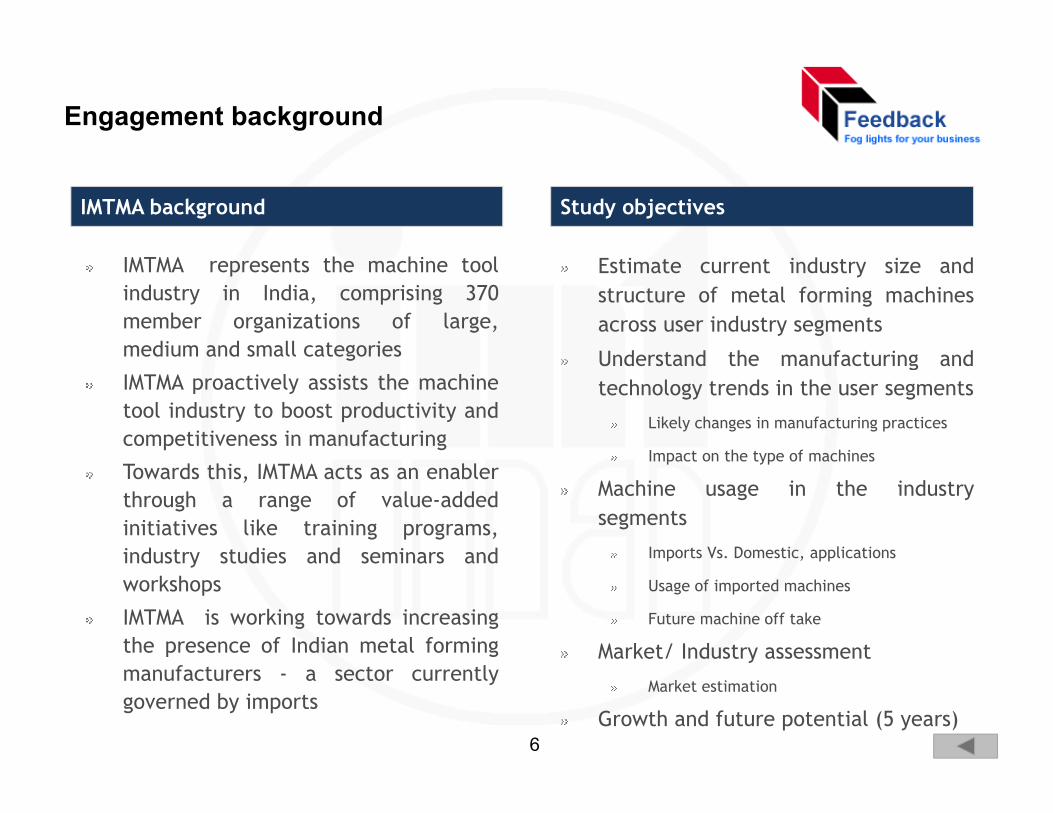
Engagement background
IMTMA background Study objectives
IMTMA represents the machine toolindustry in India, comprising 370member organizations of large,medium and small categories
Estimate current industry size andstructure of metal forming machinesacross user industry segments
Understand the manufacturing andmedium and small categories
IMTMA proactively assists the machinetool industry to boost productivity andcompetitiveness in manufacturing
Understand the manufacturing andtechnology trends in the user segments
Likely changes in manufacturing practices
Impact on the type of machinesTowards this, IMTMA acts as an enablerthrough a range of value-addedinitiatives like training programs,industry studies and seminars and
Impact on the type of machines
Machine usage in the industrysegments
Imports Vs. Domestic, applicationsindustry studies and seminars andworkshops
IMTMA is working towards increasingthe presence of Indian metal forming
p , pp
Usage of imported machines
Future machine off take
Market/ Industry assessmentmanufacturers - a sector currentlygoverned by imports
Market estimation
Growth and future potential (5 years)6
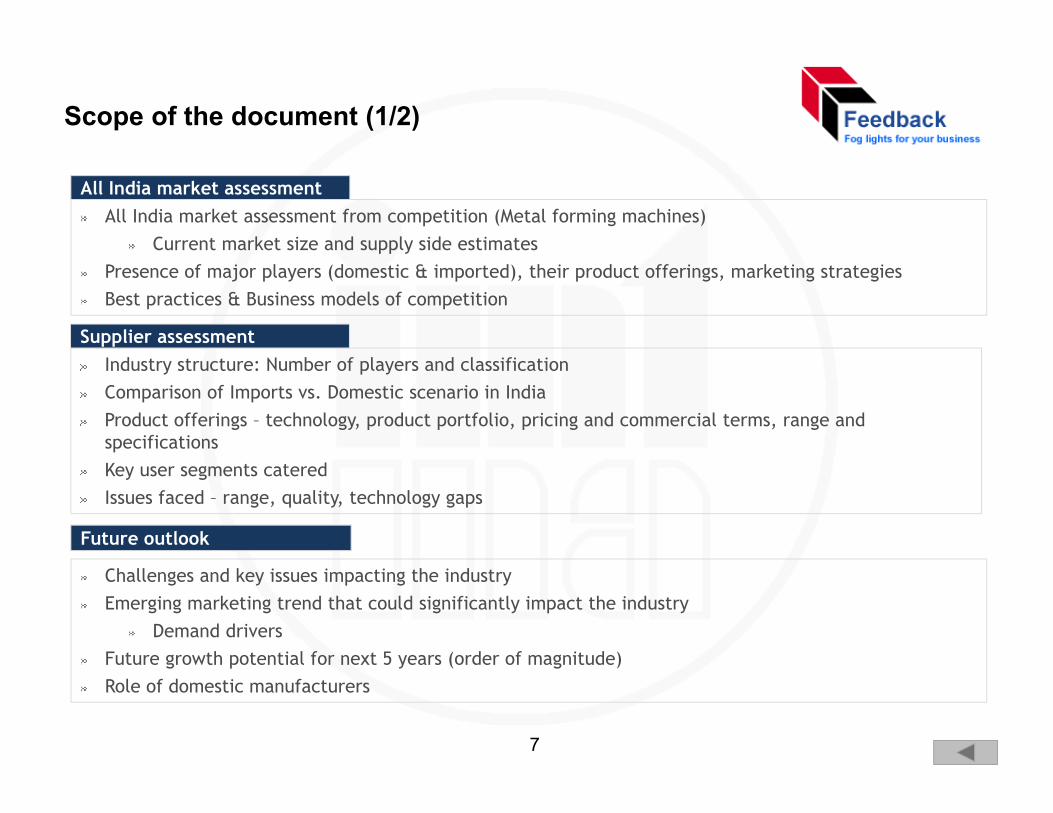
Scope of the document (1/2)
All India market assessment from competition (Metal forming machines) Current market size and supply side estimates
All India market assessment
Supplier assessment
pp yPresence of major players (domestic & imported), their product offerings, marketing strategies Best practices & Business models of competition
Industry structure: Number of players and classification Comparison of Imports vs. Domestic scenario in IndiaProduct offerings – technology, product portfolio, pricing and commercial terms, range and specifications Key user segments catered Issues faced – range, quality, technology gaps
Future outlook
Challenges and key issues impacting the industry Emerging marketing trend that could significantly impact the industry
Demand driversFuture growth potential for next 5 years (order of magnitude) Future growth potential for next 5 years (order of magnitude) Role of domestic manufacturers
7
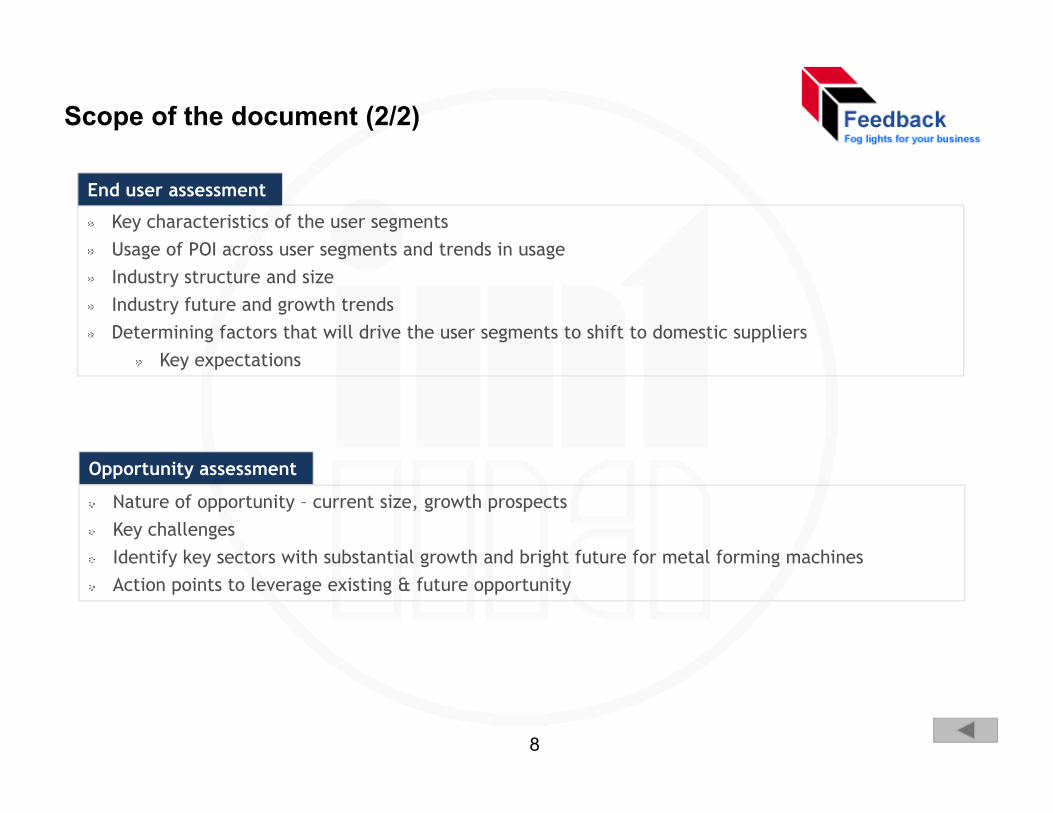
Scope of the document (2/2)
Key characteristics of the user segmentsUsage of POI across user segments and trends in usage
End user assessment
Usage of POI across user segments and trends in usage Industry structure and size Industry future and growth trends Determining factors that will drive the user segments to shift to domestic suppliers
K t ti Key expectations
Nature of opportunity – current size, growth prospectsKey challenges Identify key sectors with substantial growth and bright future for metal forming machines
Opportunity assessment
Identify key sectors with substantial growth and bright future for metal forming machines Action points to leverage existing & future opportunity
8
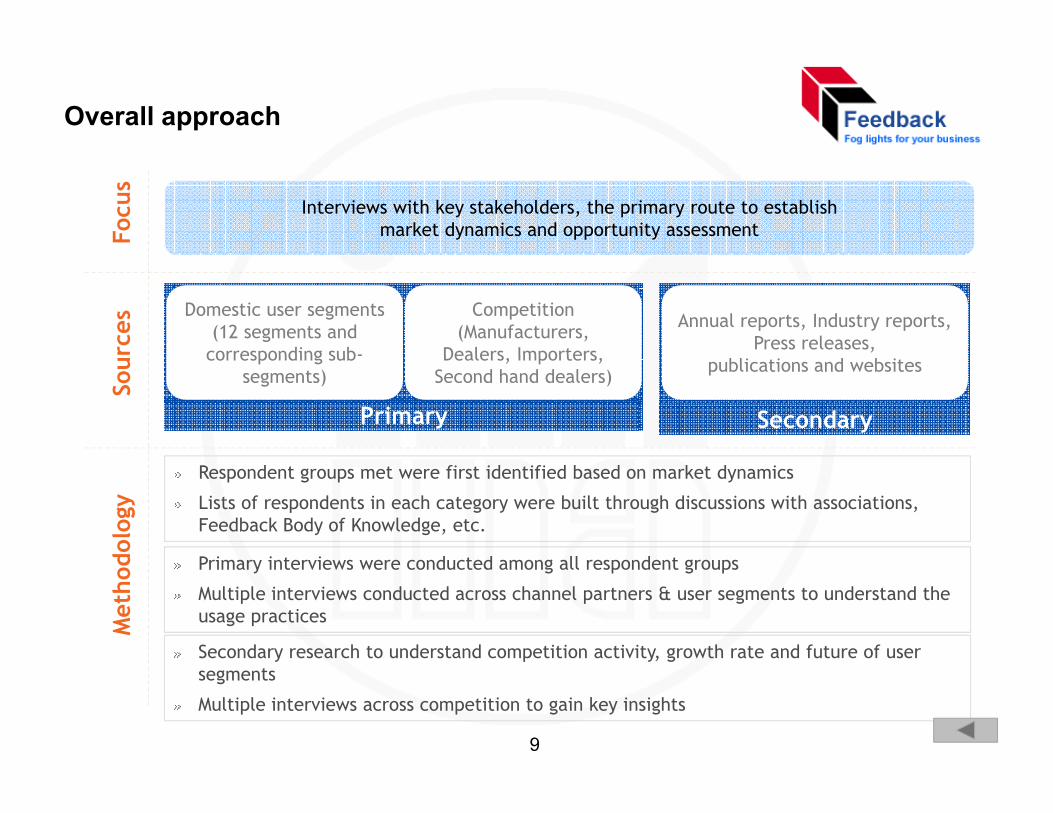
Overall approachFo
cus
Interviews with key stakeholders, the primary route to establish market dynamics and opportunity assessment
rces
Domestic user segments(12 segments and
corresponding sub-
Competition (Manufacturers,
Dealers Importers
Annual reports, Industry reports, Press releases,
Sou
Primary Secondary
corresponding sub-segments)
Dealers, Importers, Second hand dealers) publications and websites
dolo
gy
Respondent groups met were first identified based on market dynamics
Lists of respondents in each category were built through discussions with associations, Feedback Body of Knowledge, etc.
Primary interviews were conducted among all respondent groups
Met
hod Primary interviews were conducted among all respondent groups
Multiple interviews conducted across channel partners & user segments to understand the usage practices
Secondary research to understand competition activity, growth rate and future of user segments
Multiple interviews across competition to gain key insights
9
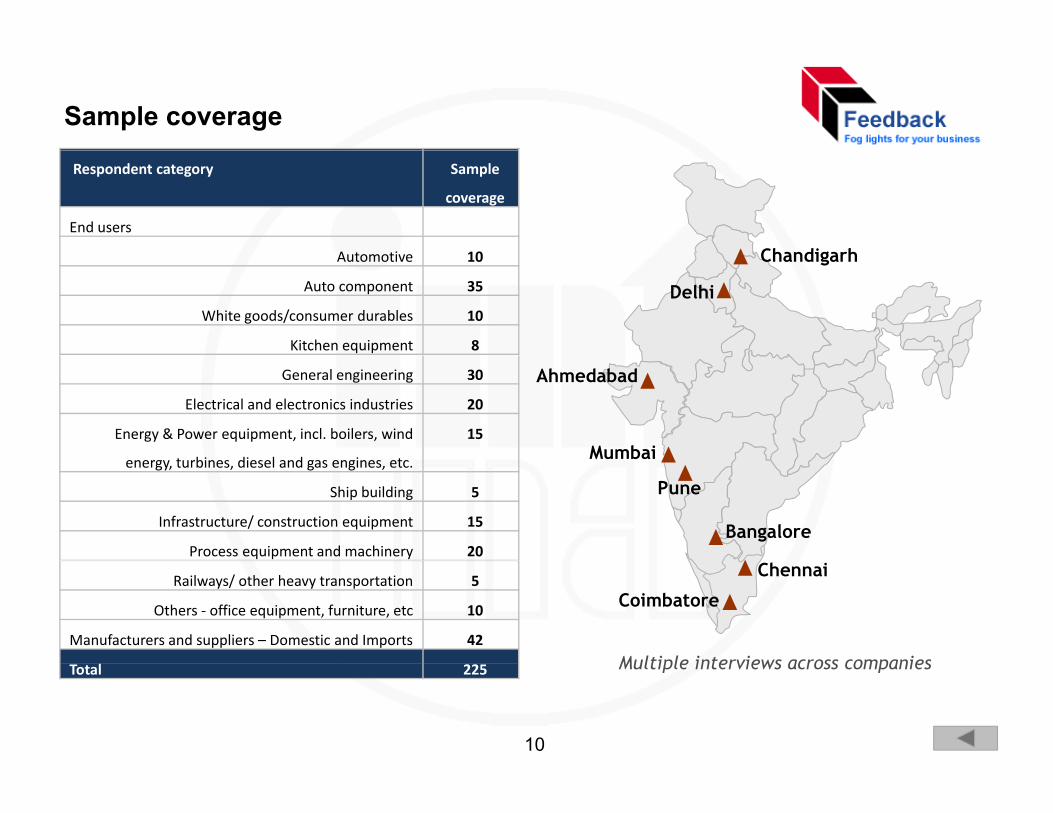
Sample coverage
Chandigarh
Respondent category Sample
coverage
End users
A t ti 10
Delhi
Chandigarh Automotive 10
Auto component 35
White goods/consumer durables 10
Kitchen equipment 8
Mumbai
AhmedabadGeneral engineering 30
Electrical and electronics industries 20
Energy & Power equipment, incl. boilers, wind
bi di l d i
15
Bangalore
Mumbai
Puneenergy, turbines, diesel and gas engines, etc.
Ship building 5
Infrastructure/ construction equipment 15
Process equipment and machinery 20Chennai
CoimbatoreRailways/ other heavy transportation 5
Others ‐ office equipment, furniture, etc 10
Manufacturers and suppliers – Domestic and Imports 42
Multiple interviews across companiesTotal 225 Multiple interviews across companies
10
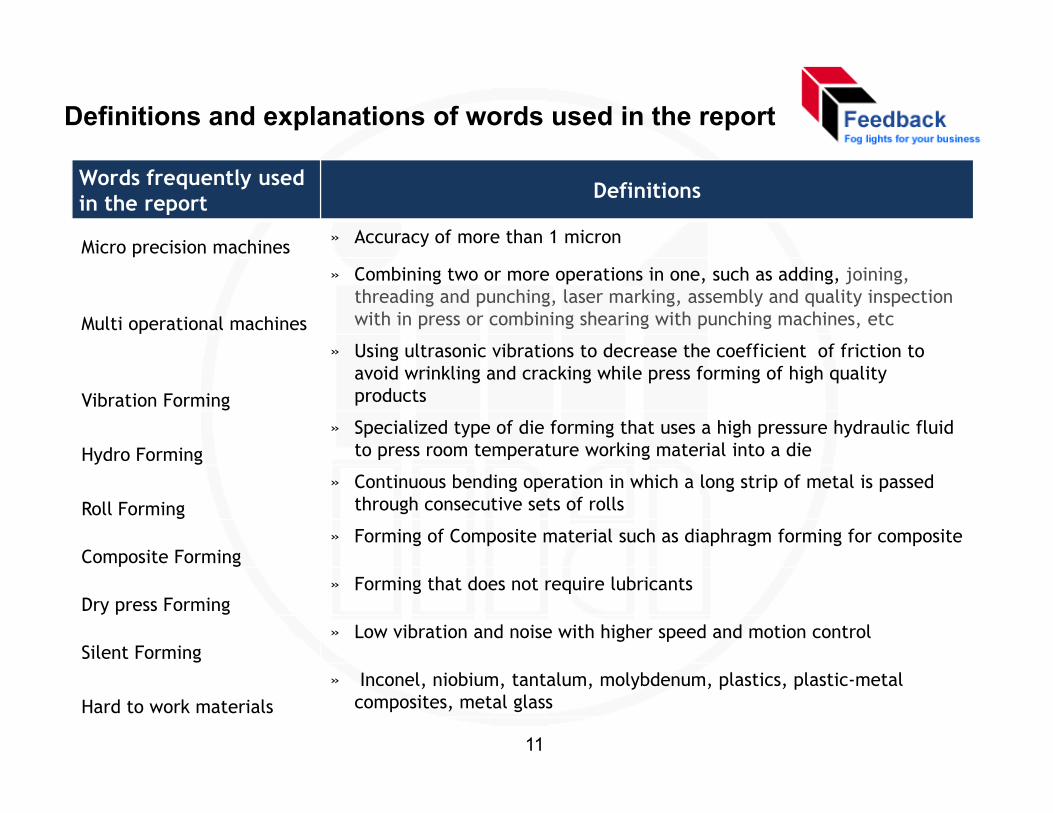
Definitions and explanations of words used in the report
Words frequently used in the report Definitions
Micro precision machines » Accuracy of more than 1 micronMicro precision machines
Multi operational machines
» Combining two or more operations in one, such as adding, joining, threading and punching, laser marking, assembly and quality inspection with in press or combining shearing with punching machines, etc
» Using ultrasonic vibrations to decrease the coefficient of friction to
Vibration Forming
Using ultrasonic vibrations to decrease the coefficient of friction to avoid wrinkling and cracking while press forming of high quality products
Hydro Forming» Specialized type of die forming that uses a high pressure hydraulic fluid
to press room temperature working material into a dieHydro Forming p p g
Roll Forming» Continuous bending operation in which a long strip of metal is passed
through consecutive sets of rolls
Composite Forming» Forming of Composite material such as diaphragm forming for composite
Composite Forming
Dry press Forming» Forming that does not require lubricants
Silent Forming» Low vibration and noise with higher speed and motion control
Hard to work materials» Inconel, niobium, tantalum, molybdenum, plastics, plastic-metal
composites, metal glass
11
Overview of Indian economyOverview of Indian economy
12
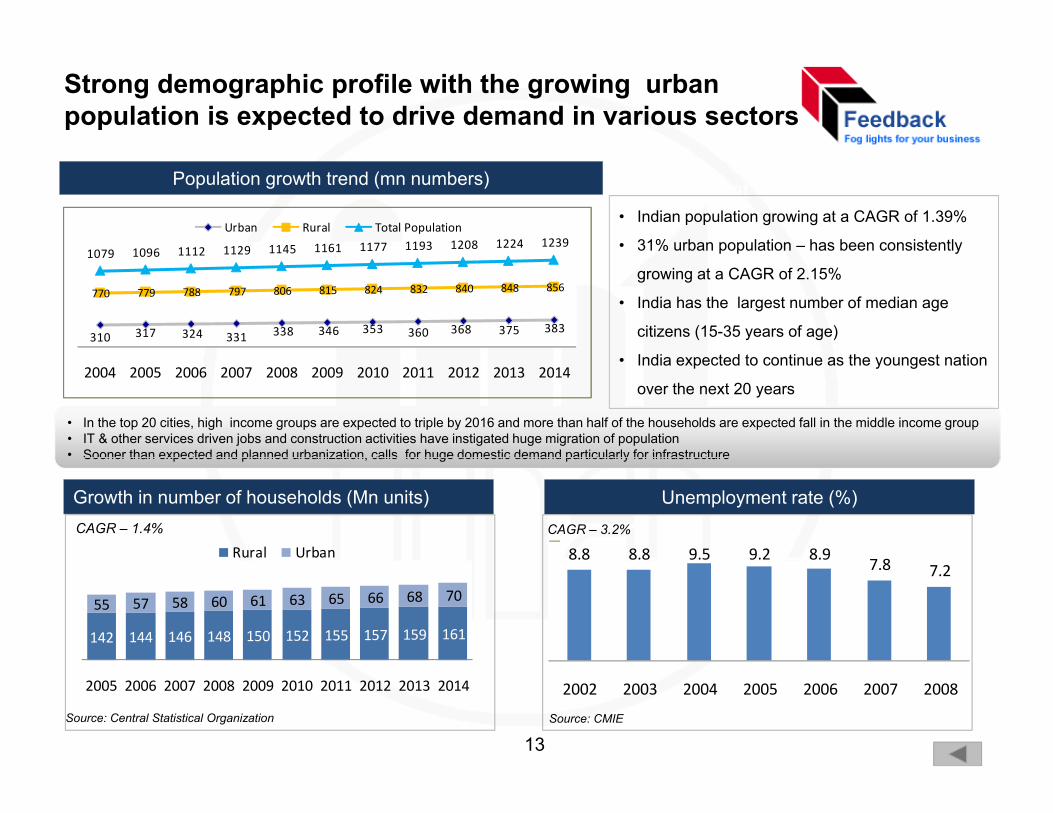
Strong demographic profile with the growing urban population is expected to drive demand in various sectors
Unemployment rate (%)
1079 1096 1112 1129 1145 1161 1177 1193 1208 1224 1239Urban Rural Total Population
Population growth trend (mn numbers)
• Indian population growing at a CAGR of 1.39%
• 31% urban population – has been consistently
310 317 324 331 338 346 353 360 368 375 383
770 779 788 797 806 815 824 832 840 848 856
1079 1096 1112 1129 1145 p p y
growing at a CAGR of 2.15%
• India has the largest number of median age
citizens (15-35 years of age)
I di t d t ti th t ti2004 2005 2006 2007 2008 2009 2010 2011 2012 2013 2014
• In the top 20 cities, high income groups are expected to triple by 2016 and more than half of the households are expected fall in the middle income group • IT & other services driven jobs and construction activities have instigated huge migration of population• Sooner than expected and planned urbanization, calls for huge domestic demand particularly for infrastructure
• India expected to continue as the youngest nation
over the next 20 years
8.8 8.8 9.5 9.2 8.97 8
Rural Urban
Sooner than expected and planned urbanization, calls for huge domestic demand particularly for infrastructure
CAGR – 3.2%CAGR – 1.4%
Growth in number of households (Mn units) Unemployment rate (%)
7.8 7.2
142 144 146 148 150 152 155 157 159 161
55 57 58 60 61 63 65 66 68 70
2002 2003 2004 2005 2006 2007 20082005 2006 2007 2008 2009 2010 2011 2012 2013 2014
Source: CMIESource: Central Statistical Organization
13
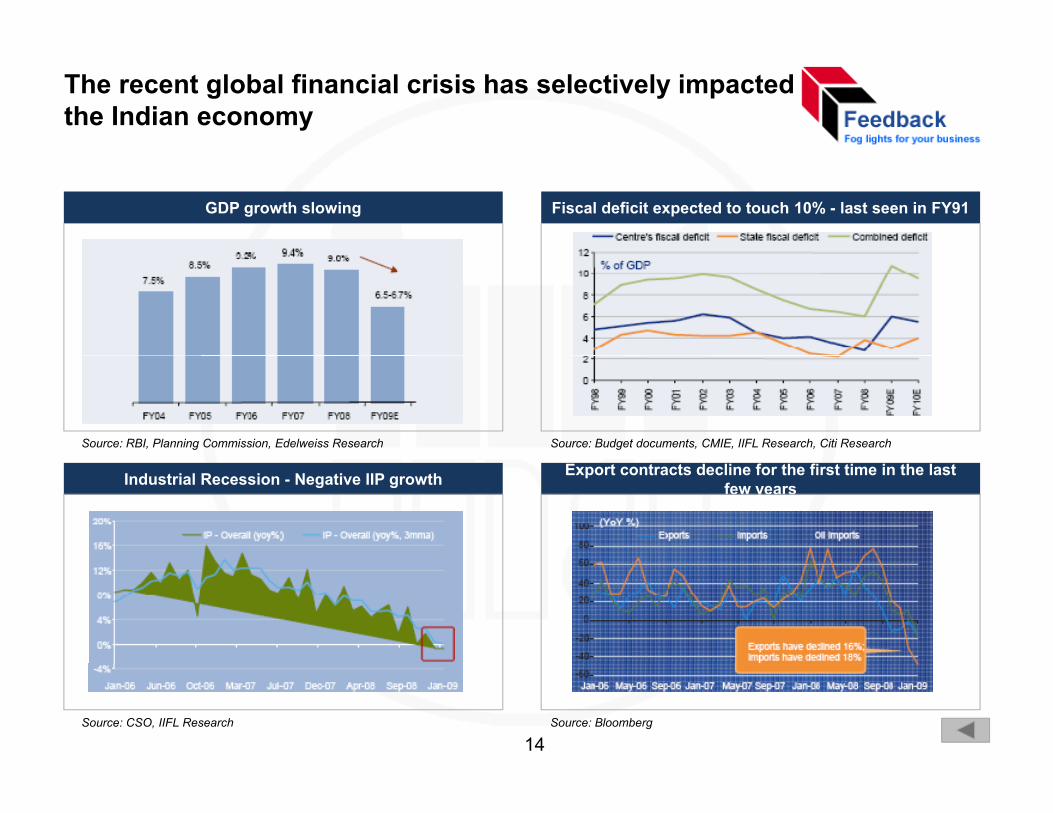
The recent global financial crisis has selectively impacted the Indian economy
GDP growth slowing Fiscal deficit expected to touch 10% - last seen in FY91
Source: RBI, Planning Commission, Edelweiss Research Source: Budget documents, CMIE, IIFL Research, Citi Research
Industrial Recession - Negative IIP growth Export contracts decline for the first time in the last few years
Source: CSO, IIFL Research Source: Bloomberg
14
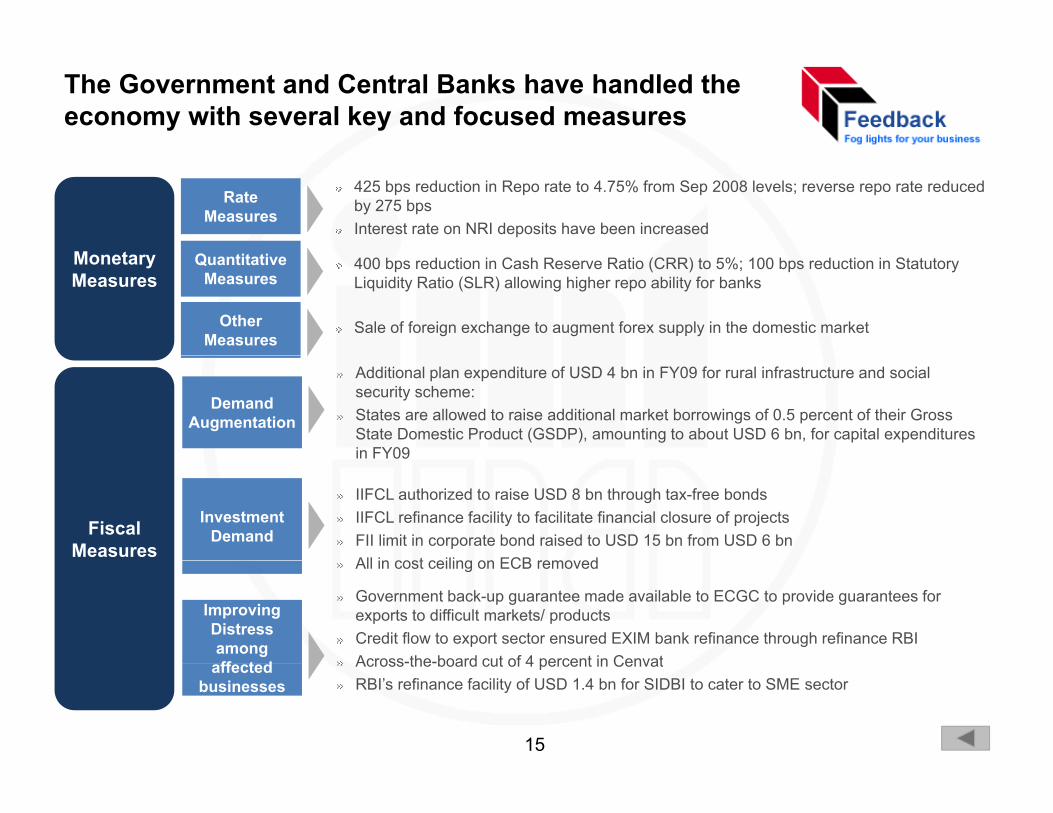
The Government and Central Banks have handled the economy with several key and focused measures
M t
RateMeasures
425 bps reduction in Repo rate to 4.75% from Sep 2008 levels; reverse repo rate reduced by 275 bpsInterest rate on NRI deposits have been increased
MonetaryMeasures
QuantitativeMeasures
400 bps reduction in Cash Reserve Ratio (CRR) to 5%; 100 bps reduction in Statutory Liquidity Ratio (SLR) allowing higher repo ability for banks
OtherMeasures
Sale of foreign exchange to augment forex supply in the domestic market
DemandAugmentation
Additional plan expenditure of USD 4 bn in FY09 for rural infrastructure and social security scheme:States are allowed to raise additional market borrowings of 0.5 percent of their Gross State Domestic Product (GSDP), amounting to about USD 6 bn, for capital expenditures in FY09
FiscalMeasures
in FY09
InvestmentDemand
IIFCL authorized to raise USD 8 bn through tax-free bondsIIFCL refinance facility to facilitate financial closure of projectsFII limit in corporate bond raised to USD 15 bn from USD 6 bnAll in cost ceiling on ECB removedAll in cost ceiling on ECB removed
ImprovingDistressamongff t d
Government back-up guarantee made available to ECGC to provide guarantees for exports to difficult markets/ productsCredit flow to export sector ensured EXIM bank refinance through refinance RBIAcross-the-board cut of 4 percent in Cenvataffected
businessesAcross-the-board cut of 4 percent in CenvatRBI’s refinance facility of USD 1.4 bn for SIDBI to cater to SME sector
15
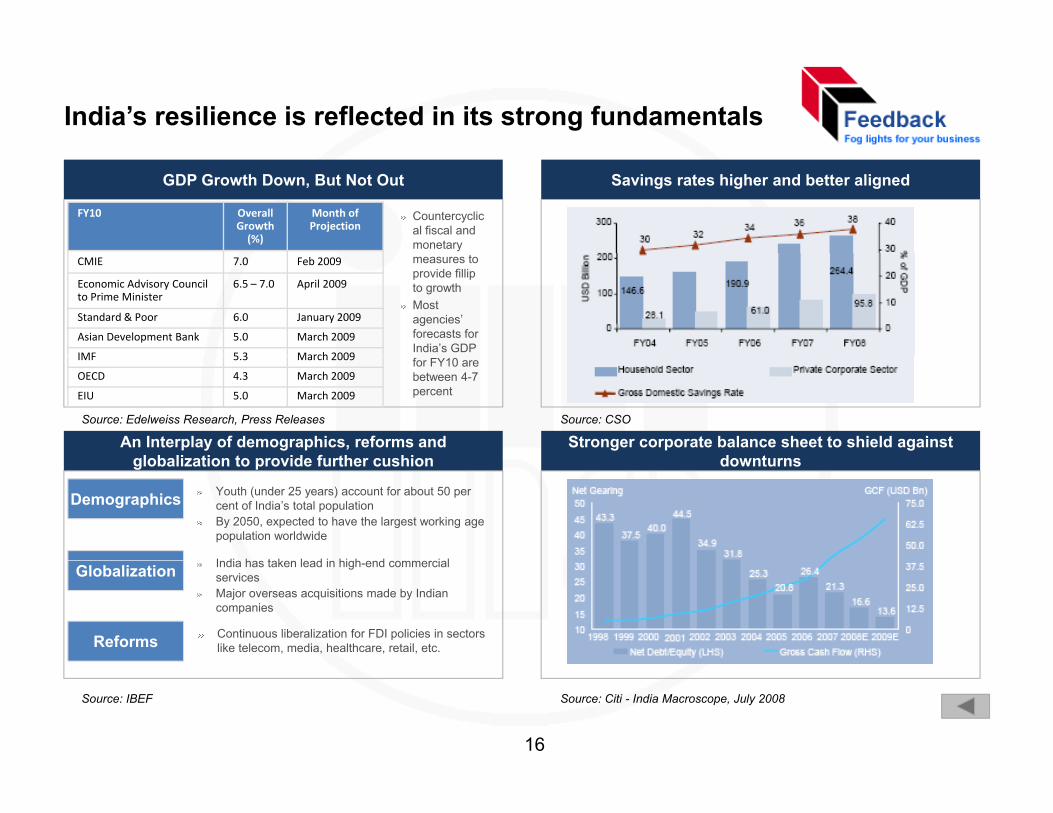
India’s resilience is reflected in its strong fundamentals
GDP Growth Down, But Not Out Savings rates higher and better aligned
FY10 OverallGrowth(%)
Month ofProjection
Countercyclical fiscal and monetary
CMIE 7.0 Feb 2009
Economic Advisory Council to Prime Minister
6.5 – 7.0 April 2009
Standard & Poor 6.0 January 2009
Asian Development Bank 5.0 March 2009
IMF 5 3 March 2009
measures to provide fillip to growth Most agencies’ forecasts for India’s GDP
Source: Edelweiss Research, Press Releases
An Interplay of demographics, reforms andglobali ation to pro ide f rther c shion
Stronger corporate balance sheet to shield against do nt rns
IMF 5.3 March 2009
OECD 4.3 March 2009
EIU 5.0 March 2009
for FY10 are between 4-7 percent
Source: CSO
globalization to provide further cushion downturns
Demographics Youth (under 25 years) account for about 50 per cent of India’s total populationBy 2050, expected to have the largest working age population worldwide
I di h t k l d i hi h d i lGlobalization India has taken lead in high-end commercial servicesMajor overseas acquisitions made by Indian companies
Reforms Continuous liberalization for FDI policies in sectors like telecom, media, healthcare, retail, etc.
Source: IBEF Source: Citi - India Macroscope, July 2008
16
Post election political scenario indicates stability on policy and increased push for reforms
Previous Government formed through coalition with various parties
Previous Government’s focus on “Inclusive Growth”
Reform agenda was blocked by coalition partners
Current Government formed by Congress Party + Allies
Some of the previous coalition partners not part of the Governmentp p p
Reforms expected, especially in BFSI, Retail, Education, Infrastructure, etc.
Increase in FDI in insurance to 49%
L i f G t St k i PSB t 33% (f 51%)Lowering of Govt Stake in PSB to 33% (from 51%)
Pension reforms
Disinvestments
Budget reflects a focus on growth stimulation in the short term and fiscal deficit
management over the long term
17
Manufacturing sector overviewManufacturing sector overview• Components and background
• Industry size and manufacturing sector output
• Private and Government investments
• Future growth rates
18
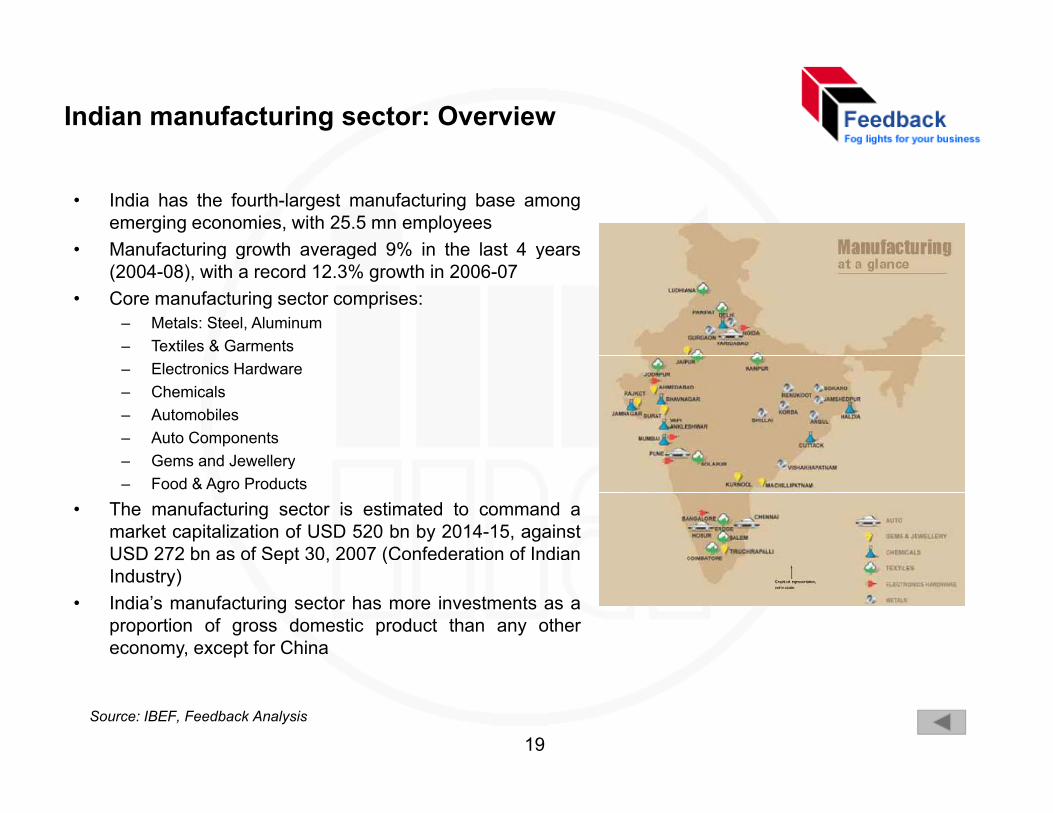
Indian manufacturing sector: Overview
• India has the fourth-largest manufacturing base amongemerging economies, with 25.5 mn employees
• Manufacturing growth averaged 9% in the last 4 yearsManufacturing growth averaged 9% in the last 4 years(2004-08), with a record 12.3% growth in 2006-07
• Core manufacturing sector comprises:– Metals: Steel, Aluminum– Textiles & Garments– Electronics Hardware– Chemicals– Automobiles– Auto Components
Gems and Jewellery– Gems and Jewellery– Food & Agro Products
• The manufacturing sector is estimated to command amarket capitalization of USD 520 bn by 2014-15, againstUSD 272 bn as of Sept 30, 2007 (Confederation of Indianp , (Industry)
• India’s manufacturing sector has more investments as aproportion of gross domestic product than any othereconomy, except for China
Source: IBEF, Feedback Analysis
19
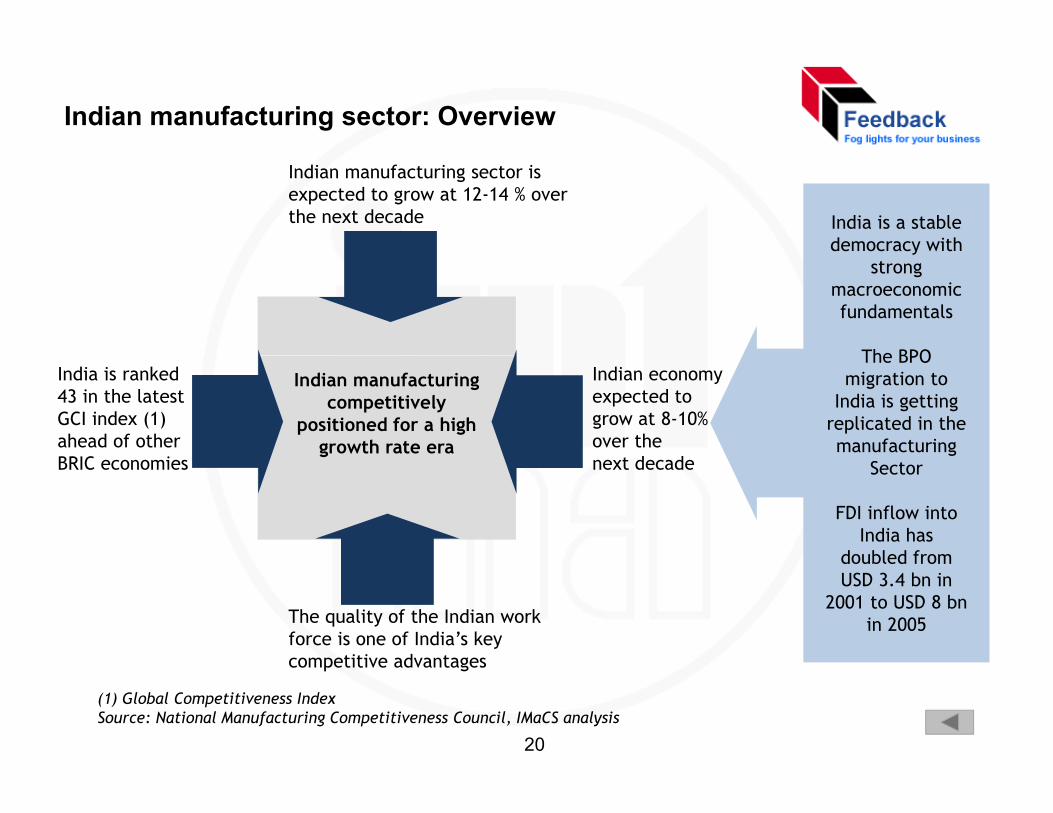
Indian manufacturing sector: Overview
Indian manufacturing sector isexpected to grow at 12-14 % over the next decade India is a stable
democracy withystrong
macroeconomicfundamentals
The BPOIndian manufacturing
competitivelypositioned for a high
growth rate era
India is ranked43 in the latestGCI index (1)ahead of otherBRIC i
Indian economyexpected togrow at 8-10% over the
t d d
The BPOmigration to
India is gettingreplicated in themanufacturing
BRIC economies next decade Sector
FDI inflow intoIndia has
doubled from
The quality of the Indian work force is one of India’s key competitive advantages
doubled fromUSD 3.4 bn in
2001 to USD 8 bnin 2005
competitive advantages
(1) Global Competitiveness IndexSource: National Manufacturing Competitiveness Council, IMaCS analysis
20
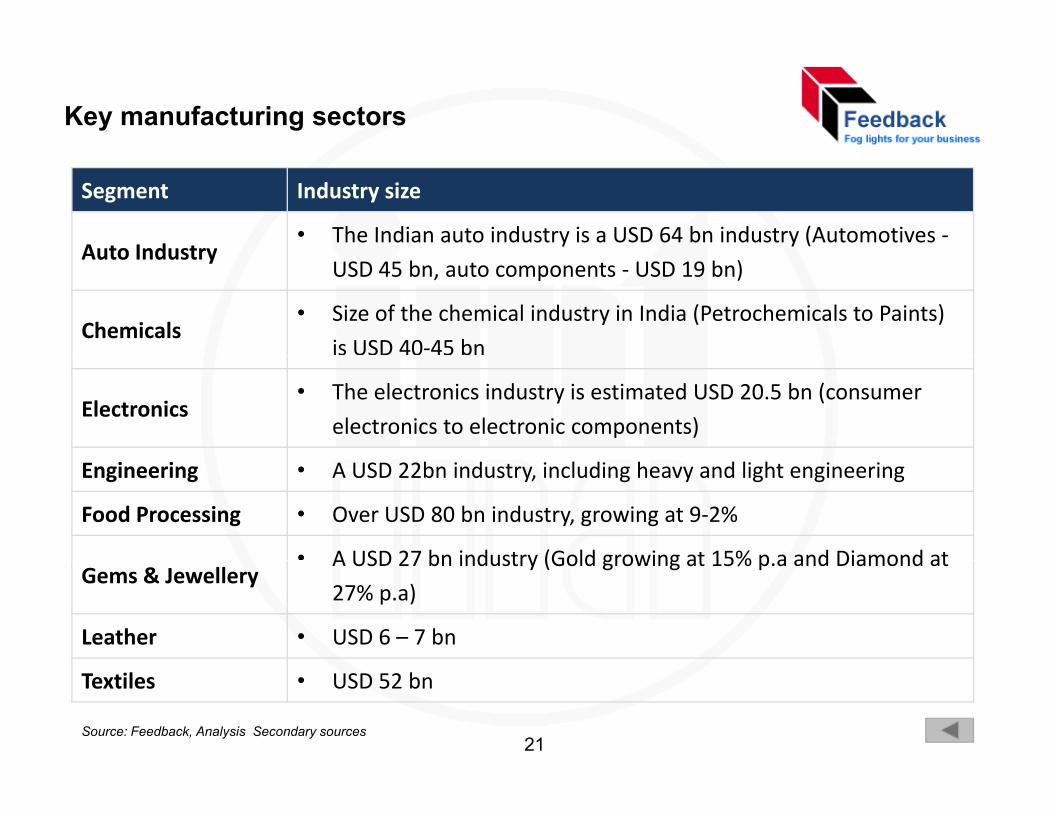
Key manufacturing sectors
Segment Industry size
Auto Industry• The Indian auto industry is a USD 64 bn industry (Automotives ‐
Auto IndustryUSD 45 bn, auto components ‐ USD 19 bn)
Chemicals• Size of the chemical industry in India (Petrochemicals to Paints)
is USD 40‐45 bn
Electronics• The electronics industry is estimated USD 20.5 bn (consumer
electronics to electronic components)
Engineering • A USD 22bn industry, including heavy and light engineering
Food Processing • Over USD 80 bn industry, growing at 9‐2%
• A USD 27 bn industry (Gold growing at 15% p a and Diamond atGems & Jewellery
A USD 27 bn industry (Gold growing at 15% p.a and Diamond at
27% p.a)
Leather • USD 6 – 7 bn
Textiles • USD 52 bn
Source: Feedback, Analysis Secondary sources21
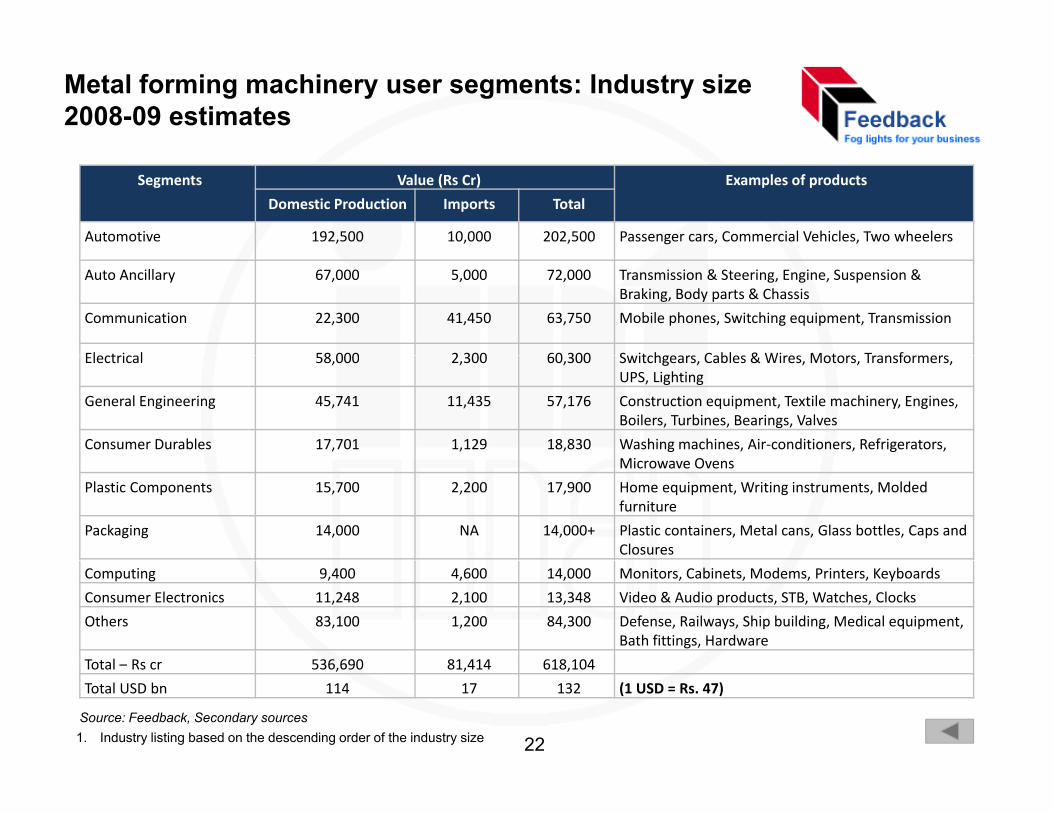
Metal forming machinery user segments: Industry size 2008-09 estimates
Segments Value (Rs Cr) Examples of products
Domestic Production Imports Total
Automotive 192,500 10,000 202,500 Passenger cars, Commercial Vehicles, Two wheelers
Auto Ancillary 67,000 5,000 72,000 Transmission & Steering, Engine, Suspension & Braking, Body parts & Chassis
Communication 22,300 41,450 63,750 Mobile phones, Switching equipment, Transmission
Electrical 58 000 2 300 60 300 S itchgears Cables & Wires Motors TransformersElectrical 58,000 2,300 60,300 Switchgears, Cables & Wires, Motors, Transformers, UPS, Lighting
General Engineering 45,741 11,435 57,176 Construction equipment, Textile machinery, Engines, Boilers, Turbines, Bearings, Valves
Consumer Durables 17,701 1,129 18,830 Washing machines, Air‐conditioners, Refrigerators, iMicrowave Ovens
Plastic Components 15,700 2,200 17,900 Home equipment, Writing instruments, Molded furniture
Packaging 14,000 NA 14,000+ Plastic containers, Metal cans, Glass bottles, Caps and Closures
Computing 9,400 4,600 14,000 Monitors, Cabinets, Modems, Printers, Keyboards
Consumer Electronics 11,248 2,100 13,348 Video & Audio products, STB, Watches, Clocks
Others 83,100 1,200 84,300 Defense, Railways, Ship building, Medical equipment, Bath fittings, Hardware
Total Rs cr 536 690 81 414 618 104
Source: Feedback, Secondary sources
Total – Rs cr 536,690 81,414 618,104
Total USD bn 114 17 132 (1 USD = Rs. 47)
1. Industry listing based on the descending order of the industry size 22
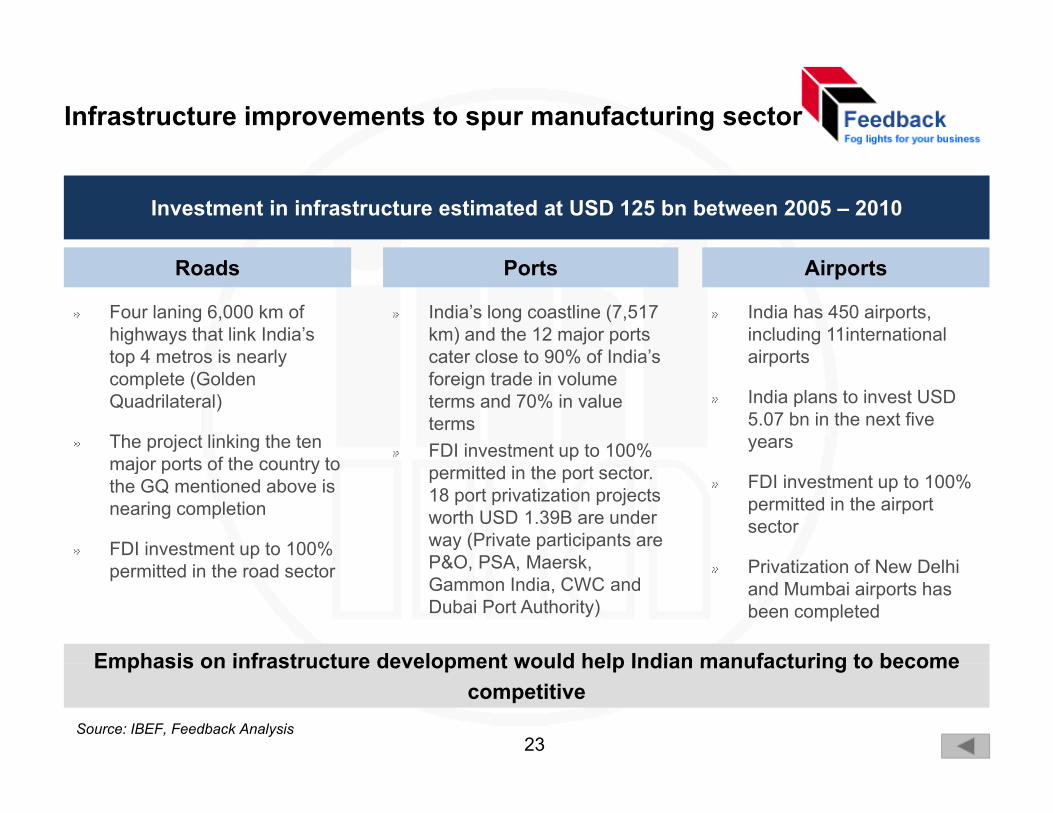
Infrastructure improvements to spur manufacturing sector
Investment in infrastructure estimated at USD 125 bn between 2005 – 2010
Four laning 6,000 km of highways that link India’s top 4 metros is nearly
India’s long coastline (7,517 km) and the 12 major ports cater close to 90% of India’s
India has 450 airports, including 11international airports
Roads Ports Airports
top 4 metros is nearly complete (Golden Quadrilateral)
The project linking the ten j t f th t t
cater close to 90% of India s foreign trade in volume terms and 70% in value termsFDI investment up to 100%
airports
India plans to invest USD 5.07 bn in the next five years
major ports of the country to the GQ mentioned above is nearing completion
FDI investment up to 100%
ppermitted in the port sector. 18 port privatization projects worth USD 1.39B are under way (Private participants are P&O PSA Maersk
FDI investment up to 100% permitted in the airport sector
P i ti ti f N D lhipermitted in the road sector P&O, PSA, Maersk, Gammon India, CWC and Dubai Port Authority)
Privatization of New Delhi and Mumbai airports has been completed
Emphasis on infrastructure development would help Indian manufacturing to becomeEmphasis on infrastructure development would help Indian manufacturing to becomecompetitive
Source: IBEF, Feedback Analysis23
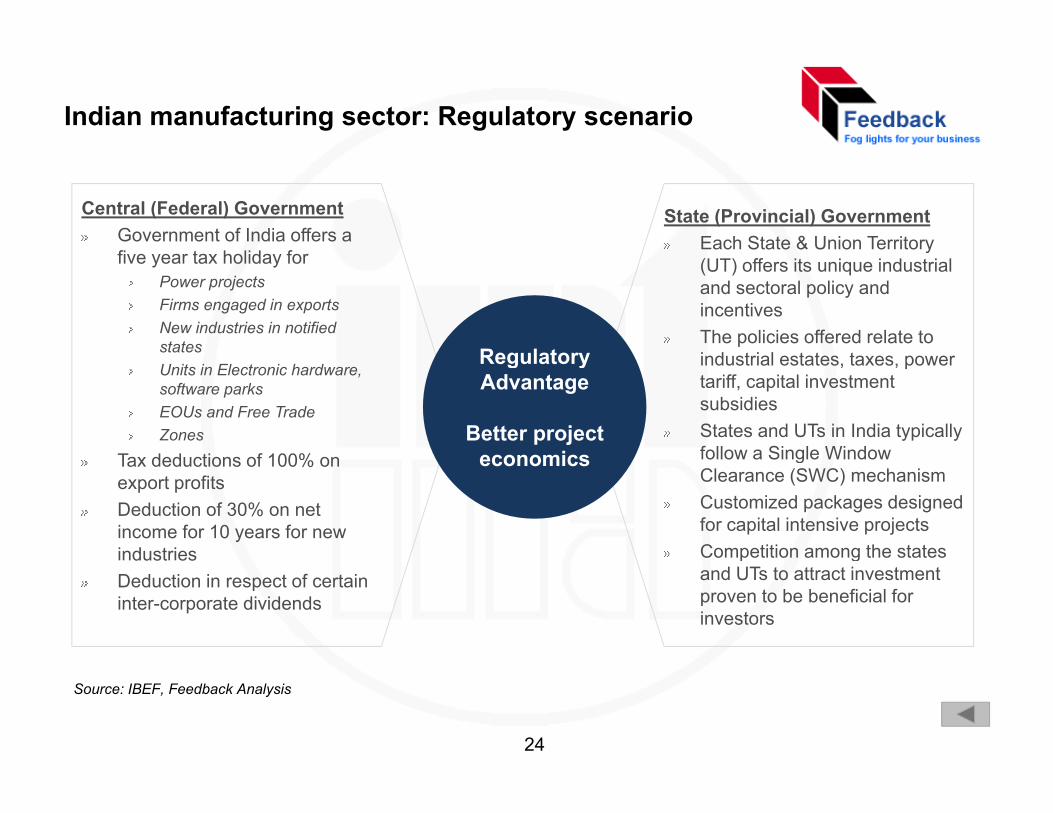
Indian manufacturing sector: Regulatory scenario
Central (Federal) GovernmentGovernment of India offers a fi t h lid f
State (Provincial) GovernmentEach State & Union Territory
five year tax holiday forPower projectsFirms engaged in exportsNew industries in notified states
y(UT) offers its unique industrial and sectoral policy and incentivesThe policies offered relate to i d t i l t t tRegulatory
Units in Electronic hardware, software parksEOUs and Free TradeZones
Tax deductions of 100% on
industrial estates, taxes, power tariff, capital investment subsidiesStates and UTs in India typically follow a Single Window
RegulatoryAdvantage
Better projecteconomicsTax deductions of 100% on
export profitsDeduction of 30% on net income for 10 years for new industries
follow a Single Window Clearance (SWC) mechanismCustomized packages designed for capital intensive projectsCompetition among the states
economics
dust esDeduction in respect of certain inter-corporate dividends
p gand UTs to attract investment proven to be beneficial for investors
Source: IBEF, Feedback Analysis
24
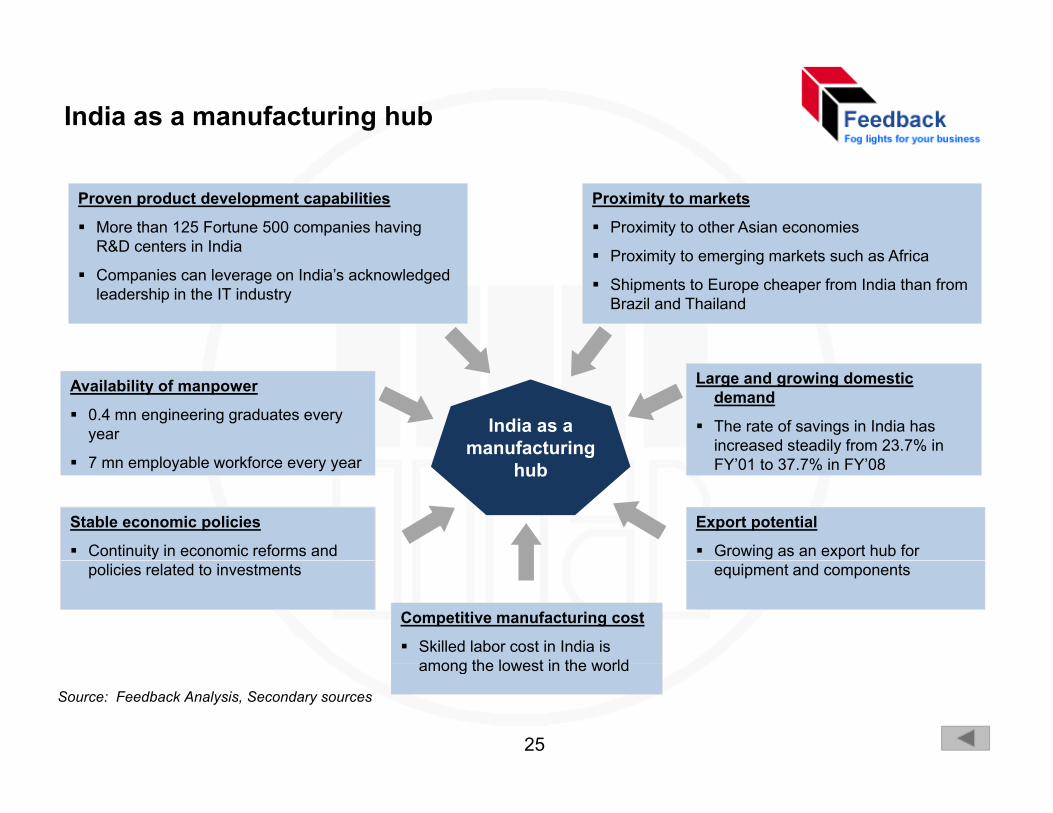
India as a manufacturing hub
Proximity to markets
Proximity to other Asian economies
Pro imit to emerging markets s ch as Africa
Proven product development capabilities
More than 125 Fortune 500 companies having R&D centers in India Proximity to emerging markets such as Africa
Shipments to Europe cheaper from India than from Brazil and Thailand
Companies can leverage on India’s acknowledged leadership in the IT industry
Availability of manpower
0.4 mn engineering graduates every year
7 l bl kf
Large and growing domestic demand
The rate of savings in India has increased steadily from 23.7% in
India as a manufacturing
Stable economic policies
Continuity in economic reforms and
7 mn employable workforce every year FY’01 to 37.7% in FY’08
Export potential
Growing as an export hub for
ghub
policies related to investments equipment and components
Competitive manufacturing cost
Skilled labor cost in India is among the lowest in the worldamong the lowest in the world
Source: Feedback Analysis, Secondary sources
25
Indian manufacturing sector: Recent developments
• Globally, India is being increasingly preferred for contract manufacturing, giving rise toopportunities in pharmaceuticals, auto components, consumer electronics and many moresegmentsGl b l i h i I di b i f th l t t i• Global passenger car companies are choosing India, being one of the low cost countries,to manufacture new generation compact cars
• The industry is seeing an increased number of global players moving to India, as thegovernment has permitted foreign players to set up 100% owned subsidiariesgovernment has permitted foreign players to set up 100% owned subsidiaries
• LG, Samsung, Louis Vuitton, Frette, Skoda Auto, Hyundai, Alstom, Toshiba, Ingersoll Randare some of the major companies, which are considering making India their globalmanufacturing hubs
• Focus on manufacturing optimization has increased, which is in turn being supported bythe developed Indian IT industry
• In India, medium sized manufacturing companies (with 100 to 999 staff) are presently thepredominant IT spenders creating solutions to cater to increased customer demand forpredominant IT spenders, creating solutions to cater to increased customer demand forhigh-quality products with reduced lead time, and the need for integration of differentbusiness functions, to combat competition
• Increasing pressure on lead time, costs and quality is making companies progress to thehub and spoke model of manufacturing. Every process in each multiphase manufacturingprocess, is handled by a hub attached with vendors as spokes
26
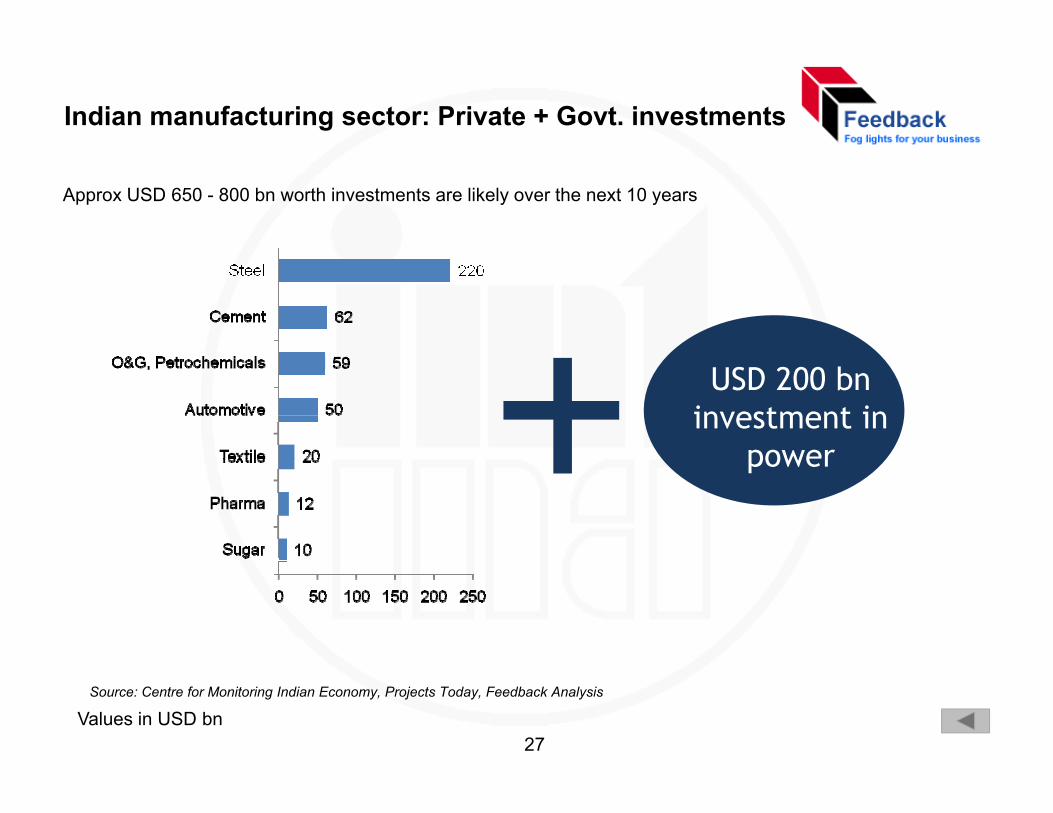
Indian manufacturing sector: Private + Govt. investments
Approx USD 650 - 800 bn worth investments are likely over the next 10 years
USD 200 bn investment in
powerpower
Source: Centre for Monitoring Indian Economy, Projects Today, Feedback Analysis
Values in USD bn27
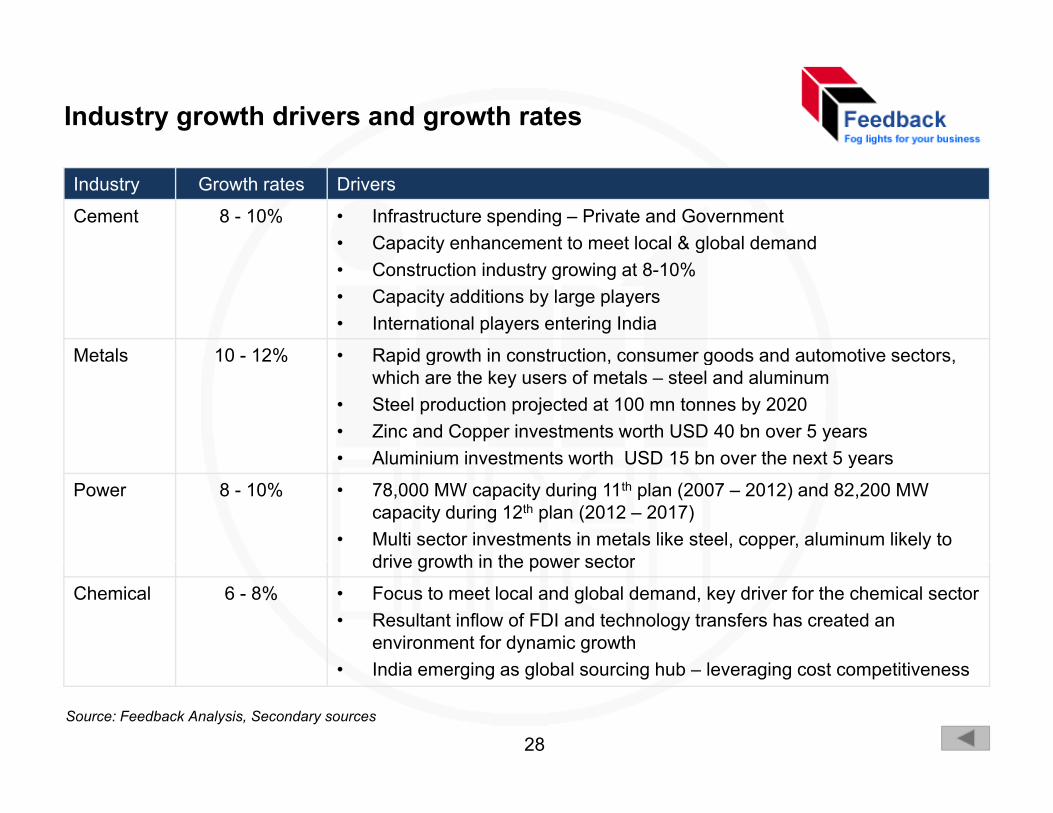
Industry growth drivers and growth rates
Industry Growth rates Drivers
Cement 8 - 10% • Infrastructure spending – Private and Government • Capacity enhancement to meet local & global demandy g• Construction industry growing at 8-10% • Capacity additions by large players• International players entering India
Metals 10 12% • Rapid growth in construction consumer goods and automotive sectorsMetals 10 - 12% • Rapid growth in construction, consumer goods and automotive sectors, which are the key users of metals – steel and aluminum
• Steel production projected at 100 mn tonnes by 2020• Zinc and Copper investments worth USD 40 bn over 5 years• Aluminium investments worth USD 15 bn over the next 5 years• Aluminium investments worth USD 15 bn over the next 5 years
Power 8 - 10% • 78,000 MW capacity during 11th plan (2007 – 2012) and 82,200 MW capacity during 12th plan (2012 – 2017)
• Multi sector investments in metals like steel, copper, aluminum likely to drive growth in the power sectordrive growth in the power sector
Chemical 6 - 8% • Focus to meet local and global demand, key driver for the chemical sector• Resultant inflow of FDI and technology transfers has created an
environment for dynamic growthI di i l b l i h b l i t titi• India emerging as global sourcing hub – leveraging cost competitiveness
Source: Feedback Analysis, Secondary sources
28
Industry growth drivers and growth rates
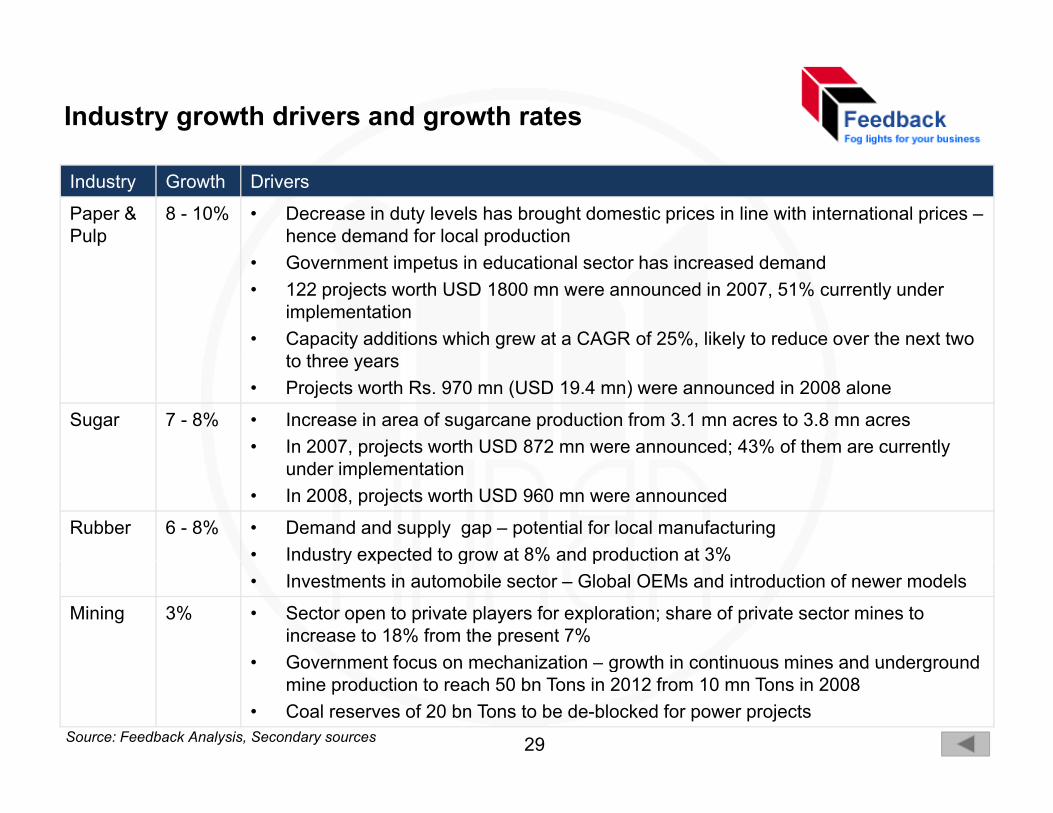
Industry Growth Drivers
Paper & Pulp
8 - 10% • Decrease in duty levels has brought domestic prices in line with international prices –hence demand for local production
• Government impetus in educational sector has increased demand• 122 projects worth USD 1800 mn were announced in 2007, 51% currently under
implementation• Capacity additions which grew at a CAGR of 25%, likely to reduce over the next two
t thto three years• Projects worth Rs. 970 mn (USD 19.4 mn) were announced in 2008 alone
Sugar 7 - 8% • Increase in area of sugarcane production from 3.1 mn acres to 3.8 mn acres• In 2007, projects worth USD 872 mn were announced; 43% of them are currently
under implementation• In 2008, projects worth USD 960 mn were announced
Rubber 6 - 8% • Demand and supply gap – potential for local manufacturing• Industry expected to grow at 8% and production at 3%Industry expected to grow at 8% and production at 3%• Investments in automobile sector – Global OEMs and introduction of newer models
Mining 3% • Sector open to private players for exploration; share of private sector mines to increase to 18% from the present 7%
• Government focus on mechanization – growth in continuous mines and underground• Government focus on mechanization – growth in continuous mines and underground mine production to reach 50 bn Tons in 2012 from 10 mn Tons in 2008
• Coal reserves of 20 bn Tons to be de-blocked for power projectsSource: Feedback Analysis, Secondary sources 29
Metal forming machinery industry Global trends- Global trends
• Metal Forming Machinery Production and consumption by country
• Machine tools Imports and Exports by country
• Technology trends and developments
30
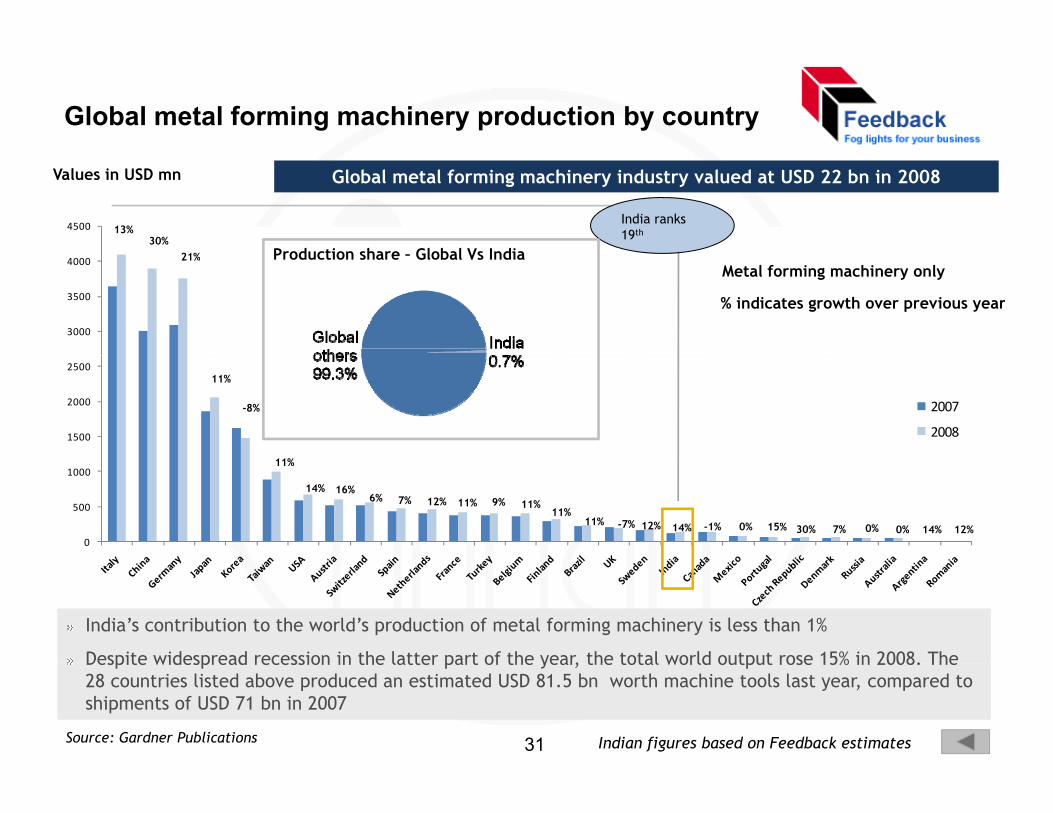
Global metal forming machinery production by country
4500
Values in USD mn
13%30%
21%
India ranks 19th
Global metal forming machinery industry valued at USD 22 bn in 2008
Production share Global Vs India
3000
3500
4000 21%Metal forming machinery only
% indicates growth over previous year
Production share – Global Vs India
1500
2000
2500
2007
2008
11%
-8%
0
500
1000
16%
11% -7% 12% 14% 15% 30% 7% 0% 14% 12%0%0%-1%
11%11%
11% 9%12%7%6%14%
11%
India’s contribution to the world’s production of metal forming machinery is less than 1%
Despite widespread recession in the latter part of the year, the total world output rose 15% in 2008. The
Indian figures based on Feedback estimates Source: Gardner Publications
Despite widespread recession in the latter part of the year, the total world output rose 15% in 2008. The 28 countries listed above produced an estimated USD 81.5 bn worth machine tools last year, compared to shipments of USD 71 bn in 2007
31
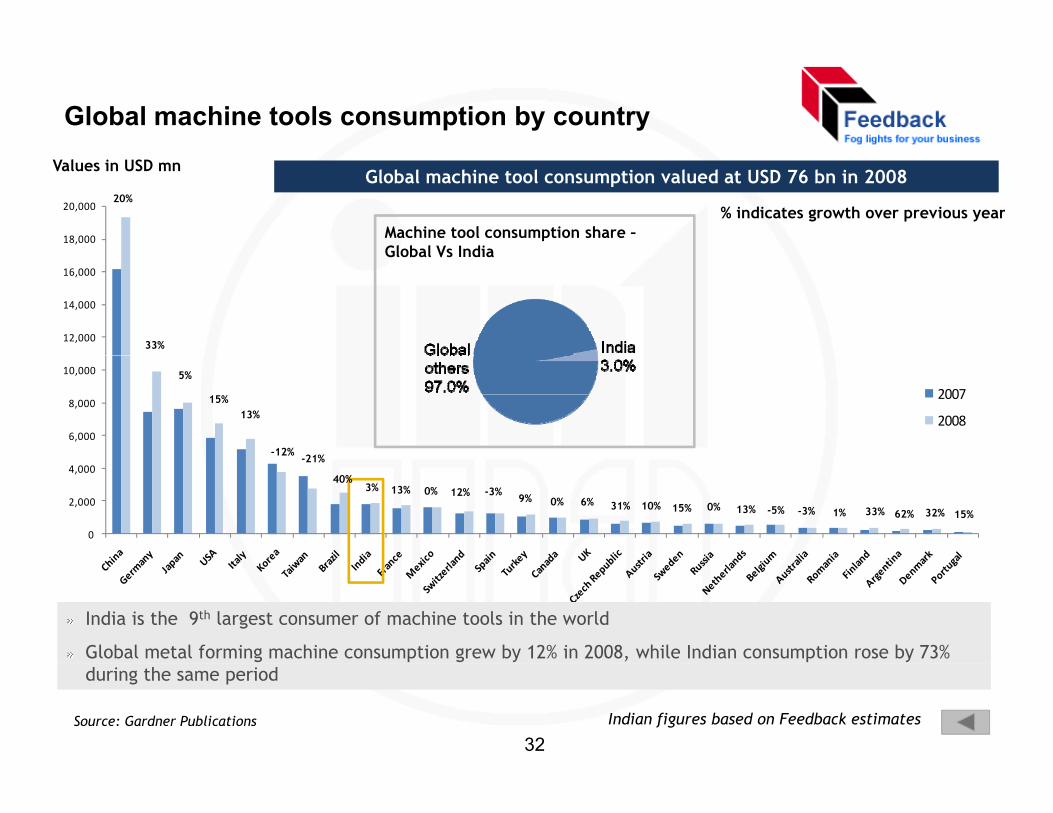
Global machine tools consumption by country
18,000
20,000
Values in USD mn
20%
Also includes machine tools
% indicates growth over previous year
Global machine tool consumption valued at USD 76 bn in 2008
Machine tool consumption share –Global Vs India
12,000
14,000
16,000
33%
Global Vs India
6,000
8,000
10,000
2007
2008
5%
15%13%
21%-12%
0
2,000
4,00040%
6% 31% 10% 15% -5% -3% 1% 62% 32% 15%33%13%0%9% 0%
12% -3%0%13%3%
-21%
India is the 9th largest consumer of machine tools in the world
Global metal forming machine consumption grew by 12% in 2008, while Indian consumption rose by 73%
Indian figures based on Feedback estimates Source: Gardner Publications
during the same period
32
Global machine tools imports by country
8,000
9,000
10,000
Values in USD mn
6%
% indicates growth over previous year
5,000
6,000
7,000
8,000
14%
19%
2,000
3,000
4,0002007
200817% -34%
79%
2% 5%14%-1%13%
4%0%
0
1,00028% 0% 3% 14% 9% -1% -5% 38% 70% 15%31%0%10%
0% 3%2% 5%14%
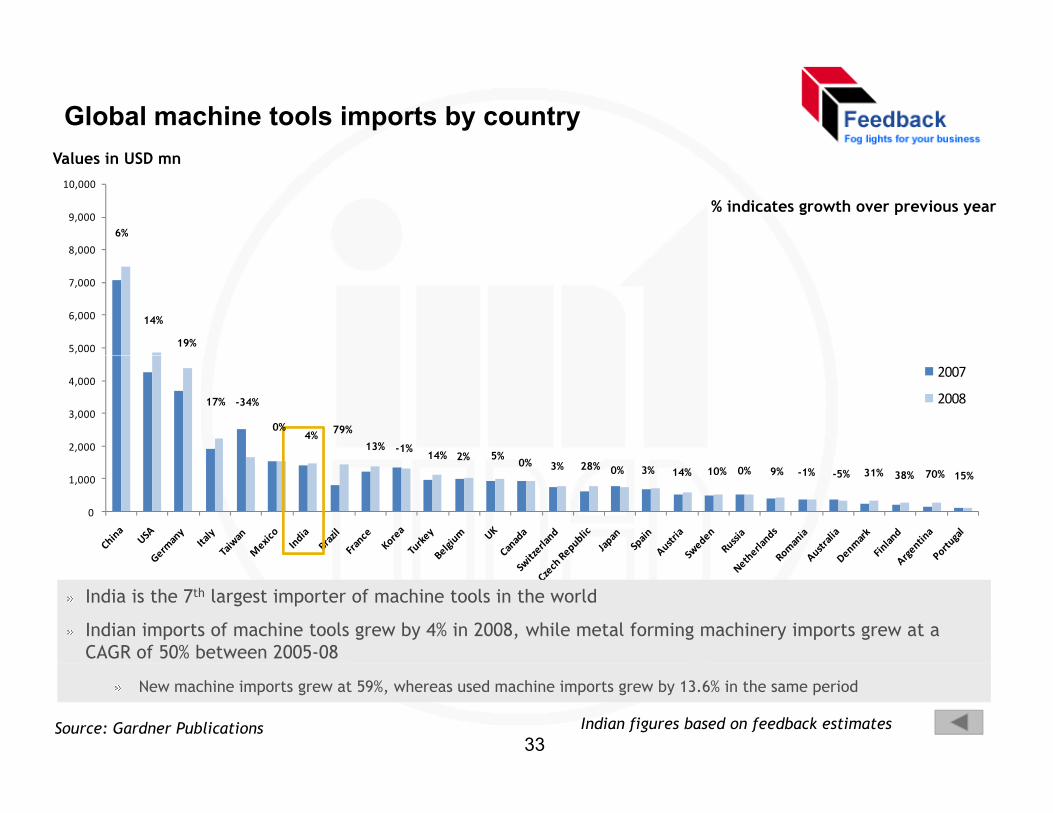
India is the 7th largest importer of machine tools in the world
Indian imports of machine tools grew by 4% in 2008, while metal forming machinery imports grew at a CAGR of 50% between 2005-08
Indian figures based on feedback estimates Source: Gardner Publications
New machine imports grew at 59%, whereas used machine imports grew by 13.6% in the same period
33
Global machine tools exports by country
12,000
Values in USD mn
10%
% indicates growth over previous year
8,000
10,00015%
4,000
6,000
2007
2008
15%
12%
3%
15%27%
0
2,000
15%
9% -2% 10% 1% -4% 0% -3% 0% -20% 33%15%11%32%28% 20%
-7% 11%20%11%20%
6%27%
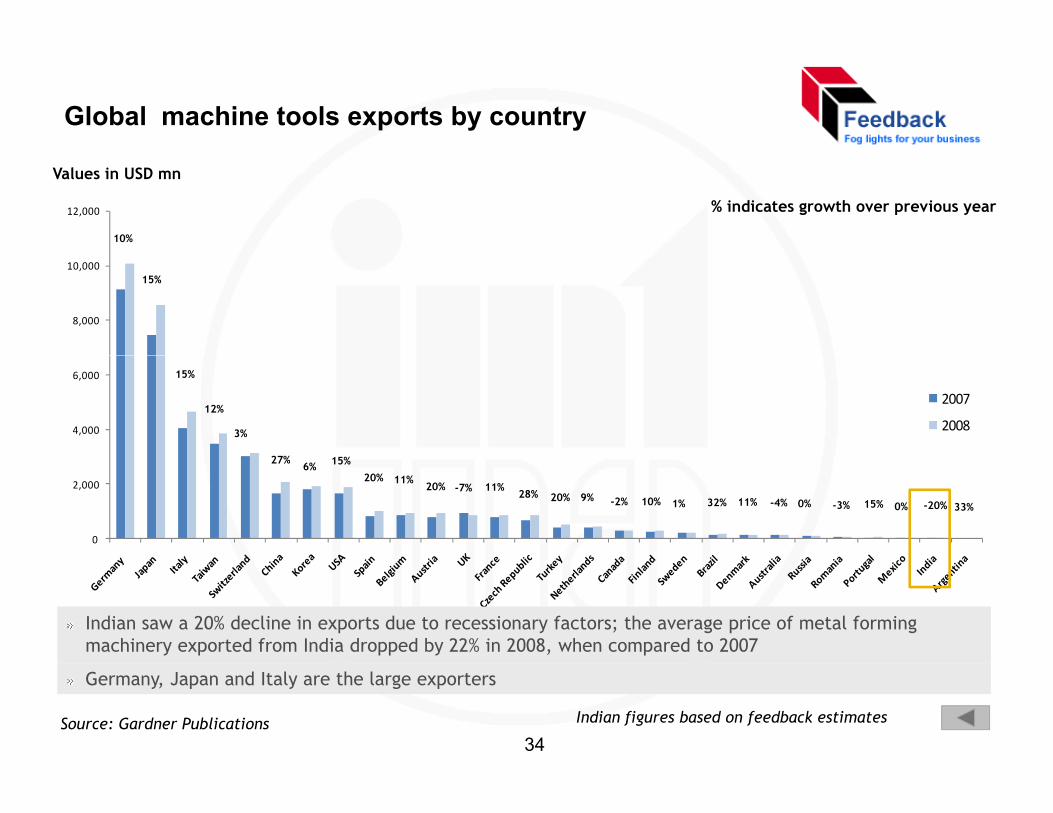
Indian saw a 20% decline in exports due to recessionary factors; the average price of metal forming machinery exported from India dropped by 22% in 2008, when compared to 2007
Indian figures based on feedback estimates Source: Gardner Publications
Germany, Japan and Italy are the large exporters
34
Technology trends by product category
Product category
Technology developments ‐ Global Technology developments ‐ India
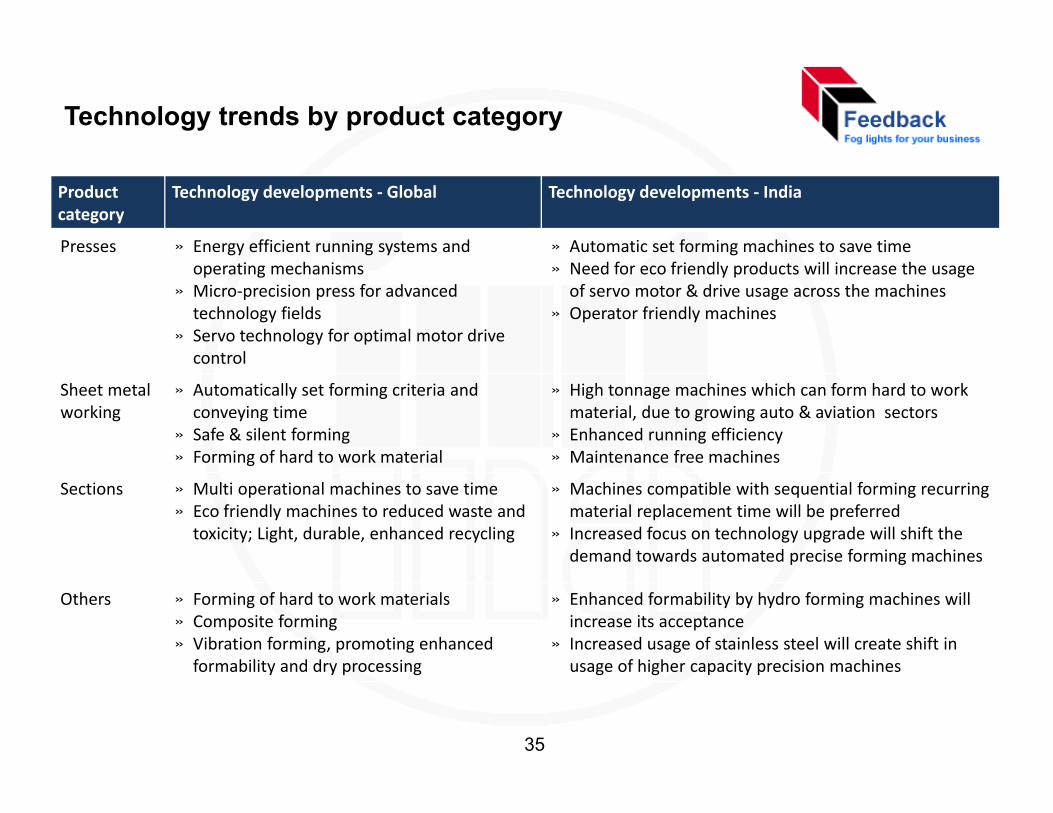
Presses » Energy efficient running systems and » Automatic set forming machines to save time gy g yoperating mechanisms
» Micro‐precision press for advanced technology fields
» Servo technology for optimal motor drive control
g» Need for eco friendly products will increase the usage of servo motor & drive usage across the machines
» Operator friendly machines
control
Sheet metal working
» Automatically set forming criteria and conveying time
» Safe & silent forming » Forming of hard to work material
» High tonnage machines which can form hard to work material, due to growing auto & aviation sectors
» Enhanced running efficiency» Maintenance free machines» Forming of hard to work material » Maintenance free machines
Sections » Multi operational machines to save time » Eco friendly machines to reduced waste and toxicity; Light, durable, enhanced recycling
» Machines compatible with sequential forming recurring material replacement time will be preferred
» Increased focus on technology upgrade will shift the demand towards automated precise forming machinesdemand towards automated precise forming machines
Others » Forming of hard to work materials» Composite forming» Vibration forming, promoting enhanced formabilit and dr processing
» Enhanced formability by hydro forming machines will increase its acceptance
» Increased usage of stainless steel will create shift in sage of higher capacit precision machinesformability and dry processing usage of higher capacity precision machines
35
Global technological trends (1/4)
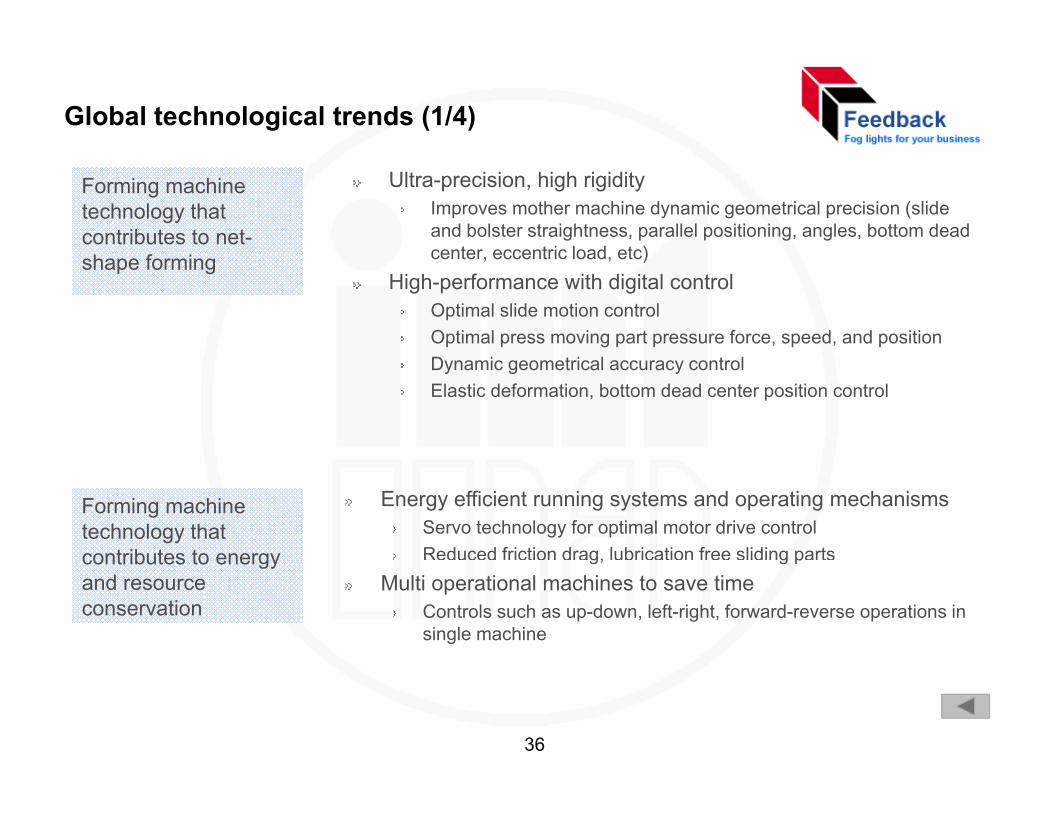
Forming machine technology that contributes to net-
Ultra-precision, high rigidityImproves mother machine dynamic geometrical precision (slide and bolster straightness, parallel positioning, angles, bottom dead center eccentric load etc)shape forming center, eccentric load, etc)
High-performance with digital controlOptimal slide motion controlOptimal press moving part pressure force, speed, and positionDynamic geometrical accuracy controlElastic deformation, bottom dead center position control
Forming machine technology that contributes to energy
Energy efficient running systems and operating mechanismsServo technology for optimal motor drive controlReduced friction drag, lubrication free sliding partscontributes to energy
and resource conservation
g, g pMulti operational machines to save time
Controls such as up-down, left-right, forward-reverse operations in single machine
36
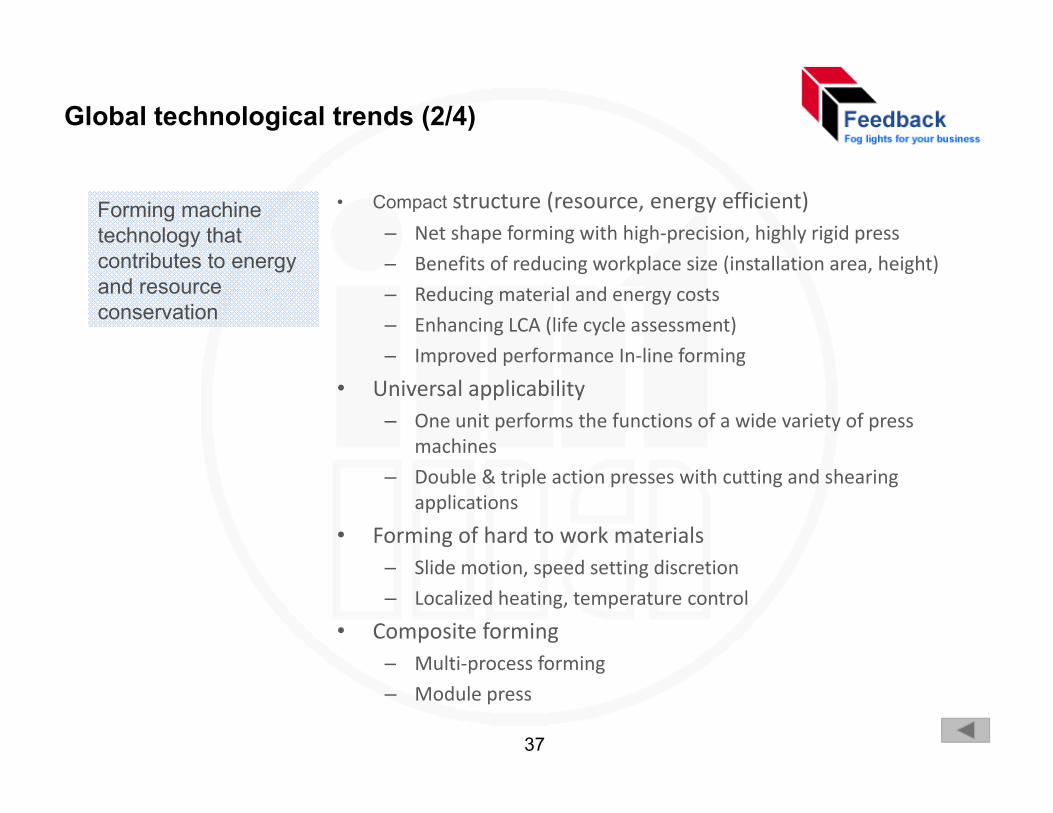
Global technological trends (2/4)
• Compact structure (resource, energy efficient)– Net shape forming with high‐precision, highly rigid press
Forming machine technology that
ib – Benefits of reducing workplace size (installation area, height)
– Reducing material and energy costs
– Enhancing LCA (life cycle assessment)
Improved performance In line forming
contributes to energy and resource conservation
– Improved performance In‐line forming
• Universal applicability– One unit performs the functions of a wide variety of press
machines
– Double & triple action presses with cutting and shearing applications
• Forming of hard to work materialsSlid i d i di i– Slide motion, speed setting discretion
– Localized heating, temperature control
• Composite formingMulti process forming– Multi‐process forming
– Module press
37
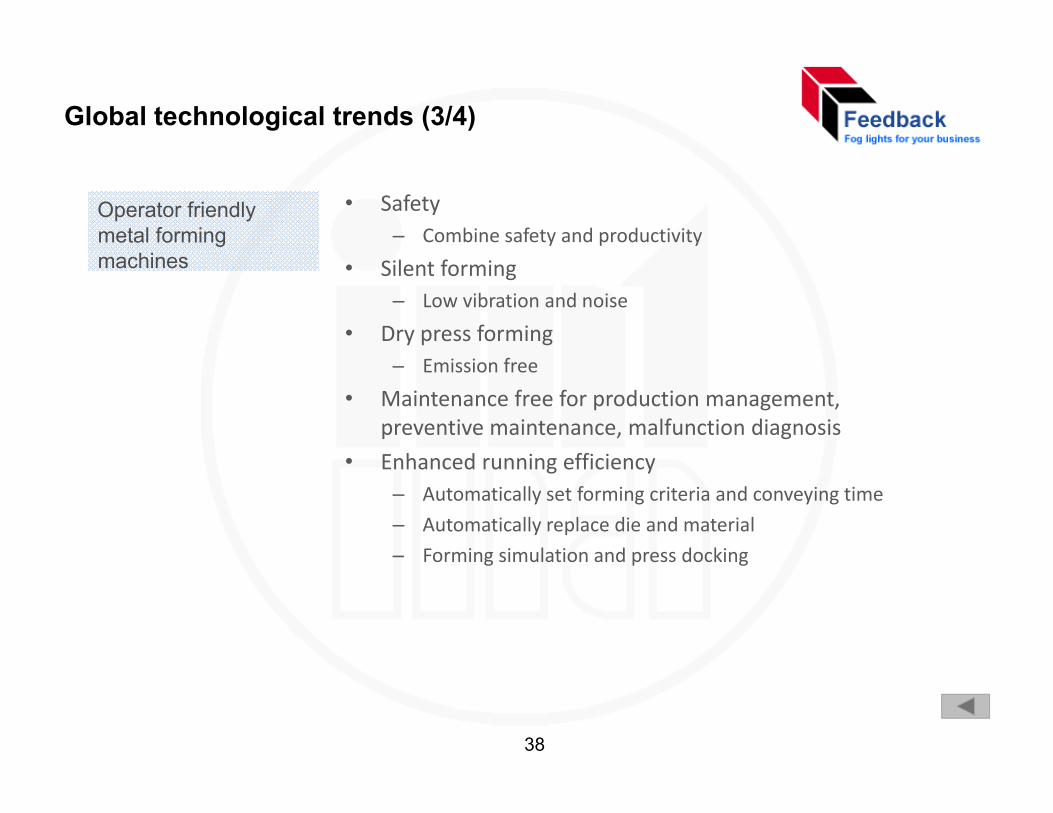
Global technological trends (3/4)
• Safety– Combine safety and productivity
Operator friendly metal forming
hi • Silent forming– Low vibration and noise
• Dry press forming
machines
– Emission free
• Maintenance free for production management, preventive maintenance, malfunction diagnosis
• Enhanced r nning efficienc• Enhanced running efficiency– Automatically set forming criteria and conveying time
– Automatically replace die and material
– Forming simulation and press dockingForming simulation and press docking
38
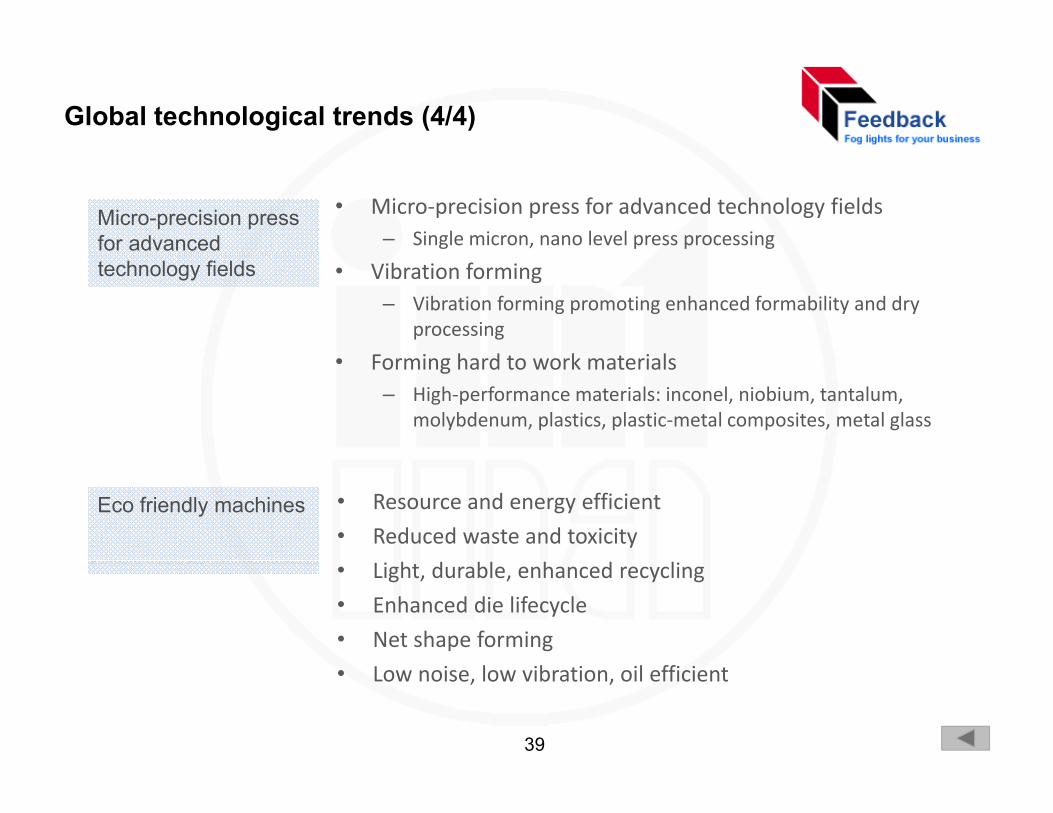
Global technological trends (4/4)
• Micro‐precision press for advanced technology fields– Single micron, nano level press processing
Micro-precision press for advanced
• Vibration forming – Vibration forming promoting enhanced formability and dry
processing
F i h d k i l
technology fields
• Forming hard to work materials– High‐performance materials: inconel, niobium, tantalum,
molybdenum, plastics, plastic‐metal composites, metal glass
• Resource and energy efficient
• Reduced waste and toxicityEco friendly machines
• Light, durable, enhanced recycling
• Enhanced die lifecycle
• Net shape forming
• Low noise, low vibration, oil efficient
39
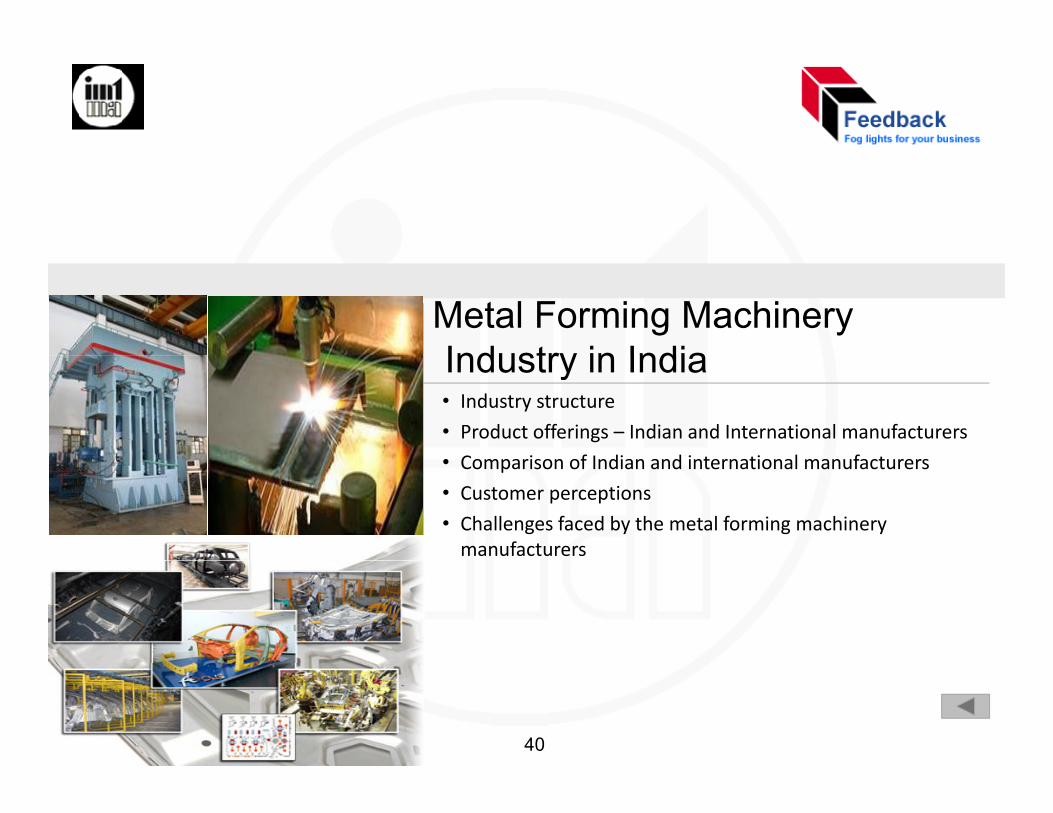
Metal Forming Machinery Industry in IndiaIndustry in India • Industry structure
• Product offerings – Indian and International manufacturers
C i f I di d i t ti l f t• Comparison of Indian and international manufacturers
• Customer perceptions
• Challenges faced by the metal forming machinery manufacturers
40
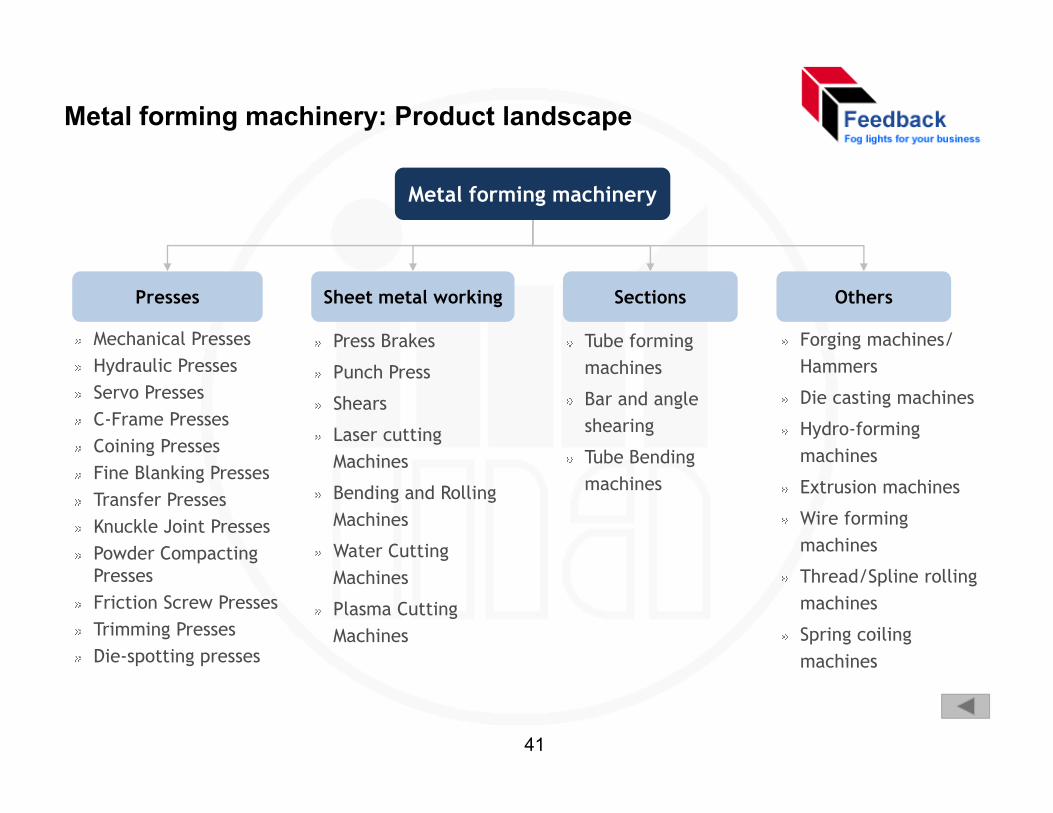
Metal forming machinery: Product landscape
Metal forming machinery
Presses Sheet metal working Sections
Mechanical Presses Press Brakes Tube forming
Others
Forging machines/ Hydraulic Presses Servo PressesC-Frame PressesCoining Presses
Punch Press
Shears
Laser cutting Machines
machines
Bar and angle shearing
Tube Bending
Hammers
Die casting machines
Hydro-forming machines
Fine Blanking PressesTransfer PressesKnuckle Joint PressesPowder Compacting
Machines
Bending and Rolling Machines
Water Cutting
Tube Bending machines
machines
Extrusion machines
Wire forming machines p g
PressesFriction Screw PressesTrimming PressesDie-spotting presses
gMachines
Plasma Cutting Machines
Thread/Spline rolling machines
Spring coiling machinesp g p machines
41
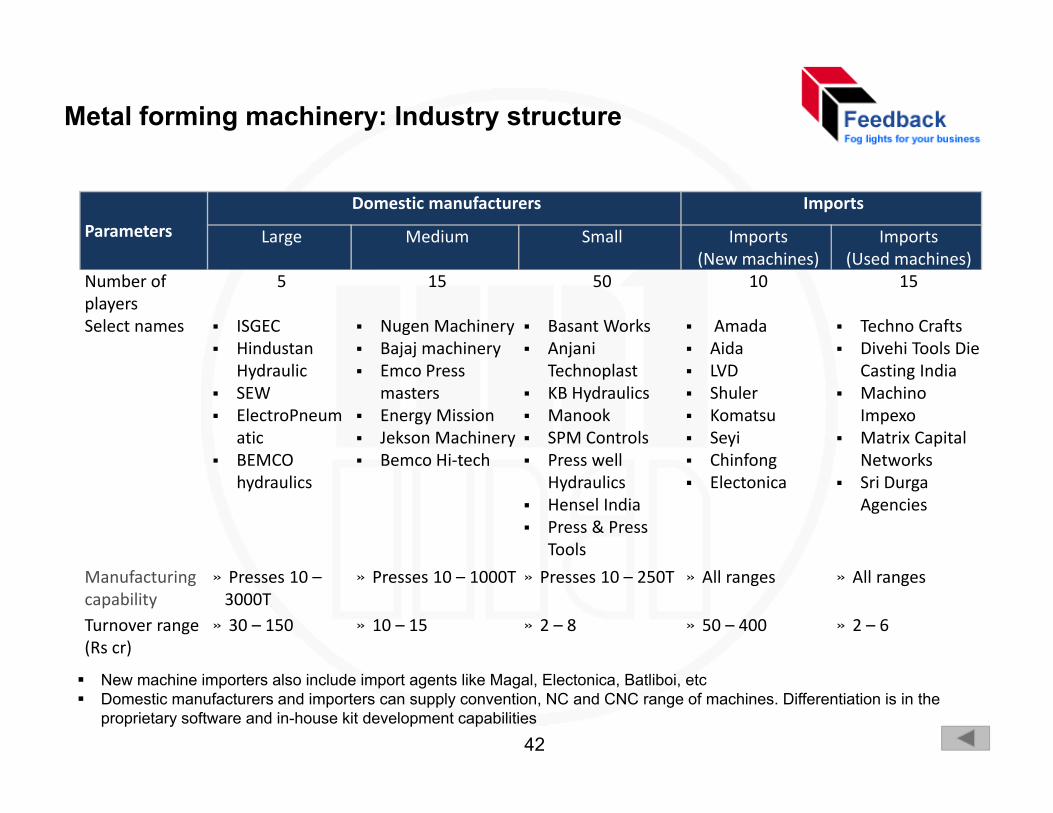
Metal forming machinery: Industry structure
Parameters
Domestic manufacturers Imports
Large Medium Small Imports (N hi )
Imports (U d hi )(New machines) (Used machines)
Number of players
5 15 50 10 15
Select names ISGECHindustan
Nugen MachineryBajaj machinery
Basant WorksAnjani
AmadaAida
Techno Crafts Divehi Tools Die
HydraulicSEWElectroPneumaticBEMCO
j j yEmco Press mastersEnergy MissionJekson MachineryBemco Hi tech
jTechnoplast KB HydraulicsManookSPM ControlsPress well
LVDShulerKomatsuSeyiChinfong
Casting IndiaMachino ImpexoMatrix Capital NetworksBEMCO
hydraulicsBemco Hi‐tech Press well
HydraulicsHensel IndiaPress & Press Tools
ChinfongElectonica
NetworksSri Durga Agencies
Manufacturing capability
» Presses 10 –3000T
» Presses 10 – 1000T » Presses 10 – 250T » All ranges » All ranges
Turnover range (Rs cr)
» 30 – 150 » 10 – 15 » 2 – 8 » 50 – 400 » 2 – 6
New machine importers also include import agents like Magal, Electonica, Batliboi, etcDomestic manufacturers and importers can supply convention, NC and CNC range of machines. Differentiation is in the proprietary software and in-house kit development capabilities
42
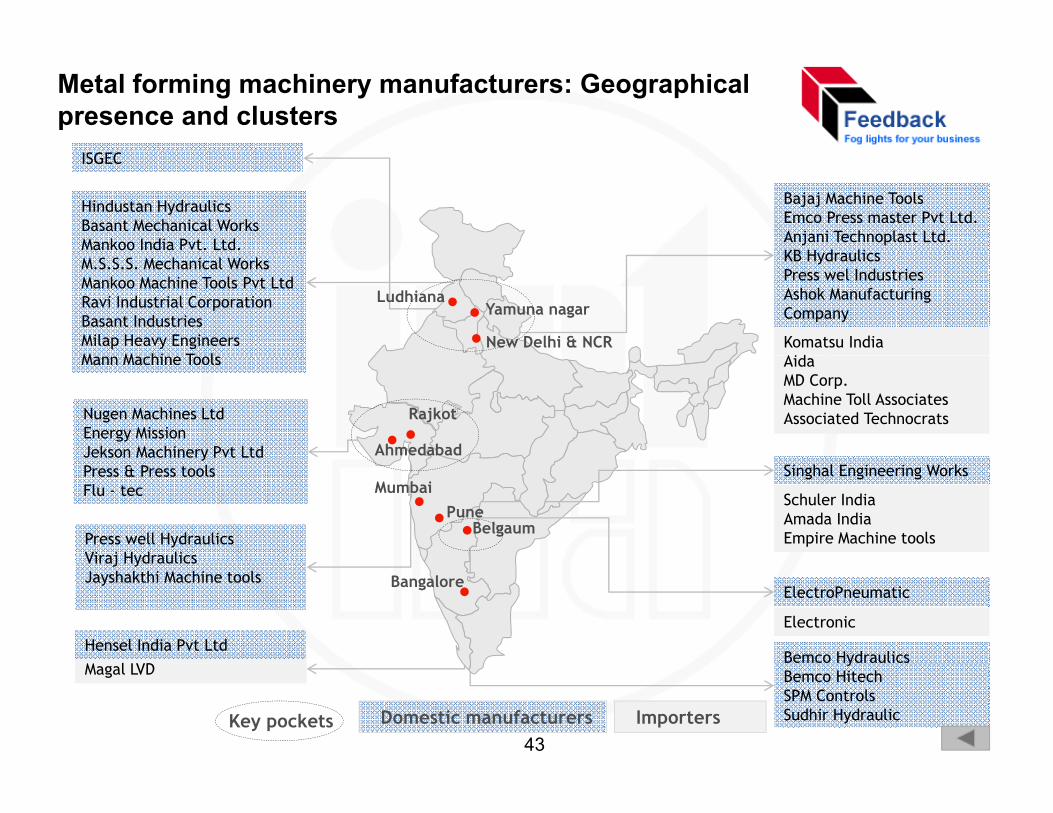
Metal forming machinery manufacturers: Geographical presence and clusters
ISGEC
Hindustan HydraulicsBasant Mechanical WorksMankoo India Pvt. Ltd.
Bajaj Machine ToolsEmco Press master Pvt Ltd.Anjani Technoplast Ltd.KB Hydraulics
New Delhi & NCR
LudhianaYamuna nagar
M.S.S.S. Mechanical WorksMankoo Machine Tools Pvt LtdRavi Industrial CorporationBasant IndustriesMilap Heavy EngineersM M hi T l
KB HydraulicsPress wel IndustriesAshok Manufacturing Company
Komatsu IndiaAid
Ahmedabad
Mann Machine Tools
Nugen Machines LtdEnergy MissionJekson Machinery Pvt Ltd
Rajkot
AidaMD Corp.Machine Toll AssociatesAssociated Technocrats
MumbaiPune
Belgaum
yPress & Press toolsFlu - tec
Press well HydraulicsViraj Hydraulics
Singhal Engineering Works
Schuler IndiaAmada IndiaEmpire Machine tools
BangaloreViraj HydraulicsJayshakthi Machine tools
l DBemco Hydraulics
ElectroPneumatic
Hensel India Pvt LtdElectronic
Key pockets
Magal LVDy
Bemco HitechSPM ControlsSudhir HydraulicDomestic manufacturers Importers
43
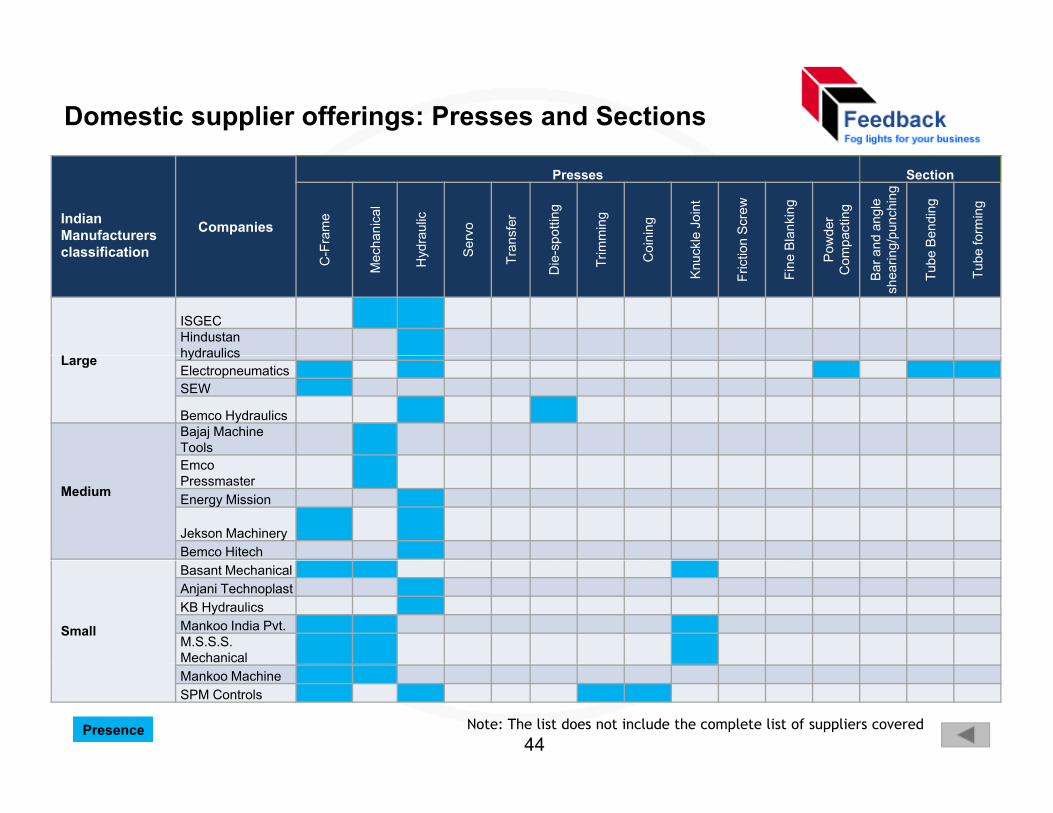
Domestic supplier offerings: Presses and Sections
Indian Manufacturersclassification
Companies
Presses Section
-Fra
me
chan
ical
ydra
ulic
Serv
o
rans
fer
-spo
tting
imm
ing
oini
ng
ckle
Joi
nt
on S
crew
Bla
nkin
g
owde
r m
pact
ing
and
angl
e ng
/pun
chin
g
e B
endi
ng
e fo
rmin
g
classification
C-
Mec Hy S Tr
Die
-
Tri C
Knu
c
Fric
ti
Fine
P oC
om
Bar
ash
earin
Tube
Tube
ISGECHindustan hydraulicsLarge hydraulics ElectropneumaticsSEW
Bemco Hydraulics Bajaj Machine Tools
Medium
Emco Pressmaster Energy Mission
Jekson Machinery Bemco Hitech
Small
Basant MechanicalAnjani Technoplast KB HydraulicsMankoo India Pvt. M.S.S.S. MechanicalMankoo MachineSPM Controls
Presence Note: The list does not include the complete list of suppliers covered44
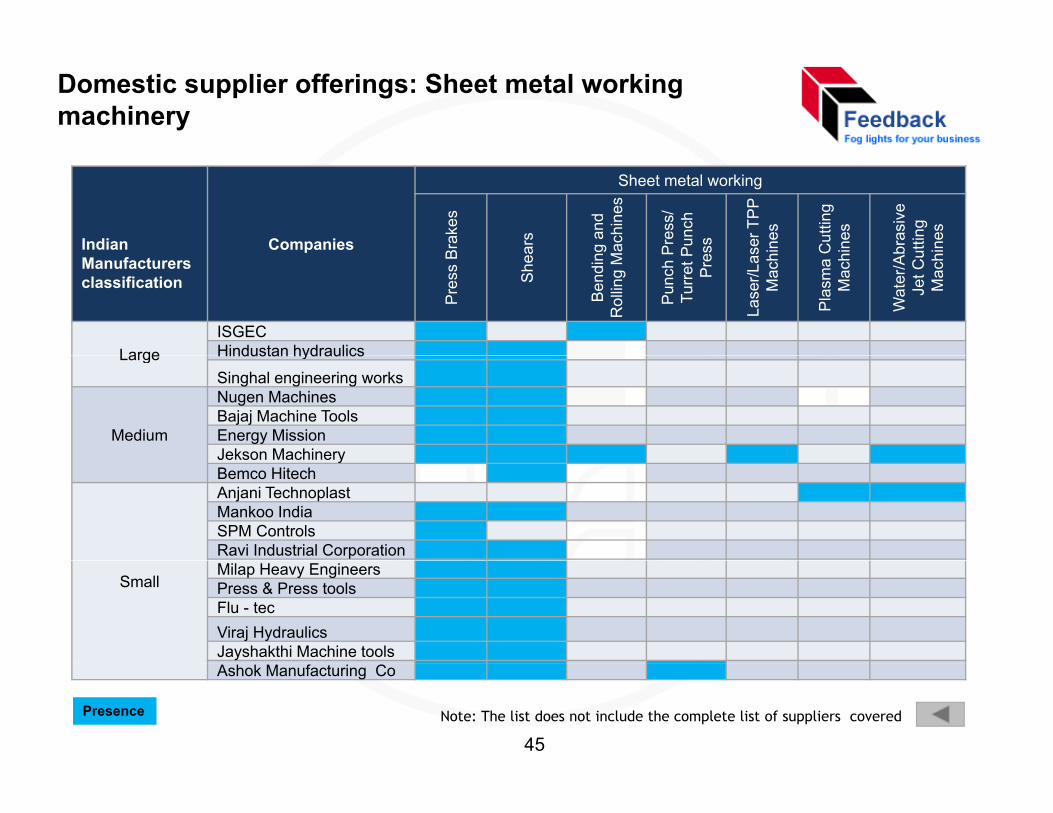
Domestic supplier offerings: Sheet metal working machinery
Indian Companies
Sheet metal working
Brak
es
ars
g an
d ac
hine
s
Pres
s/
Punc
h ss se
r TPP
in
es
Cut
ting
ines
bras
ive
uttin
g in
es
Manufacturersclassification
Pre
ss B
Shea
Bend
inR
ollin
g M
Pun
ch P
Turr
et P
Pre
Lase
r/Las
Mac
h
Pla
sma
CM
ach
Wat
er/A
bJe
t Cu
Mac
h
LargeISGECHindustan hydraulicsLarge Hindustan hydraulics
Singhal engineering works
Medium
Nugen MachinesBajaj Machine ToolsEnergy Mission Jekson MachineryJekson Machinery Bemco HitechAnjani Technoplast Mankoo IndiaSPM Controls Ravi Industrial Corporation
SmallMilap Heavy EngineersPress & Press tools Flu - tecViraj Hydraulics Jayshakthi Machine tools
Presence Note: The list does not include the complete list of suppliers covered
Ashok Manufacturing Co
45
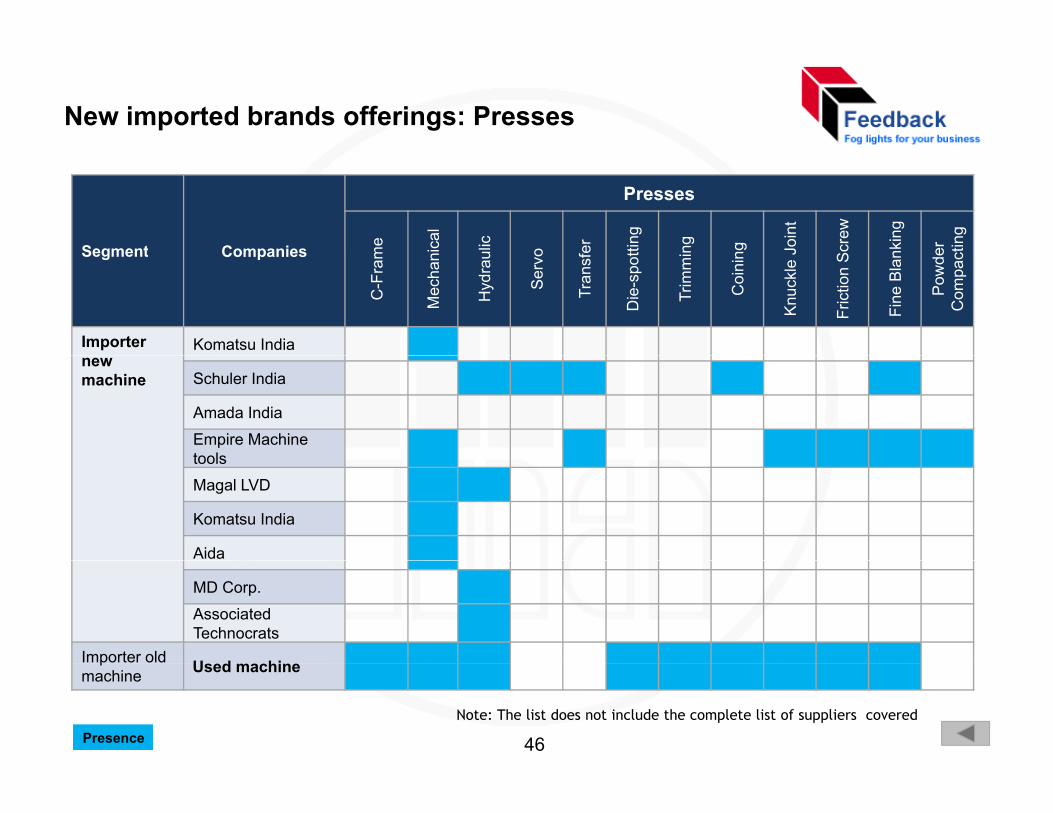
New imported brands offerings: Presses
Segment Companies
Presses
me ical
ulic
o er
tting
ng
ng
Join
t
Scre
w
nkin
g
er
ctin
g
Segment Companies
C-F
ram
Mec
han
Hyd
rau
Ser
vo
Tran
sfe
Die
-spo
t
Trim
mi
Coi
nin
Knu
ckle
J
Fric
tion
S
Fine
Bla
n
Pow
deC
ompa
c
Importer Komatsu Indianew machine Schuler India
Amada India
Empire Machine toolstools
Magal LVD
Komatsu India
Aida
MD Corp.
Associated Technocrats
Importer old U d hipmachine Used machine
Presence Note: The list does not include the complete list of suppliers covered
46
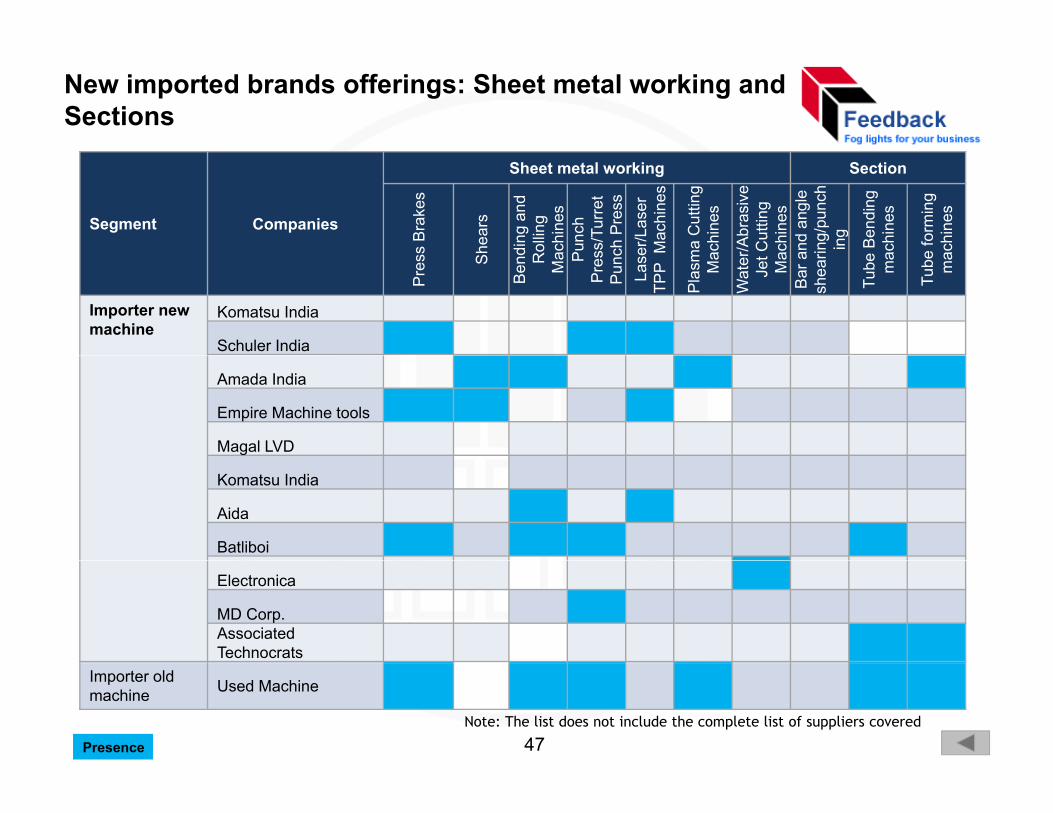
New imported brands offerings: Sheet metal working and Sections
Segment Companies
Sheet metal working Section
s B
rake
s
hear
s
ding
and
R
ollin
g ac
hine
sPu
nch
ss/T
urre
t ch
Pre
sser
/Las
er
Mac
hine
s
ma
Cut
ting
achi
nes
r/Abr
asiv
e C
uttin
g ac
hine
san
d an
gle
ing/
punc
hin
g
Ben
ding
ac
hine
s
e fo
rmin
g ac
hine
s
Pre
ss Sh
Bend R Ma P
Pre
sPu
ncLa
seTP
P
Plas
mM
a
Wat
erJe
t M
aB
ar a
shea
r
Tube m
a
Tube ma
Importer new machine
Komatsu India
Schuler India
Amada India
Empire Machine tools
Magal LVD
Komatsu India
Aida
Batliboi
Electronica
MD Corp.Associated Technocrats
Importer old machine Used Machine
Presence
Note: The list does not include the complete list of suppliers covered
47
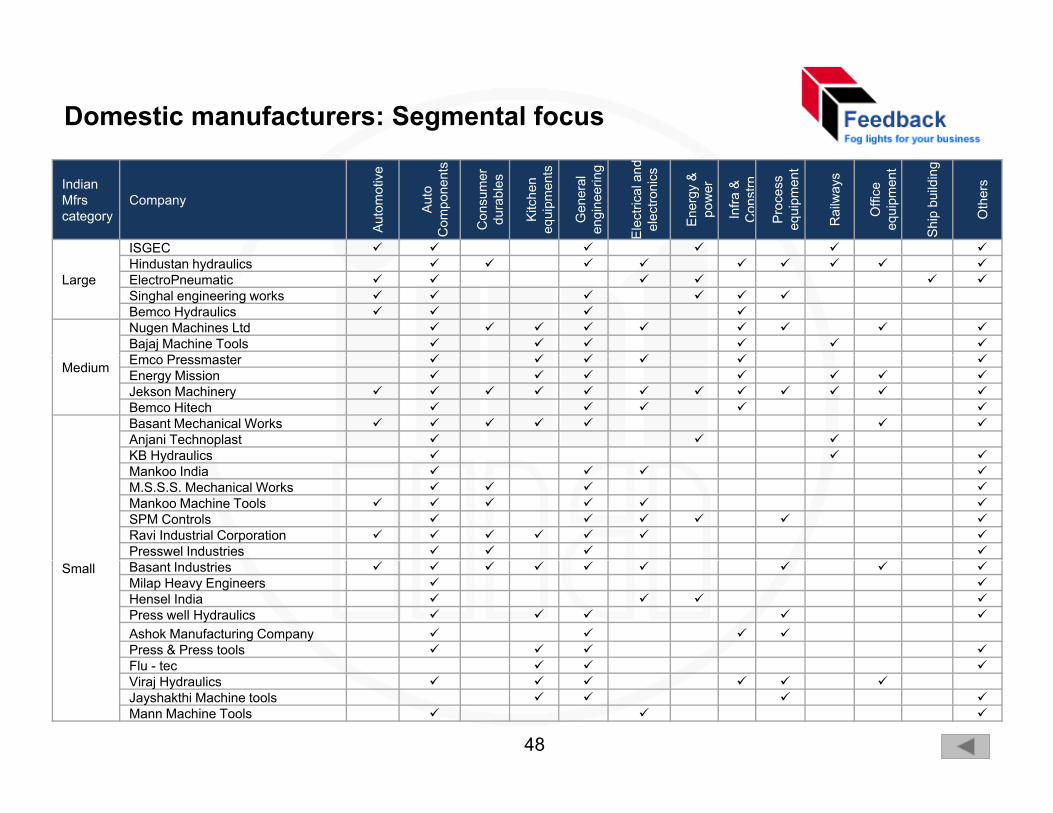
Domestic manufacturers: Segmental focus
IndianMfrs category
Company
Auto
mot
ive
Aut
o C
ompo
nent
s
Con
sum
er
dura
bles
Kitc
hen
equi
pmen
ts
Gen
eral
en
gine
erin
g
Ele
ctric
al a
nd
elec
troni
cs
Ene
rgy
&
pow
er
Infra
&
Con
strn
Proc
ess
equi
pmen
t
Rai
lway
s
Offi
ce
equi
pmen
t
Shi
p bu
ildin
g
Oth
ers
ISGEC
LargeHindustan hydraulics ElectroPneumaticSinghal engineering worksBemco Hydraulics Nugen Machines LtdBajaj Machine ToolsE P tMedium Emco Pressmaster Energy Mission Jekson Machinery Bemco HitechBasant Mechanical WorksAnjani Technoplast KB HydraulicsKB HydraulicsMankoo India M.S.S.S. Mechanical WorksMankoo Machine ToolsSPM Controls Ravi Industrial CorporationPresswel Industries
Small Basant IndustriesMilap Heavy EngineersHensel India Press well Hydraulics Ashok Manufacturing Company Press & Press tools Fl tFlu - tecViraj Hydraulics Jayshakthi Machine tools Mann Machine Tools
48
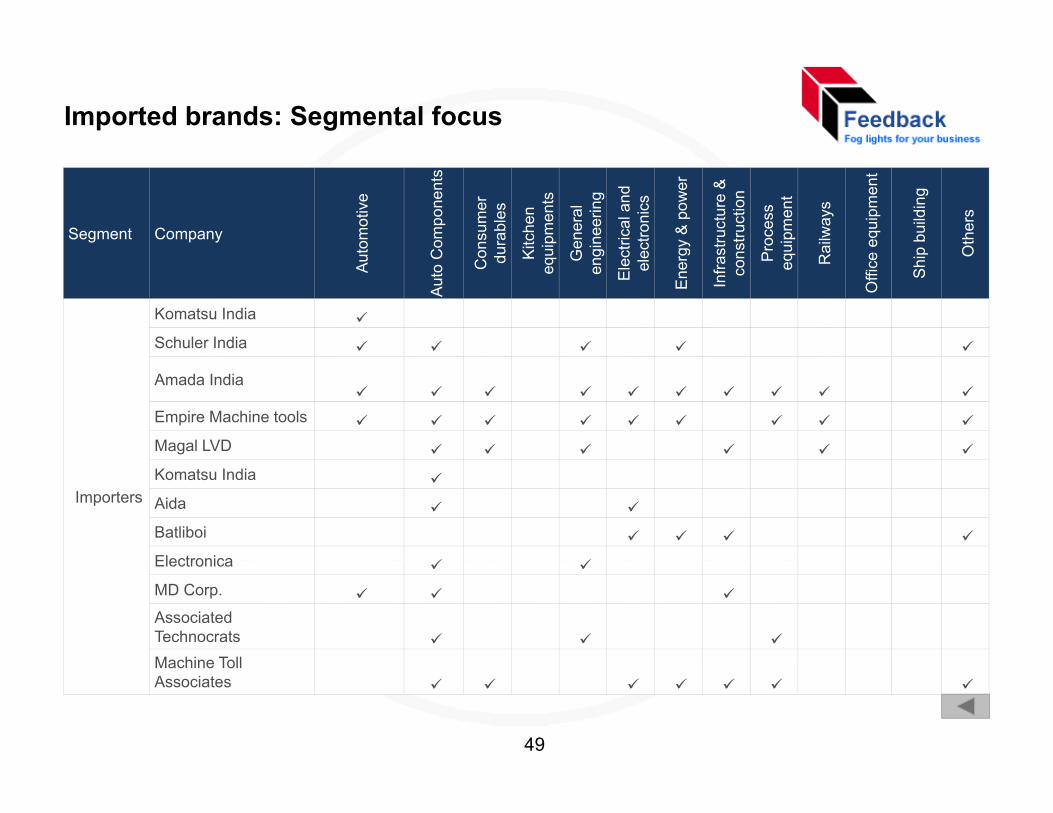
Imported brands: Segmental focus
Segment Company
tom
otiv
e
Com
pone
nts
onsu
mer
ur
able
s
Kitc
hen
uipm
ents
Gen
eral
gi
neer
ing
ctric
al a
nd
ectro
nics
gy &
pow
er
stru
ctur
e &
ns
truct
ion
Proc
ess
uipm
ent
ailw
ays
e eq
uipm
ent
p bu
ildin
g
Oth
ers
Aut
Aut
o C Co du K
equ G
eng
Elec ele
Ene
rg
Infra
sco
n P eq R
Offi
ce Ship O
Komatsu India
Schuler India
Amada India
Empire Machine tools
Magal LVD
Importers Komatsu India
Aida
Batliboi
ElectronicaElectronica
MD Corp.
Associated TechnocratsMachine TollMachine Toll Associates
49
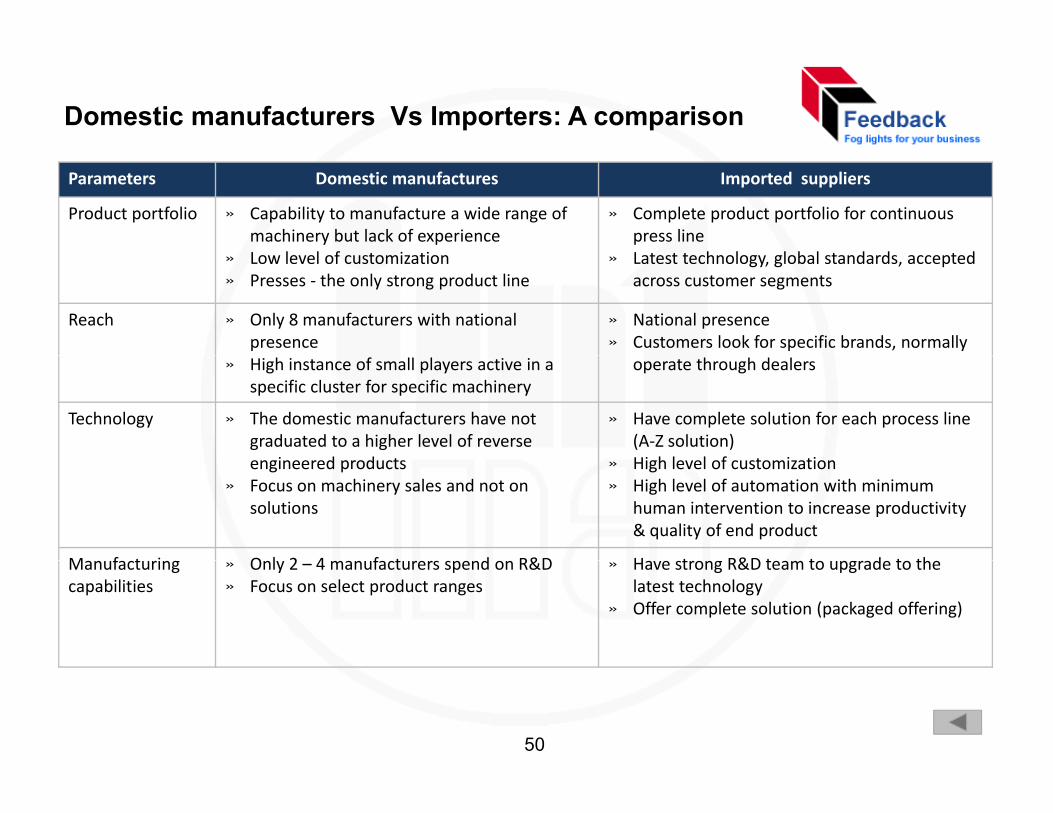
Domestic manufacturers Vs Importers: A comparison
Parameters Domestic manufactures Imported suppliers
Product portfolio » Capability to manufacture a wide range of machinery but lack of experienceL l l f i i
» Complete product portfolio for continuous press line L h l l b l d d d» Low level of customization
» Presses ‐ the only strong product line» Latest technology, global standards, accepted
across customer segments
Reach » Only 8 manufacturers with national presence
» National presence» Customers look for specific brands, normally
» High instance of small players active in a specific cluster for specific machinery
operate through dealers
Technology » The domestic manufacturers have not graduated to a higher level of reverse
i d d
» Have complete solution for each process line (A‐Z solution) Hi h l l f i iengineered products
» Focus on machinery sales and not on solutions
» High level of customization » High level of automation with minimum
human intervention to increase productivity & quality of end product
M f t i O l 2 4 f t d R&D H t R&D t t d t thManufacturing capabilities
» Only 2 – 4 manufacturers spend on R&D » Focus on select product ranges
» Have strong R&D team to upgrade to the latest technology
» Offer complete solution (packaged offering)
50
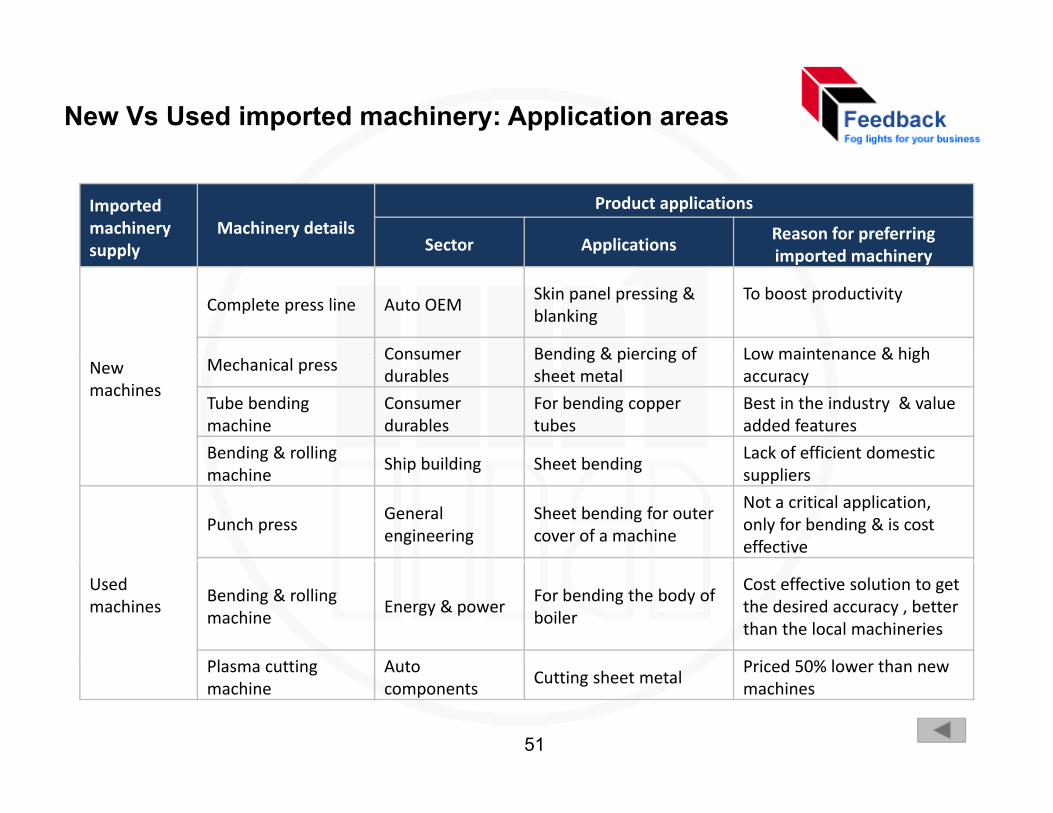
New Vs Used imported machinery: Application areas
Imported machinery supply
Machinery detailsProduct applications
Sector Applications Reason for preferring imported machinerysupply ppimported machinery
Complete press line Auto OEMSkin panel pressing & blanking
To boost productivity
Consumer Bending & piercing of Low maintenance & highNew machines
Mechanical pressConsumer durables
Bending & piercing of sheet metal
Low maintenance & high accuracy
Tube bending machine
Consumer durables
For bending copper tubes
Best in the industry & value added features
Bending & rollingShi b ildi Sh b di
Lack of efficient domesticBending & rolling machine
Ship building Sheet bending Lack of efficient domestic suppliers
Punch press General engineering
Sheet bending for outer cover of a machine
Not a critical application, only for bending & is cost effective
Used machines
Bending & rolling machine
Energy & power For bending the body of boiler
Cost effective solution to get the desired accuracy , better than the local machineries
Pl tti A t P i d 50% l thPlasma cutting machine
Auto components
Cutting sheet metal Priced 50% lower than new machines
51
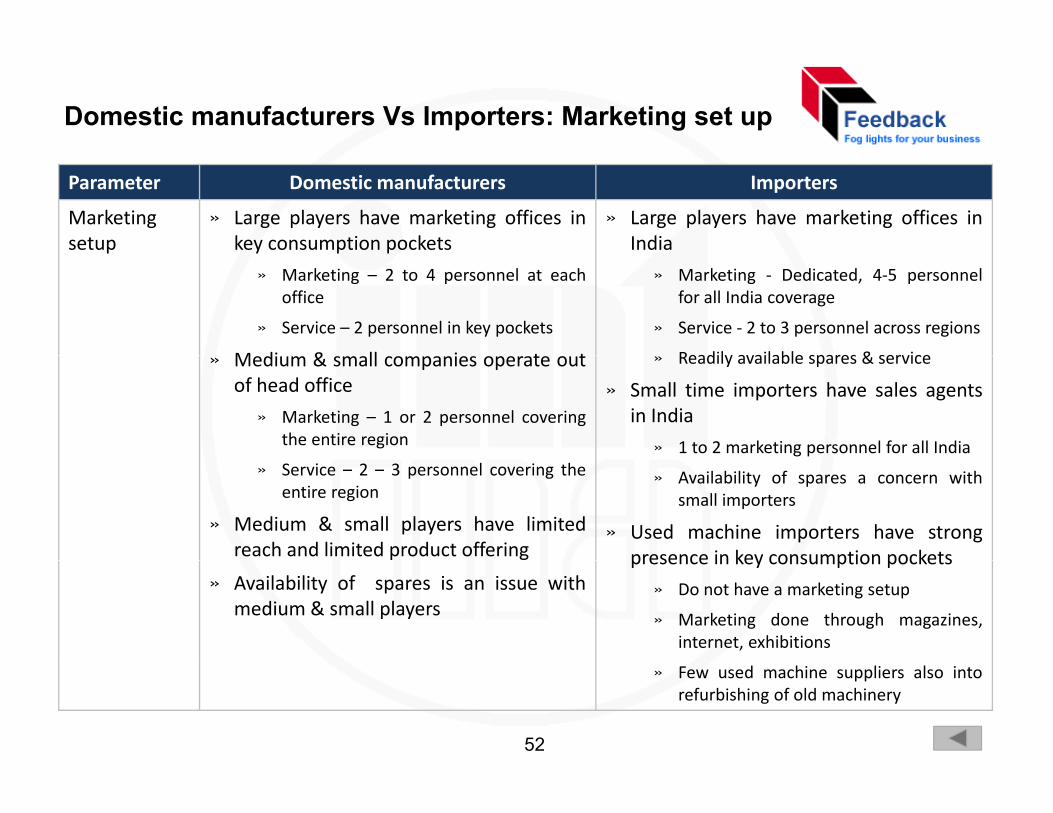
Domestic manufacturers Vs Importers: Marketing set up
Parameter Domestic manufacturers Importers
Marketing setup
» Large players have marketing offices inkey consumption pockets
» Large players have marketing offices inIndiap y p p
» Marketing – 2 to 4 personnel at eachoffice
» Service – 2 personnel in key pockets
M di & ll i t t
» Marketing ‐ Dedicated, 4‐5 personnelfor all India coverage
» Service ‐ 2 to 3 personnel across regions
Readily available spares & service» Medium & small companies operate outof head office
» Marketing – 1 or 2 personnel coveringthe entire region
» Readily available spares & service
» Small time importers have sales agentsin India
» 1 to 2 marketing personnel for all India» Service – 2 – 3 personnel covering the
entire region
» Medium & small players have limitedreach and limited product offering
» Availability of spares a concern withsmall importers
» Used machine importers have strongpresence in key consumption pockets
» Availability of spares is an issue withmedium & small players
presence in key consumption pockets
» Do not have a marketing setup
» Marketing done through magazines,internet, exhibitions
» Few used machine suppliers also intorefurbishing of old machinery
52
Domestic manufacturers Vs importers: Target segment
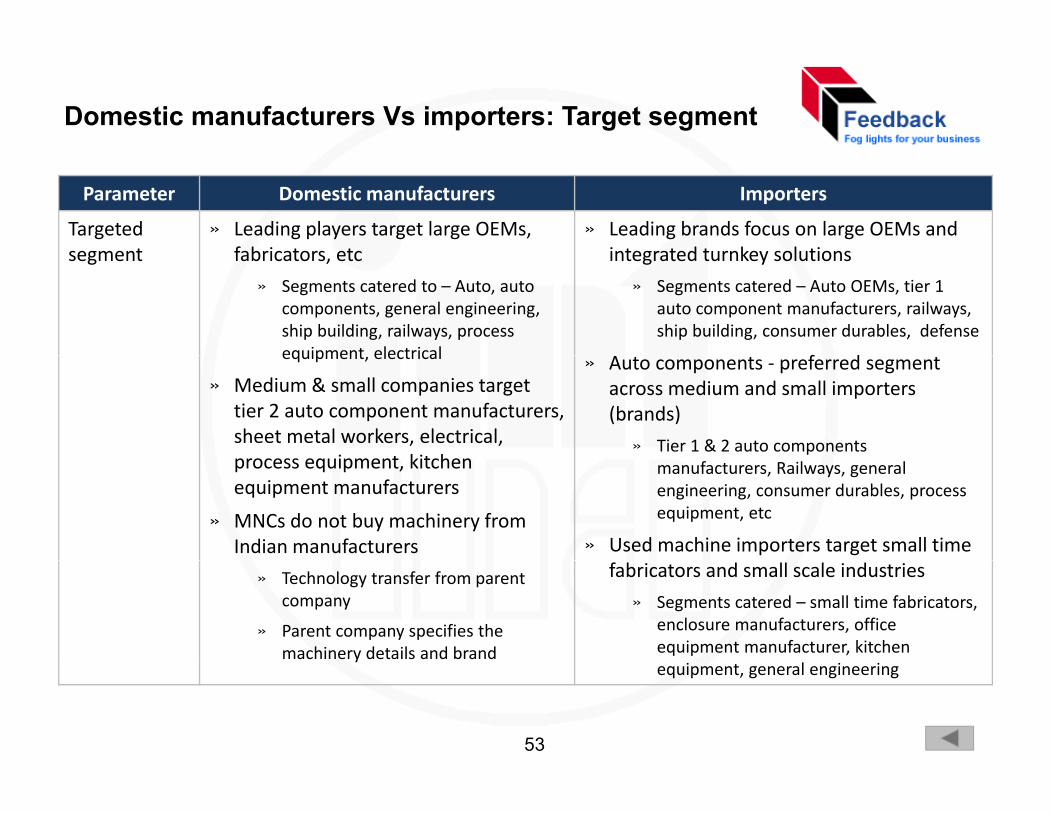
Parameter Domestic manufacturers Importers
Targeted segment
» Leading players target large OEMs, fabricators etc
» Leading brands focus on large OEMs and integrated turnkey solutionssegment fabricators, etc
» Segments catered to – Auto, auto components, general engineering, ship building, railways, process equipment electrical
integrated turnkey solutions
» Segments catered – Auto OEMs, tier 1 auto component manufacturers, railways, ship building, consumer durables, defense
f dequipment, electrical
» Medium & small companies target tier 2 auto component manufacturers, sheet metal workers, electrical,
i t kit h
» Auto components ‐ preferred segment across medium and small importers (brands)
» Tier 1 & 2 auto components process equipment, kitchen equipment manufacturers
» MNCs do not buy machinery from Indian manufacturers
manufacturers, Railways, general engineering, consumer durables, process equipment, etc
» Used machine importers target small time
» Technology transfer from parent company
» Parent company specifies the machinery details and brand
fabricators and small scale industries
» Segments catered – small time fabricators, enclosure manufacturers, office equipment manufacturer, kitchen
i l i iequipment, general engineering
53
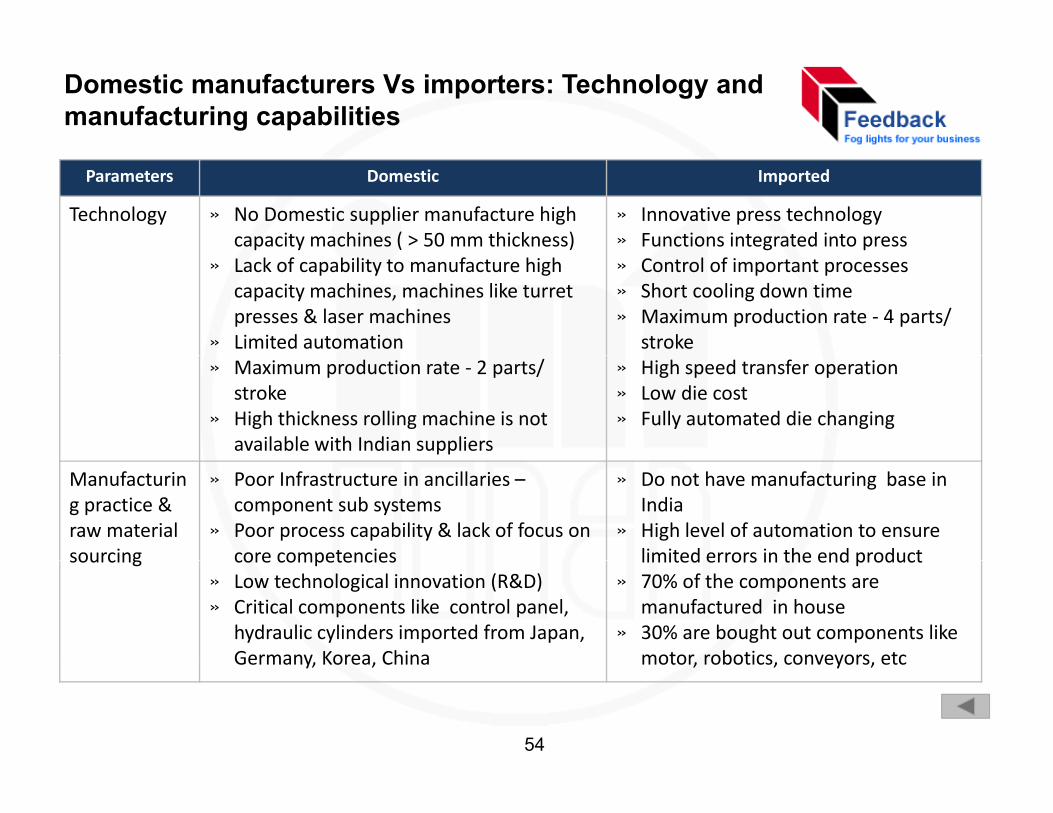
Domestic manufacturers Vs importers: Technology and manufacturing capabilities
Parameters Domestic Imported
Technology » No Domestic supplier manufacture high capacity machines ( > 50 mm thickness)
» Innovative press technology » Functions integrated into press
» Lack of capability to manufacture high capacity machines, machines like turret presses & laser machines
» Limited automation
» Control of important processes» Short cooling down time» Maximum production rate ‐ 4 parts/
stroke » Maximum production rate ‐ 2 parts/
stroke» High thickness rolling machine is not
available with Indian suppliers
» High speed transfer operation » Low die cost » Fully automated die changing
Manufacturing practice & raw material sourcing
» Poor Infrastructure in ancillaries –component sub systems
» Poor process capability & lack of focus on core competencies
» Do not have manufacturing base in India
» High level of automation to ensure limited errors in the end productsourcing core competencies
» Low technological innovation (R&D)» Critical components like control panel,
hydraulic cylinders imported from Japan, Germany, Korea, China
limited errors in the end product » 70% of the components are
manufactured in house » 30% are bought out components like
motor, robotics, conveyors, etc
54
Germany, Korea, China motor, robotics, conveyors, etc
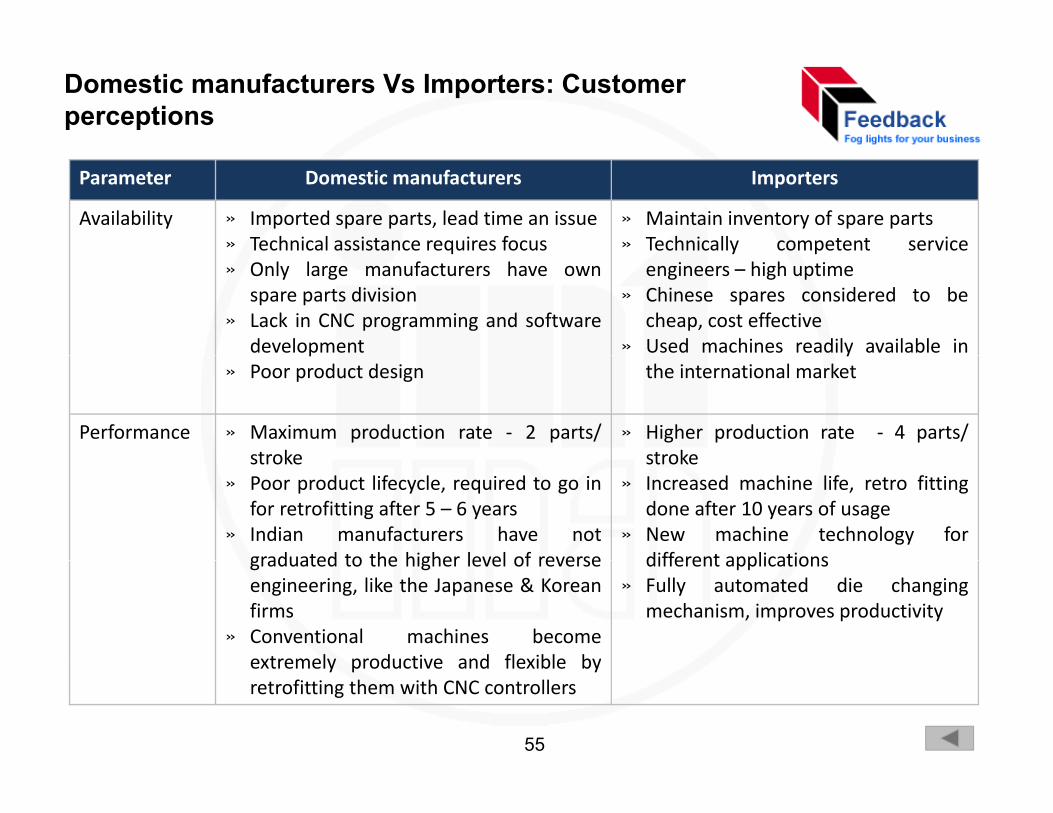
Domestic manufacturers Vs Importers: Customer perceptions
Parameter Domestic manufacturers Importers
Availability » Imported spare parts, lead time an issue» Technical assistance requires focus
» Maintain inventory of spare parts» Technically competent serviceq
» Only large manufacturers have ownspare parts division
» Lack in CNC programming and softwaredevelopment
y pengineers – high uptime
» Chinese spares considered to becheap, cost effective
» Used machines readily available inp» Poor product design
ythe international market
Performance » Maximum production rate ‐ 2 parts/stroke
» Higher production rate ‐ 4 parts/strokestroke
» Poor product lifecycle, required to go infor retrofitting after 5 – 6 years
» Indian manufacturers have notgraduated to the higher level of reverse
stroke» Increased machine life, retro fitting
done after 10 years of usage» New machine technology for
different applicationsgraduated to the higher level of reverseengineering, like the Japanese & Koreanfirms
» Conventional machines becomeextremely productive and flexible by
different applications» Fully automated die changing
mechanism, improves productivity
extremely productive and flexible byretrofitting them with CNC controllers
55
Customers verbatim on Indian manufacturers’ capability to innovate and compete with imported brands
» “Designing of most of the Indian made machines considered to be more conventional &market driven, rather than technology driven”
» “Domestic manufacturers’ core competency lies in manufacturing low cost & reasonablypriced metal forming machines”
» “The capability to conceptualize a product to achieve certain design & performancep y p p g pcharacteristics (Design & performance wise) is not found in Indigenous metal formingmachines”
» “Only a few large players have technology tie ups with foreign players and are able toy g p y gy p g p ycompete with imported machineries”
» “Machinery manufactured by major players in India is through technology transfer fromMNCs & it is seen that, whenever technology transfer happens, a gap always exists where, gy pp , g p ythe receiver ends up with lower/ obsolete technology than what the supplier has”
» “The R&D capabilities are limited to 5-6 major players only and most of them are involved insolving problems that arise in manufacturing, rather than developing new technology driveng p g, p g gyproducts”
56
Metal Forming Machinery Market estimates– Market estimates
• Approach and Methodology • Overall market, 2008-09 as the base year• Market estimates by:
– Type of machinery– Import Vs Domestic manufacturing
D ti f t i l t– Domestic manufacturing clusters
57
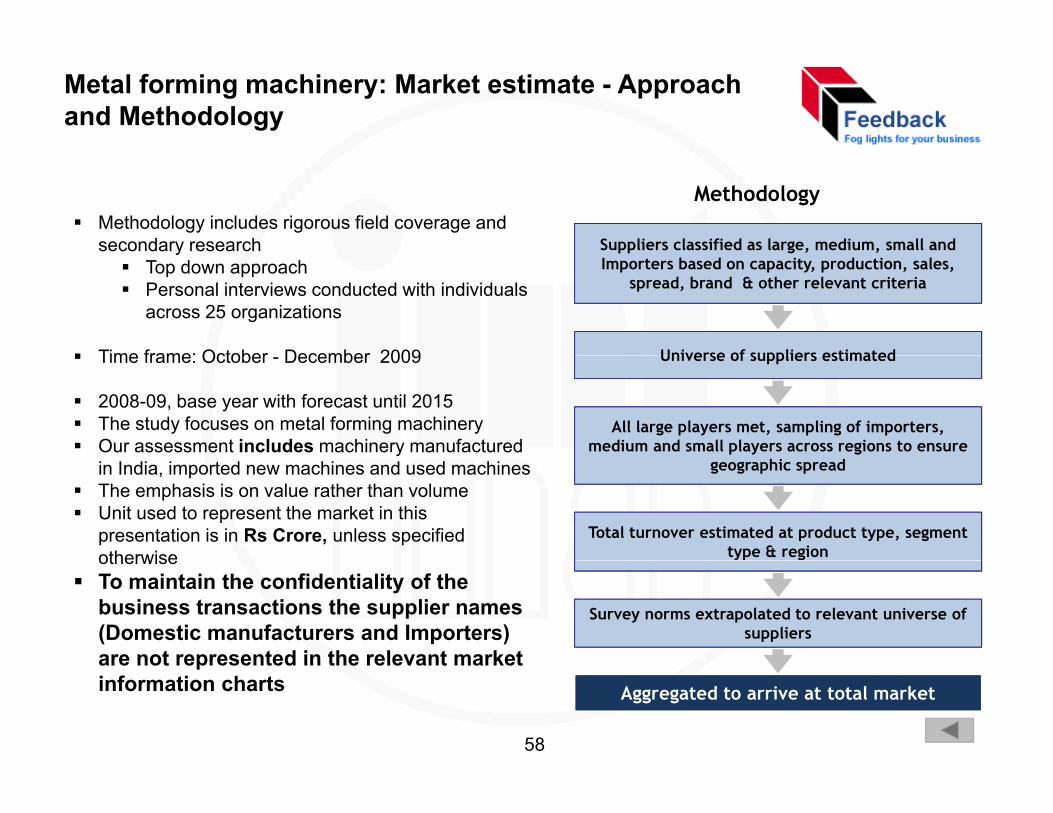
Metal forming machinery: Market estimate - Approach and Methodology
Suppliers classified as large, medium, small and Methodology includes rigorous field coverage and secondary research
Methodology
pp g , ,Importers based on capacity, production, sales,
spread, brand & other relevant criteria
Universe of suppliers estimated
yTop down approachPersonal interviews conducted with individuals across 25 organizations
Time frame: October December 2009
All large players met, sampling of importers, medium and small players across regions to ensure
Universe of suppliers estimatedTime frame: October - December 2009
2008-09, base year with forecast until 2015The study focuses on metal forming machineryOur assessment includes machinery manufactured
Total turnover estimated at product type, segment type & region
geographic spreadin India, imported new machines and used machinesThe emphasis is on value rather than volumeUnit used to represent the market in this presentation is in Rs Crore, unless specified otherwise
Survey norms extrapolated to relevant universe of suppliers
otherwiseTo maintain the confidentiality of the business transactions the supplier names (Domestic manufacturers and Importers) are not represented in the relevant market
Aggregated to arrive at total marketAggregated to arrive at total market
are not represented in the relevant market information charts
58
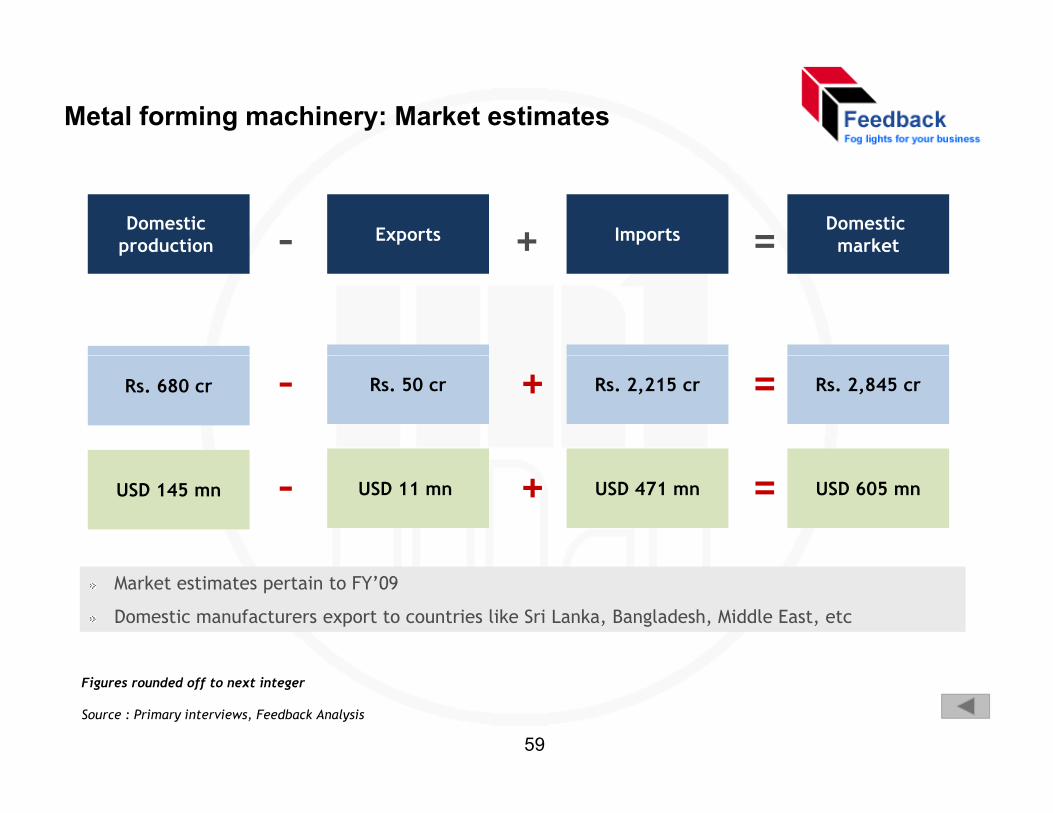
Metal forming machinery: Market estimates
Domestic market
Domestic production ImportsExports =+–p
+–Rs. 680 cr Rs. 50 cr Rs. 2,215 cr Rs. 2,845 cr=
+–USD 145 mn USD 11 mn USD 471 mn USD 605 mn=
Market estimates pertain to FY’09
Domestic manufacturers export to countries like Sri Lanka, Bangladesh, Middle East, etc
Source : Primary interviews, Feedback Analysis
Figures rounded off to next integer
59
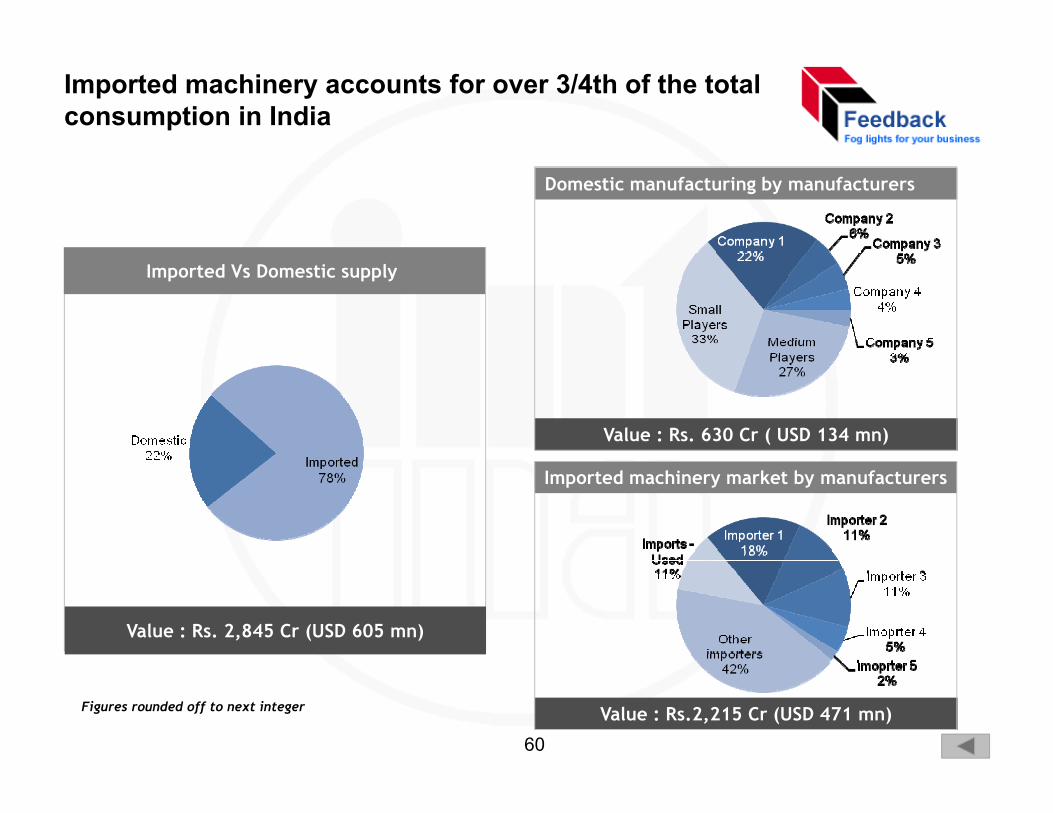
Imported machinery accounts for over 3/4th of the total consumption in India
Domestic manufacturing by manufacturers
Imported Vs Domestic supply
Value : Rs. 630 Cr ( USD 134 mn)
Imported machinery market by manufacturers
Value : Rs. 2,845 Cr (USD 605 mn)
Value : Rs.2,215 Cr (USD 471 mn)Figures rounded off to next integer
60
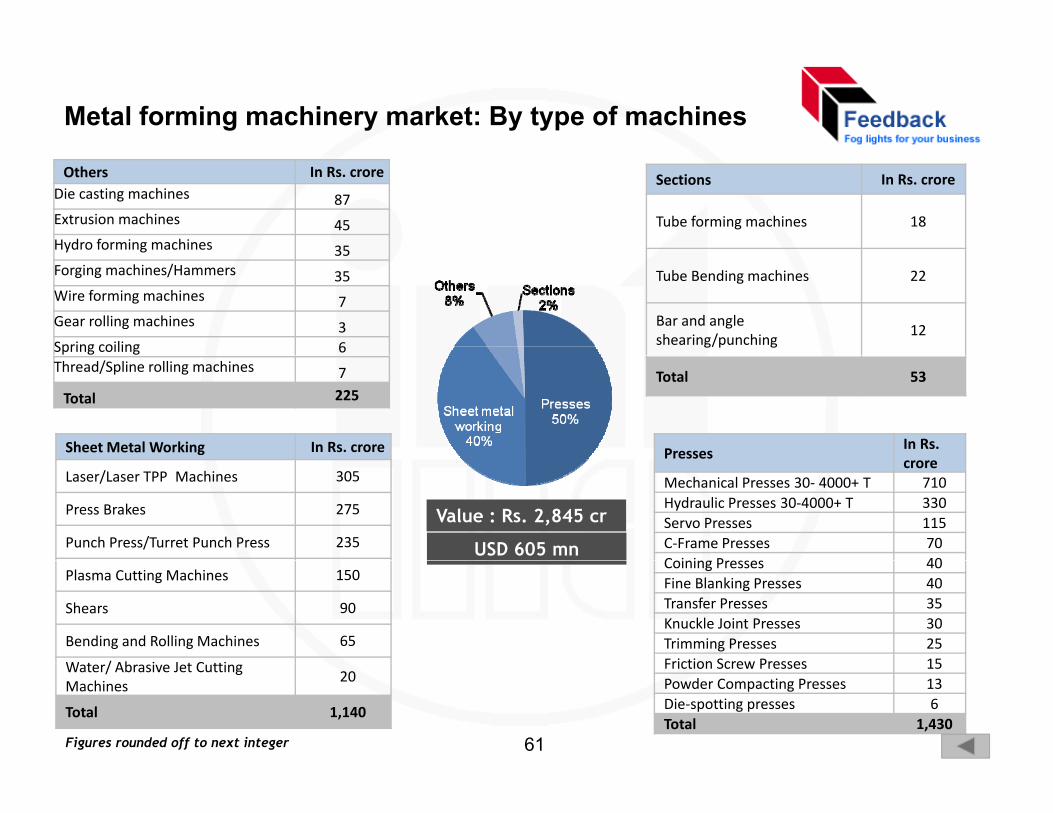
Metal forming machinery market: By type of machines
Others In Rs. crore Die casting machines 87Extrusion machines 45Hydro forming machines 35
Sections In Rs. crore
Tube forming machines 18
35Forging machines/Hammers 35Wire forming machines 7Gear rolling machines 3Spring coiling 6
Tube Bending machines 22
Bar and angle shearing/punching
12
PressesIn Rs. Sheet Metal Working In Rs. crore
Thread/Spline rolling machines 7
Total 225Total 53
Pressescrore
Mechanical Presses 30‐ 4000+ T 710Hydraulic Presses 30‐4000+ T 330Servo Presses 115C‐Frame Presses 70C i i P 40
Laser/Laser TPP Machines 305
Press Brakes 275
Punch Press/Turret Punch Press 235
Value : Rs. 2,845 cr
USD 605 mnCoining Presses 40Fine Blanking Presses 40Transfer Presses 35Knuckle Joint Presses 30Trimming Presses 25Friction Screw Presses 15
Plasma Cutting Machines 150
Shears 90
Bending and Rolling Machines 65
W t / Ab i J t C tti Friction Screw Presses 15Powder Compacting Presses 13Die‐spotting presses 6Total 1,430
Water/ Abrasive Jet Cutting Machines
20
Total 1,140
Figures rounded off to next integer 61
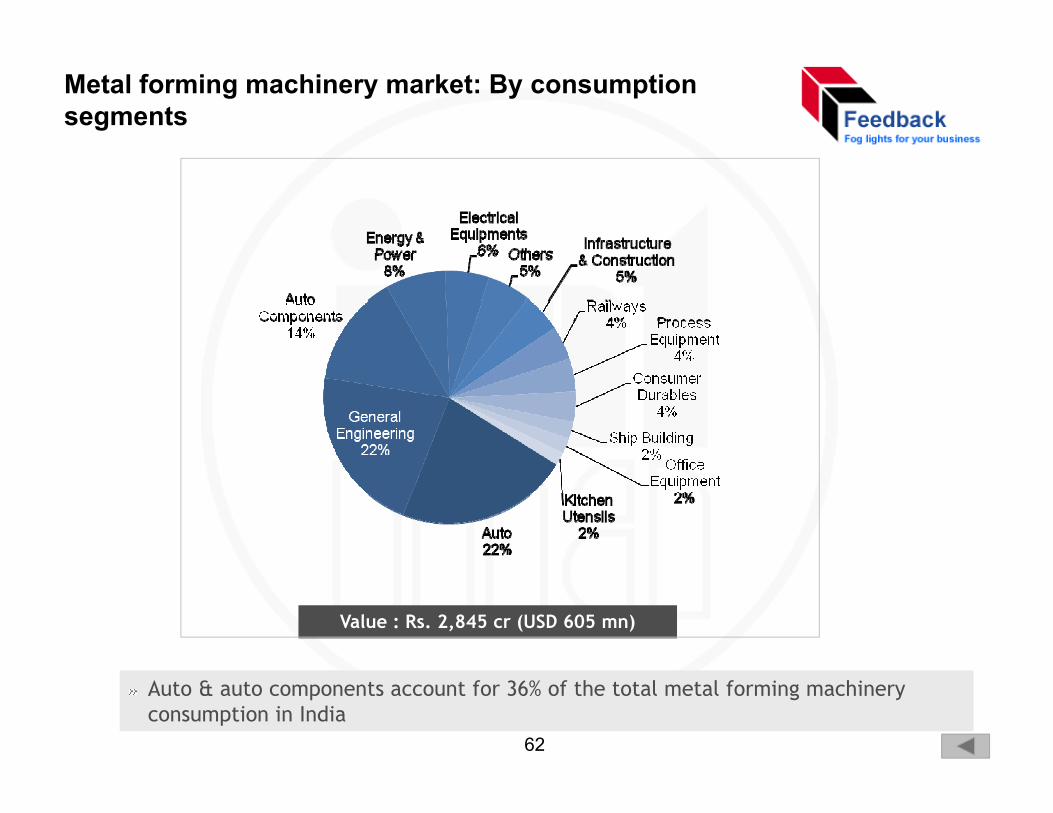
Metal forming machinery market: By consumption segments
Value : Rs. 2,845 cr (USD 605 mn)
Auto & auto components account for 36% of the total metal forming machinery consumption in India
62
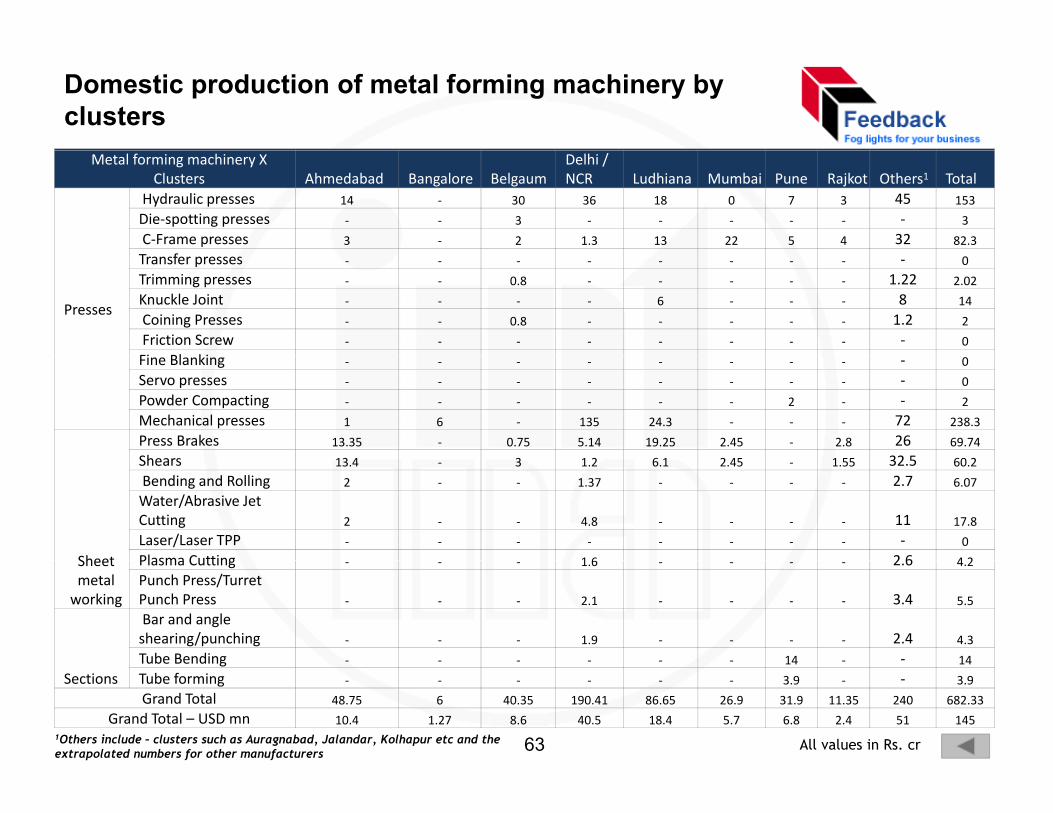
Domestic production of metal forming machinery by clusters
Metal forming machinery X Clusters Ahmedabad Bangalore Belgaum
Delhi / NCR Ludhiana Mumbai Pune Rajkot Others1 Total
Hydraulic presses 14 ‐ 30 36 18 0 7 3 45 153
Die‐spotting presses ‐ ‐ 3 ‐ ‐ ‐ ‐ ‐ ‐ 3
C‐Frame presses 3 ‐ 2 1.3 13 22 5 4 32 82.3
Presses
Transfer presses ‐ ‐ ‐ ‐ ‐ ‐ ‐ ‐ ‐ 0
Trimming presses ‐ ‐ 0.8 ‐ ‐ ‐ ‐ ‐ 1.22 2.02
Knuckle Joint ‐ ‐ ‐ ‐ 6 ‐ ‐ ‐ 8 14
Coining Presses ‐ ‐ 0.8 ‐ ‐ ‐ ‐ ‐ 1.2 2
Friction Screw ‐ ‐ ‐ ‐ ‐ ‐ ‐ ‐ ‐ 0
Fi Bl kiFine Blanking ‐ ‐ ‐ ‐ ‐ ‐ ‐ ‐ ‐ 0
Servo presses ‐ ‐ ‐ ‐ ‐ ‐ ‐ ‐ ‐ 0
Powder Compacting ‐ ‐ ‐ ‐ ‐ ‐ 2 ‐ ‐ 2
Mechanical presses 1 6 ‐ 135 24.3 ‐ ‐ ‐ 72 238.3
Press Brakes 13.35 ‐ 0.75 5.14 19.25 2.45 ‐ 2.8 26 69.74
Sh 13 4 3 1 2 6 1 2 45 1 55 32 5 60 2
Sheet
Shears 13.4 ‐ 3 1.2 6.1 2.45 ‐ 1.55 32.5 60.2
Bending and Rolling 2 ‐ ‐ 1.37 ‐ ‐ ‐ ‐ 2.7 6.07
Water/Abrasive Jet Cutting 2 ‐ ‐ 4.8 ‐ ‐ ‐ ‐ 11 17.8
Laser/Laser TPP ‐ ‐ ‐ ‐ ‐ ‐ ‐ ‐ ‐ 0
Plasma Cutting 1 6 2 6 4 2Sheet metal working
Plasma Cutting ‐ ‐ ‐ 1.6 ‐ ‐ ‐ ‐ 2.6 4.2
Punch Press/Turret Punch Press ‐ ‐ ‐ 2.1 ‐ ‐ ‐ ‐ 3.4 5.5
Bar and angle shearing/punching ‐ ‐ ‐ 1.9 ‐ ‐ ‐ ‐ 2.4 4.3
Tube Bending ‐ ‐ ‐ ‐ ‐ ‐ 14 ‐ ‐ 14
Sections Tube Bending 14 14
Tube forming ‐ ‐ ‐ ‐ ‐ ‐ 3.9 ‐ ‐ 3.9
Grand Total 48.75 6 40.35 190.41 86.65 26.9 31.9 11.35 240 682.33
Grand Total – USD mn 10.4 1.27 8.6 40.5 18.4 5.7 6.8 2.4 51 1451Others include – clusters such as Auragnabad, Jalandar, Kolhapur etc and the extrapolated numbers for other manufacturers
All values in Rs. cr63
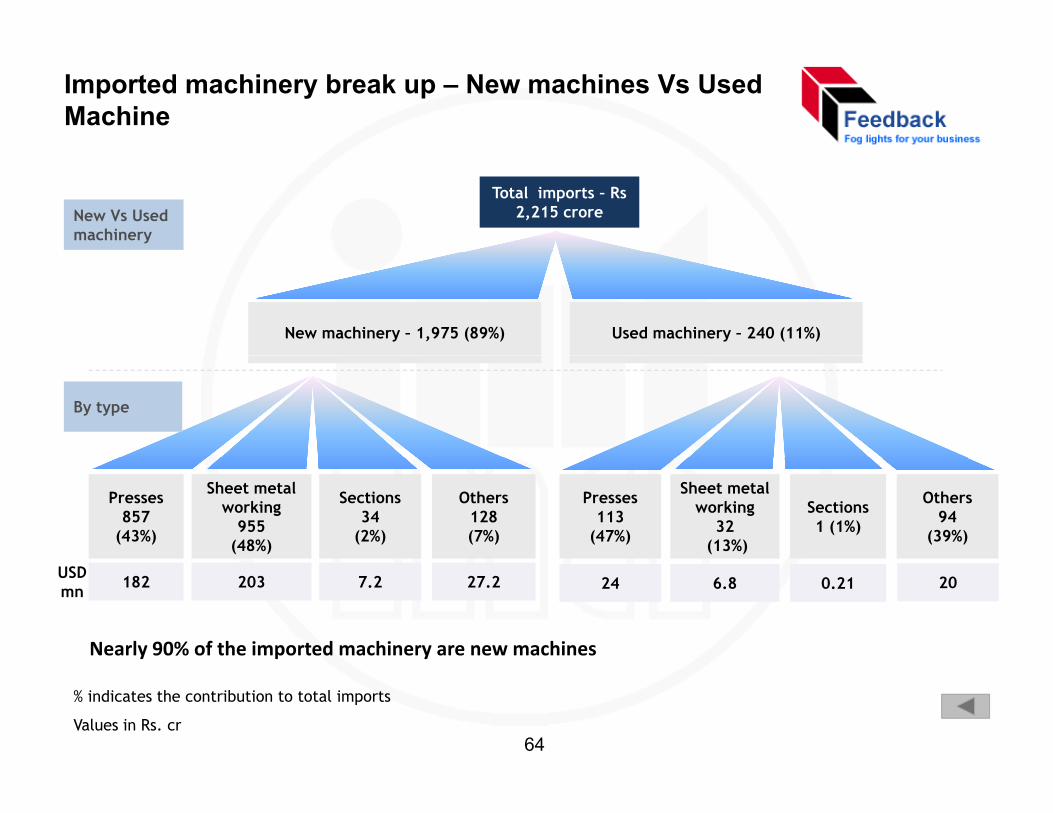
Imported machinery break up – New machines Vs Used Machine
Total imports – Rs 2,215 croreNew Vs Used
machinery
New machinery – 1,975 (89%) Used machinery – 240 (11%)
By type
Presses 857
(43%)
Sheet metal working
955 (48%)
Sections34
(2%)
Others128 (7%)
Presses113
(47%)
Sheet metal working
32(13%)
Sections1 (1%)
Others94
(39%)
2024 6.8 0.21182 203 7.2 27.2USDmn
Nearly 90% of the imported machinery are new machines
Values in Rs. cr
% indicates the contribution to total imports
64
Market estimates by segmentsMarket estimates by segments
65
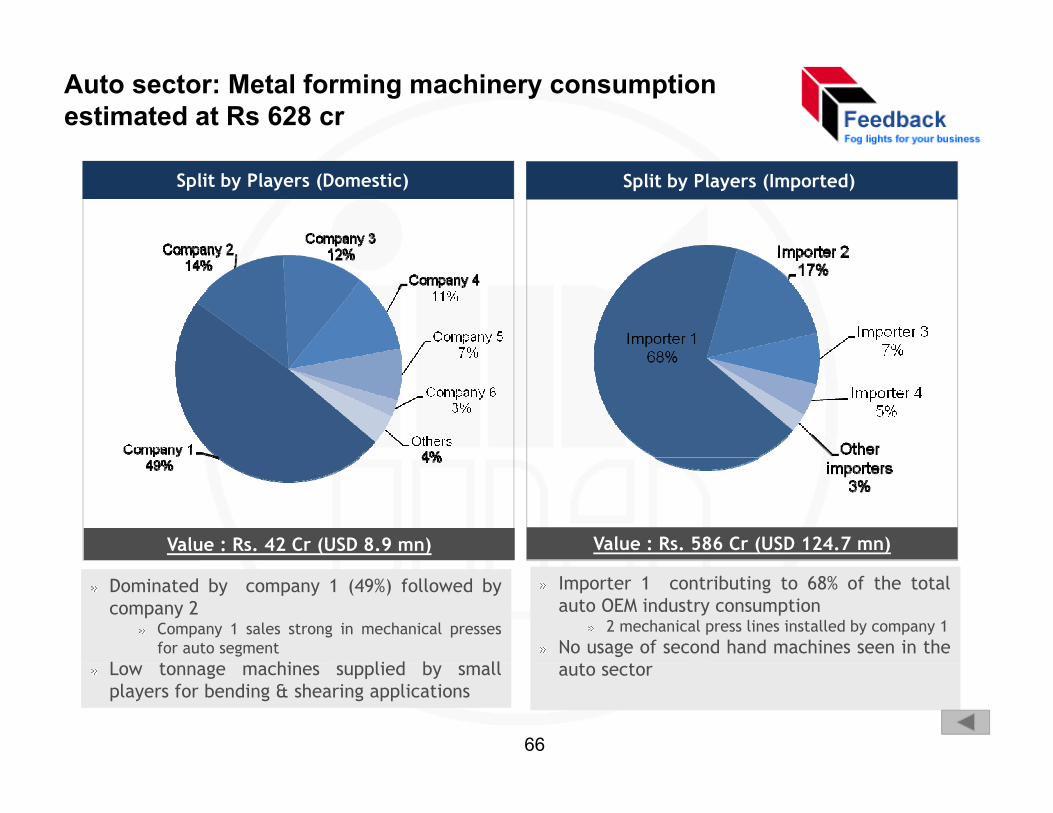
Auto sector: Metal forming machinery consumption estimated at Rs 628 cr
Split by Players (Domestic) Split by Players (Imported)
Value : Rs. 42 Cr (USD 8.9 mn) Value : Rs. 586 Cr (USD 124.7 mn)
Dominated by company 1 (49%) followed bycompany 2
Company 1 sales strong in mechanical pressesfor auto segment
L t hi li d b ll
Importer 1 contributing to 68% of the totalauto OEM industry consumption
2 mechanical press lines installed by company 1No usage of second hand machines seen in the
Low tonnage machines supplied by smallplayers for bending & shearing applications
auto sector
66
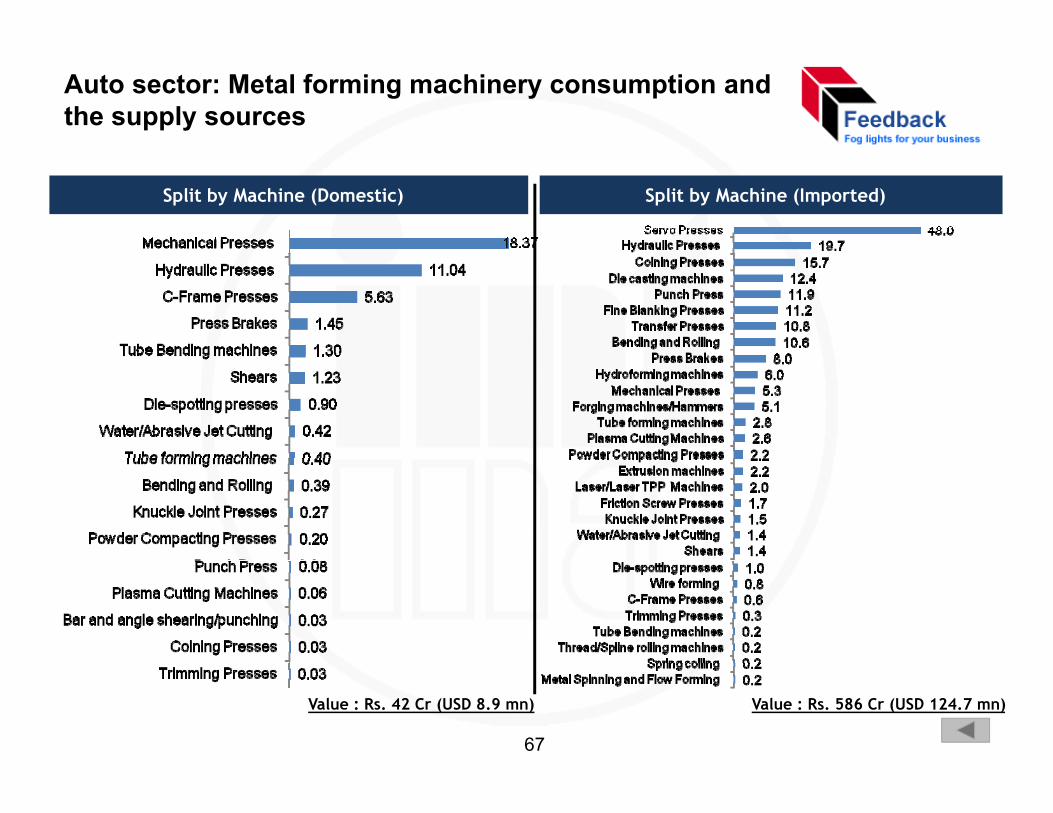
Auto sector: Metal forming machinery consumption and the supply sources
Split by Machine (Domestic) Split by Machine (Imported)
Value : Rs. 42 Cr (USD 8.9 mn) Value : Rs. 586 Cr (USD 124.7 mn)
67
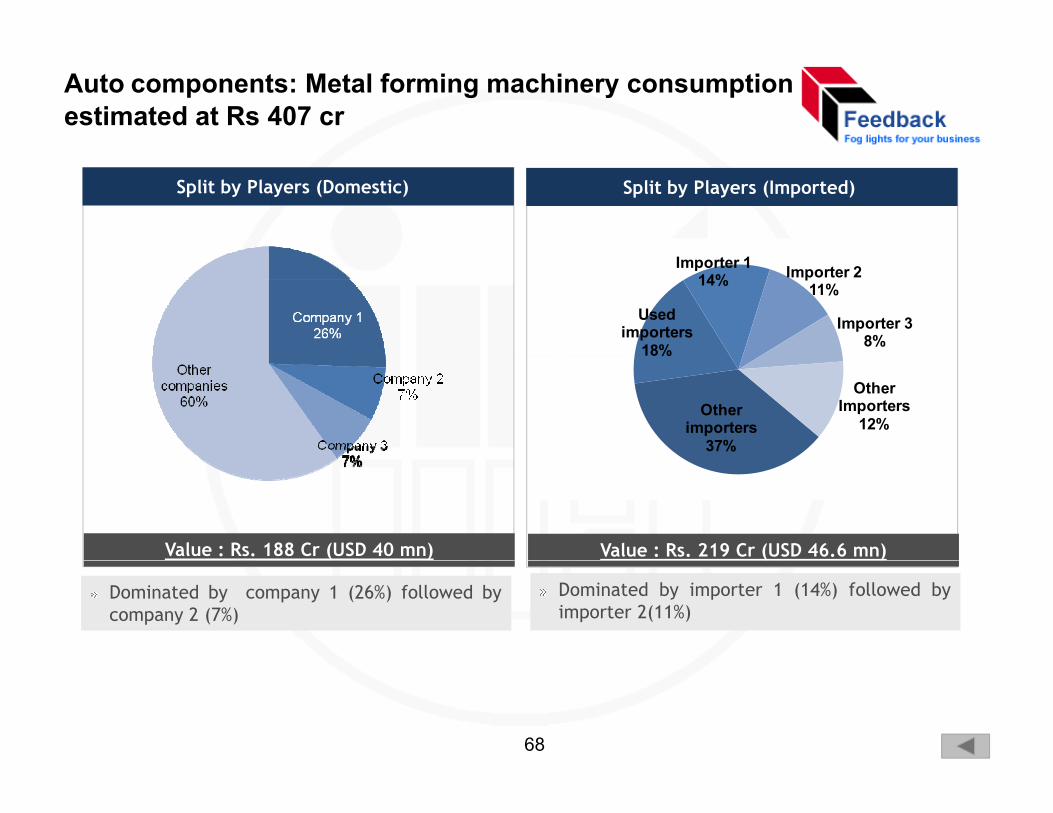
Auto components: Metal forming machinery consumption estimated at Rs 407 cr
Split by Players (Domestic) Split by Players (Imported)
Used importers
18%
Importer 114% Importer 2
11%
Importer 38%
Other importers
37%
18%
Other Importers
12%
Value : Rs. 188 Cr (USD 40 mn) Value : Rs. 219 Cr (USD 46.6 mn)
Dominated by company 1 (26%) followed bycompany 2 (7%)
( )
Dominated by importer 1 (14%) followed byimporter 2(11%)
68
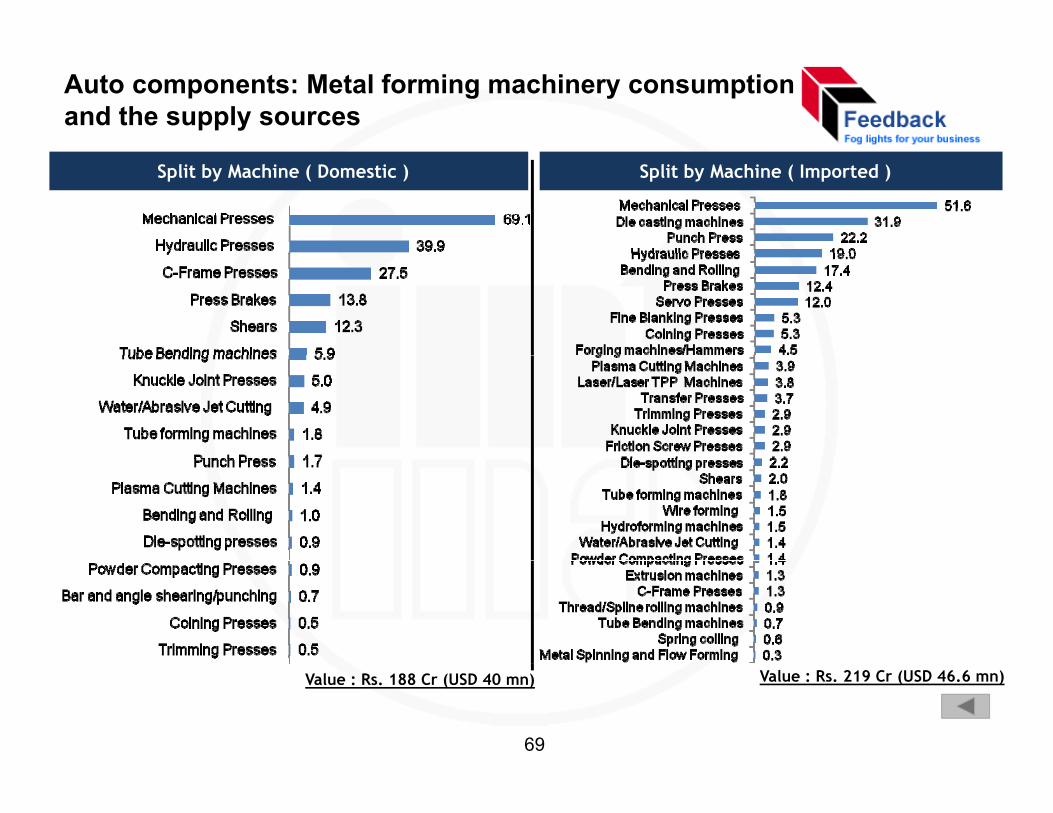
Auto components: Metal forming machinery consumption and the supply sources
Split by Machine ( Domestic ) Split by Machine ( Imported )
Value : Rs. 188 Cr (USD 40 mn) Value : Rs. 219 Cr (USD 46.6 mn)
69
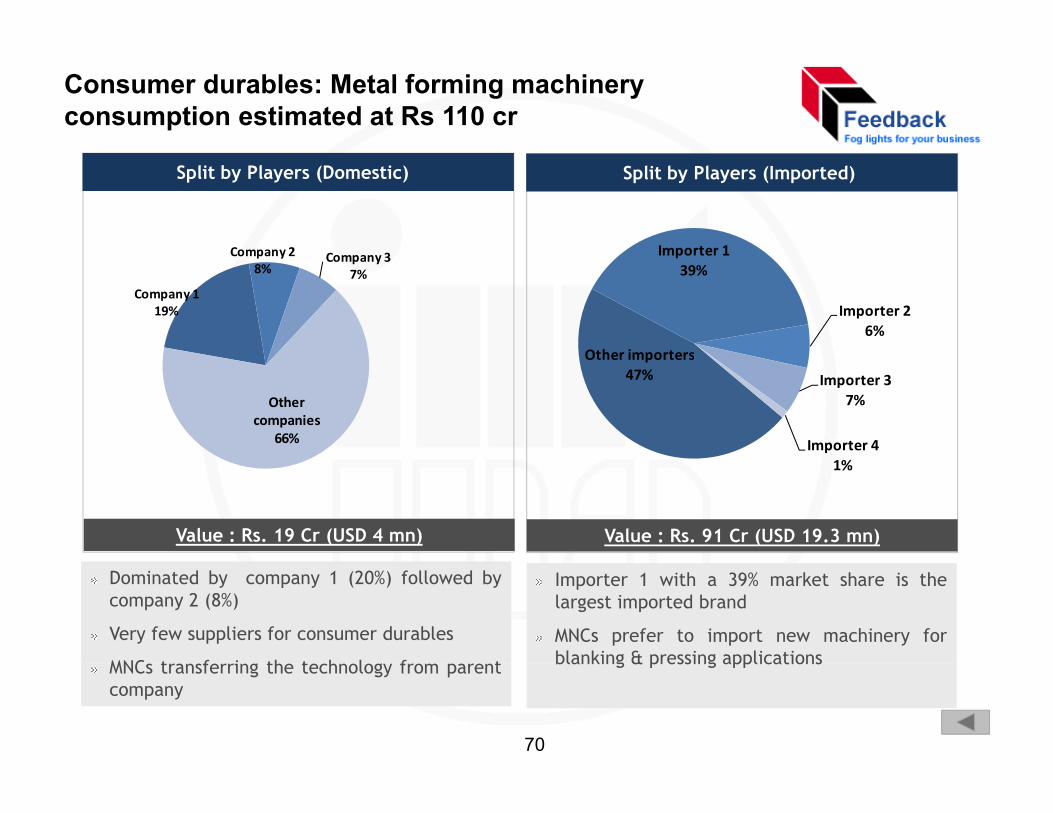
Consumer durables: Metal forming machinery consumption estimated at Rs 110 cr
Company 2 C 3 Importer 1
Split by Players (Domestic) Split by Players (Imported)
Company 119%
Company 28%
Company 37%
Other importers
Importer 139%
Importer 26%
Other companies
66%
Other importers47% Importer 3
7%
Importer 41%
Value : Rs. 19 Cr (USD 4 mn) Value : Rs. 91 Cr (USD 19.3 mn)
Dominated by company 1 (20%) followed bycompany 2 (8%)
Very few suppliers for consumer durables
MNC t f i th t h l f t
Importer 1 with a 39% market share is thelargest imported brand
MNCs prefer to import new machinery forblanking & pressing applicationsMNCs transferring the technology from parent
company
blanking & pressing applications
70
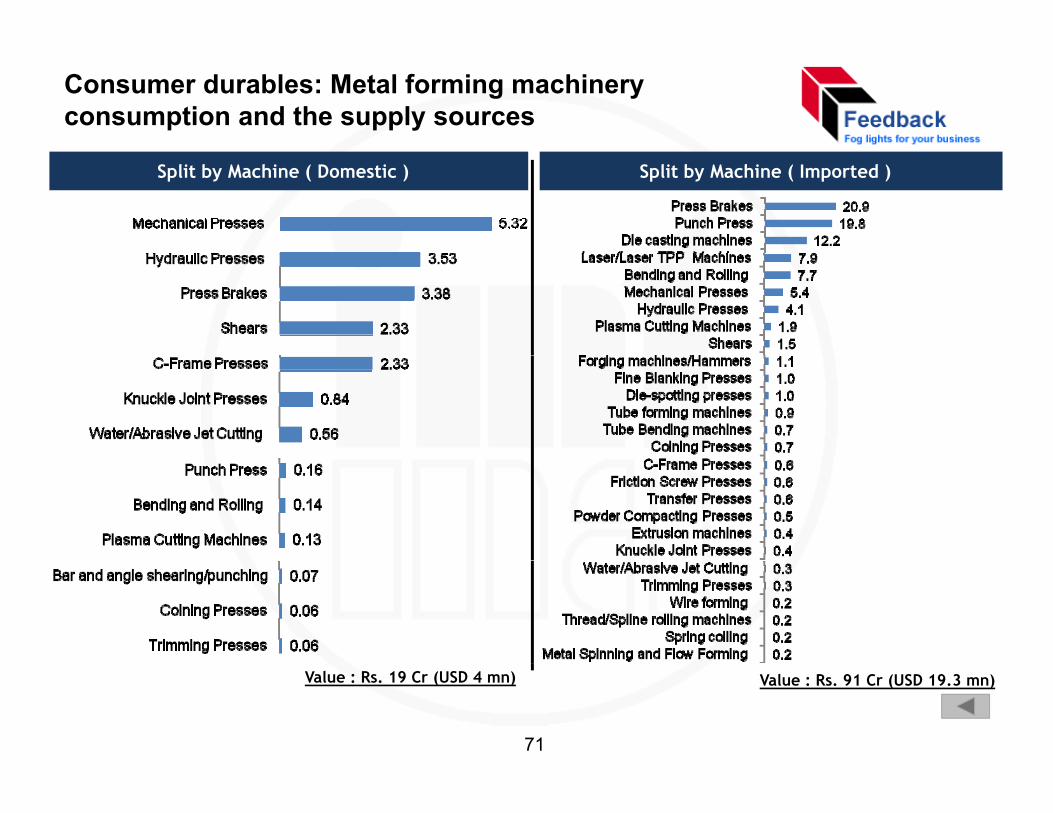
Consumer durables: Metal forming machinery consumption and the supply sources
Split by Machine ( Domestic ) Split by Machine ( Imported )
Value : Rs. 19 Cr (USD 4 mn) Value : Rs. 91 Cr (USD 19.3 mn)
71
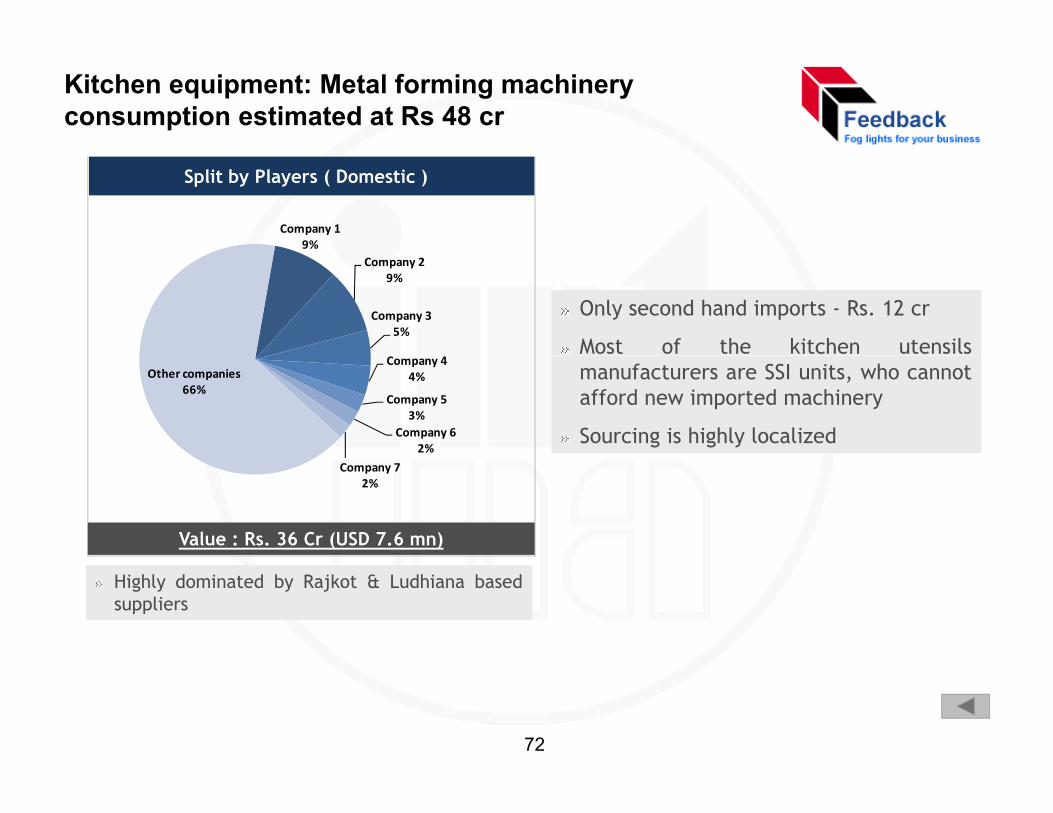
Kitchen equipment: Metal forming machinery consumption estimated at Rs 48 cr
Company 19%
Split by Players ( Domestic )
Company 29%
Company 35%
Only second hand imports - Rs. 12 cr
Most of the kitchen utensilsCompany 4
4%
Company 53%
Company 62%
Other companies66%
manufacturers are SSI units, who cannotafford new imported machinery
Sourcing is highly localizedCompany 7
2%
Value : Rs. 36 Cr (USD 7.6 mn)
Highly dominated by Rajkot & Ludhiana basedsuppliers
72
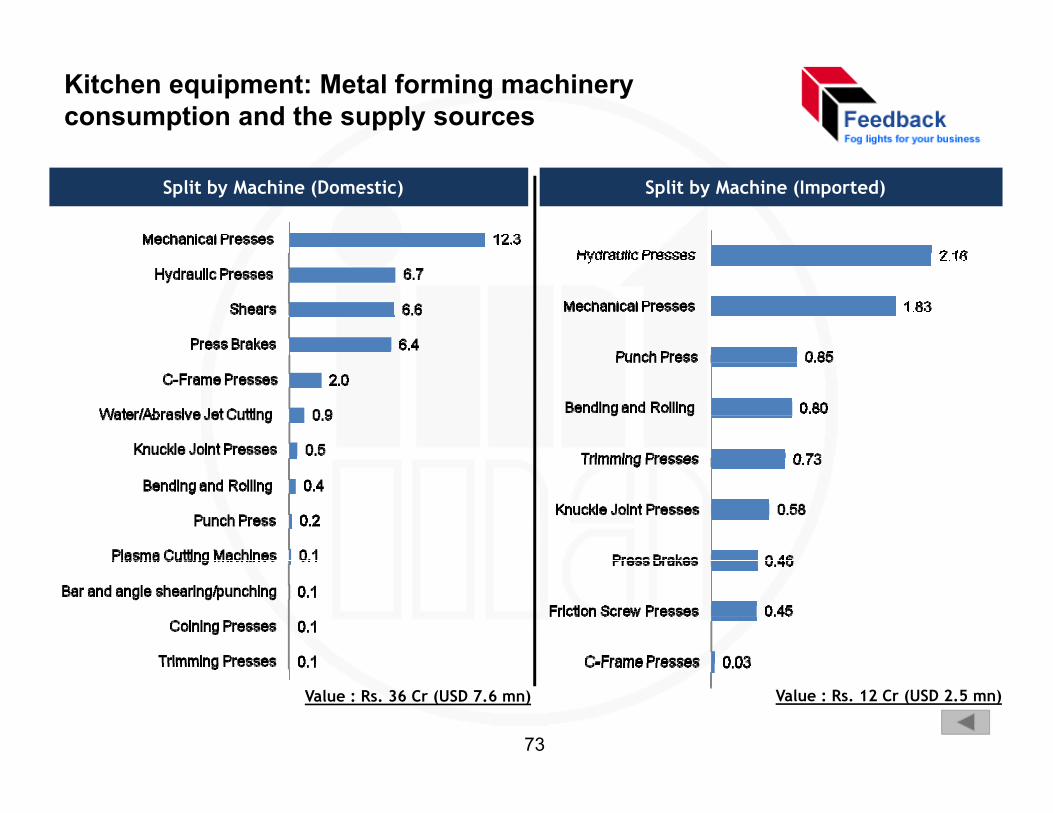
Kitchen equipment: Metal forming machinery consumption and the supply sources
Split by Machine (Domestic) Split by Machine (Imported)
Value : Rs. 36 Cr (USD 7.6 mn) Value : Rs. 12 Cr (USD 2.5 mn)
73
General engineering: Metal forming machinery consumption estimated at Rs 614 cr
Used machine
Split by Players ( Domestic ) Split by Players (Imported)
Other importers
70%
importers14%
Importer 18%70% 8%
Importer 25%
Importer 33%3%
Value : Rs. 108 Cr( USD 23 mn) Value : Rs. 506 Cr (USD 107.6 mn)
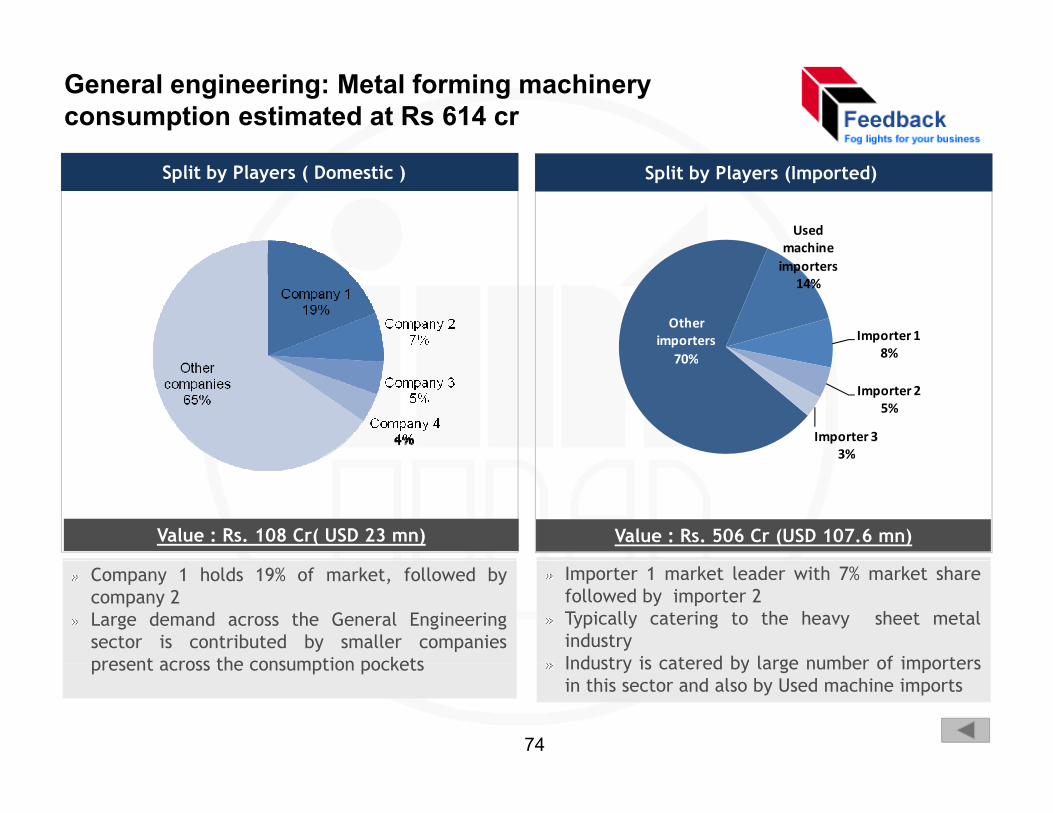
Company 1 holds 19% of market, followed bycompany 2Large demand across the General Engineeringsector is contributed by smaller companiespresent across the consumption pockets
Importer 1 market leader with 7% market sharefollowed by importer 2Typically catering to the heavy sheet metalindustryIndustry is catered by large number of importerspresent across the consumption pockets Industry is catered by large number of importersin this sector and also by Used machine imports
74
General Engineering: Metal forming machinery consumption and the supply sources
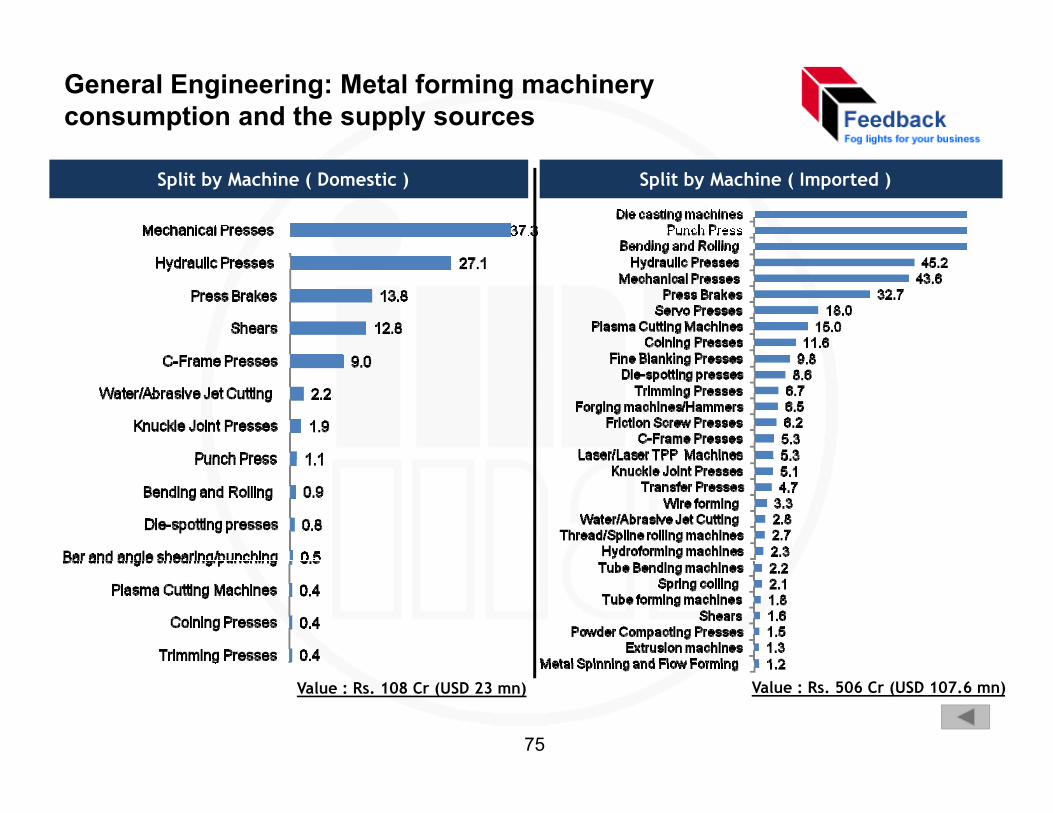
Split by Machine ( Domestic ) Split by Machine ( Imported )
Value : Rs. 108 Cr (USD 23 mn) Value : Rs. 506 Cr (USD 107.6 mn)
75
Electrical equipment: Metal forming machinery consumption estimated at Rs 162 cr
Split by Players ( Domestic ) Split by Players (Imported)
Importer 128% Importer 2
15%
Other importers
52%
Importer 35%
Value : Rs 34 Cr (USD 7 2 mn) Value : Rs 128 Cr (USD 27 2 mn)Value : Rs. 34 Cr (USD 7.2 mn)
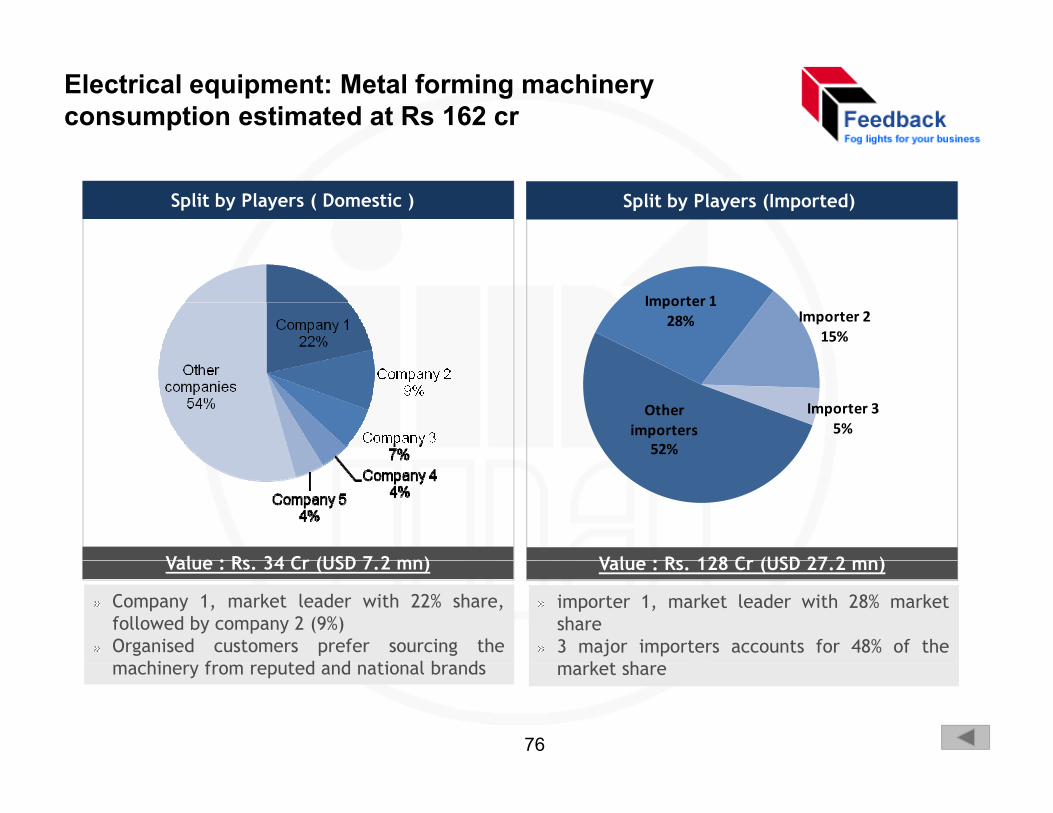
Company 1, market leader with 22% share,followed by company 2 (9%)Organised customers prefer sourcing the
hi f t d d ti l b d
Value : Rs. 128 Cr (USD 27.2 mn)
importer 1, market leader with 28% marketshare3 major importers accounts for 48% of the
k t hmachinery from reputed and national brands market share
76
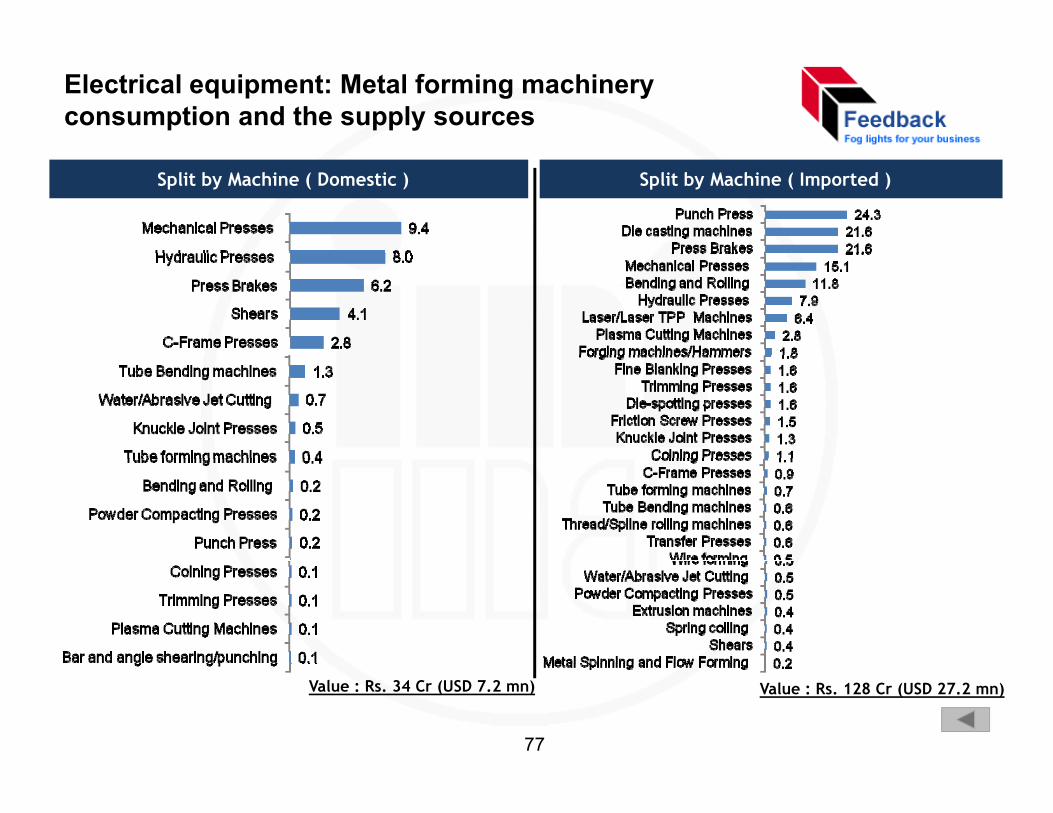
Electrical equipment: Metal forming machinery consumption and the supply sources
Split by Machine ( Domestic ) Split by Machine ( Imported )
Value : Rs. 34 Cr (USD 7.2 mn) Value : Rs. 128 Cr (USD 27.2 mn)
77
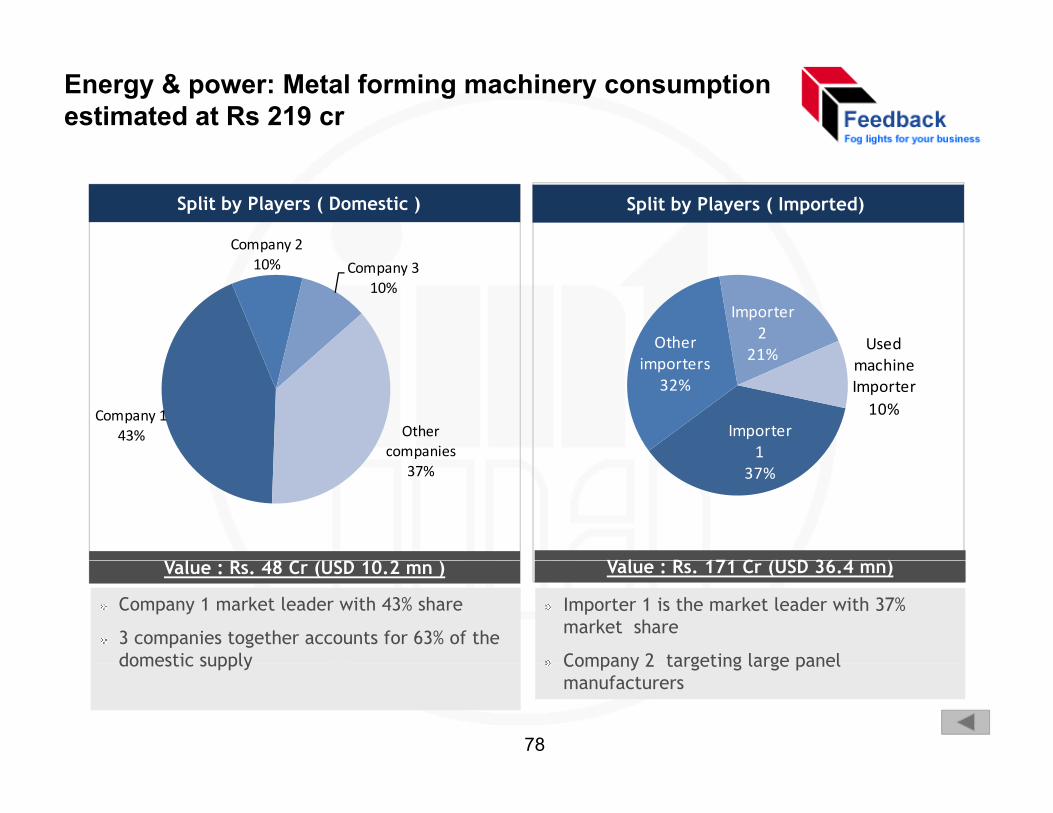
Energy & power: Metal forming machinery consumption estimated at Rs 219 cr
Company 2
Split by Players ( Domestic ) Split by Players ( Imported)
10% Company 310%
Other
Importer 2
21%Used
Company 143% Other
companiesImporter
1
importers32%
21%machine Importer10%
p37%
l R 48 C ( SD 10 2 ) V l R 171 C (USD 36 4 )
37%
Value : Rs. 48 Cr (USD 10.2 mn )
Company 1 market leader with 43% share
3 companies together accounts for 63% of the domestic supply
Value : Rs. 171 Cr (USD 36.4 mn)
Importer 1 is the market leader with 37% market share
Company 2 targeting large panel domestic supply Company 2 targeting large panel manufacturers
78
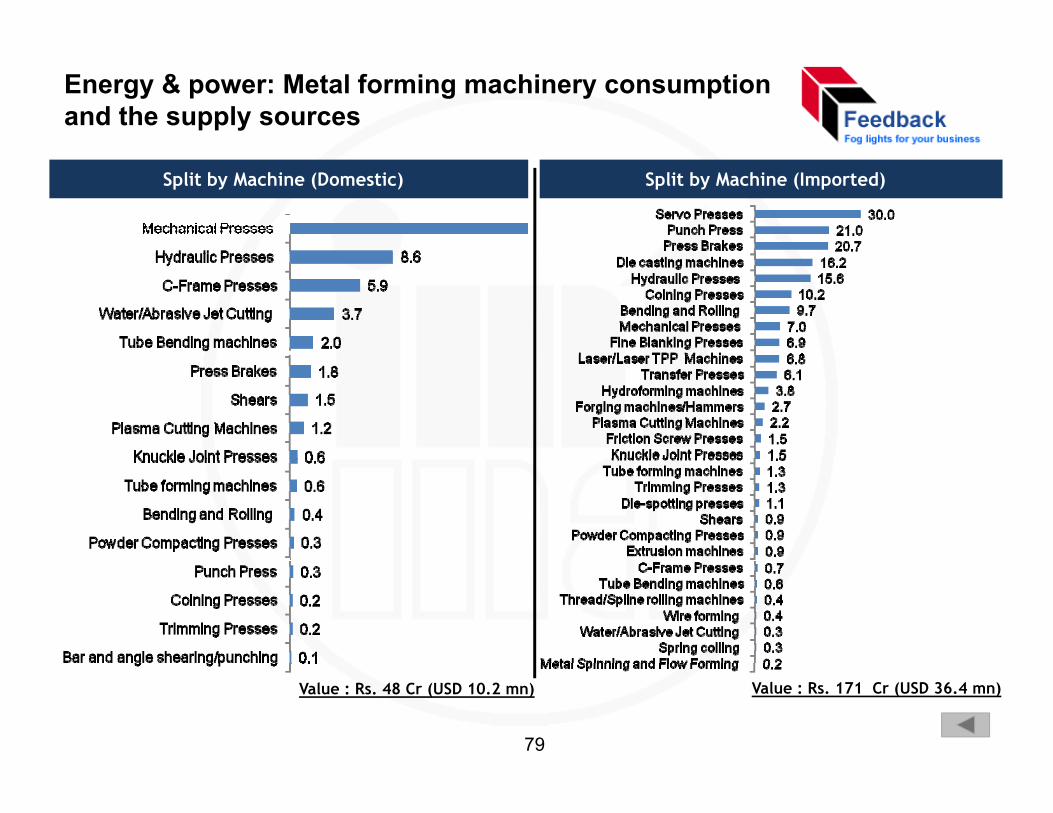
Energy & power: Metal forming machinery consumption and the supply sources
Split by Machine (Domestic) Split by Machine (Imported)
Value : Rs. 48 Cr (USD 10.2 mn) Value : Rs. 171 Cr (USD 36.4 mn)
79
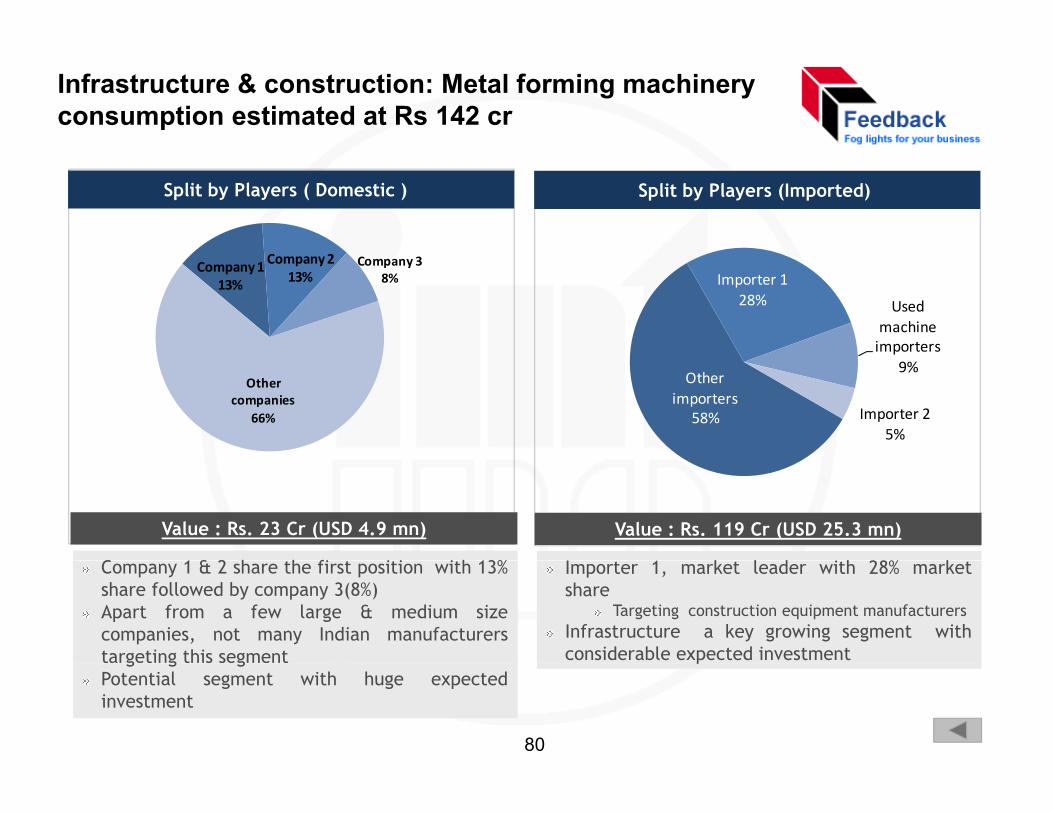
Infrastructure & construction: Metal forming machinery consumption estimated at Rs 142 cr
Split by Players ( Domestic ) Split by Players (Imported)
Company 113%
Company 213%
Company 38% Importer 1
28% Used machine importers
Other companies
66%
Other importers
58%
9%
Importer 25%
Value : Rs. 23 Cr (USD 4.9 mn)
C 1 & 2 h h fi i i i h 13%
Value : Rs. 119 Cr (USD 25.3 mn)
I 1 k l d i h 28% kCompany 1 & 2 share the first position with 13%share followed by company 3(8%)Apart from a few large & medium sizecompanies, not many Indian manufacturerstargeting this segment
Importer 1, market leader with 28% marketshare
Targeting construction equipment manufacturersInfrastructure a key growing segment withconsiderable expected investmentg g g
Potential segment with huge expectedinvestment
p
80
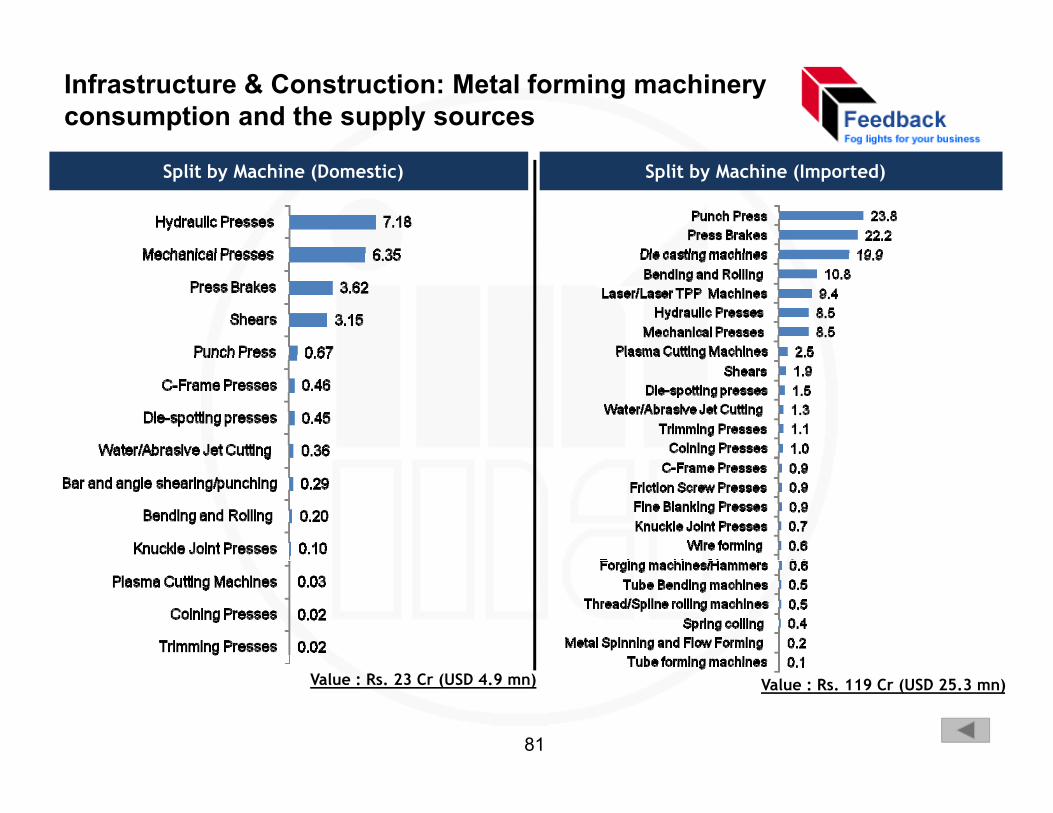
Infrastructure & Construction: Metal forming machinery consumption and the supply sources
Split by Machine (Domestic) Split by Machine (Imported)
Value : Rs. 23 Cr (USD 4.9 mn) Value : Rs. 119 Cr (USD 25.3 mn)
81
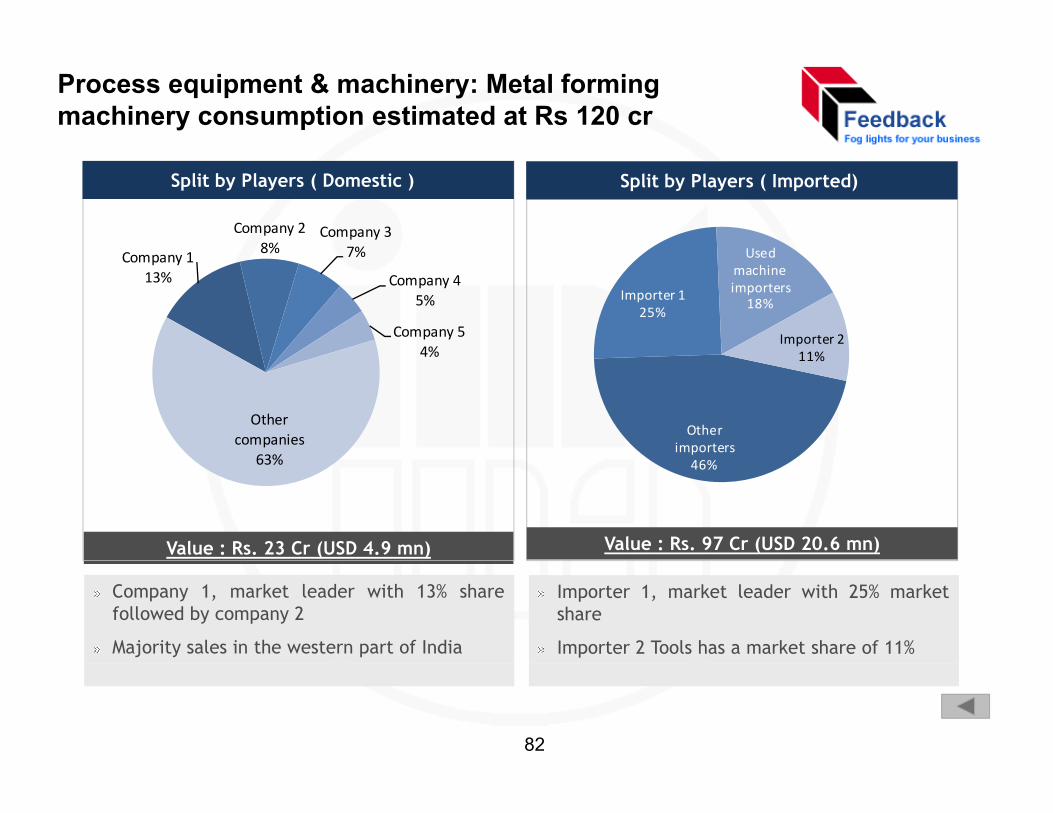
Process equipment & machinery: Metal forming machinery consumption estimated at Rs 120 cr
UsedC 1
Company 28%
Company 37%
Split by Players ( Domestic ) Split by Players ( Imported)
Importer 125%
Used machine importers
18%
Importer 211%
Company 113%
8% 7%
Company 45%
Company 54%
Other importers
11%4%
Other companies
63% 46%63%
Value : Rs. 97 Cr (USD 20.6 mn)Value : Rs. 23 Cr (USD 4.9 mn)
Company 1, market leader with 13% sharefollowed by company 2
Majority sales in the western part of India
Importer 1, market leader with 25% marketshare
Importer 2 Tools has a market share of 11%
82
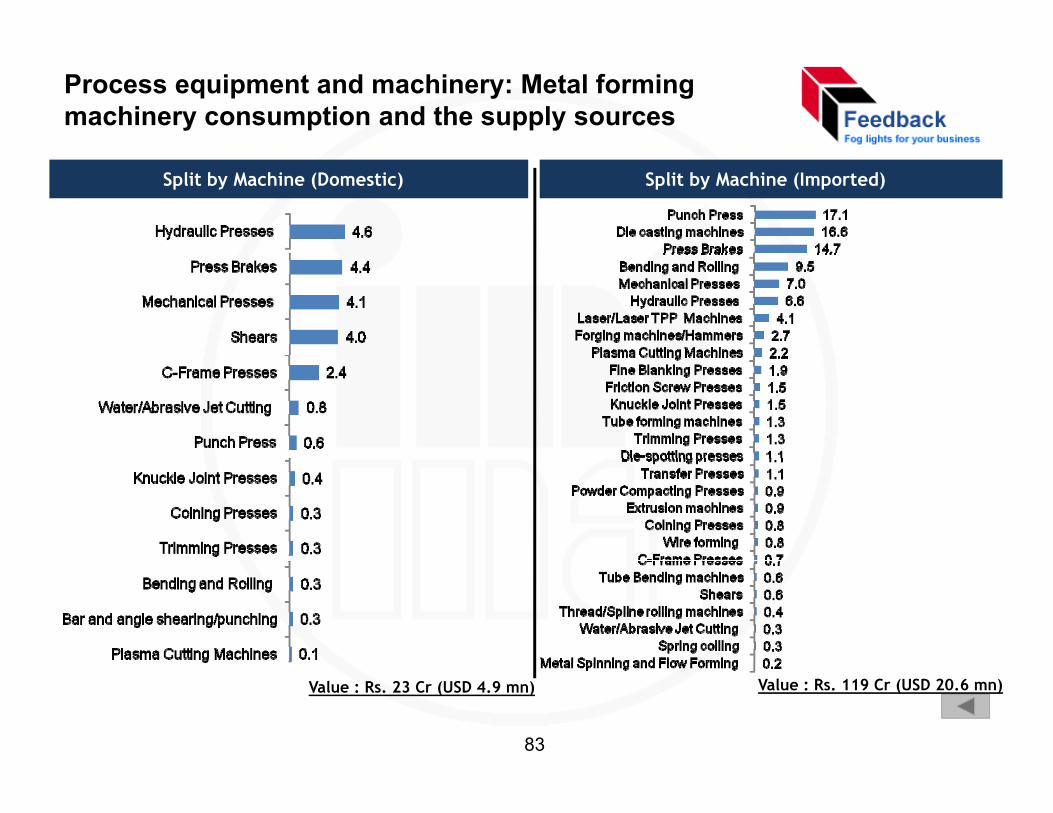
Process equipment and machinery: Metal forming machinery consumption and the supply sources
Split by Machine (Domestic) Split by Machine (Imported)
Value : Rs. 23 Cr (USD 4.9 mn) Value : Rs. 119 Cr (USD 20.6 mn)
83
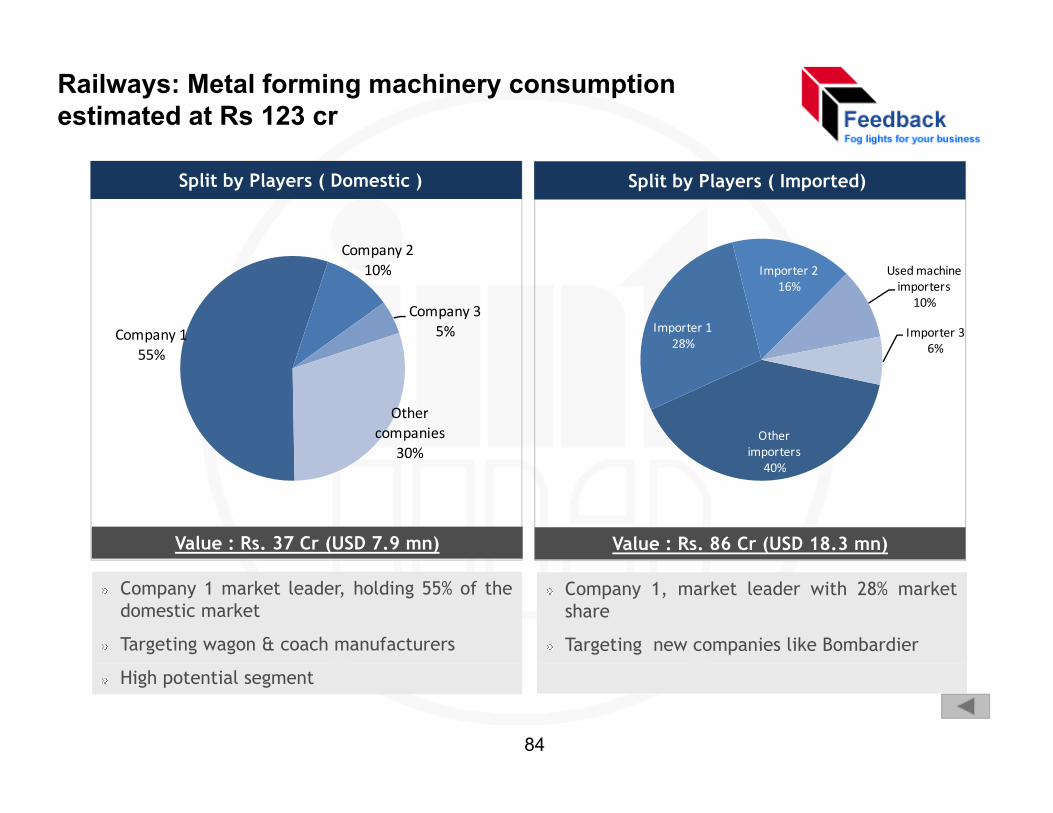
Railways: Metal forming machinery consumption estimated at Rs 123 cr
Company 2
Split by Players ( Domestic ) Split by Players ( Imported)
Importer 128%
Importer 216%
Used machine importers
10%
Importer 36%
Company 155%
Company 210%
Company 35%
Other importers
55%
Other companies
30% p40%
30%
Value : Rs. 37 Cr (USD 7.9 mn) Value : Rs. 86 Cr (USD 18.3 mn)
Company 1 market leader, holding 55% of thedomestic market
Targeting wagon & coach manufacturers
Company 1, market leader with 28% marketshare
Targeting new companies like Bombardier
High potential segment
84
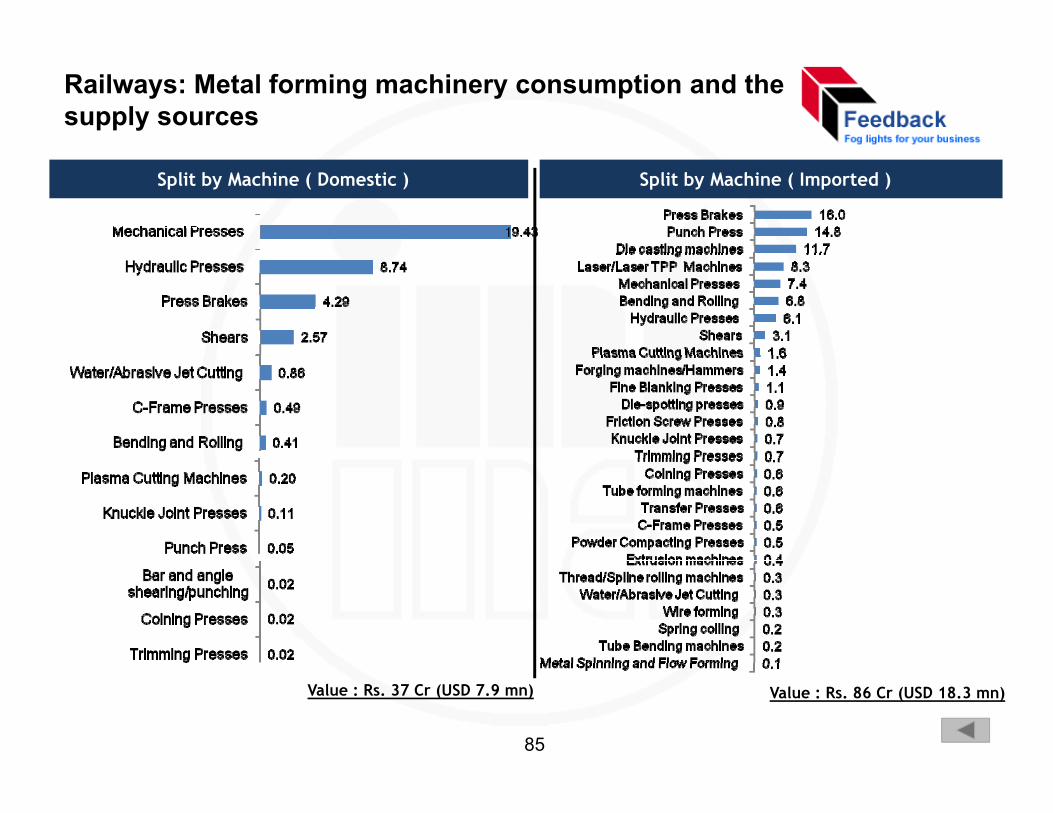
Railways: Metal forming machinery consumption and the supply sources
Split by Machine ( Domestic ) Split by Machine ( Imported )
Value : Rs. 37 Cr (USD 7.9 mn) Value : Rs. 86 Cr (USD 18.3 mn)
85
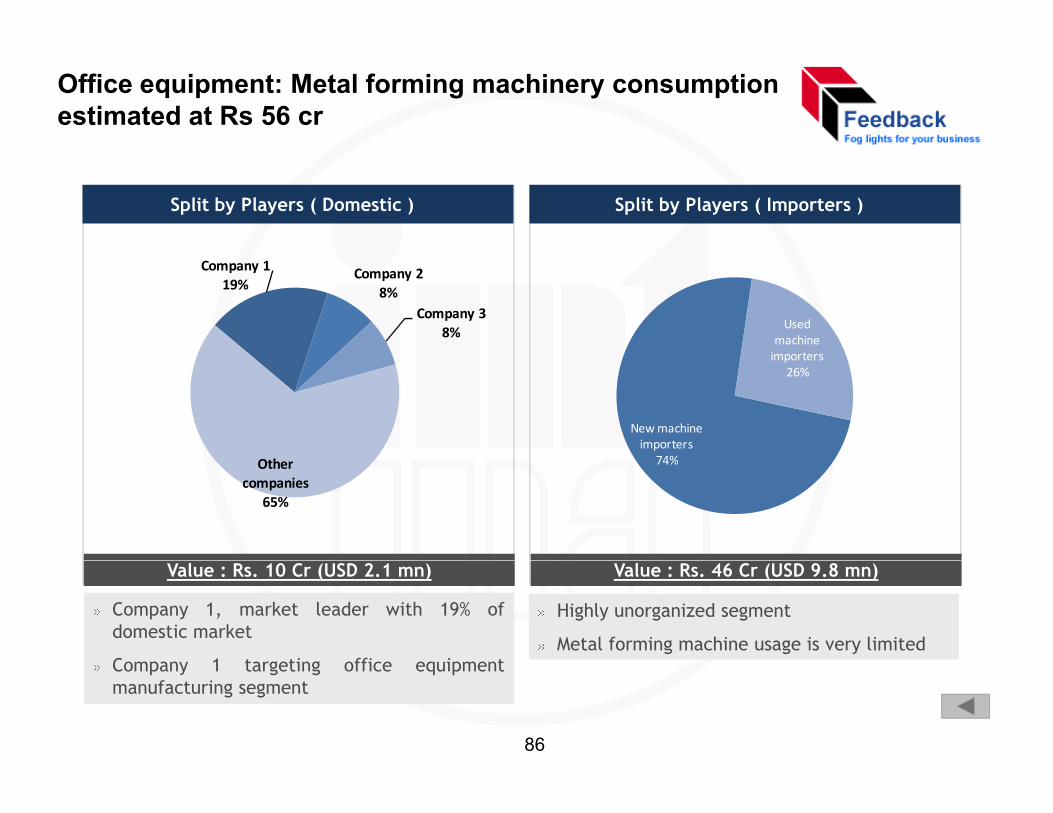
Office equipment: Metal forming machinery consumption estimated at Rs 56 cr
Split by Players ( Domestic ) Split by Players ( Importers )
Used machine importers
Company 119%
Company 28%
Company 38%
New machine importers
74%
importers26%
74%Other companies
65%
Value : Rs. 10 Cr (USD 2.1 mn)
Company 1, market leader with 19% ofdomestic market
Company 1 targeting office equipment
Highly unorganized segment
Metal forming machine usage is very limited
Value : Rs. 46 Cr (USD 9.8 mn)
Company 1 targeting office equipmentmanufacturing segment
86
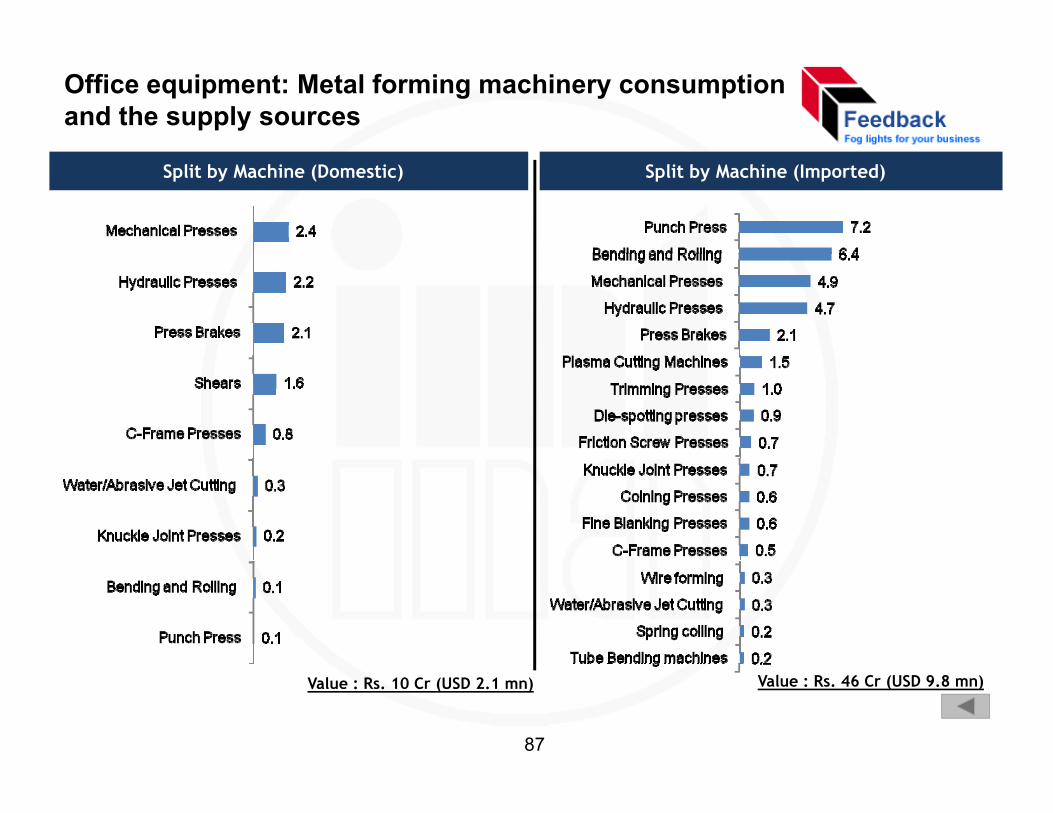
Office equipment: Metal forming machinery consumption and the supply sources
Split by Machine (Domestic) Split by Machine (Imported)
Value : Rs. 10 Cr (USD 2.1 mn) Value : Rs. 46 Cr (USD 9.8 mn)
87
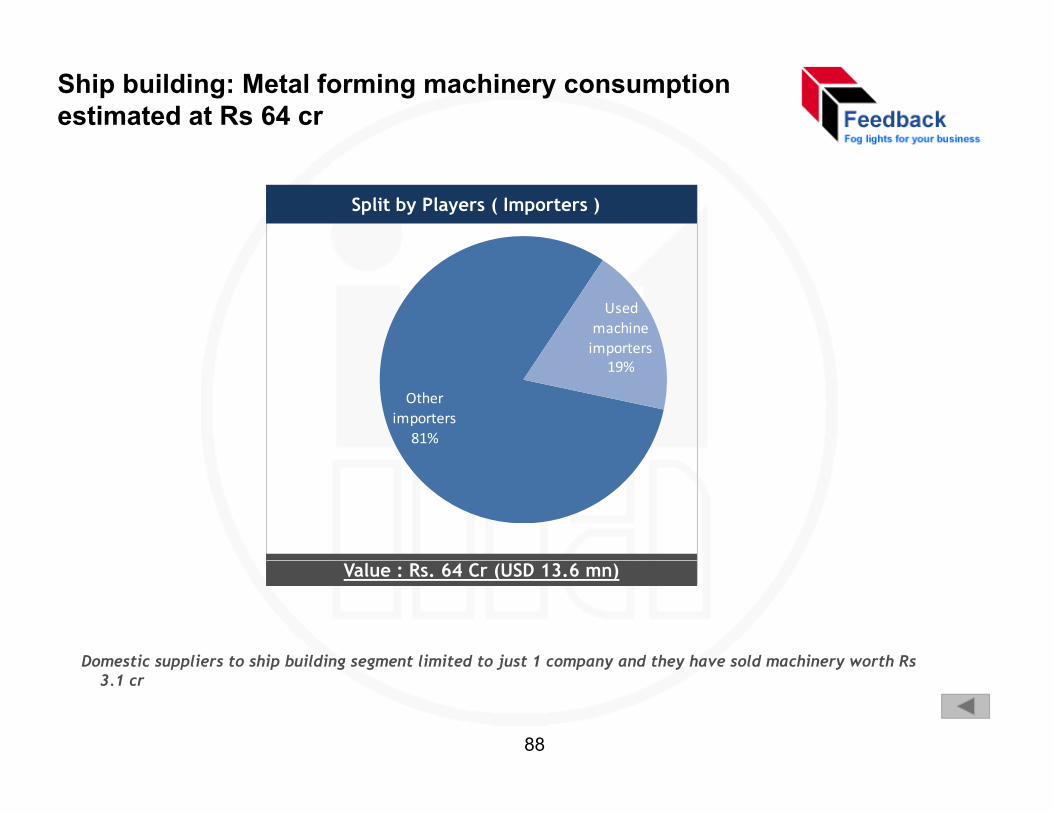
Ship building: Metal forming machinery consumption estimated at Rs 64 cr
Split by Players ( Importers )
Used machine importers
Other importers
81%
p19%
Value : Rs. 64 Cr (USD 13.6 mn)
Domestic suppliers to ship building segment limited to just 1 company and they have sold machinery worth Rs Domestic suppliers to ship building segment limited to just 1 company and they have sold machinery worth Rs 3.1 cr
88
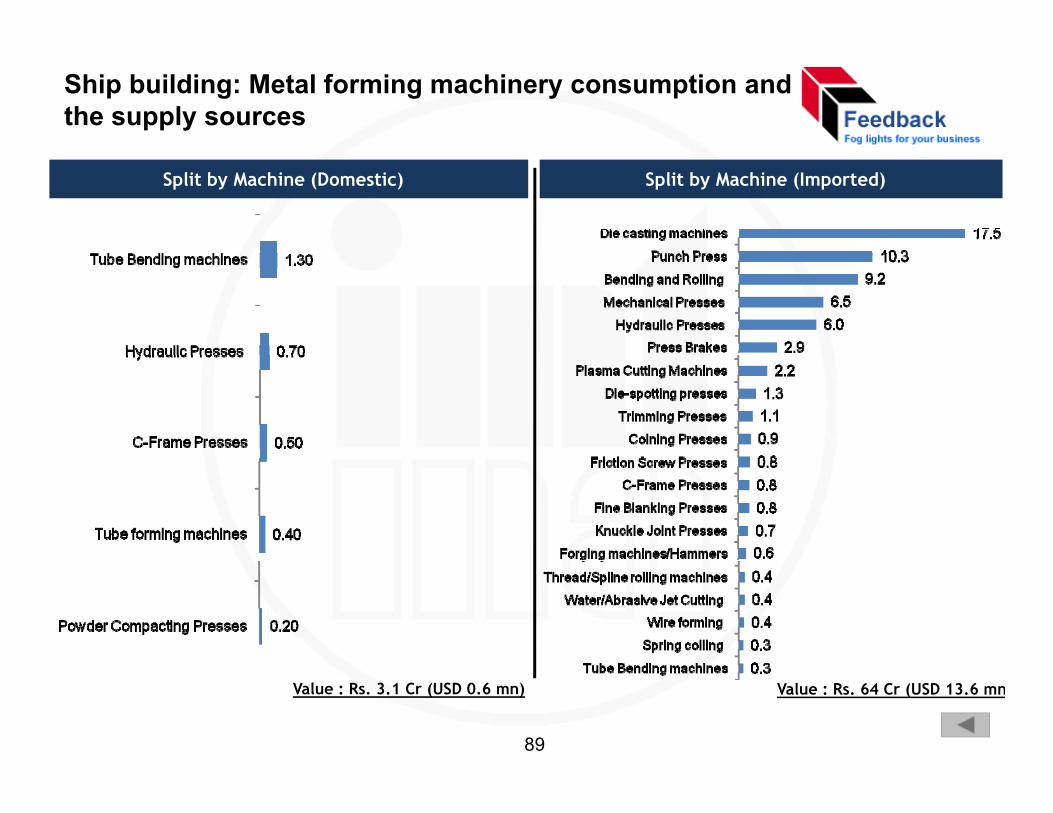
Ship building: Metal forming machinery consumption and the supply sources
Split by Machine (Domestic) Split by Machine (Imported)
Value : Rs. 3.1 Cr (USD 0.6 mn) Value : Rs. 64 Cr (USD 13.6 mn
89
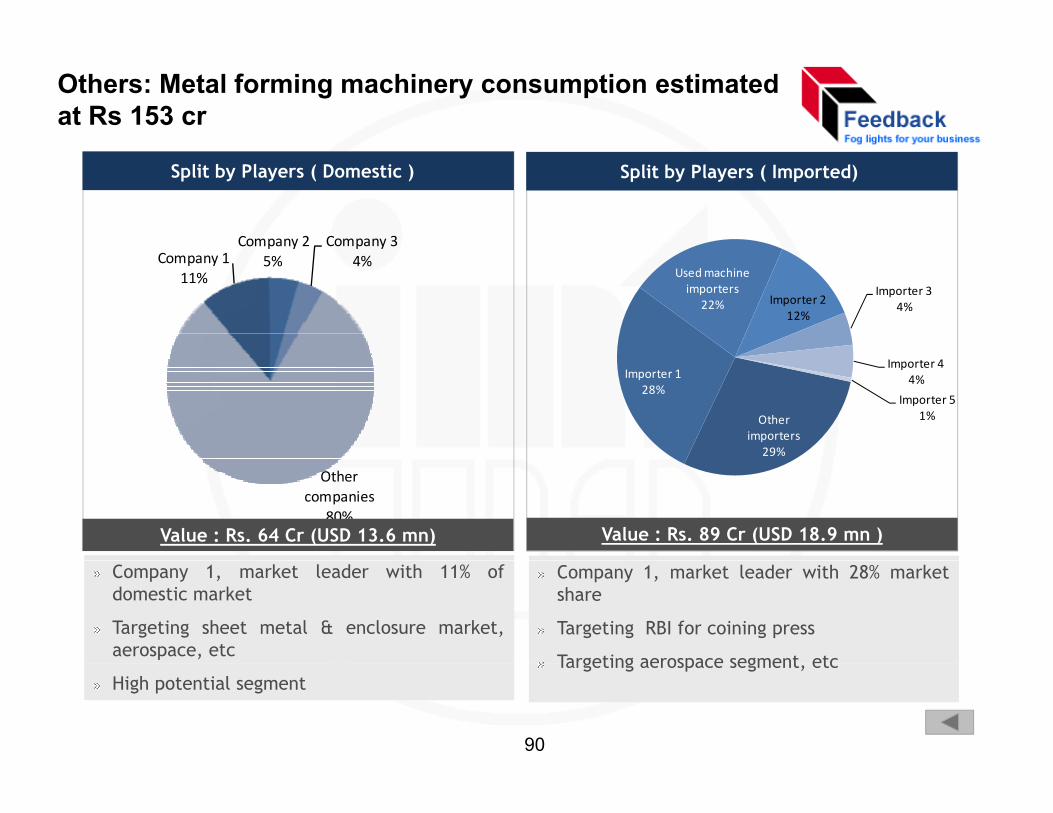
Others: Metal forming machinery consumption estimated at Rs 153 cr
C 1Company 2 Company 3
Split by Players ( Domestic ) Split by Players ( Imported)
Used machine importers
22% Importer 212%
Importer 34%
Company 111%
5% 4%
Other importers
29%
Importer 128%
Importer 44%
Importer 51%
Other companies
80%Value : Rs. 89 Cr (USD 18.9 mn ) Value : Rs. 64 Cr (USD 13.6 mn)
Company 1, market leader with 11% ofdomestic market
Targeting sheet metal & enclosure market,aerospace, etc
Company 1, market leader with 28% marketshare
Targeting RBI for coining press
Targeting aerospace segment etcHigh potential segment
Targeting aerospace segment, etc
90
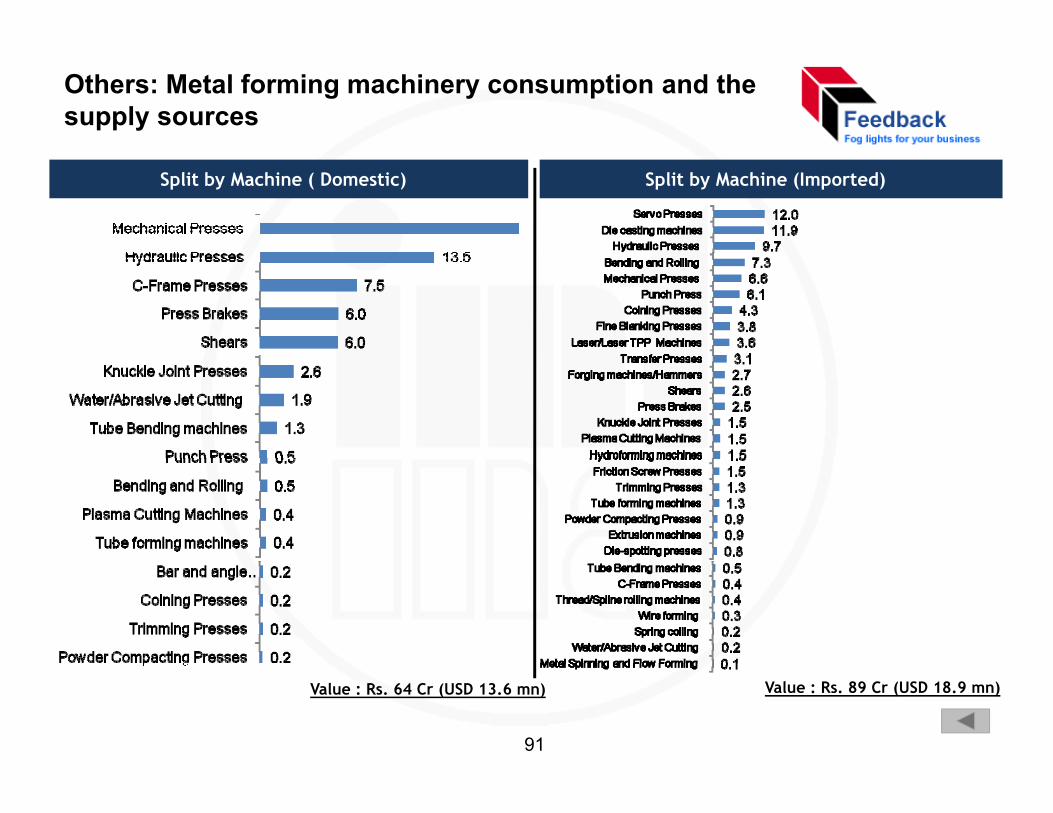
Others: Metal forming machinery consumption and the supply sources
Split by Machine ( Domestic) Split by Machine (Imported)
Value : Rs. 89 Cr (USD 18.9 mn)Value : Rs. 64 Cr (USD 13.6 mn)
91
Metal forming machinery –F t 2008 2015Forecast 2008 - 2015• Approach and Methodology
• Historical trends
• Forecasts by– Segments
– Type of machinery
S t d t f hi– Segments and type of machinery
92
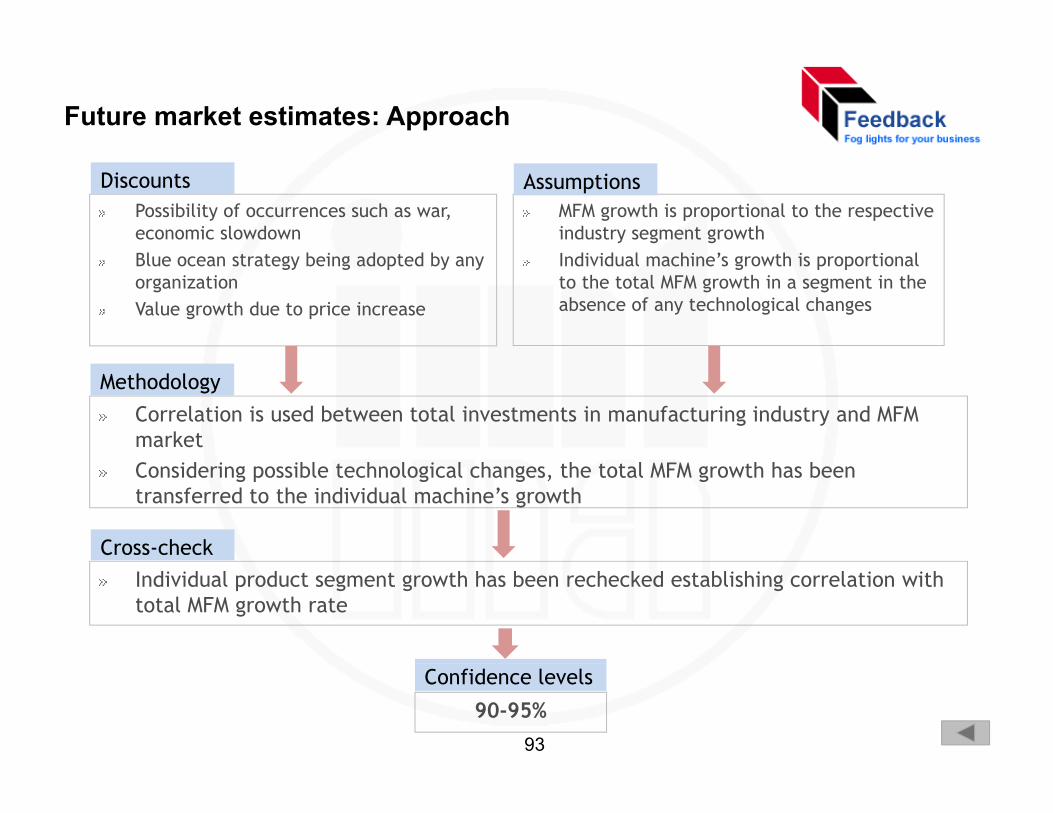
Future market estimates: Approach
MFM growth is proportional to the respective industry segment growthI di id l hi ’ h i i l
Possibility of occurrences such as war, economic slowdown Bl b i d d b
Discounts Assumptions
Individual machine’s growth is proportional to the total MFM growth in a segment in the absence of any technological changes
Blue ocean strategy being adopted by any organization Value growth due to price increase
Correlation is used between total investments in manufacturing industry and MFM market
Methodology
Considering possible technological changes, the total MFM growth has been transferred to the individual machine’s growth
Cross-checkIndividual product segment growth has been rechecked establishing correlation with total MFM growth rate
90-95%
Confidence levels
93
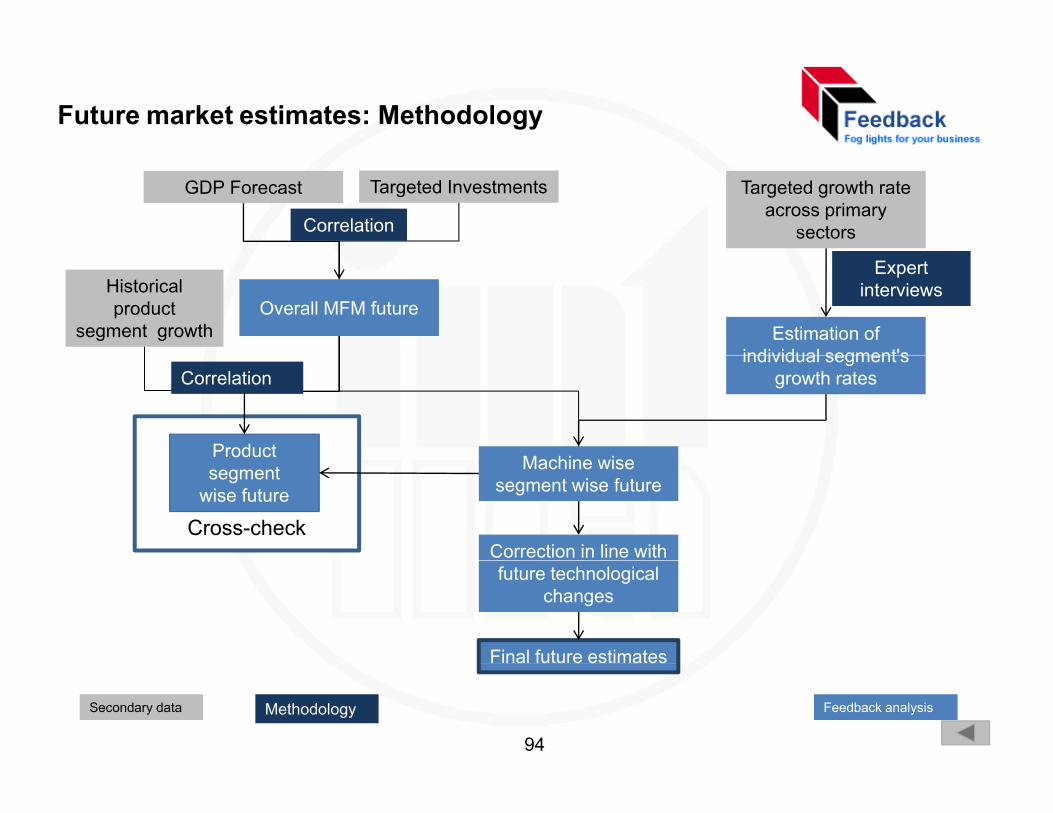
Future market estimates: Methodology
GDP Forecast Targeted Investments Targeted growth rate across primary
sectorsCorrelation
Overall MFM futureEstimation of
individual segment's
Historical product
segment growth
Expert interviews
individual segment s growth rates
M hi iProduct
Correlation
Machine wise segment wise future
Correction in line with
segment wise future
Cross-check
future technological changes
Final future estimatesa u u e es a es
Secondary data Feedback analysisMethodology
94
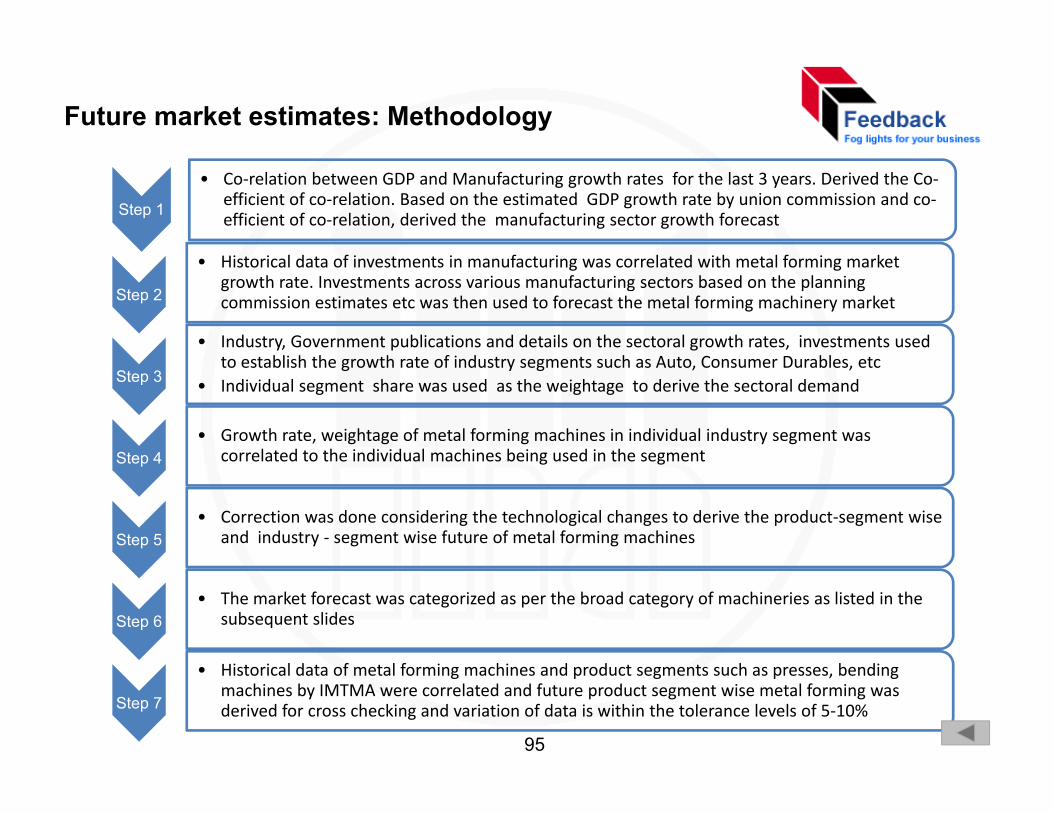
Future market estimates: Methodology
Step 1
• Co‐relation between GDP and Manufacturing growth rates for the last 3 years. Derived the Co‐efficient of co‐relation. Based on the estimated GDP growth rate by union commission and co‐efficient of co‐relation, derived the manufacturing sector growth forecast
Step 2
• Historical data of investments in manufacturing was correlated with metal forming market growth rate. Investments across various manufacturing sectors based on the planning commission estimates etc was then used to forecast the metal forming machinery market
• Industry, Government publications and details on the sectoral growth rates, investments used bl h h h f d h bl
Step 3to establish the growth rate of industry segments such as Auto, Consumer Durables, etc
• Individual segment share was used as the weightage to derive the sectoral demand
Step 4• Growth rate, weightage of metal forming machines in individual industry segment was
correlated to the individual machines being used in the segmentStep 4 correlated to the individual machines being used in the segment
Step 5• Correction was done considering the technological changes to derive the product‐segment wise
and industry ‐ segment wise future of metal forming machines
Step 6• The market forecast was categorized as per the broad category of machineries as listed in the
subsequent slides
l d f l f h d d h b d
Step 7
• Historical data of metal forming machines and product segments such as presses, bending machines by IMTMA were correlated and future product segment wise metal forming was derived for cross checking and variation of data is within the tolerance levels of 5‐10%
95
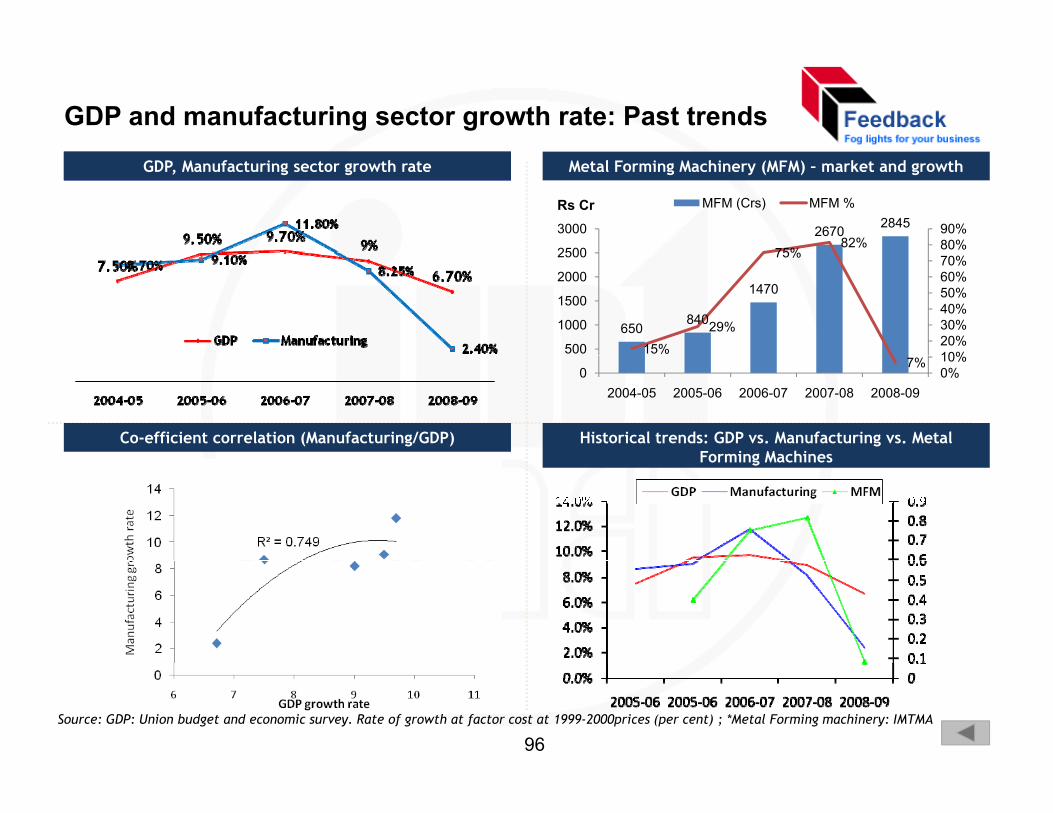
GDP and manufacturing sector growth rate: Past trends
GDP growth rateGDP, Manufacturing sector growth rate Metal Forming Machinery (MFM) – market and growth
2670 2845
75%82% 80%
90%
2500
3000
MFM (Crs) MFM %Rs Cr
650840
1470
15%
29%
75%
10%20%30%40%50%60%70%
500
1000
1500
2000
2500
Co-efficient correlation (Manufacturing/GDP) Historical trends: GDP vs. Manufacturing vs. Metal Forming Machines
7%0%10%
02004-05 2005-06 2006-07 2007-08 2008-09
Forming Machines
Source: GDP: Union budget and economic survey. Rate of growth at factor cost at 1999-2000prices (per cent) ; *Metal Forming machinery: IMTMA
96

Investments in manufacturing sector and metal forming machines growth rate: Past trends & future
FDI/ Total Investments in manufacturing
82.8100
FDI ( $b) Investments ($ b)
Future – GDP vs. Manufacturing industry growth rate unit?)
6 05 7.7219.5 24.5 27.3
20.027.9
60.374.2
82.8
20
40
60
80
Co-efficient correlation (MFM/Investments) Future – MFM vs investments in Rs cr
6.05 7.72
02004-05 2005-06 2006-07 2007-08 2008-09
Co-efficient correlation (MFM/Investments) Future MFM vs. investments in Rs cr
R² = 0.9568
0 40
0.50
0.60
0.70
54546965
893024% 26% 28%
28%
20%25%30%
8000
10000
MFM (Crs) Investments (%)
0 00
0.10
0.20
0.30
0.40
3016 34964329
5454
6%
16%
0%5%10%15%20%
0
2000
4000
6000
Source: Investment: FBI, Investment commission
0.000.0 20.0 40.0 60.0 80.0 100.0
97
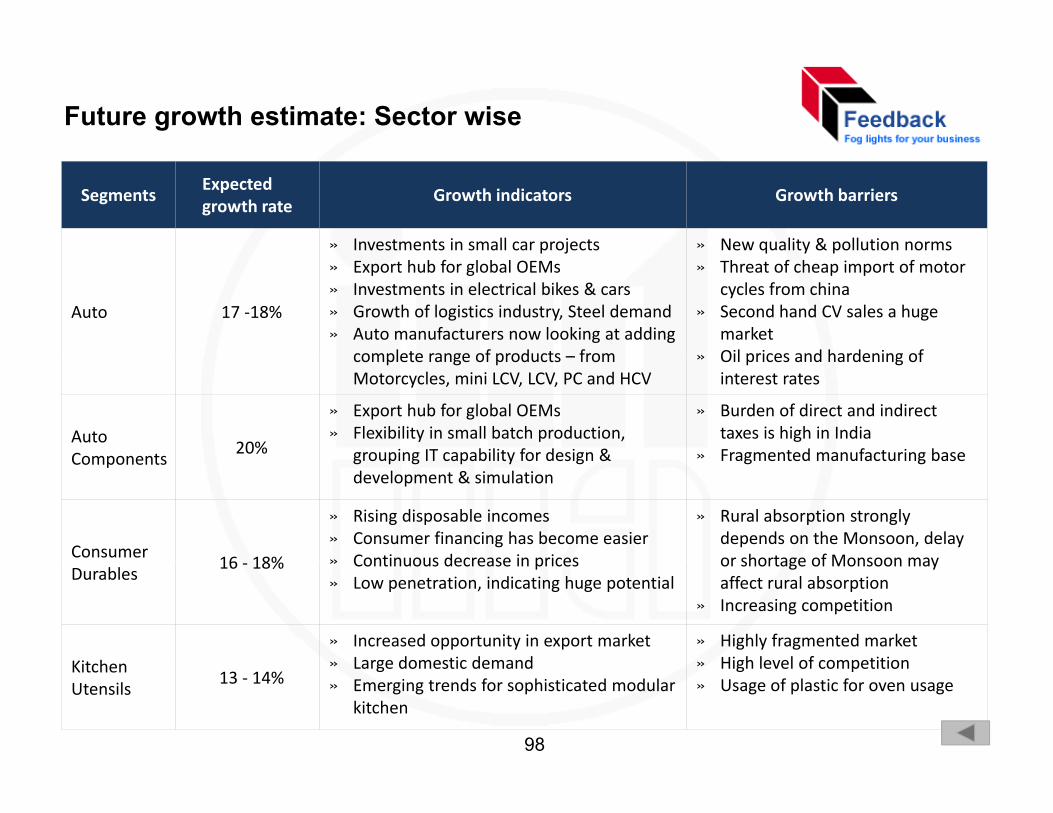
Future growth estimate: Sector wise
SegmentsExpected growth rate
Growth indicators Growth barriers
» Investments in small car projects » New quality & pollution norms
Auto 17 ‐18%
p j» Export hub for global OEMs» Investments in electrical bikes & cars » Growth of logistics industry, Steel demand» Auto manufacturers now looking at adding
complete range of products from
q y p» Threat of cheap import of motor
cycles from china » Second hand CV sales a huge
market» Oil prices and hardening ofcomplete range of products – from
Motorcycles, mini LCV, LCV, PC and HCV» Oil prices and hardening of
interest rates
Auto Components
20%
» Export hub for global OEMs» Flexibility in small batch production,
grouping IT capability for design &
» Burden of direct and indirect taxes is high in India
» Fragmented manufacturing baseComponents grouping IT capability for design & development & simulation
» Fragmented manufacturing base
Consumer 16 18%
» Rising disposable incomes» Consumer financing has become easier » Continuous decrease in prices
» Rural absorption strongly depends on the Monsoon, delay or shortage of Monsoon may
Durables16 ‐ 18% » Continuous decrease in prices
» Low penetration, indicating huge potential or shortage of Monsoon may affect rural absorption
» Increasing competition
Kit h» Increased opportunity in export market » Large domestic demand
» Highly fragmented market » High level of competitionKitchen
Utensils13 ‐ 14%
» Large domestic demand » Emerging trends for sophisticated modular
kitchen
» High level of competition » Usage of plastic for oven usage
98
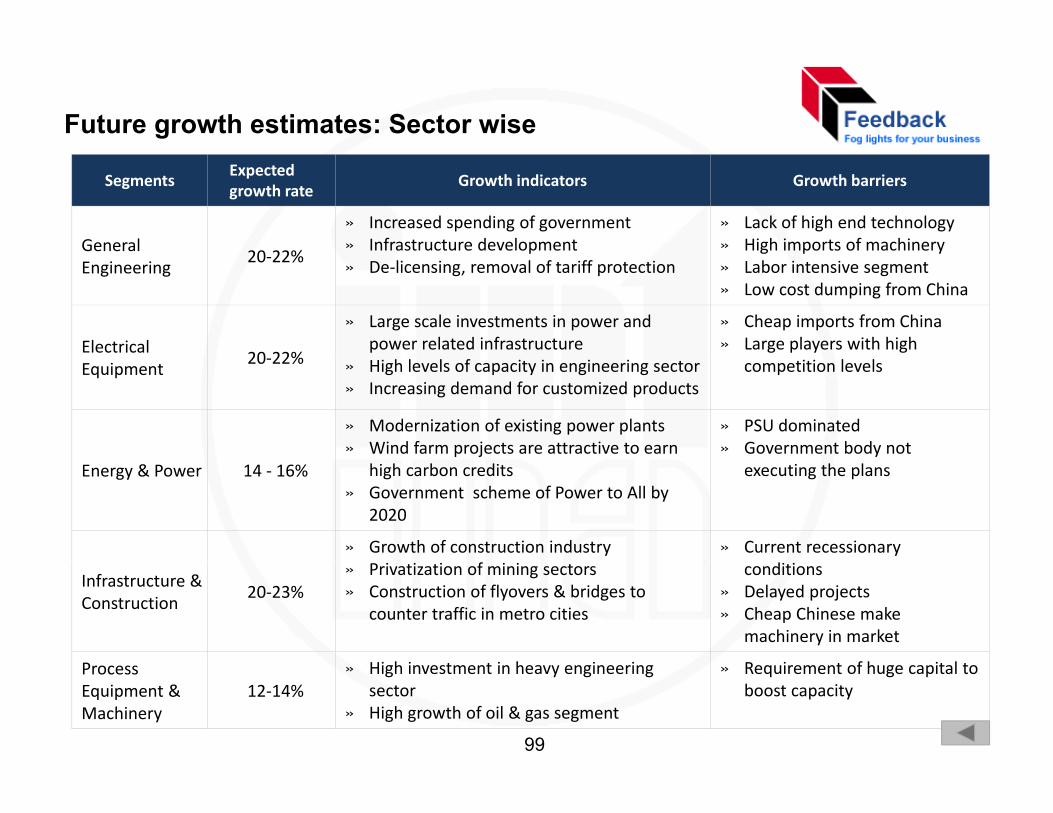
Future growth estimates: Sector wise
SegmentsExpected growth rate
Growth indicators Growth barriers
General 20 22%
» Increased spending of government » Infrastructure development
» Lack of high end technology » High imports of machinery
Engineering20‐22%
p» De‐licensing, removal of tariff protection
g p y» Labor intensive segment » Low cost dumping from China
Electrical 20 22%
» Large scale investments in power and power related infrastructure
» Cheap imports from China » Large players with high
Equipment20‐22% » High levels of capacity in engineering sector
» Increasing demand for customized products competition levels
» Modernization of existing power plants » Wind farm projects are attractive to earn
» PSU dominated » Government body not
Energy & Power 14 ‐ 16% high carbon credits » Government scheme of Power to All by
2020
executing the plans
» Growth of construction industry » Current recessionary
Infrastructure & Construction
20‐23%» Privatization of mining sectors » Construction of flyovers & bridges to
counter traffic in metro cities
conditions» Delayed projects » Cheap Chinese make
machinery in market
P Hi h i t t i h i i R i t f h it l tProcess Equipment & Machinery
12‐14%» High investment in heavy engineering
sector » High growth of oil & gas segment
» Requirement of huge capital to boost capacity
99
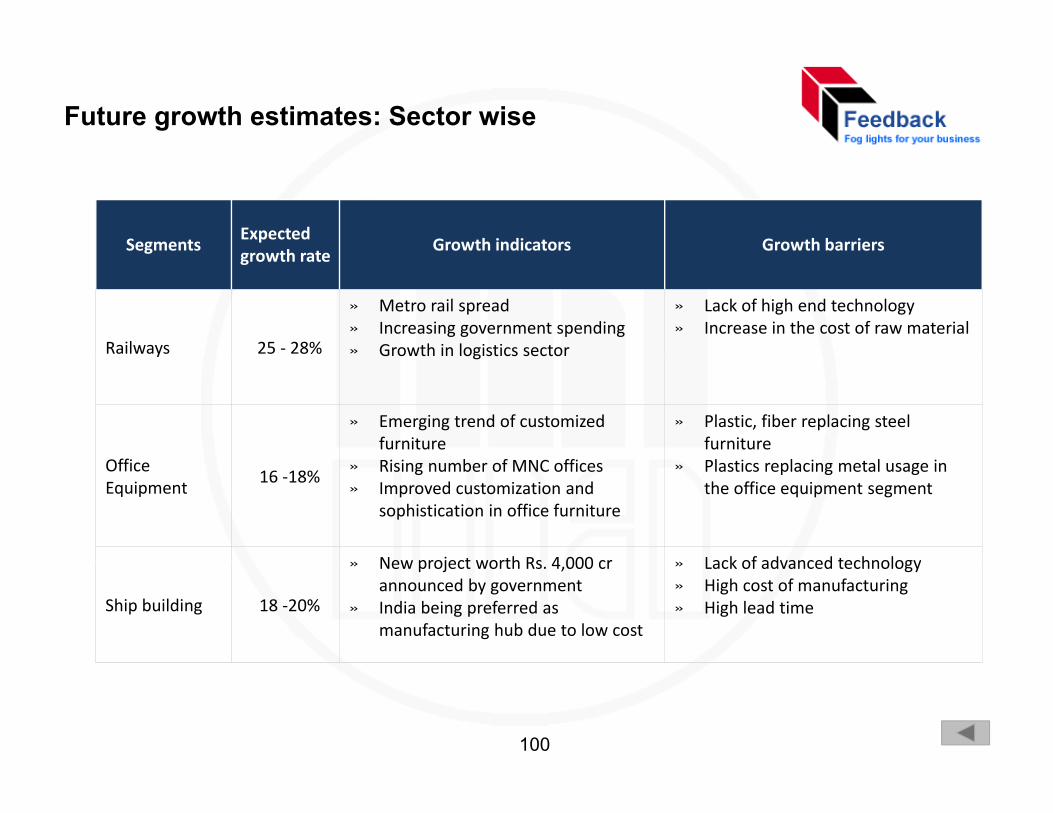
Future growth estimates: Sector wise
SegmentsExpected growth rate
Growth indicators Growth barriersggrowth rate
Railways 25 ‐ 28%
» Metro rail spread » Increasing government spending» Growth in logistics sector
» Lack of high end technology » Increase in the cost of raw material
y Growth in logistics sector
» Emerging trend of customized furniture
» Plastic, fiber replacing steel furniture
Office Equipment
16 ‐18% » Rising number of MNC offices » Improved customization and
sophistication in office furniture
» Plastics replacing metal usage in the office equipment segment
New project worth Rs 4 000 cr Lack of advanced technology
Ship building 18 ‐20%
» New project worth Rs. 4,000 cr announced by government
» India being preferred as manufacturing hub due to low cost
» Lack of advanced technology» High cost of manufacturing » High lead time
100
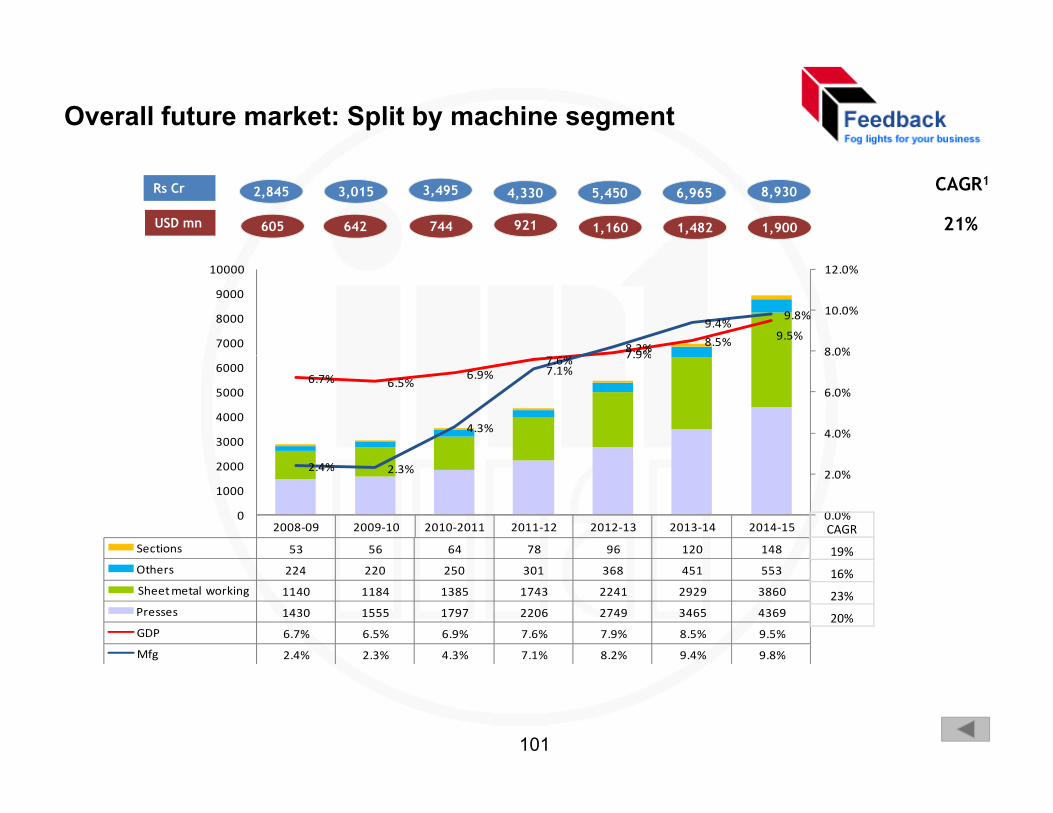
Overall future market: Split by machine segment
Rs Cr CAGR1
21%
3,015 3,495 4,330 5,450 6,9652,845 8,930
USD mn 744 921 1,160 1,482 1,900605 642
7 9%8.5% 9.5%
8.2%
9.4%9.8%
8.0%
10.0%
12.0%
7000
8000
9000
10000
6.7% 6.5%6.9%
7.6% 7.9%
4.3%
7.1%
4.0%
6.0%
8.0%
3000
4000
5000
6000
2008‐09 2009‐10 2010‐2011 2011‐12 2012‐13 2013‐14 2014‐15
Sections 53 56 64 78 96 120 148
2.4% 2.3%
0.0%
2.0%
0
1000
2000
CAGR
19%Others 224 220 250 301 368 451 553
Sheet metal working 1140 1184 1385 1743 2241 2929 3860
Presses 1430 1555 1797 2206 2749 3465 4369
GDP 6.7% 6.5% 6.9% 7.6% 7.9% 8.5% 9.5%
Mfg 2.4% 2.3% 4.3% 7.1% 8.2% 9.4% 9.8%
16%
23%
20%
101
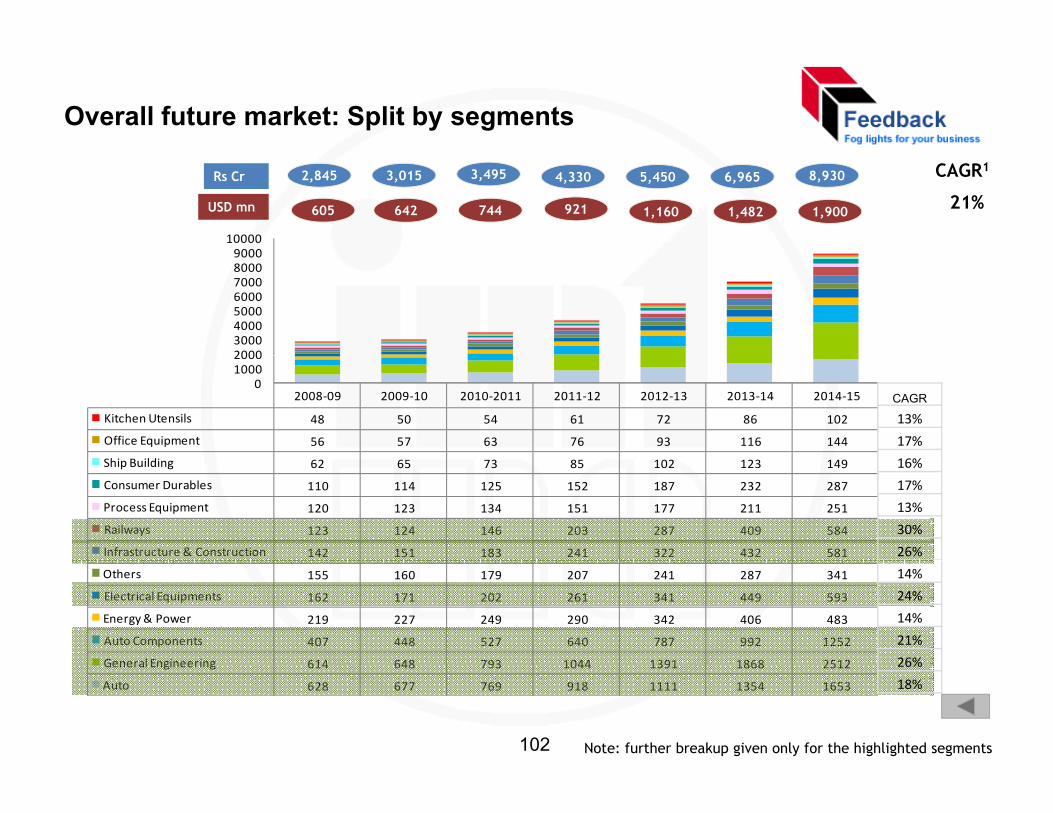
Overall future market: Split by segments
900010000
3,015 3,495 4,330 5,450 6,965 CAGR1
21%2,845 8,930Rs Cr
USD mn 744 921 1,160 1,482 1,900605 642
20003000400050006000700080009000
2008‐09 2009‐10 2010‐2011 2011‐12 2012‐13 2013‐14 2014‐15
Kitchen Utensils 48 50 54 61 72 86 102
Office Equipment 56 57 63 76 93 116 144
010002000
CAGR
13%
17%
Ship Building 62 65 73 85 102 123 149
Consumer Durables 110 114 125 152 187 232 287
Process Equipment 120 123 134 151 177 211 251
Railways 123 124 146 203 287 409 584
Infrastructure & Construction 142 151 183 241 322 432 581
16%
17%
13%
30%
26%
Others 155 160 179 207 241 287 341
Electrical Equipments 162 171 202 261 341 449 593
Energy & Power 219 227 249 290 342 406 483
Auto Components 407 448 527 640 787 992 1252
General Engineering 614 648 793 1044 1391 1868 2512
14%
24%
14%
21%
26%General Engineering 614 648 793 1044 1391 1868 2512
Auto 628 677 769 918 1111 1354 1653
26%
18%
Note: further breakup given only for the highlighted segments102
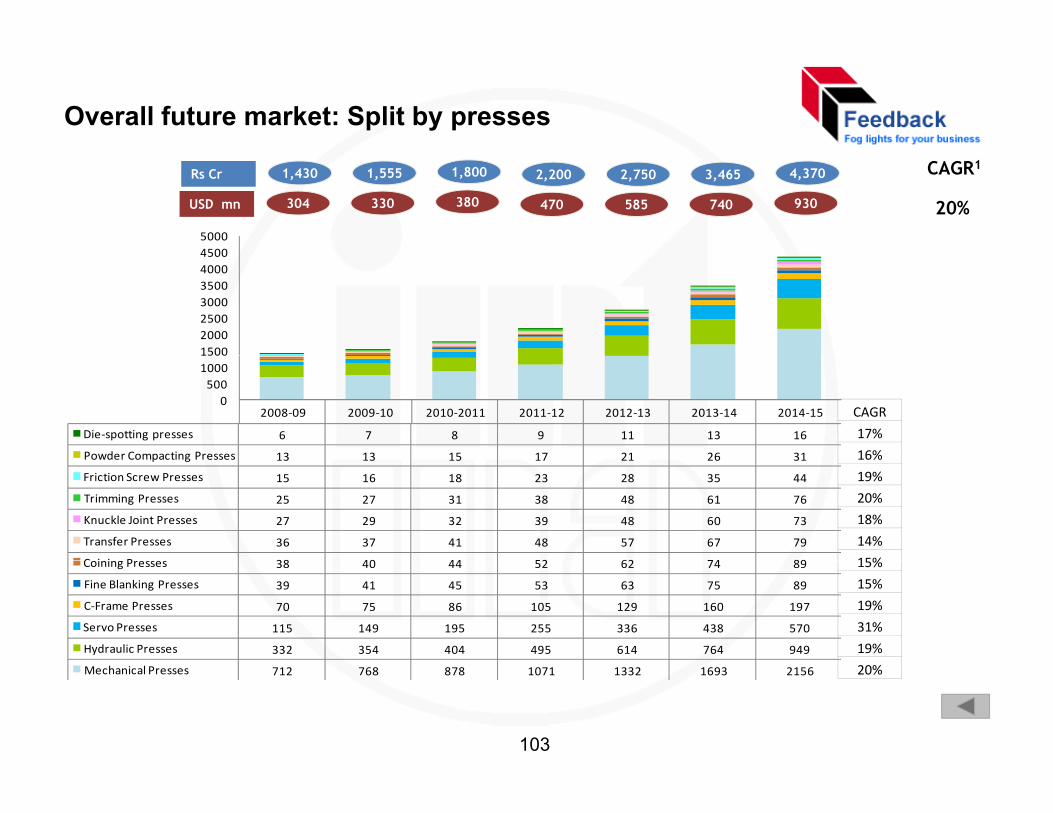
Overall future market: Split by presses
45005000
1,555 1,800 2,200 2,750 3,465 CAGR1
20%
1,430 4,370Rs Cr
330 380 470 585 740304 930USD mn
1500200025003000350040004500
2008‐09 2009‐10 2010‐2011 2011‐12 2012‐13 2013‐14 2014‐15
Die‐spotting presses 6 7 8 9 11 13 16
Powder Compacting Presses 13 13 15 17 21 26 31
050010001500
CAGR
17%
16%Powder Compacting Presses 13 13 15 17 21 26 31
Friction Screw Presses 15 16 18 23 28 35 44
Trimming Presses 25 27 31 38 48 61 76
Knuckle Joint Presses 27 29 32 39 48 60 73
Transfer Presses 36 37 41 48 57 67 79
C i i P 38 40 44 52 62 74 89
16%
19%
20%
18%
14%
15%Coining Presses 38 40 44 52 62 74 89
Fine Blanking Presses 39 41 45 53 63 75 89
C‐Frame Presses 70 75 86 105 129 160 197
Servo Presses 115 149 195 255 336 438 570
Hydraulic Presses 332 354 404 495 614 764 949
15%
15%
19%
31%
19%
Mechanical Presses 712 768 878 1071 1332 1693 2156 20%
103
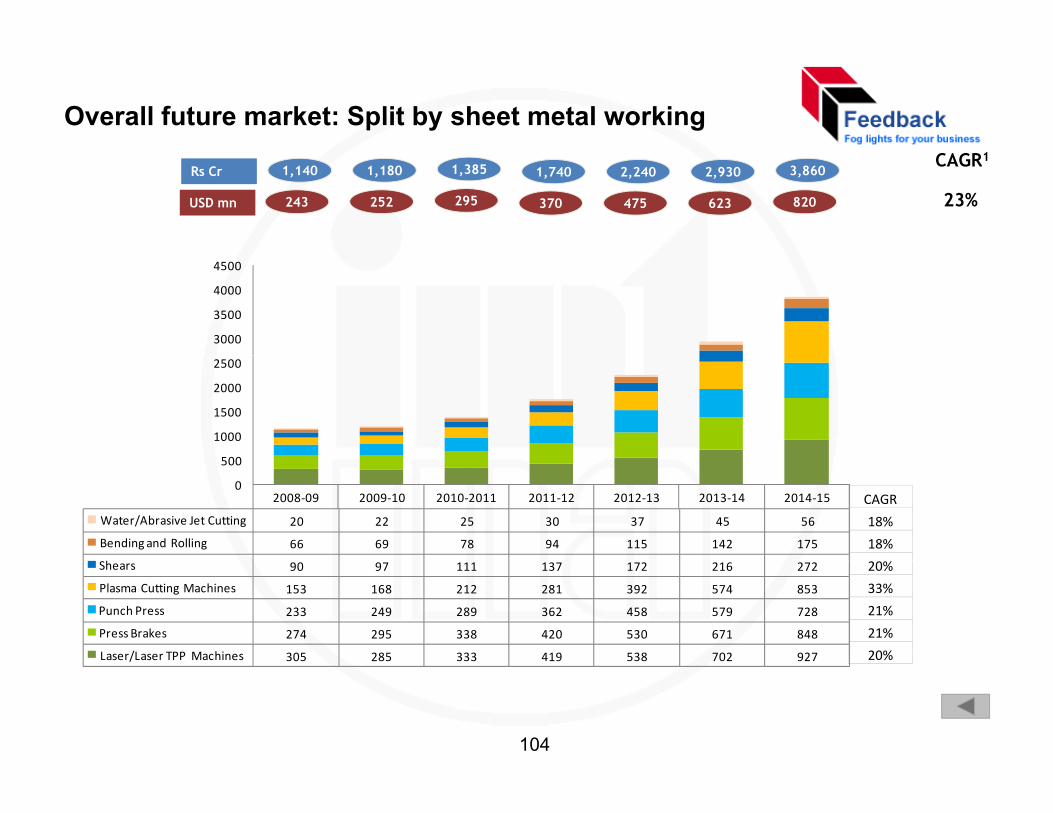
Overall future market: Split by sheet metal working
1,180 1,385 1,740 2,240 2,930CAGR1
23%
1,140 3,860Rs Cr
252 295 370 475 623243 820USD mn
3000
3500
4000
4500
500
1000
1500
2000
2500
2008‐09 2009‐10 2010‐2011 2011‐12 2012‐13 2013‐14 2014‐15
Water/Abrasive Jet Cutting 20 22 25 30 37 45 56
Bending and Rolling 66 69 78 94 115 142 175
0
500
CAGR
18%
18%
Shears 90 97 111 137 172 216 272
Plasma Cutting Machines 153 168 212 281 392 574 853
Punch Press 233 249 289 362 458 579 728
Press Brakes 274 295 338 420 530 671 848
Laser/Laser TPP Machines 305 285 333 419 538 702 927
20%
33%
21%
21%
20%
104
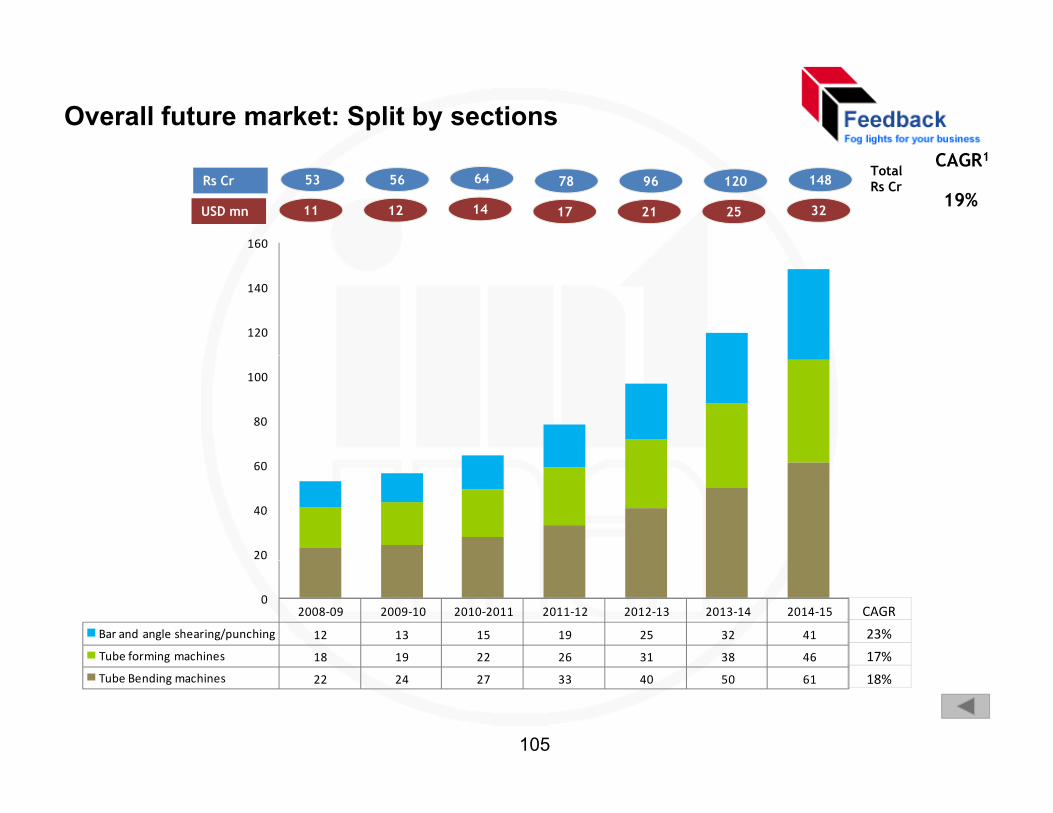
Overall future market: Split by sections
160
56 64 78 96 120Total Rs Cr
CAGR1
19%53 148Rs Cr
12 14 17 21 2511 32USD mn
120
140
80
100
20
40
60
2008‐09 2009‐10 2010‐2011 2011‐12 2012‐13 2013‐14 2014‐15
Bar and angle shearing/punching 12 13 15 19 25 32 41
Tube forming machines 18 19 22 26 31 38 46
0CAGR
23%
17%
Tube Bending machines 22 24 27 33 40 50 61 18%
105
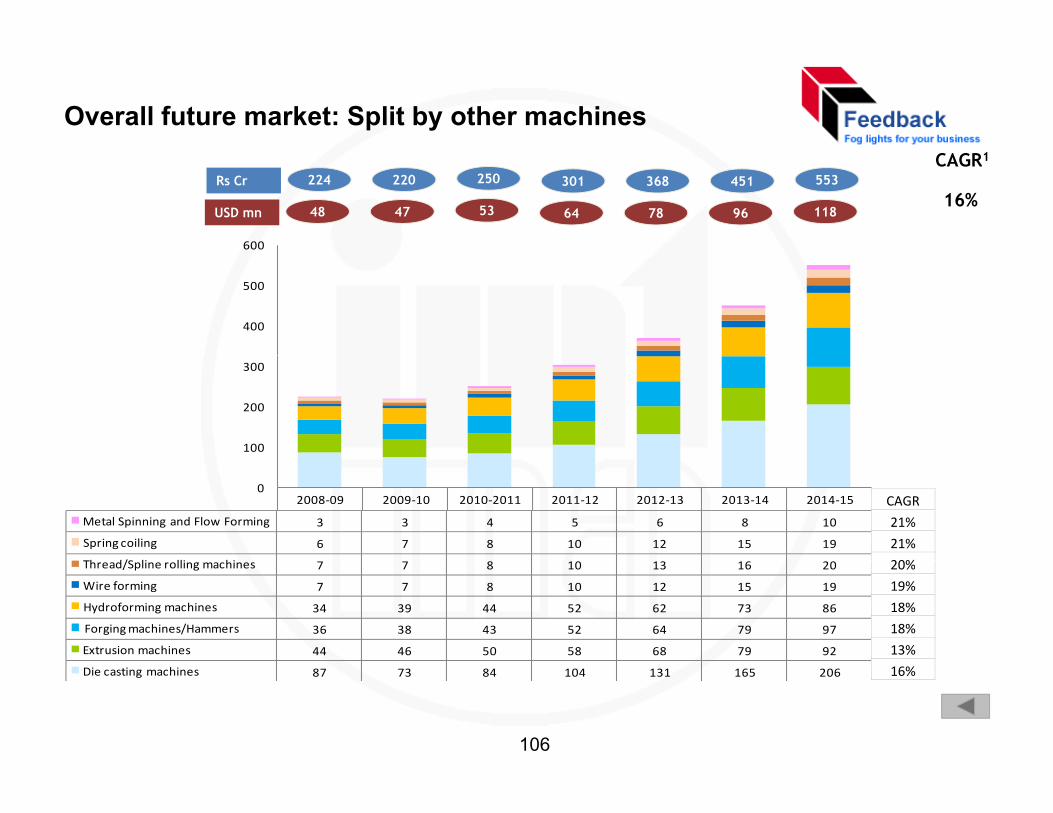
Overall future market: Split by other machines
600
220 250 301 368 451CAGR1
16%224 553Rs Cr
47 53 64 78 9648 118USD mn
400
500
100
200
300
2008‐09 2009‐10 2010‐2011 2011‐12 2012‐13 2013‐14 2014‐15
Metal Spinning and Flow Forming 3 3 4 5 6 8 10
Spring coiling 6 7 8 10 12 15 19
Th d/S li lli hi
0CAGR
21%
21%
20%Thread/Spline rolling machines 7 7 8 10 13 16 20
Wire forming 7 7 8 10 12 15 19
Hydroforming machines 34 39 44 52 62 73 86
Forging machines/Hammers 36 38 43 52 64 79 97
Extrusion machines 44 46 50 58 68 79 92
20%
19%
18%
18%
13%
Die casting machines 87 73 84 104 131 165 206 16%
106
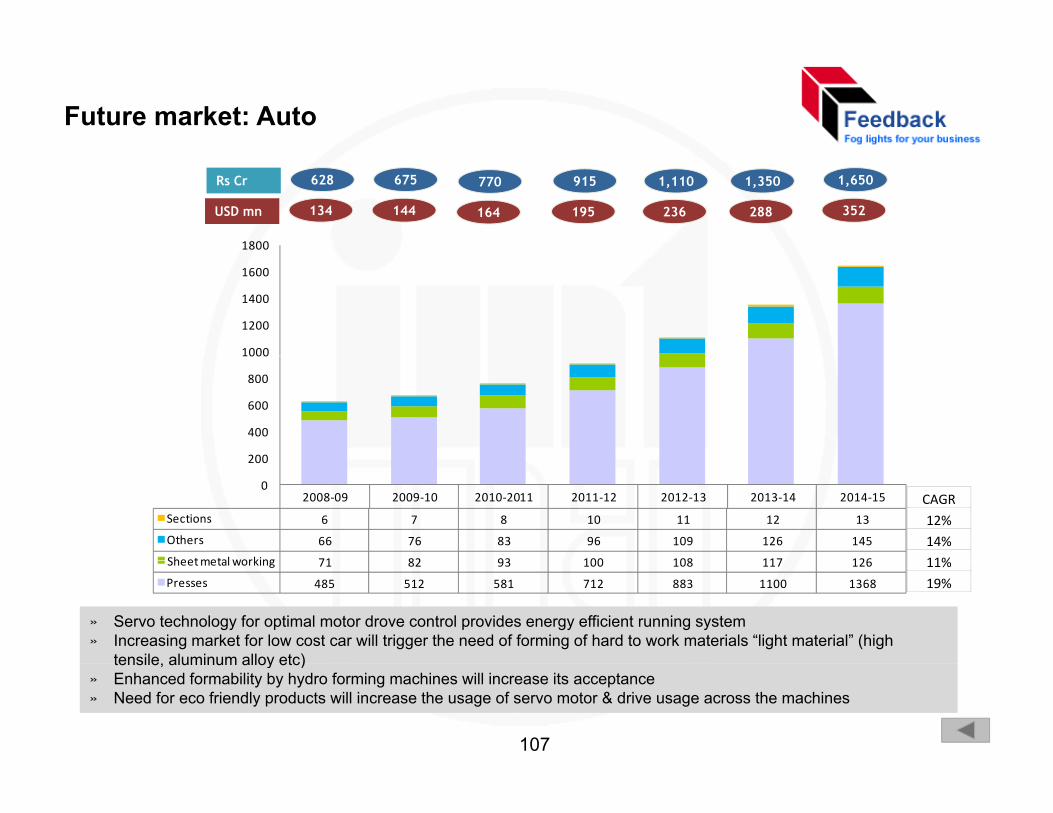
Future market: Auto
1800
675 770 915 1,110 1,350628 1,650Rs Cr
144 164 195 236 288134 352USD mn
1000
1200
1400
1600
200
400
600
800
1000
2008‐09 2009‐10 2010‐2011 2011‐12 2012‐13 2013‐14 2014‐15
Sections 6 7 8 10 11 12 13
Others 66 76 83 96 109 126 145
Sheetmetalworking 71 82 93 100 108 117 126
0
200
CAGR
12%
14%
11%Sheet metal working 71 82 93 100 108 117 126
Presses 485 512 581 712 883 1100 1368
» Servo technology for optimal motor drove control provides energy efficient running system » Increasing market for low cost car will trigger the need of forming of hard to work materials “light material” (high
tensile aluminum alloy etc)
11%
19%
tensile, aluminum alloy etc) » Enhanced formability by hydro forming machines will increase its acceptance» Need for eco friendly products will increase the usage of servo motor & drive usage across the machines
107
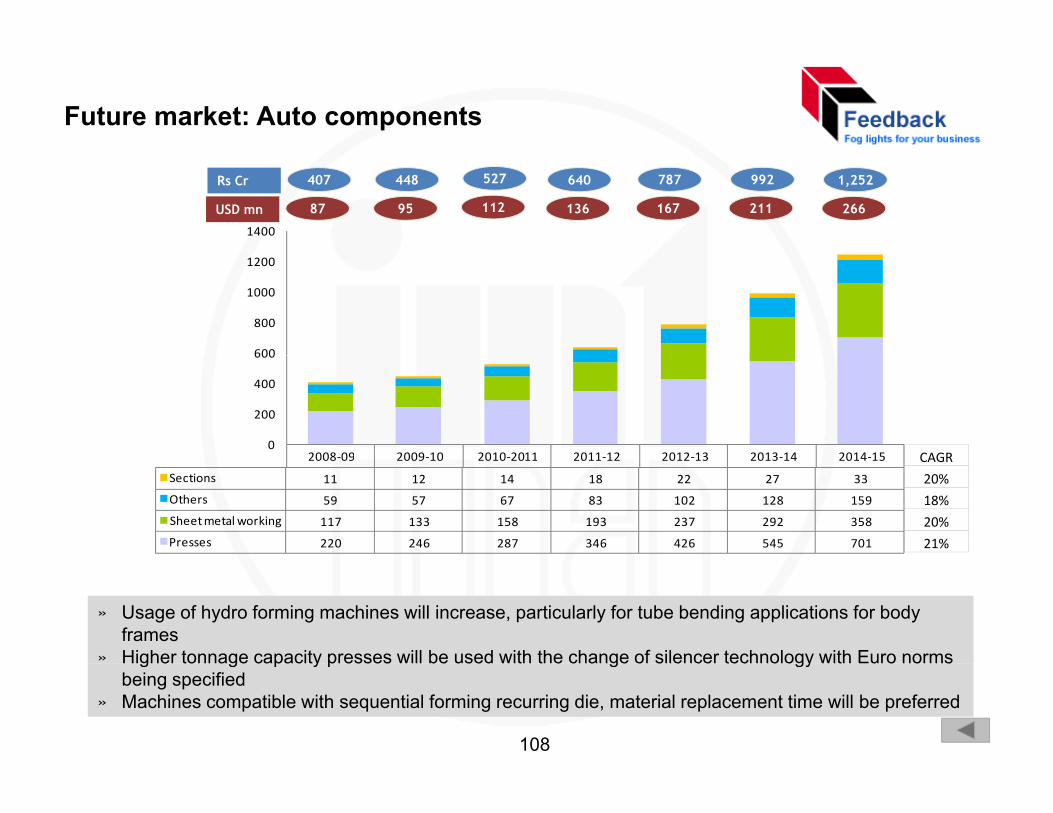
Future market: Auto components
1400
448 527 640 787 992407 1,252Rs Cr
95 112 136 167 21187 266USD mn
600
800
1000
1200
2008‐09 2009‐10 2010‐2011 2011‐12 2012‐13 2013‐14 2014‐150
200
400
600
CAGR2008 09 2009 10 2010 2011 2011 12 2012 13 2013 14 2014 15
Sections 11 12 14 18 22 27 33
Others 59 57 67 83 102 128 159
Sheet metal working 117 133 158 193 237 292 358
Presses 220 246 287 346 426 545 701
CAGR
20%
18%
20%
21%
» Usage of hydro forming machines will increase, particularly for tube bending applications for body frames
» Higher tonnage capacity presses will be used with the change of silencer technology with Euro normsHigher tonnage capacity presses will be used with the change of silencer technology with Euro norms being specified
» Machines compatible with sequential forming recurring die, material replacement time will be preferred
108
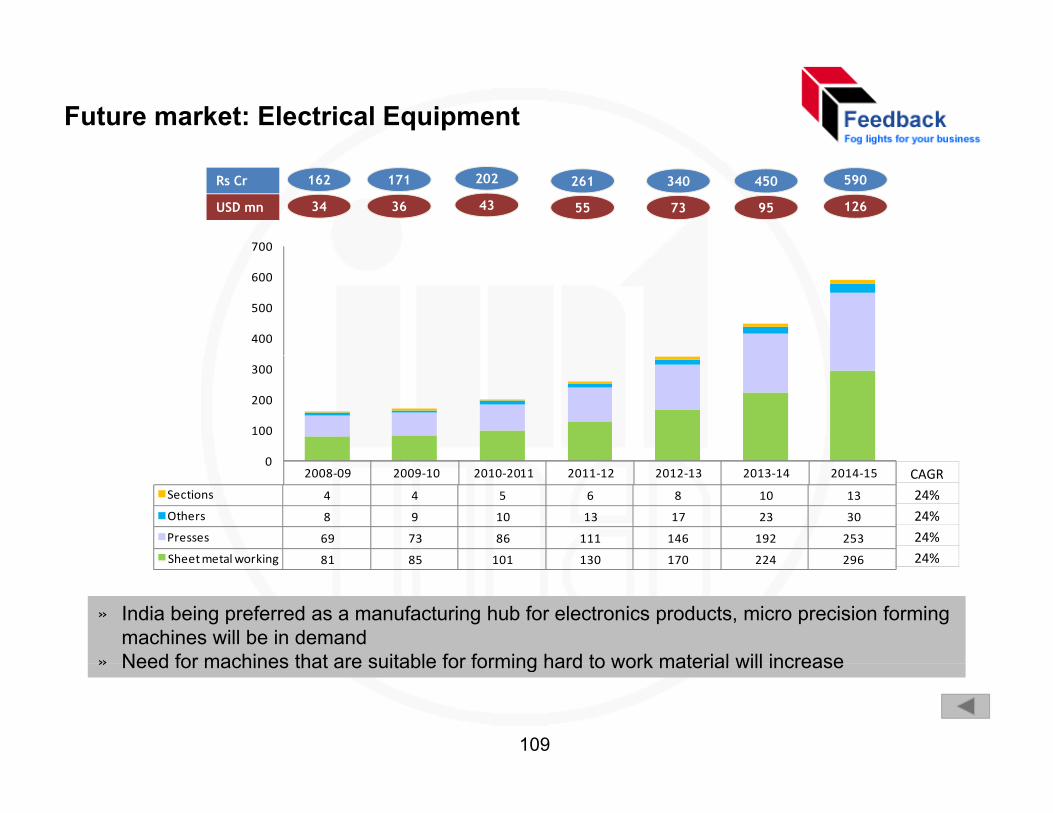
Future market: Electrical Equipment
700
171 202 261 340 450162 590Rs Cr
36 43 55 73 9534 126USD mn
400
500
600
0
100
200
300
2008‐09 2009‐10 2010‐2011 2011‐12 2012‐13 2013‐14 2014‐15
Sections 4 4 5 6 8 10 13
Others 8 9 10 13 17 23 30
Presses 69 73 86 111 146 192 253
Sheetmetalworking 81 85 101 130 170 224 296
0CAGR
24%
24%
24%
24%Sheet metal working 81 85 101 130 170 224 296
» India being preferred as a manufacturing hub for electronics products, micro precision forming machines will be in demand
» Need for machines that are suitable for forming hard to work material will increase
24%
» Need for machines that are suitable for forming hard to work material will increase
109
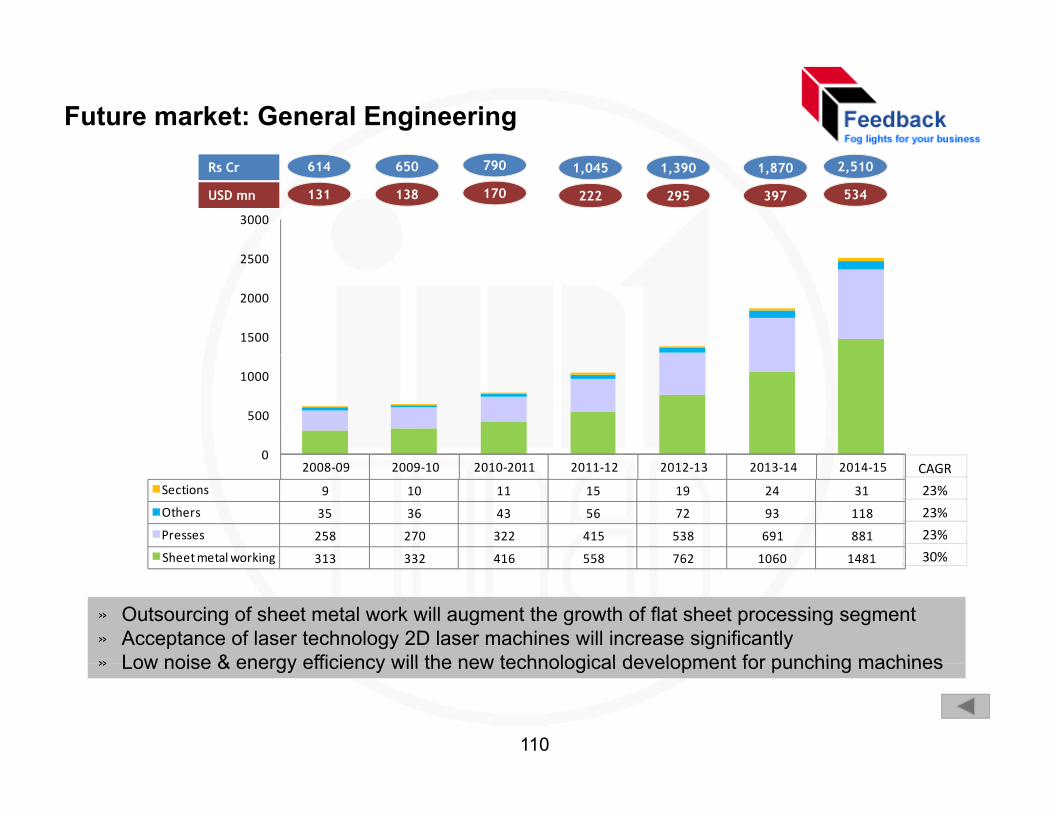
Future market: General Engineering
3000
650 790 1,045 1,390 1,870614 2,510Rs Cr
138 170 222 295 397131 534USD mn
1500
2000
2500
0
500
1000
2008‐09 2009‐10 2010‐2011 2011‐12 2012‐13 2013‐14 2014‐15
Sections 9 10 11 15 19 24 31
Others 35 36 43 56 72 93 118
Presses 258 270 322 415 538 691 881
Sheetmetalworking 313 332 416 558 762 1060 1481
0CAGR
23%
23%
23%
30%Sheet metal working 313 332 416 558 762 1060 1481
» Outsourcing of sheet metal work will augment the growth of flat sheet processing segment» Acceptance of laser technology 2D laser machines will increase significantly» Low noise & energy efficiency will the new technological development for punching machines
30%
» Low noise & energy efficiency will the new technological development for punching machines
110
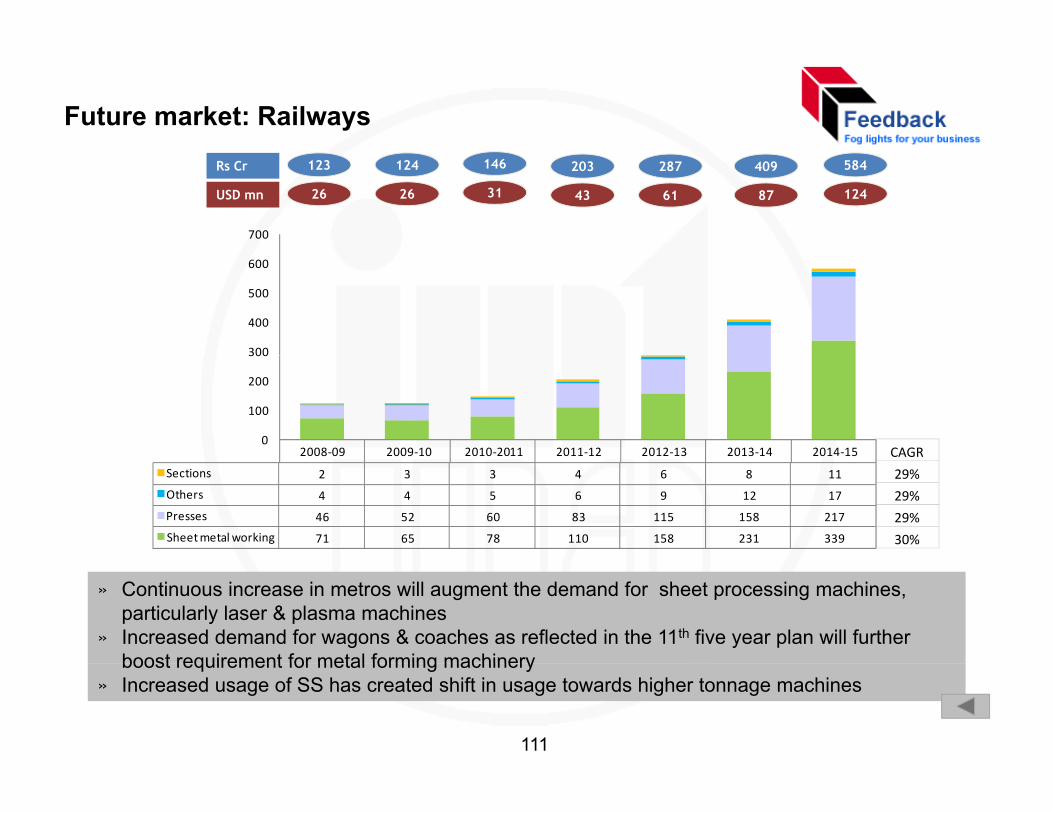
Future market: Railways
700
124 146 203 287 409123 584Rs Cr
26 31 43 61 8726 124USD mn
300
400
500
600
2008‐09 2009‐10 2010‐2011 2011‐12 2012‐13 2013‐14 2014‐150
100
200
300
CAGRSections 2 3 3 4 6 8 11
Others 4 4 5 6 9 12 17
Presses 46 52 60 83 115 158 217
Sheet metal working 71 65 78 110 158 231 339
29%
29%
29%
30%
» Continuous increase in metros will augment the demand for sheet processing machines, particularly laser & plasma machines
» Increased demand for wagons & coaches as reflected in the 11th five year plan will further boost requirement for metal forming machineryboost requirement for metal forming machinery
» Increased usage of SS has created shift in usage towards higher tonnage machines
111
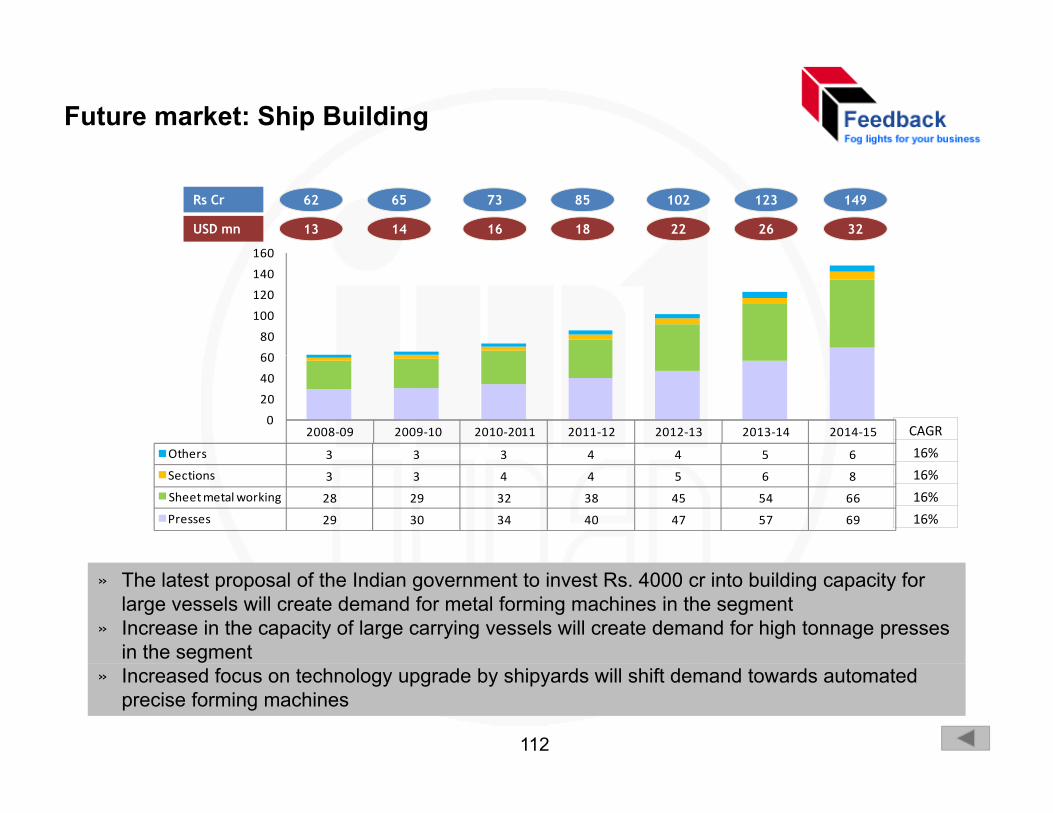
Future market: Ship Building
160
65 73 85 102 12362 149Rs Cr
14 16 18 22 2613 32USD mn
60
80
100
120
140
160
2008‐09 2009‐10 2010‐2011 2011‐12 2012‐13 2013‐14 2014‐15
Others 3 3 3 4 4 5 6
0
20
40
60
CAGR
16%3 3 3 4 4 5 6
Sections 3 3 4 4 5 6 8
Sheet metal working 28 29 32 38 45 54 66
Presses 29 30 34 40 47 57 69
16%
16%
16%
» The latest proposal of the Indian government to invest Rs. 4000 cr into building capacity for large vessels will create demand for metal forming machines in the segment
» Increase in the capacity of large carrying vessels will create demand for high tonnage presses in the segment
» Increased focus on technology upgrade by shipyards will shift demand towards automated precise forming machines
112
Opportunity Analysis and R d tiRecommendations• Opportunities
• Action Points
113
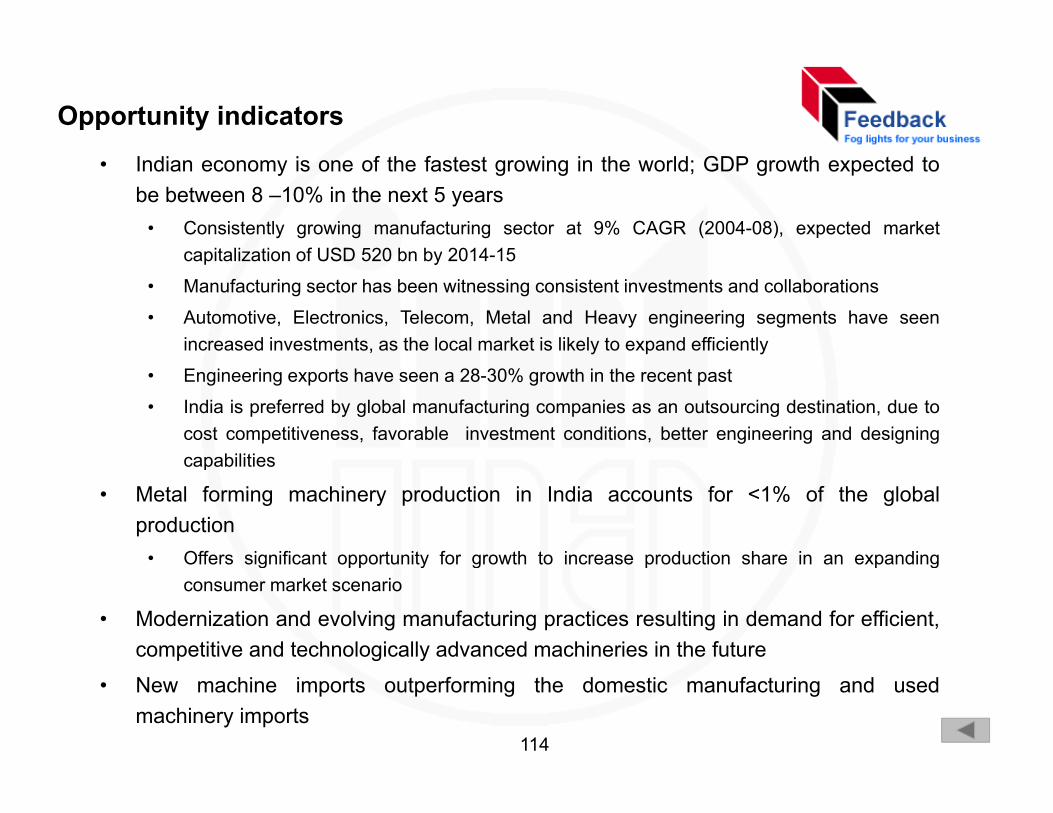
Opportunity indicators
• Indian economy is one of the fastest growing in the world; GDP growth expected tobe between 8 –10% in the next 5 years
• Consistently growing manufacturing sector at 9% CAGR (2004-08), expected marketcapitalization of USD 520 bn by 2014 15capitalization of USD 520 bn by 2014-15
• Manufacturing sector has been witnessing consistent investments and collaborations
• Automotive, Electronics, Telecom, Metal and Heavy engineering segments have seenincreased investments, as the local market is likely to expand efficiently
• Engineering exports have seen a 28-30% growth in the recent past
• India is preferred by global manufacturing companies as an outsourcing destination, due tocost competitiveness, favorable investment conditions, better engineering and designingcapabilitiescapabilities
• Metal forming machinery production in India accounts for <1% of the globalproduction
• Offers significant opportunity for growth to increase production share in an expandingOffers significant opportunity for growth to increase production share in an expandingconsumer market scenario
• Modernization and evolving manufacturing practices resulting in demand for efficient,competitive and technologically advanced machineries in the future
• New machine imports outperforming the domestic manufacturing and usedmachinery imports
114
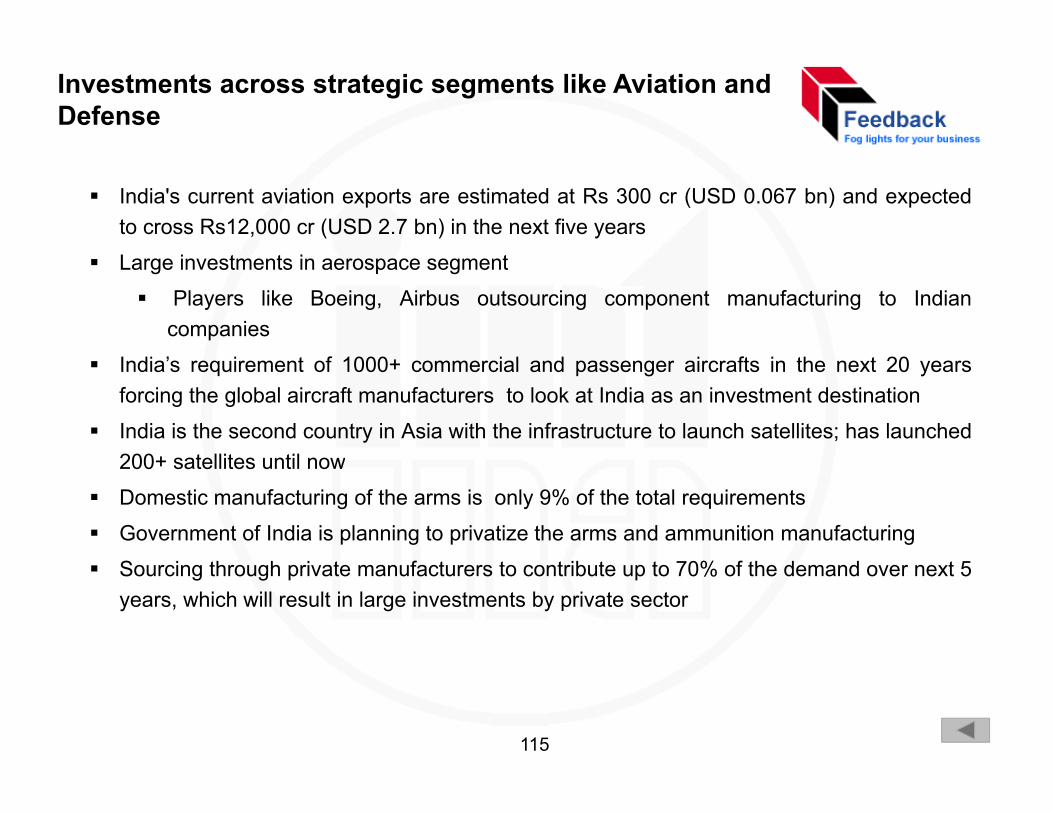
Investments across strategic segments like Aviation and Defense
India's current aviation exports are estimated at Rs 300 cr (USD 0.067 bn) and expectedto cross Rs12,000 cr (USD 2.7 bn) in the next five years
Large investments in aerospace segment
Players like Boeing, Airbus outsourcing component manufacturing to Indiancompanies
India’s requirement of 1000+ commercial and passenger aircrafts in the next 20 yearsforcing the global aircraft manufacturers to look at India as an investment destination
India is the second country in Asia with the infrastructure to launch satellites; has launched200+ satellites until now200+ satellites until now
Domestic manufacturing of the arms is only 9% of the total requirements
Government of India is planning to privatize the arms and ammunition manufacturing
Sourcing through private manufacturers to contribute up to 70% of the demand over next 5years, which will result in large investments by private sector
115
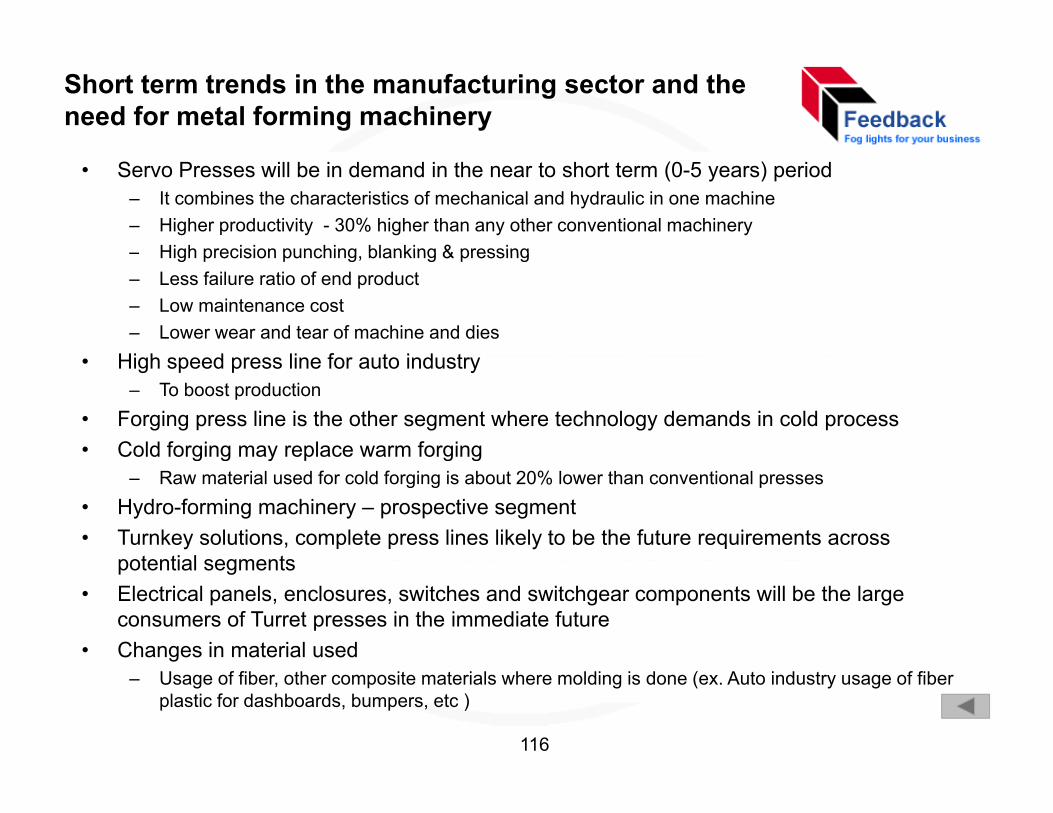
Short term trends in the manufacturing sector and the need for metal forming machinery
• Servo Presses will be in demand in the near to short term (0-5 years) period– It combines the characteristics of mechanical and hydraulic in one machine– Higher productivity - 30% higher than any other conventional machinery– High precision punching blanking & pressing– High precision punching, blanking & pressing – Less failure ratio of end product – Low maintenance cost– Lower wear and tear of machine and dies
Hi h d li f t i d t• High speed press line for auto industry – To boost production
• Forging press line is the other segment where technology demands in cold process• Cold forging may replace warm forgingg g y p g g
– Raw material used for cold forging is about 20% lower than conventional presses• Hydro-forming machinery – prospective segment • Turnkey solutions, complete press lines likely to be the future requirements across
potential segmentspotential segments• Electrical panels, enclosures, switches and switchgear components will be the large
consumers of Turret presses in the immediate future• Changes in material used
– Usage of fiber, other composite materials where molding is done (ex. Auto industry usage of fiber plastic for dashboards, bumpers, etc )
116
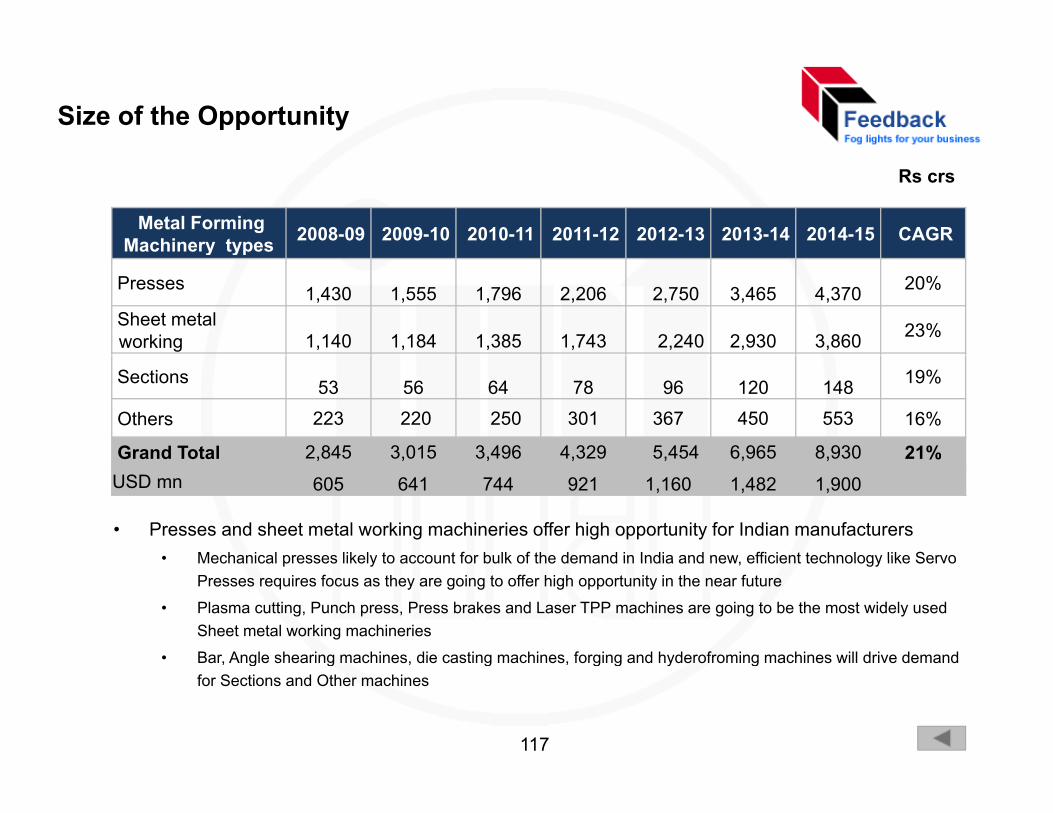
Size of the Opportunity
Metal Forming Machinery types 2008-09 2009-10 2010-11 2011-12 2012-13 2013-14 2014-15 CAGR
Rs crs
y yp
Presses 1,430 1,555 1,796 2,206 2,750 3,465 4,370 20%
Sheet metal working 1,140 1,184 1,385 1,743 2,240 2,930 3,860 23%
Sections 53 56 64 78 96 120 148 19%
Others 223 220 250 301 367 450 553 16%
Grand Total 2,845 3,015 3,496 4,329 5,454 6,965 8,930 21%
• Presses and sheet metal working machineries offer high opportunity for Indian manufacturers • Mechanical presses likely to account for bulk of the demand in India and new efficient technology like Servo
Grand Total 2,845 3,015 3,496 4,329 5,454 6,965 8,930 21%USD mn 605 641 744 921 1,160 1,482 1,900
Mechanical presses likely to account for bulk of the demand in India and new, efficient technology like Servo Presses requires focus as they are going to offer high opportunity in the near future
• Plasma cutting, Punch press, Press brakes and Laser TPP machines are going to be the most widely used Sheet metal working machineries
• Bar, Angle shearing machines, die casting machines, forging and hyderofroming machines will drive demand a , g e s ea g ac es, d e cas g ac es, o g g a d yde o o g ac es d e de a dfor Sections and Other machines
117
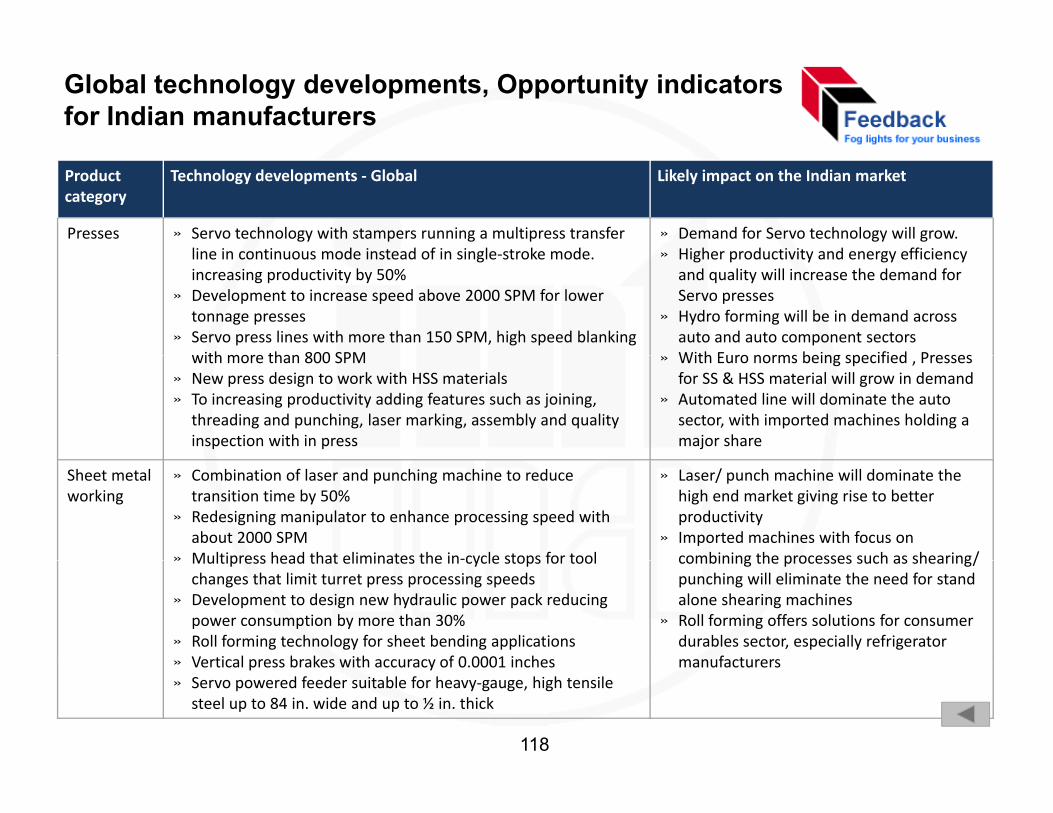
Global technology developments, Opportunity indicators for Indian manufacturers
Product category
Technology developments ‐ Global Likely impact on the Indian market
Presses » Servo technology with stampers running a multipress transfer line in continuous mode instead of in single stroke mode
» Demand for Servo technology will grow.» Higher productivity and energy efficiencyline in continuous mode instead of in single‐stroke mode.
increasing productivity by 50% » Development to increase speed above 2000 SPM for lower
tonnage presses» Servo press lines with more than 150 SPM, high speed blanking
with more than 800 SPM
» Higher productivity and energy efficiency and quality will increase the demand for Servo presses
» Hydro forming will be in demand across auto and auto component sectorsWith Euro norms being specified Presseswith more than 800 SPM
» New press design to work with HSS materials» To increasing productivity adding features such as joining,
threading and punching, laser marking, assembly and quality inspection with in press
» With Euro norms being specified , Presses for SS & HSS material will grow in demand
» Automated line will dominate the auto sector, with imported machines holding a major share
Sheet metal working
» Combination of laser and punching machine to reduce transition time by 50%
» Redesigning manipulator to enhance processing speed with about 2000 SPM
» Multipress head that eliminates the in‐cycle stops for tool
» Laser/ punch machine will dominate the high end market giving rise to better productivity
» Imported machines with focus on combining the processes such as shearing/» Multipress head that eliminates the in cycle stops for tool
changes that limit turret press processing speeds » Development to design new hydraulic power pack reducing
power consumption by more than 30%» Roll forming technology for sheet bending applications» Vertical press brakes with accuracy of 0 0001 inches
combining the processes such as shearing/ punching will eliminate the need for stand alone shearing machines
» Roll forming offers solutions for consumer durables sector, especially refrigerator manufacturers» Vertical press brakes with accuracy of 0.0001 inches
» Servo powered feeder suitable for heavy‐gauge, high tensile steel up to 84 in. wide and up to ½ in. thick
manufacturers
118
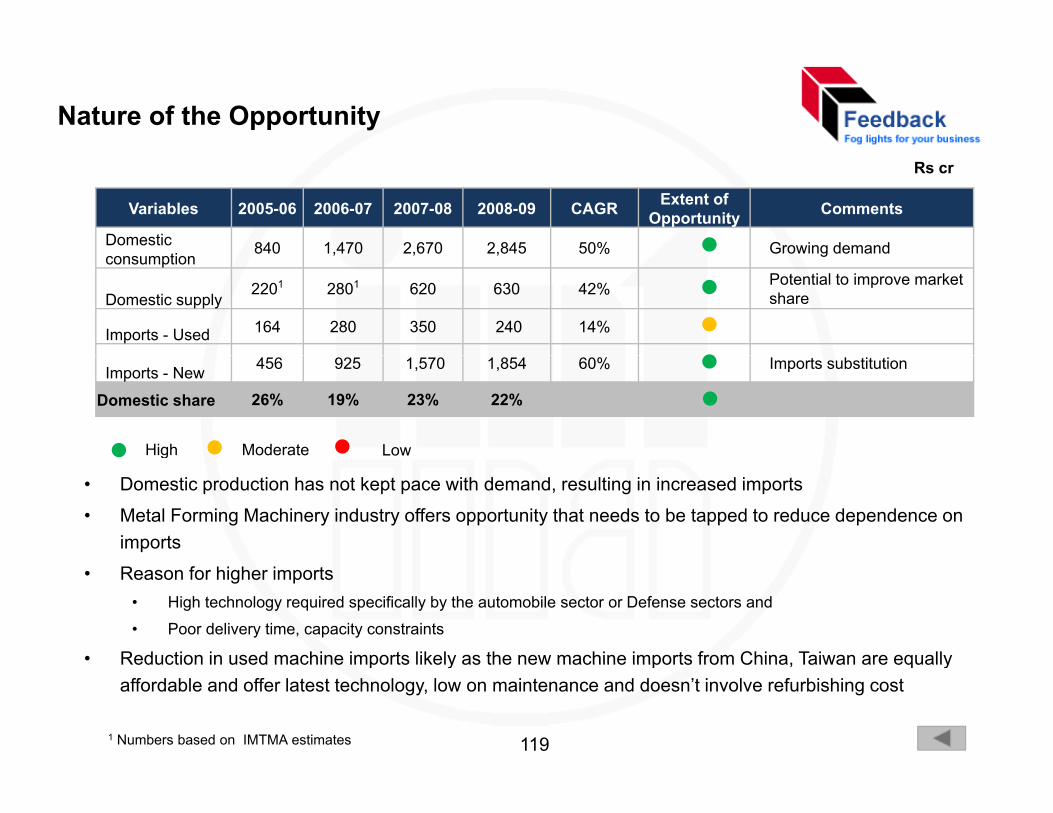
Nature of the Opportunity
Variables 2005-06 2006-07 2007-08 2008-09 CAGR Extent of Opportunity Comments
Domestic i
840 1,470 2,670 2,845 50% Growing demand
Rs cr
consumption840 1,470 2,670 2,845 50% Growing demand
Domestic supply2201 2801 620 630 42% Potential to improve market
share
Imports - Used 164 280 350 240 14%
Imports - New 456 925 1,570 1,854 60% Imports substitution
Domestic share 26% 19% 23% 22%
High Moderate Low
• Domestic production has not kept pace with demand, resulting in increased imports
• Metal Forming Machinery industry offers opportunity that needs to be tapped to reduce dependence on imports
g
• Reason for higher imports • High technology required specifically by the automobile sector or Defense sectors and
• Poor delivery time, capacity constraints
• Reduction in used machine imports likely as the new machine imports from China, Taiwan are equallyReduction in used machine imports likely as the new machine imports from China, Taiwan are equally affordable and offer latest technology, low on maintenance and doesn’t involve refurbishing cost
1 Numbers based on IMTMA estimates 119
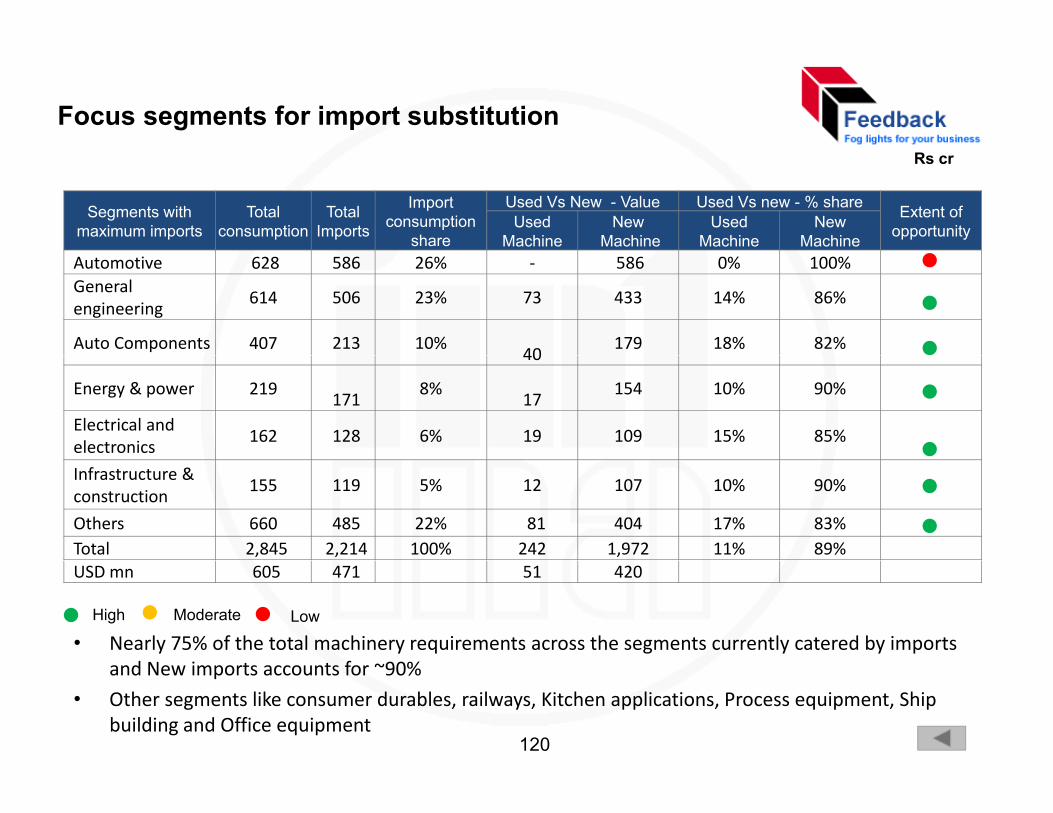
Focus segments for import substitution
Segments with maximum imports
Total consumption
Total Imports
Import consumption
share
Used Vs New - Value Used Vs new - % share Extent of opportunityUsed
MachineNew
MachineUsed
MachineNew
Machine
Rs cr
Automotive 628 586 26% ‐ 586 0% 100%General engineering
614 506 23% 73 433 14% 86%
Auto Components 407 213 10%40
179 18% 82%40
Energy & power 219171
8%17
154 10% 90%
Electrical and electronics
162 128 6% 19 109 15% 85%
Infrastructure & construction
155 119 5% 12 107 10% 90%
Others 660 485 22% 81 404 17% 83%Total 2,845 2,214 100% 242 1,972 11% 89%USD mn 605 471 51 420
• Nearly 75% of the total machinery requirements across the segments currently catered by imports d N i t t f 90%
High Moderate Low
and New imports accounts for ~90%
• Other segments like consumer durables, railways, Kitchen applications, Process equipment, Ship building and Office equipment
120
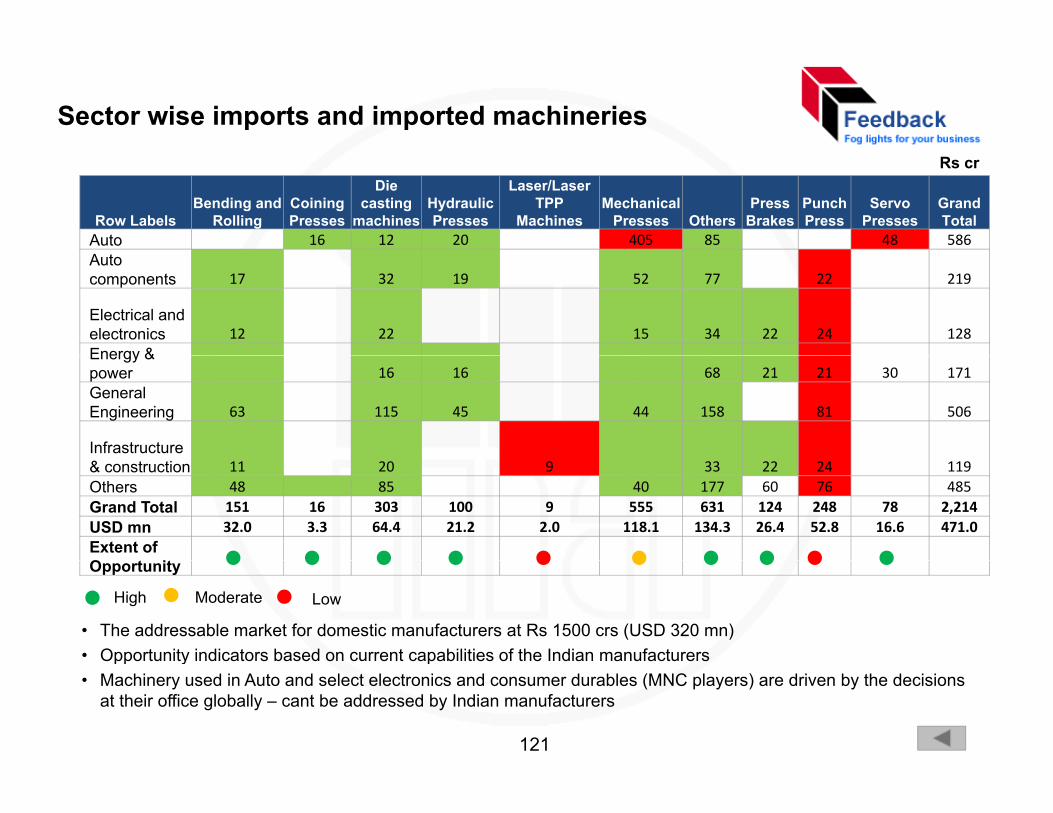
Sector wise imports and imported machineries Rs cr
Row LabelsBending and
Rolling Coining Presses
Die casting
machinesHydraulic Presses
Laser/Laser TPP
MachinesMechanical
Presses OthersPress
BrakesPunch Press
Servo Presses
Grand Total
Auto 16 12 20 405 85 48 586Auto components 17 32 19 52 77 22 219
Electrical and electronics 12 22 15 34 22 24 128Energy &Energy & power 16 16 68 21 21 30 171General Engineering 63 115 45 44 158 81 506
Infrastructure & construction 11 20 9 33 22 24 119Others 48 85 40 177 60 76 485Grand Total 151 16 303 100 9 555 631 124 248 78 2,214USD mn 32.0 3.3 64.4 21.2 2.0 118.1 134.3 26.4 52.8 16.6 471.0Extent of O t it
• The addressable market for domestic manufacturers at Rs 1500 crs (USD 320 mn)• Opportunity indicators based on current capabilities of the Indian manufacturers
Opportunity
High Moderate Low
pp y p• Machinery used in Auto and select electronics and consumer durables (MNC players) are driven by the decisions
at their office globally – cant be addressed by Indian manufacturers
121
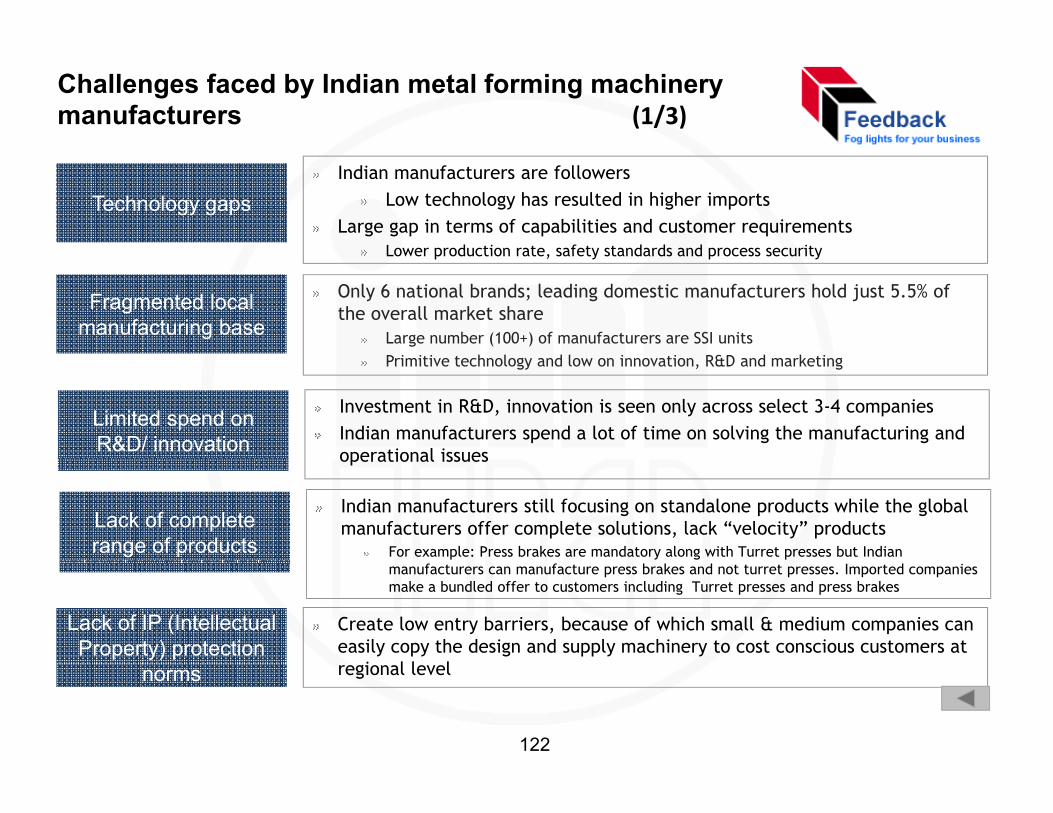
Challenges faced by Indian metal forming machinery manufacturers (1/3)
Technology gapsIndian manufacturers are followers
Low technology has resulted in higher importsLarge gap in terms of capabilities and customer requirements
Lower production rate safety standards and process security
Fragmented local manufacturing base
Lower production rate, safety standards and process security
Only 6 national brands; leading domestic manufacturers hold just 5.5% of the overall market share
Large number (100+) of manufacturers are SSI unitsP i i i h l d l i i R&D d k iPrimitive technology and low on innovation, R&D and marketing
Limited spend on R&D/ innovation
Investment in R&D, innovation is seen only across select 3-4 companiesIndian manufacturers spend a lot of time on solving the manufacturing and operational issues operational issues
Indian manufacturers still focusing on standalone products while the global manufacturers offer complete solutions, lack “velocity” products
For example: Press brakes are mandatory along with Turret presses but Indian
Lack of complete range of products
Lack of IP (Intellectual Property) protection
Create low entry barriers, because of which small & medium companies can easily copy the design and supply machinery to cost conscious customers at
i l l l
manufacturers can manufacture press brakes and not turret presses. Imported companies make a bundled offer to customers including Turret presses and press brakes
norms regional level
122
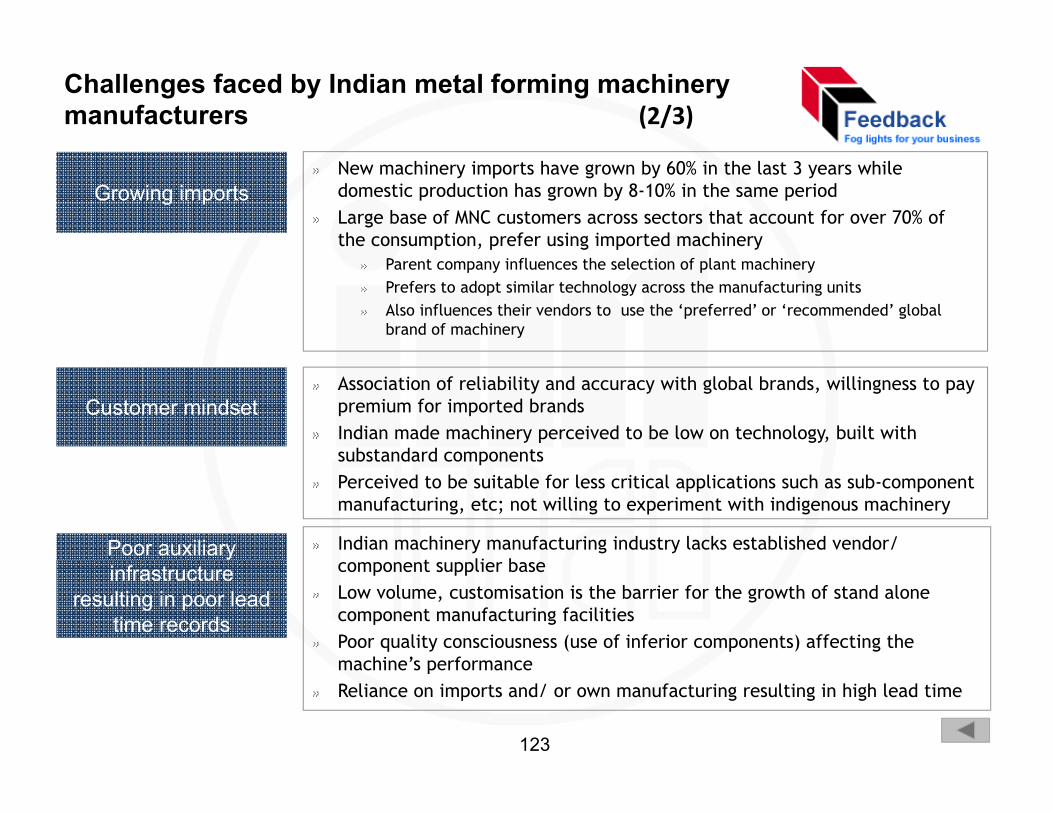
Challenges faced by Indian metal forming machinery manufacturers (2/3)
New machinery imports have grown by 60% in the last 3 years while domestic production has grown by 8-10% in the same periodLarge base of MNC customers across sectors that account for over 70% of the consumption, prefer using imported machinery
Growing imports
Parent company influences the selection of plant machineryPrefers to adopt similar technology across the manufacturing unitsAlso influences their vendors to use the ‘preferred’ or ‘recommended’ global brand of machinery
Customer mindsetAssociation of reliability and accuracy with global brands, willingness to pay premium for imported brandsIndian made machinery perceived to be low on technology, built with substandard componentssubstandard componentsPerceived to be suitable for less critical applications such as sub-component manufacturing, etc; not willing to experiment with indigenous machinery
Poor auxiliary Indian machinery manufacturing industry lacks established vendor/ t li binfrastructure
resulting in poor lead time records
component supplier baseLow volume, customisation is the barrier for the growth of stand alone component manufacturing facilitiesPoor quality consciousness (use of inferior components) affecting the machine’s performancemachine s performanceReliance on imports and/ or own manufacturing resulting in high lead time
123
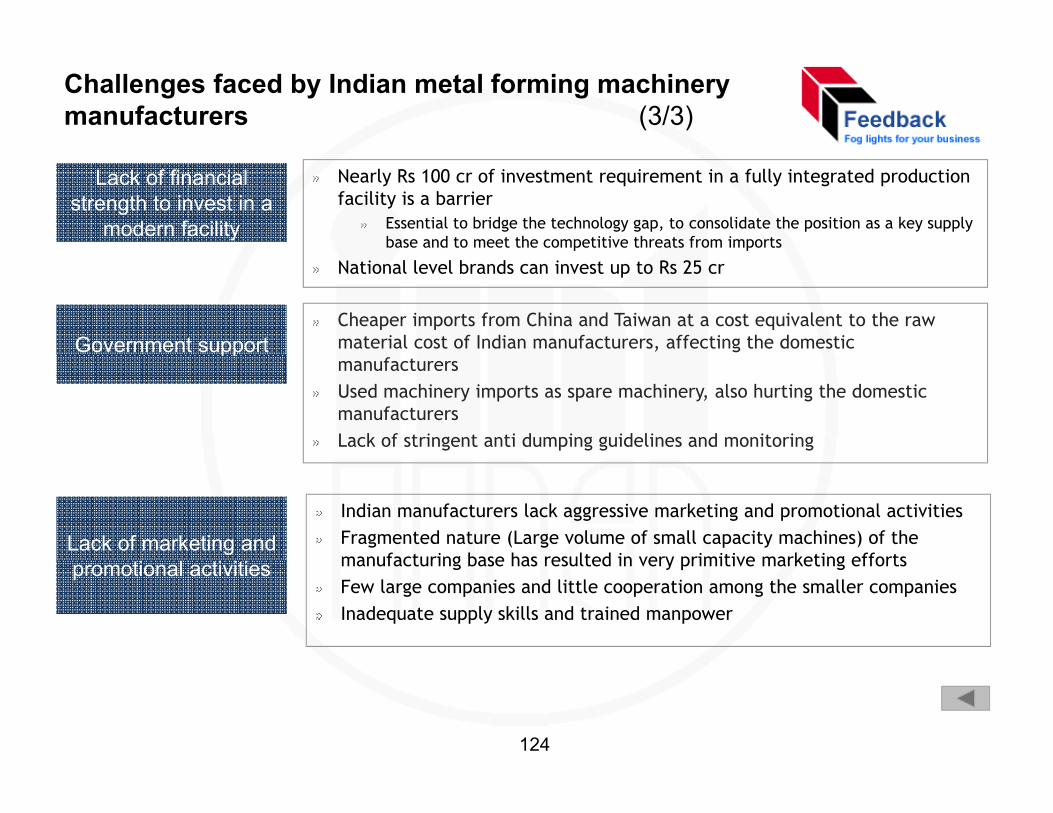
Challenges faced by Indian metal forming machinery manufacturers (3/3)
Lack of financial strength to invest in a
modern facility
Nearly Rs 100 cr of investment requirement in a fully integrated production facility is a barrier
Essential to bridge the technology gap, to consolidate the position as a key supply base and to meet the competitive threats from imports
Government support
National level brands can invest up to Rs 25 cr
Cheaper imports from China and Taiwan at a cost equivalent to the raw material cost of Indian manufacturers, affecting the domestic ppmanufacturersUsed machinery imports as spare machinery, also hurting the domestic manufacturersLack of stringent anti dumping guidelines and monitoring
Lack of marketing and Indian manufacturers lack aggressive marketing and promotional activitiesFragmented nature (Large volume of small capacity machines) of the manufacturing base has resulted in very primitive marketing effortspromotional activities manufacturing base has resulted in very primitive marketing effortsFew large companies and little cooperation among the smaller companiesInadequate supply skills and trained manpower
124
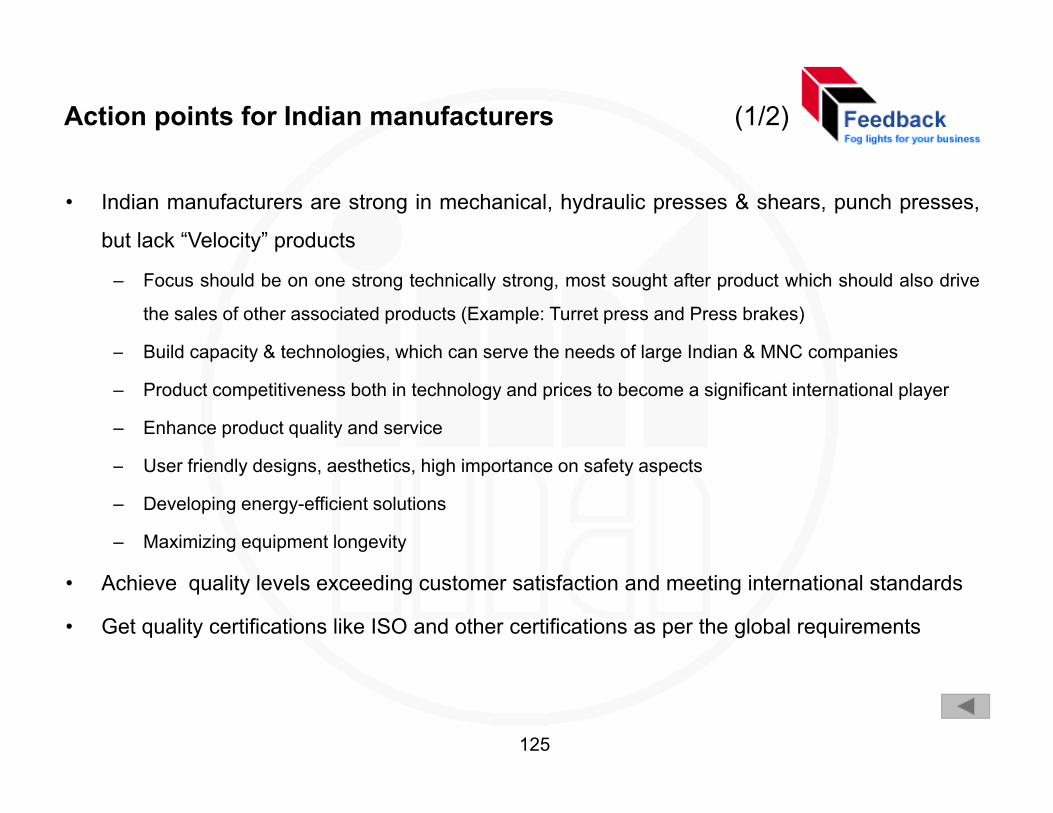
Action points for Indian manufacturers (1/2)
• Indian manufacturers are strong in mechanical, hydraulic presses & shears, punch presses,
but lack “Velocity” products
– Focus should be on one strong technically strong, most sought after product which should also drive
the sales of other associated products (Example: Turret press and Press brakes)
– Build capacity & technologies which can serve the needs of large Indian & MNC companiesBuild capacity & technologies, which can serve the needs of large Indian & MNC companies
– Product competitiveness both in technology and prices to become a significant international player
– Enhance product quality and service
– User friendly designs, aesthetics, high importance on safety aspects
– Developing energy-efficient solutions
– Maximizing equipment longevity
• Achieve quality levels exceeding customer satisfaction and meeting international standards
• Get quality certifications like ISO and other certifications as per the global requirements
125
Action points for Indian manufacturers (2/2)
• Establish strong links with international companies for components, technology and sub
systems
– Partnerships with European, Japanese companies with modern press and sheet metal machineryPartnerships with European, Japanese companies with modern press and sheet metal machinery
and not yet present in India
– Explore partnerships with leading manufacturers from China and Taiwan; China is a net importer
as on date but likely to emerge as the net exporter in the short termas on date but likely to emerge as the net exporter in the short term
• Improve lead time, realign supply chain system to achieve delivery within 4-6 weeks
– Jointly develop strong, competent and quality conscious component vendor base in a cluster
• Improve operational efficiency and financial power to strengthen marketing, R & D efforts
• Marketing network in domestic and international markets, aggressive marketing
• Design segment specific machinery (eg Specific to aerospace defense auto etc )• Design segment specific machinery (eg. Specific to aerospace, defense, auto, etc )
• Participating in national & international trade fairs & exhibitions to create awareness
among customers and also enhance the export market
• Get enlisted (non members) with associations (IMTMA)
126
Action points for IMTMA (1/2)
• Need to bring the regional level players and the associations under IMTMA
• Strong case to create a facility (Hub) for component manufacturers that will assist the
development of a strong and technologically superior component manufacturing base
for a reliable supply chain
– Electrical Control unit, Pressing unit, Fabricated structures, machine components, Mold, dyesg p y
and tooling
• Create a consortium of technologically oriented machinery manufacturers and opinion
leaders from the customer segments (Auto consumer durables etc) and jointlyleaders from the customer segments (Auto, consumer durables, etc) and jointly
develop products for the industry– Share future investments in technology, R&D to lower the financial load on the manufacturers
f &– Target 10 – 15 major manufacturers and support them with technology and R&D
• Initiatives to drive new machine imports substitution as it accounts for over 90% of the
total value of imports
127
Action points for IMTMA (2/2)
• China is likely to emerge as a major exporter in the short term (0-2 years)– China produces USD 19 bn worth forming machines, imports USD 7.5 bn of machinery and exports USD 450 mn
– Chinese companies likely to start dumping standard products in India as the domestic demand swellsp y p g p
– Evaluate a strategy to counter the possible threats from China
• Import limit on Chinese and Taiwanese machinery - New and used machine imports
CIF l f th R 1 C– CIF value of more than Rs. 1 Cr
• Enable international marketing through associates and affiliated trade bodies, as the
fragmented Indian manufacturers find global marketing a challenge– Most developed markets meet nearly 30 -50% of their demand through imports
• Establish “Made in India” label
• Increase awareness and improve the acceptability of servo presses across the customersIncrease awareness and improve the acceptability of servo presses across the customers– Productivity, quality of production (or components), safety and energy efficiency can be the selling points
• Drive a campaign to improve the per capita consumption of metal forming machinery
which is very low currently
128
About IMTMA (Indian Machine Tool Manufacturer’s Association)
Formed in the year when India secured its independenceIndian Machine Tool Manufacturers' Association (IMTMA) represents the entire machine tool industry in IndiaIMTMA has a membership of over 370+ companies, from both public & private sectors
Background
Assists and enables its members to realize their objective of achieving competitiveness in manufacturing, through a range of value-added initiatives
Publications, Seminars & Workshops Vision Workshops International Inward Missions Technology Missions etc
Activities
Vision Workshops, International Inward Missions, Technology Missions, etc
IMTMA is deeply committed to supporting its members to increase competitiveness, enhance efficiency, improve productivity, and ensure growth Organize trade fairs, including globally recognized exhibitions as IMTEX and Tooltech
Services
g g g y gTechnology center with productivity institute & design instituteCluster Development Programmes & training programmes
Partners – BFW, BLUM Novotest, CADEM, Delcam, Ezset, Jyoti, Pioneer CT, Renishaw, Saroa, Siemens, Taegutec
Select Partners & Members
Few members - ISGEC, HMT, Bemco Hydraulics, Baltiboi Ltd, Hindustan Hydraulics, Kennametal, etc
Location & Contact detailsIndian Machine Tool Manufacturers' Association10th Mile, Tumkur Road, Madavara Post, Bangalore 562123Phone: 080 66246600Phone: 080-66246600Fax: 080-66246658Web: www.imtma.in ; Mail: [email protected]
129
About Feedback Consulting
Feedback is your ideal business partner in the Indian market with a track record of over 2400 engagements across diverse industry
sectors. We are a leading B2B Research based consulting firm in India.
Feedback Experience : Since 1985 we have successfully executed over 2400 market research consulting and implementation
Background
Feedback Experience : Since 1985, we have successfully executed over 2400 market research, consulting and implementation
engagements for more than 250 Indian and International firms. We have enabled over US$ 6 bn investments in India .
Our Team : A qualified team of 120 executives across 4 offices in India
Co-ordinatesFeedback- Services Offered
Delhi
Market assessment
& Entry strategy • Partner Identification
• Market evaluation/ assessment • Business Forecasting• Company rating – Due Diligence• Competitive Intelligence
• Location identification• Ch l t t i Tel: +91 11 4653 4653
MumbaiTel: +91 22 4089 8000
Focus on O t
strategyPartner
identification
Satisfaction t
Advisorial services
Others
• Stakeholders satisfaction – Customer, Employee,
• Alliance Programs – JVs, M & A, Buyouts, Channel tie ups and policy formulations
• Channel structuring• Price tracking• Customer behavior
• Business transformation services
• Business alignment i
ChennaiTel: +91 44 4214 6384
BangaloreTel: +91 80 4062 3800
Website : www.feedbackconsulting.com
Outcomes measurement
India visit assistance
Web based sentiment analysis
services Vendors & Channels• Performance
improvements programs
services• Process Improvements
• Distills the sentiments expressed on your product / service on the web
• Quick temp check on your product / service
• Delegation Management• Matching making services
g
E‐mail ID : [email protected]
India representati
on
product / service
• Your Indian office, • Undertake specific activities on behalf of
the client • Project management 130
Thank YouThank You
131