meteo-grid: performing local weather forecast using grid computing c.-j. lenz, d. majewski deutscher...
Post on 21-Dec-2015
221 views
TRANSCRIPT

Meteo-GRID: Performing Local Weather Forecast
Using GRID Computing
C.-J. Lenz, D. Majewski
Deutscher Wetterdienst (DWD)
e-mail: [email protected] [email protected]

• Introduction to Meteo-GRID
• Tasks of Meteo-GRID, data flow in Meteo-GRID
• Presentation of the GUI of the LM-Plugin
• Application example
Contents

Goal of Meteo-GRID
To provide
high-resolution short range weather forecasts
with the
relocatable nonhydrostatic “Lokal-Modell” (LM)
of the Deutscher Wetterdienst (DWD)
for any desired region in the world
via Internet and EUROGRID

Meteo-GRID
- ... is one of the application-specific GRID workpackages
of EUROGRID
- ...is done by close collaboration of three EUROGRID
partners:
- Deutscher Wetterdienst (DWD)
- Centro Svizzero di Calcolo Scientifico (CSCS)
- Centre Nationale de Récherche Scientifique - Institut du Développement et des Ressources en Informatique Scientifique (CNRS-IDRIS)

What`s special about Meteo-GRID ? (1)
- Real-time weather forecasting is a time-critical task,
a 48-h forecast must be completed in less than
60 minutes
- LM is a large MPP code of about 100.000 lines of code,
Fortran95, MPI for message passing
- Weather forecasting is computationally expensive
~ 4000 Flop/grid point and time step
~ 15 Tflop for a 48-h forecast (160 x 160 x 35 grid points,
grid resolution ~ 7 km)
~ 3000 sec at a sustained speed of 5 Gflop/s

What`s special about Meteo-GRID ? (2)
- Weather forecasting requires high band width for data
transfer
Forecast data (at hourly intervals): (48+1) x 20 Mbyte = 1 GByte
Transfer in less than 1 hour: 2.4 Mbit/sec
- “Weather” has large social and economic impact
worldwide (storms, floodings, snow, freezing rain ...)
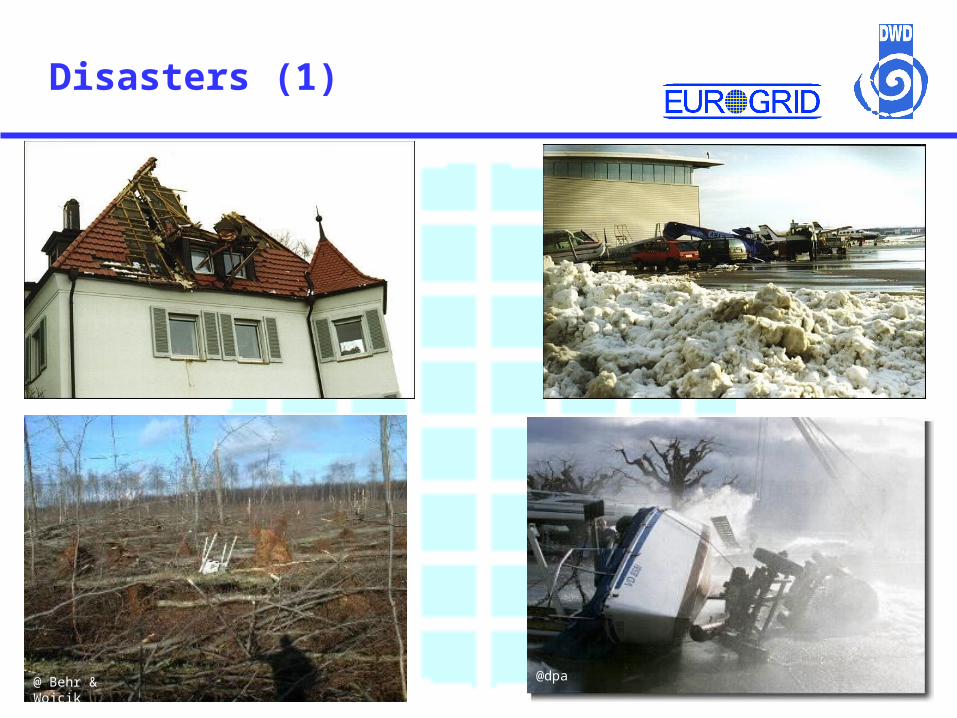
Disasters (1)
@dpa@ Behr & Wojcik
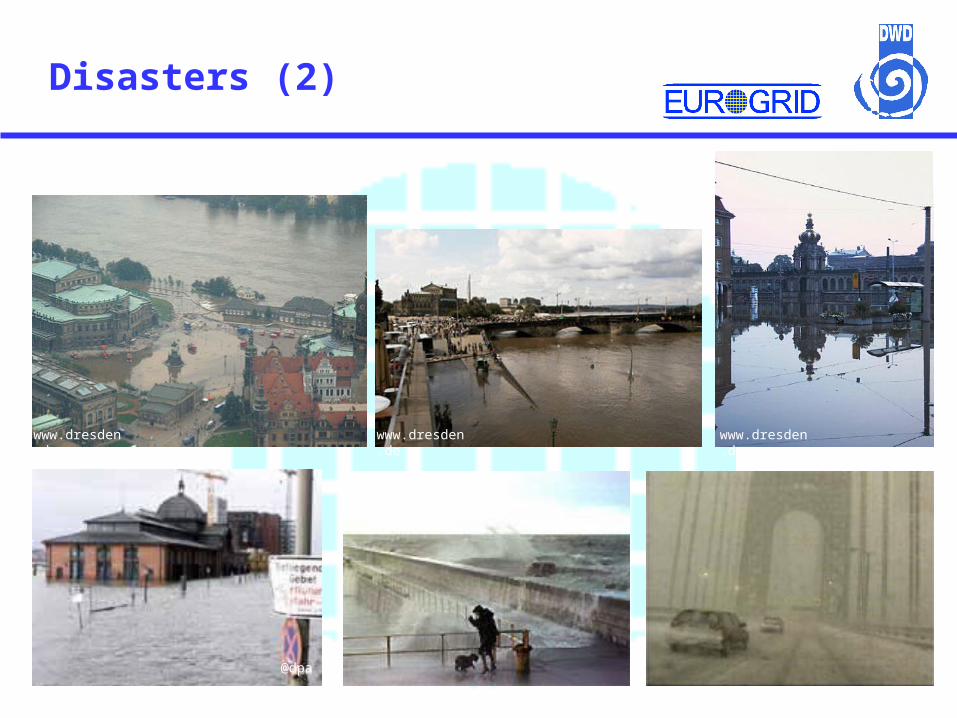
Disasters (2)
www.dresden.de www.dresden.de www.dresden.de
@dpa

Tasks of Meteo-GRID (1)
- Selection of
model domain,
grid resolution,
forecast date and
forecast range,
forecast products
in a Graphical User Interface (GUI)
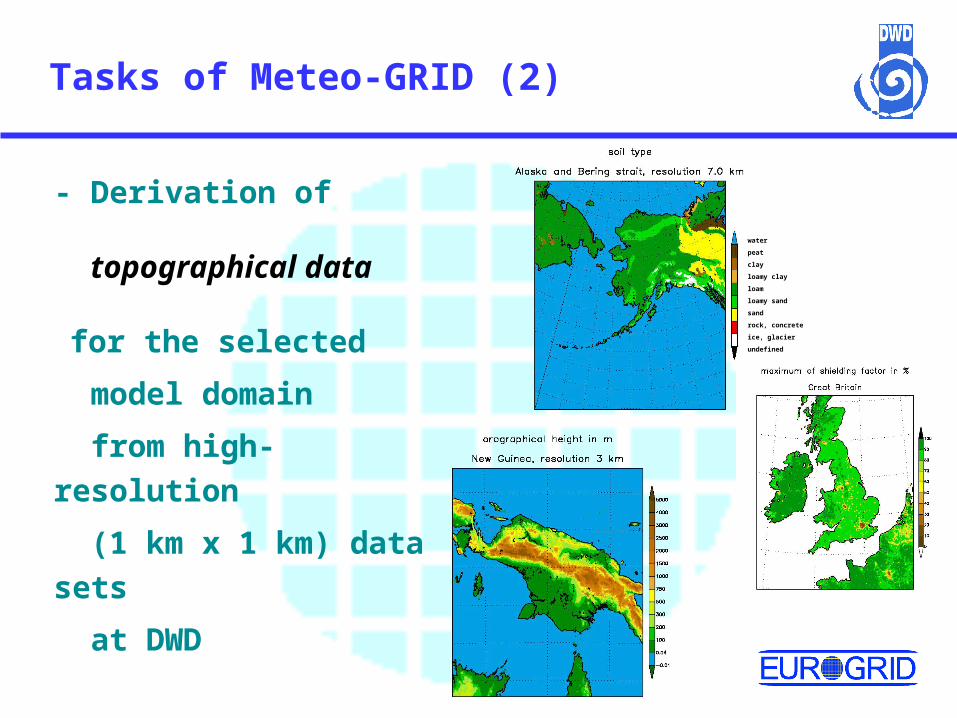
Tasks of Meteo-GRID (2)
- Derivation of
topographical data
for the selected
model domain
from high-resolution
(1 km x 1 km) data sets
at DWD
water
peat
clay
loamy clay
loam
loamy sand
sand
rock, concrete
ice, glacier
undefined

Tasks of Meteo-GRID (3)
- Extraction of
initial data and
lateral boundary data
sets for LM
from result data
of the global model GME
of DWD from the
ORACLE data base
Tasks of Meteo-GRID (4)
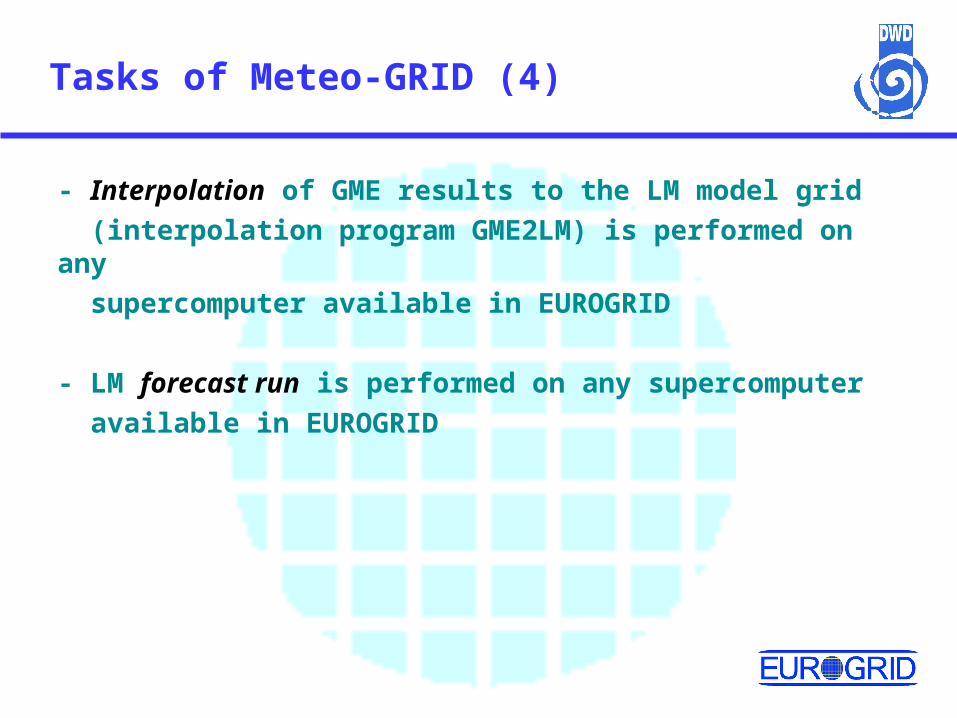
- Interpolation of GME results to the LM model grid
(interpolation program GME2LM) is performed on any
supercomputer available in EUROGRID
- LM forecast run is performed on any supercomputer
available in EUROGRID

Tasks of Meteo-GRID (5)
- Forecast data (up to 20 GByte in GRIB code) are
returned to the user via the internet and EUROGRID
AND/OR
- Visualization of LM forecasts ( 1 to 5 dimensional
graphics) on a computer within EUROGRID or on the
user’s computer
- Verification and validation of LM forecasts for any
region worldwide

Information and Data Flow (1)
1.1. Set up of LM-domain Set up of LM-domain
User
Global topographicaldata set (GIS),~ 7 GByte
Topographical data set(~ 1 MByte)
DWDDWD
GUI:GUI:Selection of- domain corners- grid resolution- forecast date- forecast range- forecast products
Calculation at DWD onSGI Origin, IBM RS/6000-SP (~ 15 min. wallclock time)

Information and Data Flow (2)
2. Define forecast date and range
GME data base (Oracle)
Hourly initial and lateral boundarydata sets on GME grid (~50 Mbyte)
UserDWDDWD
Extraction of GME results covering the LM domain at DWD (SGI Origin O 2000, IBM-RS/6000-SP) ~ 30 min. wallclock time

Information and Data Flow (3)
3.3. Perform GME2LM interpolation on EUROGRID HPC 1Perform GME2LM interpolation on EUROGRID HPC 1
User DWD
Topographical data set
Initial and lateral boundarydata sets on GME grid
HPC 1
GME2LMinterpolation of
GME results to LM grid
~1 MByte
~50 MByte
Initial and hourly lateral boundarydata sets on LM grid (50 MByte to 20 GByte)
Information and Data Flow (4)
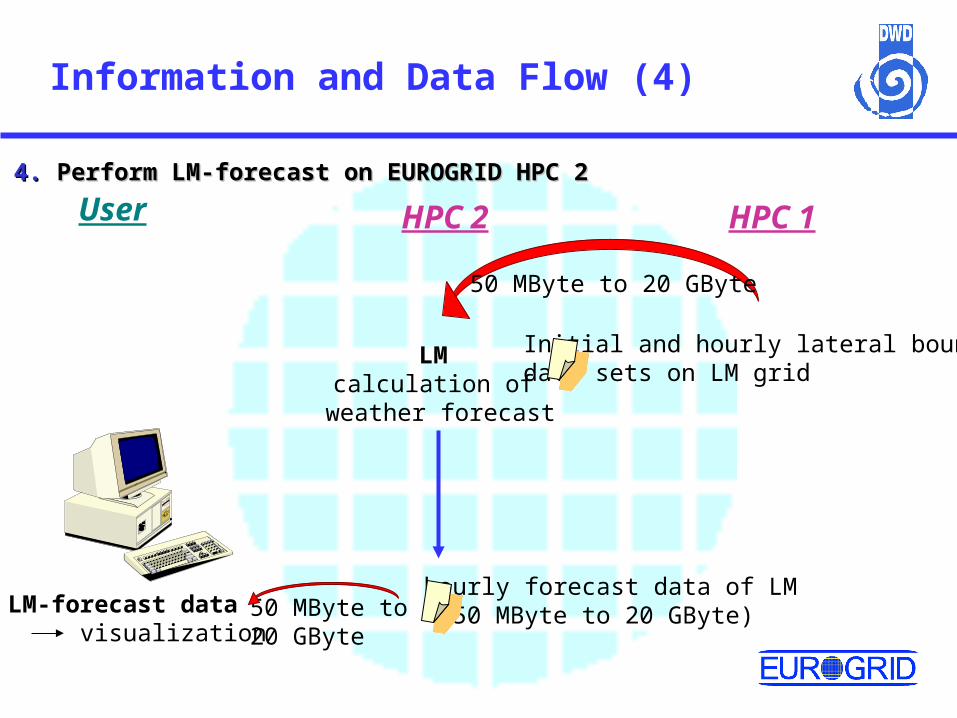
4.4. Perform LM-forecast on EUROGRID HPC 2Perform LM-forecast on EUROGRID HPC 2
User HPC 2
LMcalculation of
weather forecast
50 MByte to20 GByte
LM-forecast data visualization
Initial and hourly lateral boundarydata sets on LM grid
HPC 1
50 MByte to 20 GByte
hourly forecast data of LM (50 MByte to 20 GByte)
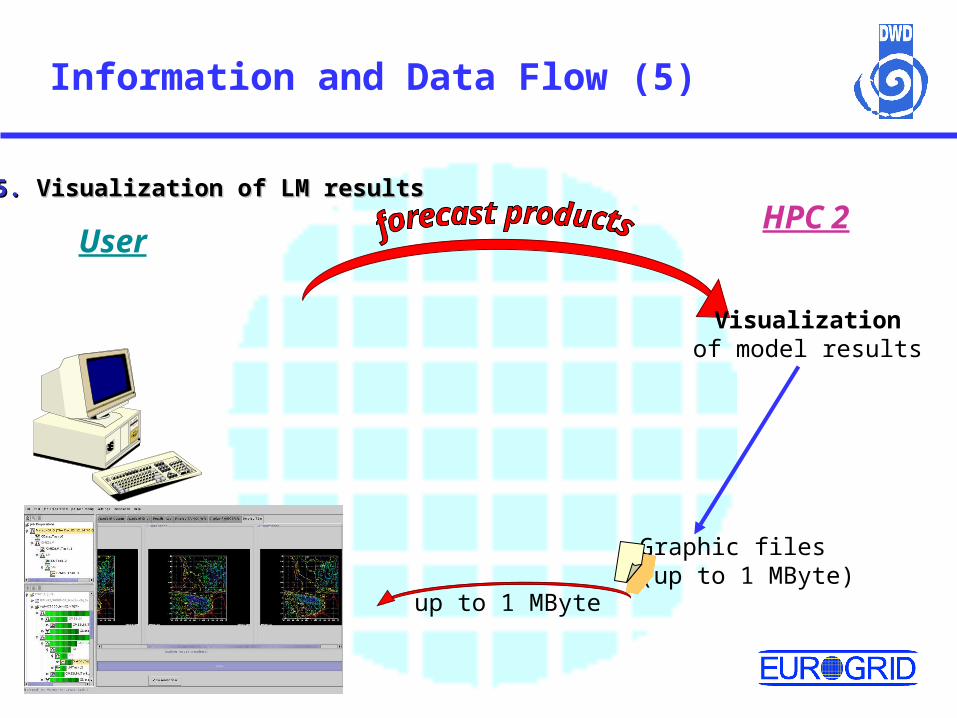
Information and Data Flow (5)
5.5. Visualization of LM results Visualization of LM results
UserHPC 2
Visualizationof model results
Graphic files(up to 1 MByte)
up to 1 MByte

GUI of the LM Plugin (1)

GUI of the LM Plugin (2)

GUI of the LM Plugin (3)
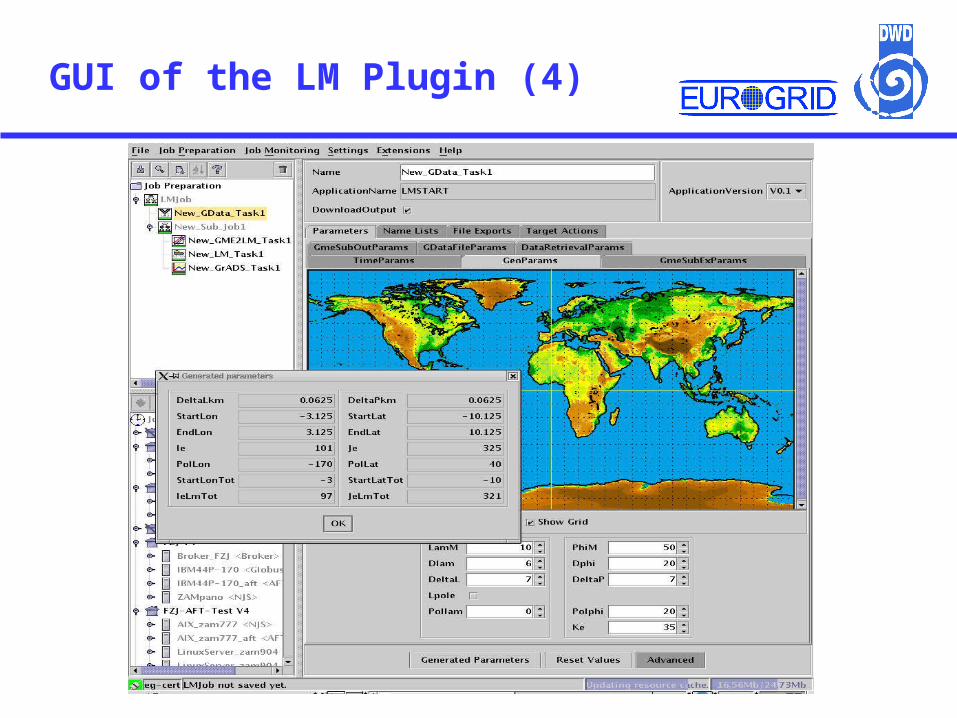
GUI of the LM Plugin (4)

GUI of the LM Plugin (5)
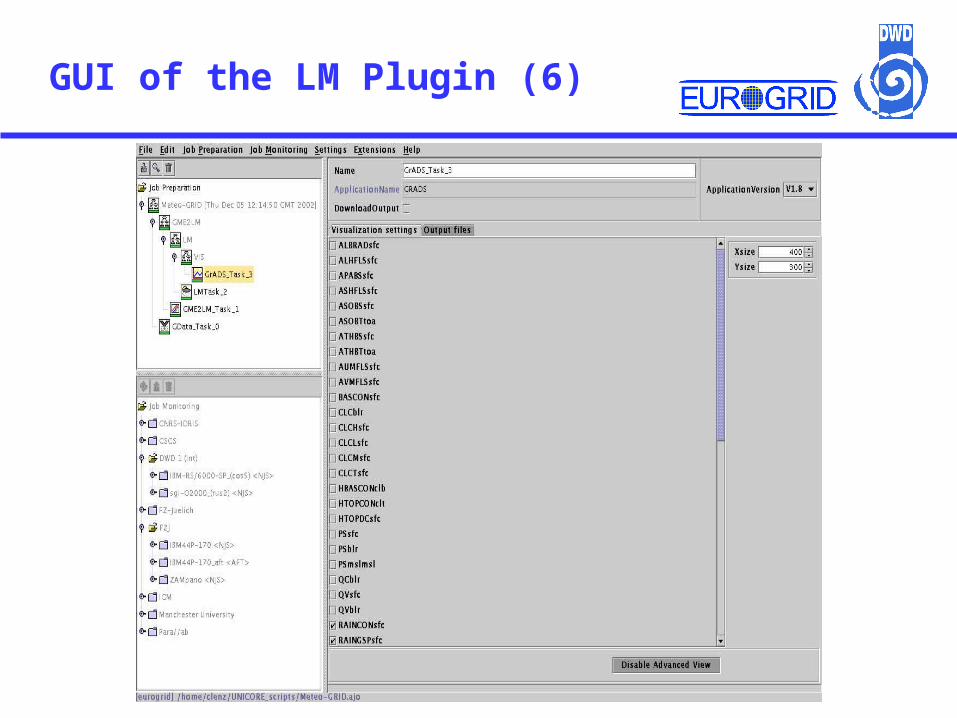
GUI of the LM Plugin (6)

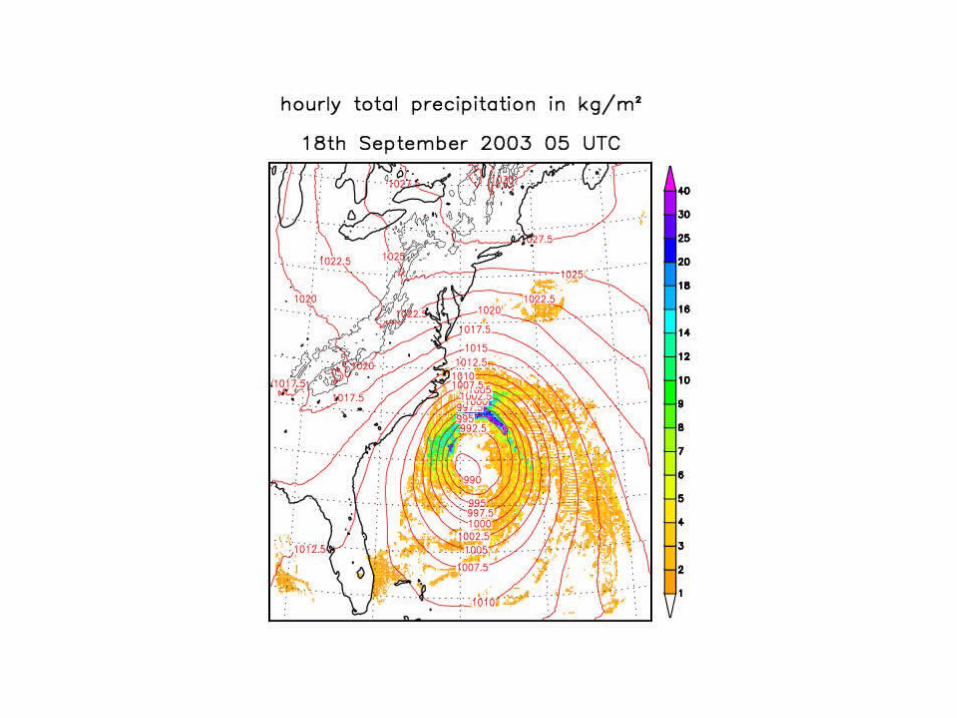
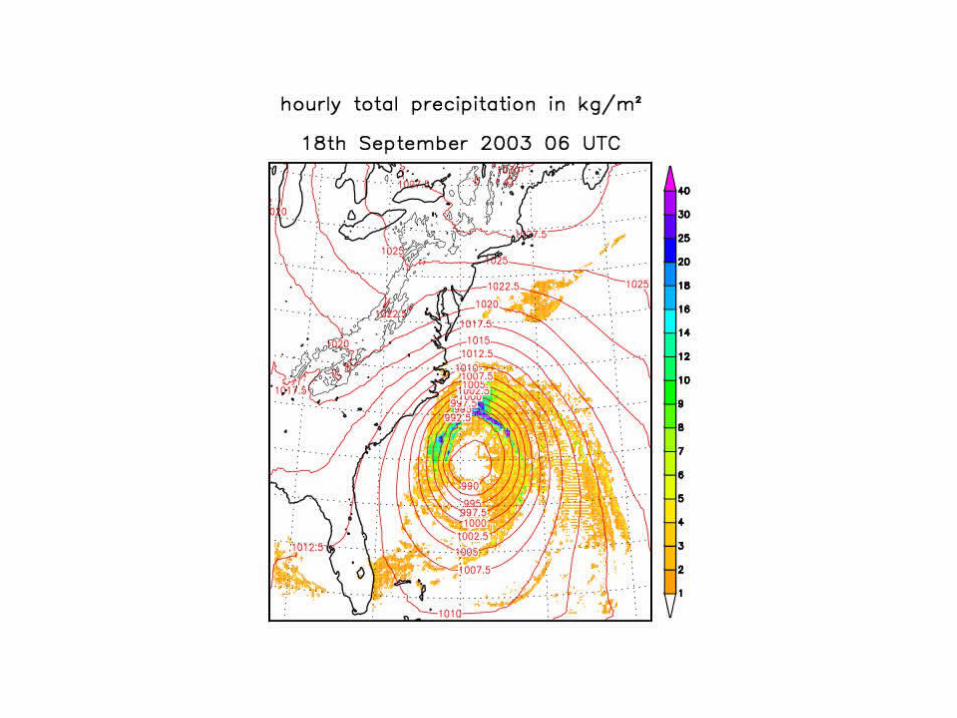
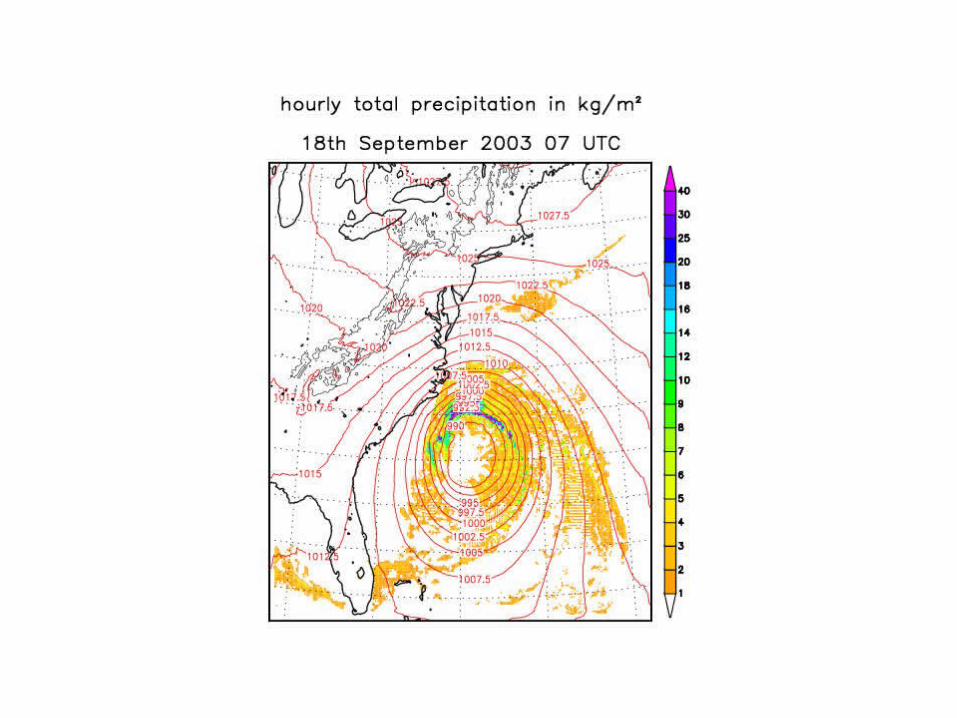
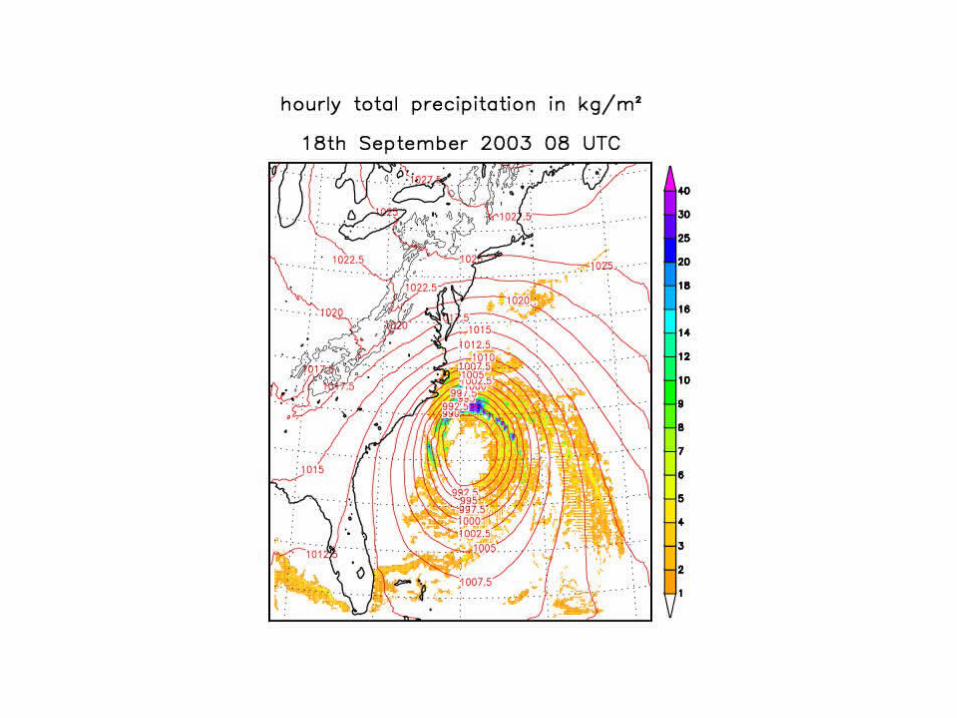
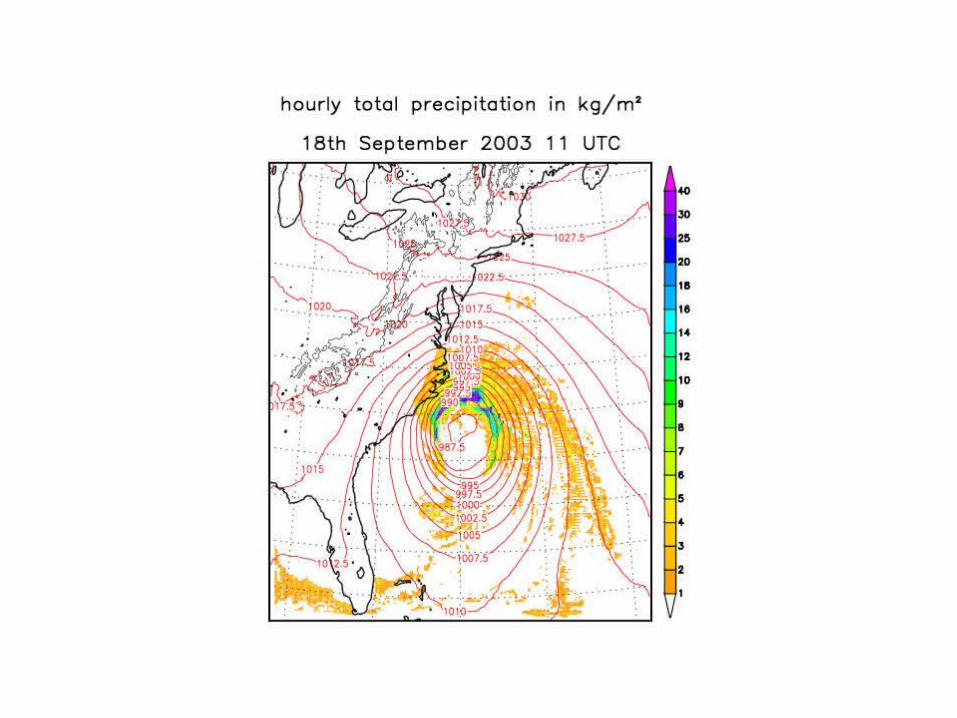
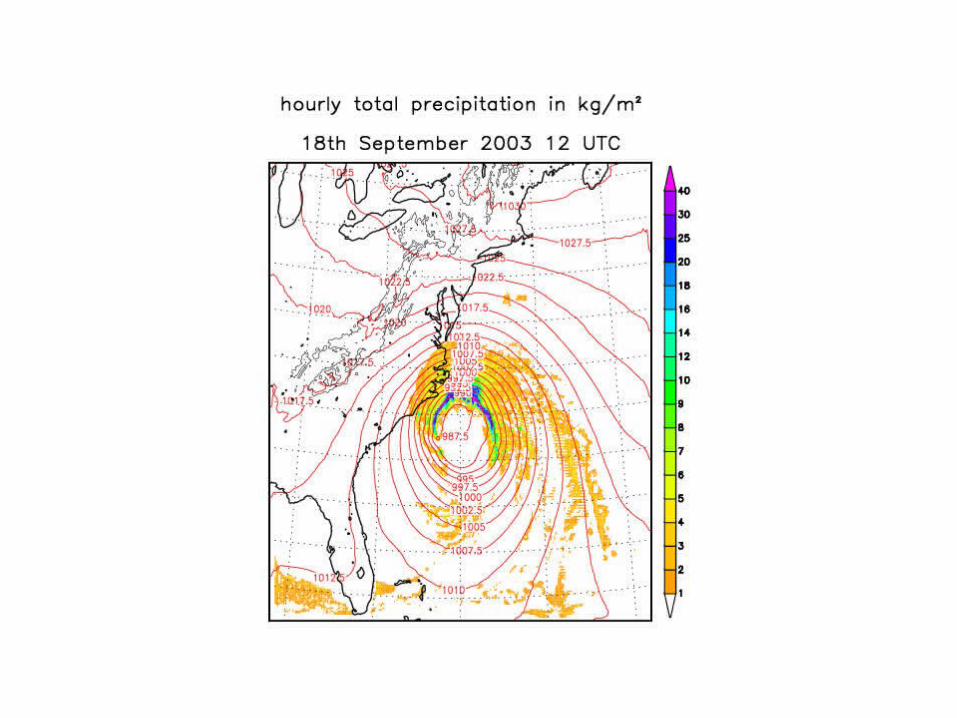
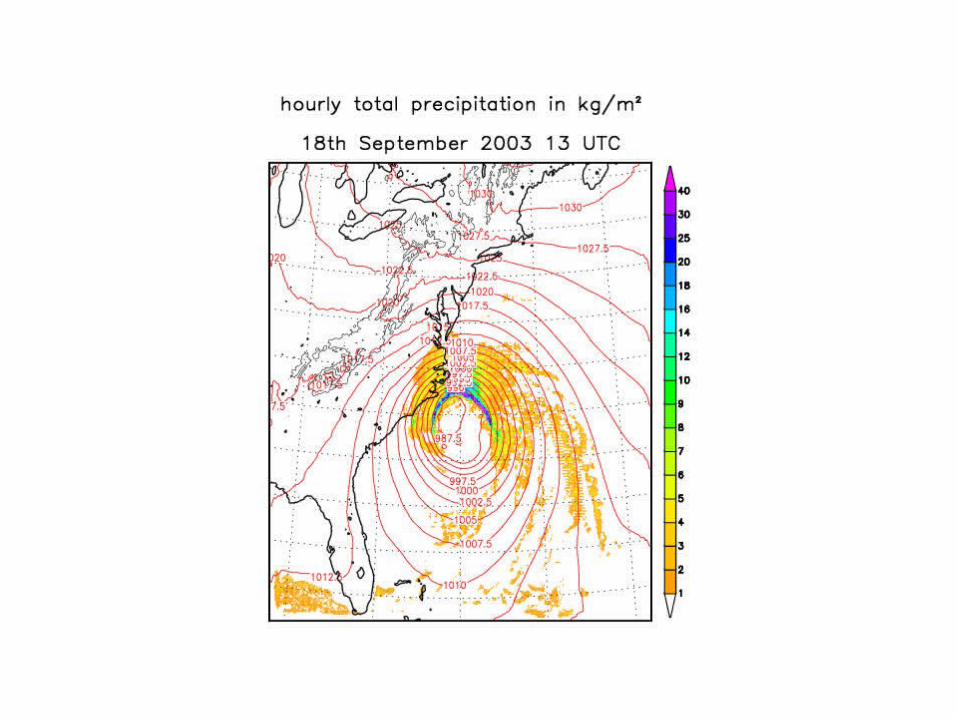
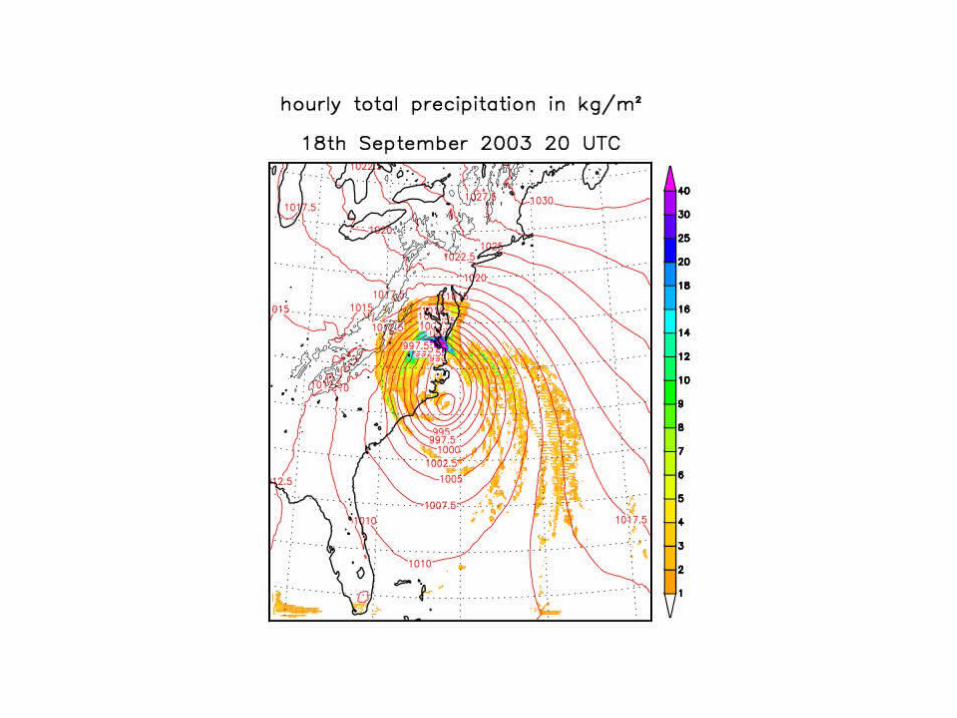
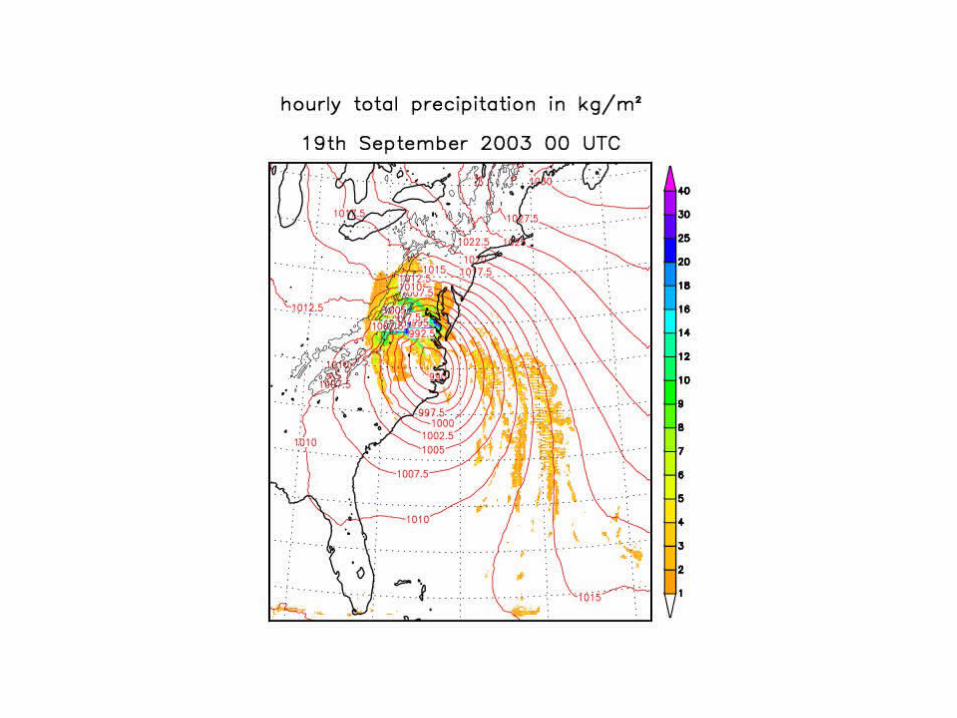
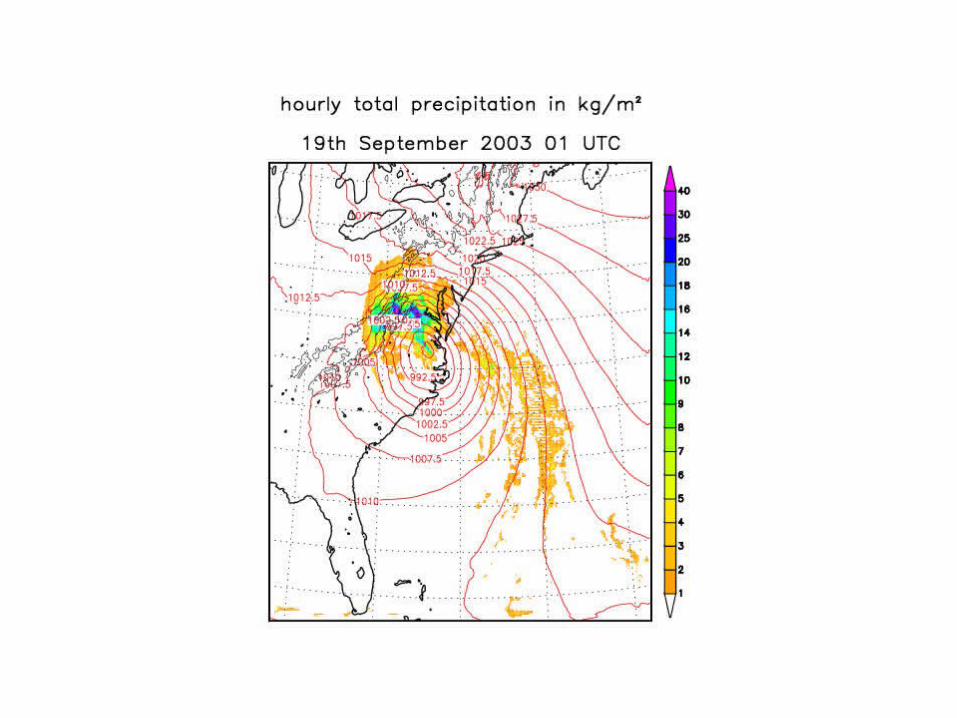
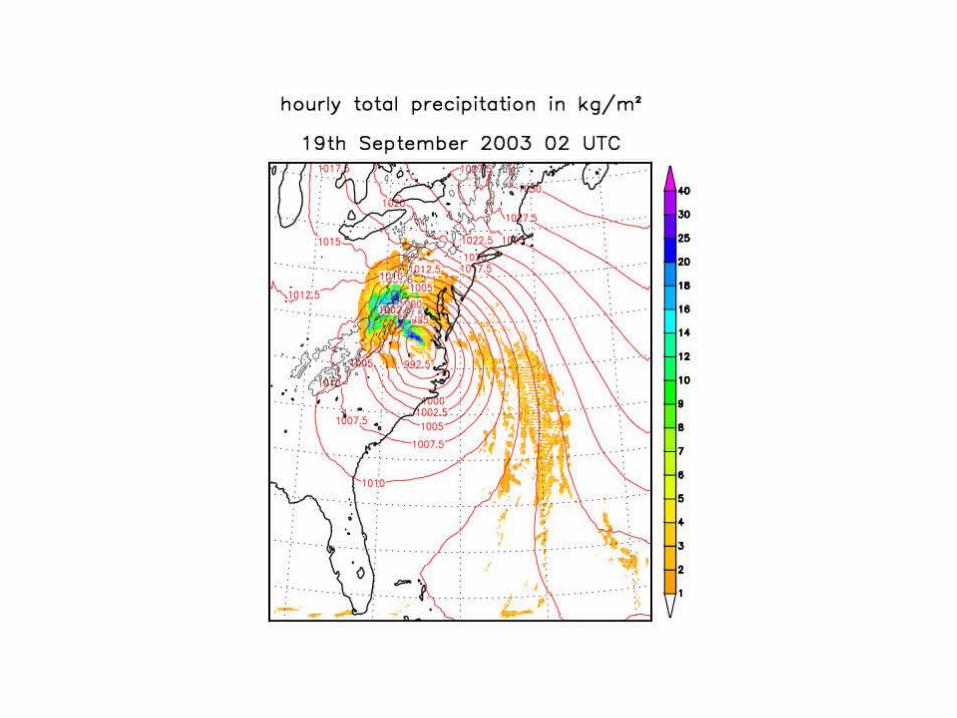
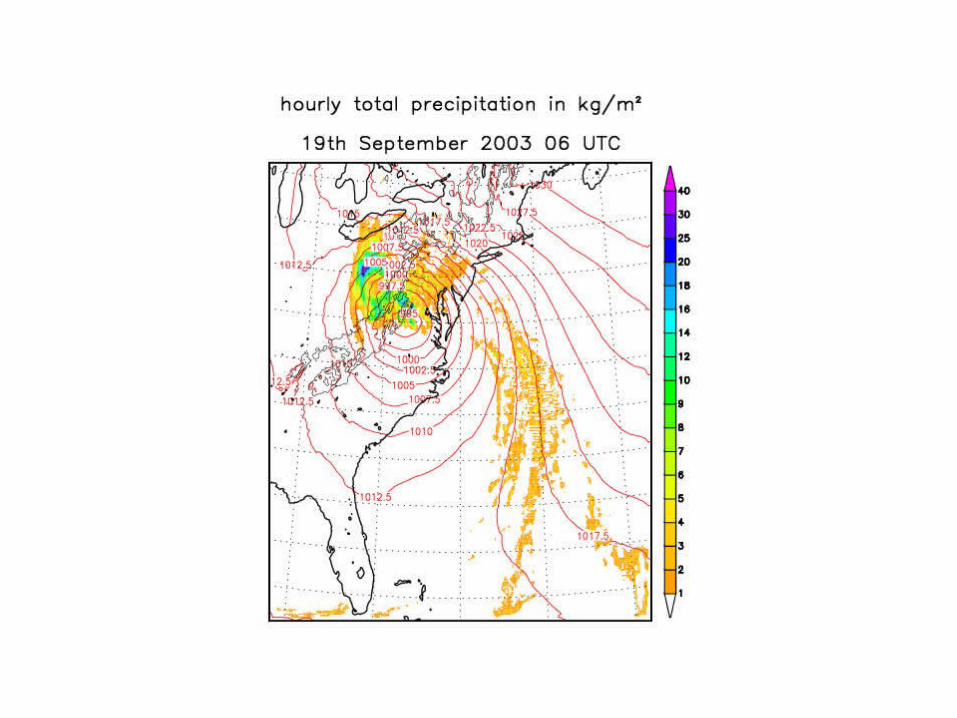
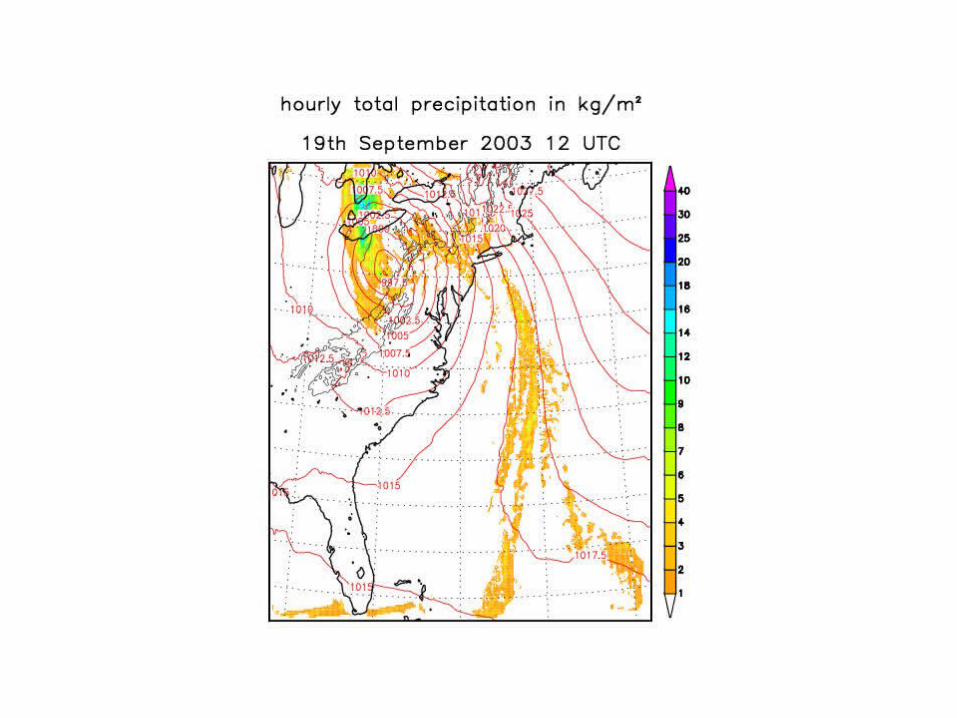
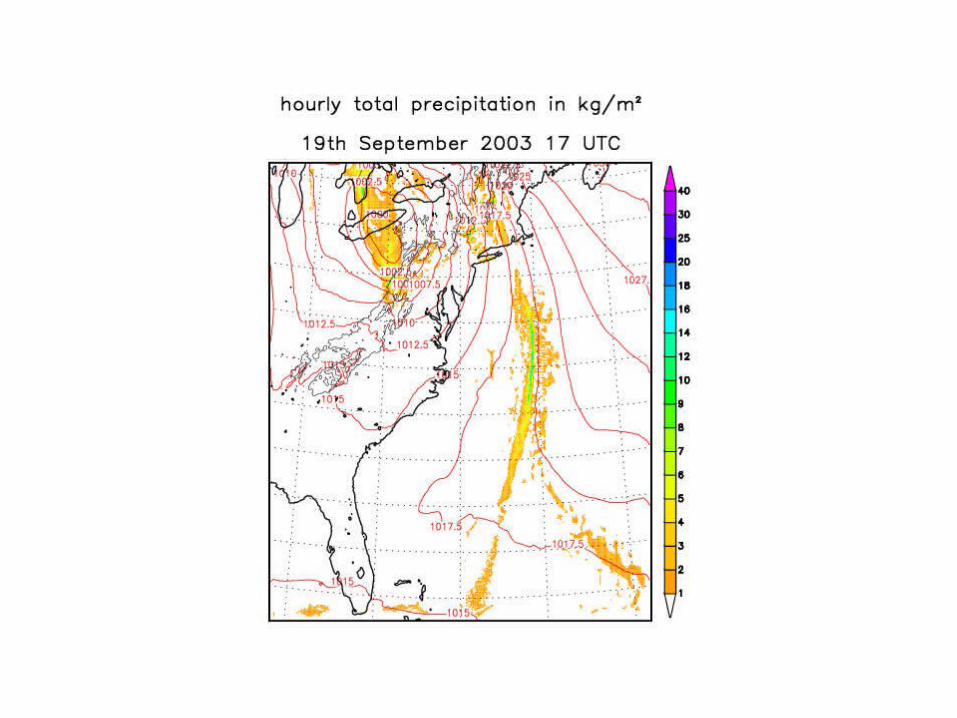
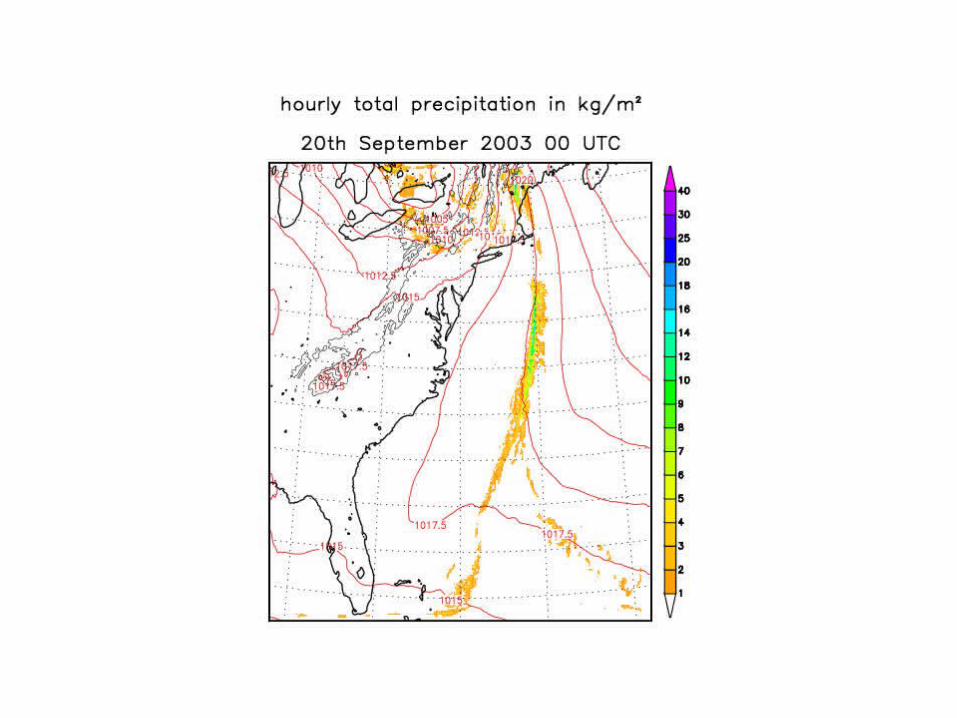
Application example
-Selection of hurricane Isabel /US East Coast,
18 - 20 August 2003)