meteorological data for water years 1988-94 from five ... · pdf filemeteorological data for...
TRANSCRIPT
Meteorological Data for Water Years 1988-94 from Five Weather Stations at Yucca Mountain, Nevada
by Alan L. Flint and William J. Davies
U.S. GEOLOGICAL SURVEY
Open-File Report 96-462
Prepared in cooperation with the
NEVADA OPERATIONS OFFICE,
U.S. DEPARTMENT OF ENERGY, under
Interagency Agreement DE-AI08-92NV10874
Denver, Colorado 1997
U.S. DEPARTMENT OF THE INTERIOR
BRUCE BABBITT, Secretary
U.S. GEOLOGICAL SURVEY
Gordon P. Eaton, Director
The use of firm, trade, and brand names in this report is for identification purposes only and does not constitute endorsement by the U.S. Geological Survey.
For additional information write to:
Chief, Earth Science Investigations ProgramYucca Mountain Project BranchU.S. Geological SurveyBox 25046, Mail Stop 421Denver Federal CenterDenver, CO 80225-0046
Copies of this report can be purchased from:
U.S. Geological Survey Branch of Information Services Box 25286 Denver, CO 80225-0286
CONTENTS
Abstract............................................................................................_^ 1Introduction.........................................................................................._ 1
Study Area Description............................................................_^ 1Instrumentation......................................................................................_^ 3
Meteorological Data.............................................................................................................................................................. 3Suinmary .................................................. 10References Cited.........................................................................................................................................» 10
FIGURE
1. Map showing locations of eight weather station sites at Yucca Mountain, Nevada................................................... 2
TABLES
1. Location, elevation, and date of coverage for each weather station....................................................................... 42. Instrumentation used for each weather station........................................................................................................ 43. Daily meteorological data from weather station WX-3 for June 21,1994............................................................. 54. Maximum and minimum monthly air temperature for five weather stations for water year 1992......................... 85. Total monthly precipitation for five weather stations for water year 1992............................................................. 96. Maximum and minimum monthly air temperature for weather station WX-3 for water years 1988 94............... 97. Total monthly precipitation values for weather station WX-3 for water years 1988-94........................................ 10
CONVERSION FACTORS
Multiply By To obtain
millimeter (mm) 0.03937 inchmeter (m) 3.28 foot
watt (w) 3.412 BTU per hourjoule 9.48 x 10"4 BTU, British thermal unit
kilometer (km) 0.6214 mile (mi)square kilometer (km2) 0.3861 square mile (mi2)
watts (w/m2) per square meter 0.319 BTU per square foot per hourmegaJoules per square meter (MJ/m2) 1141.77 BTU per square foot
__________________kilopascal (kPa)______0.145_______pound-force per square inch___ ________
Temperature in degrees Celsius (°C) may be converted to degrees Fahrenheit (°F) as follows:
°F= (1.8x°C) + 32
CONTENTS III
Meteorological Data for Water Years 1988-94 from Five Weather Stations at Yucca Mountain, NevadaBy Alan L Flint and William J. Davies
Abstract
This report describes meteorological data collected from five weather stations at Yucca Mountain, Nevada, from as early as April 1987 through September 1994. The measurements include solar radiation, temperature, relative humidity, wind speed, wind vector magnitude, wind direction, wind vector direction, barometric pressure, and precipitation. Measurements were made every 10 seconds and averaged every 15 minutes. The data were collected as part of the geologic and hydrologic site-characterization studies of Yucca Mountain, a potential repository for high-level radioactive waste.
Precipitation at the site ranged from a low of 12 millimeters total for water year 1989 to a high of 312 millimeters total for water
year 1993. Air temperature ranged from a low of 15.1 degrees Celsius in December 1990 (water year 1991) to a high of 41.9 degrees Celsius in July 1989 (water year 1989). The weather station network also provides information on the spatial variability of precipitation and temperature.
INTRODUCTION
Yucca Mountain, Nevada, is being evaluated as a potential site for the storage of high-level radioactive waste in a geologic repository (U.S. Department of Energy, 1988). As part of this study, the U.S. Geolog ical Survey (USGS) is collecting meteorological data. Meteorological data are needed to help charac terize present net infiltration rates and to develop models for predicting changes in infiltration rates in response to potential changes in climate and surface characteristics. The data from this study are intended
to support studies of precipitation, infiltration, and evapotranspiration to help characterize the surface- water budget for Yucca Mountain. The purpose of this report is to describe the data collected since 1987, for water year 1988. A water year is the continuous 12-month period that begins October 1 and ends September 30, designated by the calendar year in which it ends.
Study Area Description
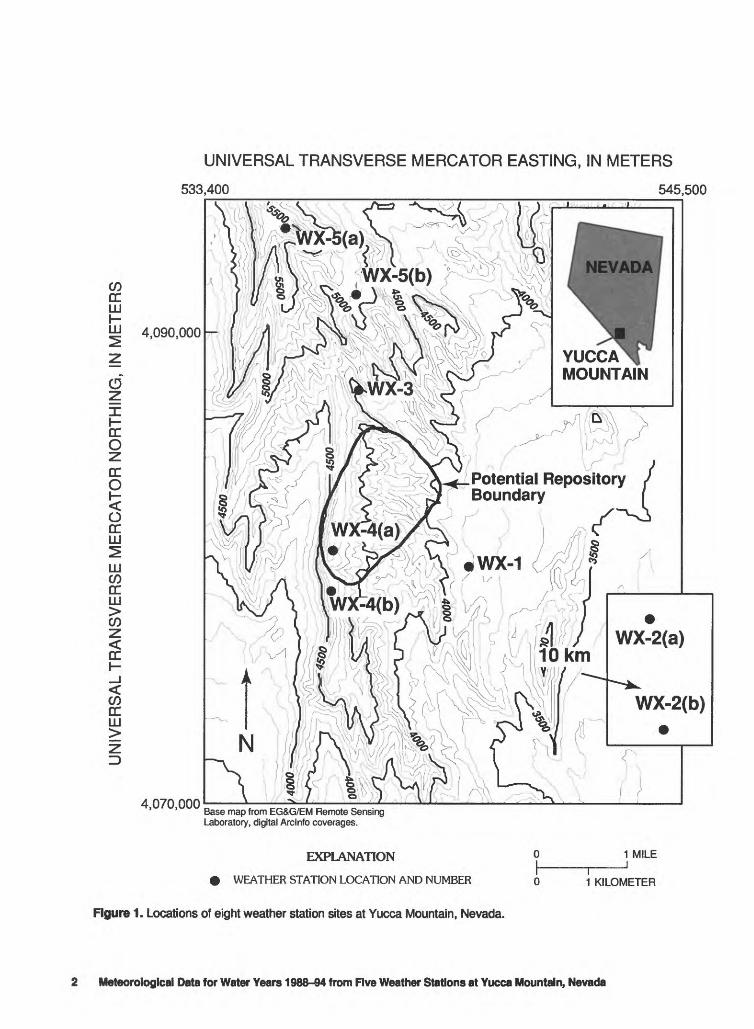
Yucca Mountain, Nevada, is a north-south- trending block-faulted ridge located within the southern part of the Basin and Range physiographic province and within the northern part of the Mojave Desert. It is located in the rain shadow of the Sierra Nevada and is considered one of the driest locations in the United States. The Mojave Desert is classified as a warm desert, receiving most of its precipitation as rain. There are two distinctly different storm patterns affecting the desert climate in this area, one in winter, the other in summer. Winter precipitation tends to be of low intensity and long duration (days) and covers large areas. In contrast, most summer rains result from convective thunderstorms of high intensity and short duration (hours) that cover less than 2 3 km2. Less than 48 km to the north is the southern boundary of the Great Basin Desert, a cold desert. Conditions may arise that allow winter storms to move south from the Great Basin Desert toward the study area, bringing snow and cold temperatures in the winter. Because the study area is near the boundary of two distinctly different desert systems, meteorological conditions may vary considerably. The area of interest in this study is the potential repository and surrounding area encompassed by the weather stations shown in figure 1.
Abstract 1
UNIVERSAL TRANSVERSE MERCATOR EASTING, IN METERS
533,400 545,500
CO CC LLJ
O
CC O
CC O
O CC LU2LU CO CC LU
CO
4,090,000 -
CO CC LU
4,070,000
YUCCA MOUNTAIN
1 Potential Repository r Boundary
Base map from EG&G/EM Remote Sensing Laboratory, digital Arclnfo coverages.
EXPLANATION
WEATHER STATION LOCATION AND NUMBER
Figure 1. Locations of eight weather station sites at Yucca Mountain, Nevada.
1 MILE
I1 KILOMETER
2 Meteorological Data for Water Years 1988-94 from Five Weather Stations at Yucca Mountain, Nevada
Instrumentation
Two weather stations were installed in early 1983 and 1984 to monitor environmental conditions during drilling activities. In 1987, these two weather stations were rebuilt at the same location with new instruments, and two additional weather stations were added to the network (table 1). In 1988, a final weather station was added. The weather station instrumenta tion was chosen for two purposes: (1) To provide local information on solar radiation, temperature, relative humidity, wind speed, wind direction, barometric pressure, and precipitation; and (2) to provide the minimal information necessary to make estimates of potential and actual evapotranspiration using the Penman equation or the Priestley-Taylor equation (Monteith and Unsworth, 1990; Flint and Childs, 1991).
All instruments for each weather station were attached to a tripod except for the tipping-bucket rain gage. The rain gage was located on the ground away from, but within 5 m of the station to minimize wind effects around the weather station. A data logger was used to sample the sensors every 10 seconds and to average the measurements every 15 minutes. The tipping-bucket rain gage was event-driven with the counter checked every 10 seconds. If tips occurred, then the time of the tip was recorded (to within 10 seconds). During high-intensity precipitation events, multiple tips could be recorded. The manufac turer, model, and accuracy for each instrument is given in table 2 (barometric pressure was recorded only at weather station WX-3). In addition to the 15-minute data, a daily record was generated. The daily record consists of total solar radiation data, minimum and maximum air temperature and relative-humidity data, and the time of collection of minimum and maximum air temperature and relative-humidity data. These data were derived from the data collected every 10 seconds. Although the weather station numbers remained the same, they were sometimes relocated from one site to another during the study.
METEOROLOGICAL DATA
The data are presented in four types of files and are available as ASCII files from the USGS (Denver) repository site on the Internet. These data are available online (via anonymous ftp) at ympbsrvl.cr.usgs.gov
or from the Chief, Earth Science Investigations Program. A daily file consists of the ninety-six 15-minute records of time (Pacific standard time), temperature ('C), relative humidity (percent), solar radiation (w/m2), wind speed (m/s), wind vector magnitude (m/s), wind direction (azimuthal degrees) or wind vector (azimuthal degrees), and barometric pressure (kPa). The daily files are designated as WX#_DOY.OYR, where WX# is the weather station number, DOY is the three-digit day of year (001-366), and YR is the last two digits of the calendar year.
Prior to mid-January 1990, the wind direction was recorded as the average of ninety 10-second readings. After mid-January, wind vector direction was calculated instead. The wind vector direction is the wind direction linearly weighted by the wind speed. The higher the wind speed over a 10-second reading, the more weight given to the wind direction. When the wind speed is zero, the wind direction is not counted. The wind vector magnitude is the average magnitude of the wind speed for that wind vector direction. To keep the data files as consistent as possible, a column was created for wind vector magnitude for all daily data files. A -99 appears in that column if the data were not yet collected. (Note: -99 is used to denote missing or bad data in all cases). When the weather station program was changed to collect wind vector magnitude and wind vector direction, the data in the wind direction column changes to wind vector direction. An example of a daily-data file is presented in table 3.
The temperature and relative-humidity sensor was placed in an R.M. Young self-aspirated radiation shield at 2 m above land surface. The relative- humidity data tended to drift over the 1-year field life; at low humidities (<50 percent), the measured relative humidity was insensitive to small changes in humidity. When the calibration data differed between pre-instal- lation and post-installation, a linear drift was assumed and the data were corrected. Data were not adjusted for insensitivity. Insensitivity to small changes can be seen in the daily data files as slowly changing relative humidity at low humidities. The overall trend of humidity appears to be correct when compared with the other weather stations.
Barometric pressure was collected only at weather station WX-3. The horizontal variability barometric pressure probably is small over the study area, but the effects of differences in elevation should be accounted for. For 2 weeks (days 241-254, 1987),
METEOROLOGICAL DATA
Table 1. Location, elevation, and date of coverage for each weather station
[Weather stations WX-1, WX-2, WX-4, and WX-5 were moved during the time of data collection and are indicated by (a) for first location and (b) for second location; Northing and Easting are in Universal Transverse Mercator (NAD 27) coordinates]
Locations(Universal Transverse Mercator1 )
Weather station ID
WX-1
WX-2(a)
WX-2(b)WX-3
WX-4(a)
WX-4(b)
WX-5(a)
WX-5(b)
Northing (meters)
4,076,521
4,075,931
4,071,986
4,080,316
4,076,856
4,075,990
4,083,775
4,082,370
Easting (meters)550,424
564,332
563,430
548,038
547,504
547,481
546,453
547,984
Elevation (meters)
1,163
1,154
1,055
1,351
1,498
1,489
1,789
1,563
Beginning date
01/01/88
04/18/87
03/07/89
07/16/87
07/01/87
06/08/90
06/23/88
10/04/93
Ending date
09/30/94
03/07/89
09/30/94
09/30/94
06/08/90
09/30/94
10/04/93
09/30/94
'Nevada State Coordinates are used to identify location of weather stations cited in this report. These coordi nates are for the central zone of Nevada and are based on a Transverse Mercator projection. The origin of this projection for the central zone of Nevada is latitude 34°45' N., and the central meridian is at longitude 116°40' W. The coordinates listed in this report are in meters north of the baseline and in meters east of the central meridian.
Table 2. Instrumentation used for each weather station
[*C, Celsius; m/s, meters per second; kPa, kilopascals; N/A, not applicable]
Instrument
PyranometerTemperatureRelative humidityWind speedWind directionRain gageBarometric pressureData logger
Manufacturer
Li-CorCampbell ScientificCampbell ScientificMet-OneMet-OneSierra MiscoSetraCampbell Scientific
Model
LI-200SZ207207
024A014A250127021X
Manufacturers' stated accuracy1
5 percent0.4°C5 percent0.11 m/s5 degrees2 percent0.02 kPaN/A
'The actual accuracies may vary depending on each individual instrument calibration. The values reported here are for reference only. Actual instrument calibration data can be requested from the Chief, Earth Science Investigations Program, U.S. Geological Survey, Box 25046, MS-421, Denver, CO 80225).
4 Meteorological Data for Water Years 1988-84 from Five Weather Stations at Yucca Mountain, Nevada
Table 3. Daily meteorological data from weather station WX-3 for June 21,1994
[Time of day in Pacific standard time; °C, degrees Celsius; w/m2, watts per square meter; m/s, meters per second; deg, degrees; kPa, kilopascals]
Time of day
0015003000450100
0115013001450200
0215023002450300
0315033003450400
0415043004450500
0515053005450600
0615063006450700
0715073007450800
0815
083008450900
Air temperature <°C)
21.020.921.020,6
20.620.520.620.7
20.520.219.820.1
20.120.320.119.7
19.419.219.019.0
19.119.520.221.4
22.323.023.525.5
26.326.827.628.1
28.128.228.428.6
Relative humidity (percent)
27282929
29303030
31323333
333334
35
36373839
39393837
36353533
32312929
28272626
Solar radiation
(w/m2)0000
0000
0000
0000
014
8
16346183
7364
236396
448504570554
615
595775817
Mean wind speed (m/s)
2.22.11.71.9
1.82.01.81.7
1.71.91.92.0
1.61.81.72.1
2.12.12.12.2
1.91.81.41.1
0.71.51.32.3
2.52.01.92.2
2.62.42.53.9
Mean wind vector magnitude
(m/s)2.12.01.41.8
1.72.01.81.3
1.51.81.81.9
1.51.71.72.1
2.02.02.02.2
1.81.81.31.0
0.31.51.32.2
2.41.91.6
2.0
2.42.22.23.6
Wind vector direction
(azlmuthal deg)319311302313
309305308330
313309321318
305307313314
317321306321
317308296337
339114115133
126125138140
136114112139
Barometric pressure
(kPa)86.65486.64786.65086.652
86.65786.65486.65086.651
86.65086.65086.65086.645
86.65386.65386.65986.663
86.66786.67686.68086.685
86.69286.70286.70086.705
86.72186.73186.73386.735
86.75186.75986.75586.752
86.753
86.75586.75186.749
METEOROLOGICAL DATA
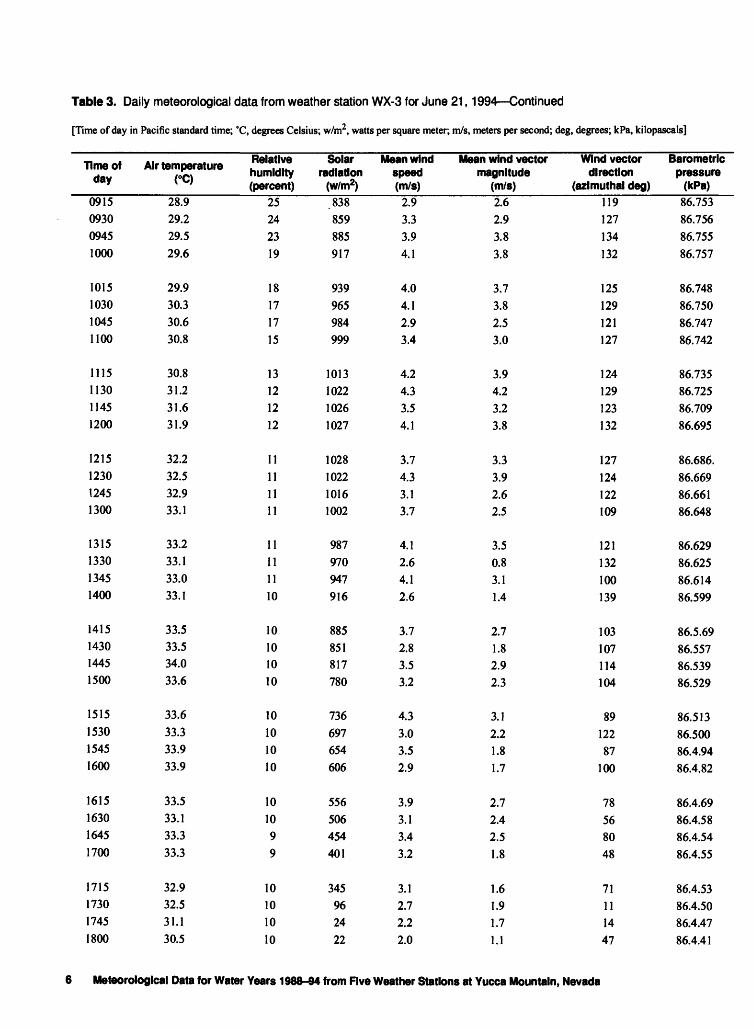
Table 3. Daily meteorological data from weather station WX-3 for June 21,1994 Continued
[Time of day in Pacific standard time; °C, degrees Celsius; w/m2 , watts per square meter; m/s, meters per second; deg, degrees; kPa, kilopascals]
Time of day
0915093009451000
1015103010451100
1115113011451200
1215123012451300
1315133013451400
1415143014451500
1515153015451600
1615163016451700
1715173017451800
Air temperature (°C)
28.929.229.529.6
29.930.330.630.8
30.831.231.631.9
32.232.532.933.1
33.233.133.033.1
33.533.534.033.6
33.633.333.933.9
33.533.133.333.3
32.932.531.130.5
Relative humidity (percent)
25242319
18171715
13121212
11111111
11111110
10101010
10101010
101099
10101010
Solar radiation
(w/m2).838859885917
939965984999
1013102210261027
1028102210161002
987970947916
885851817780
736697654606
556506454401
345962422
Mean wind speed (m/s)
2.93.33.94.1
4.04.12.93.4
4.24.33.54.1
3.74.33.13.7
4.12.64.12.6
3.72.83.53.2
4.33.03.52.9
3.93.13.43.2
3.12.72.22.0
Mean wind vector magnitude
(m/s)2.62.93.83.8
3.73.82.53.0
3.94.23.23.8
3.33.92.62.5
3.50.83.11.4
2.71.82.92.3
3.12.21.81.7
2.72.42.51.8
1.61.91.71.1
Wind vector direction
(azlmuthal deg)119127134132
125129121127
124129123132
127124122109
121132100139
103107114104
8912287
100
78568048
71111447
Barometric pressure
(kPa)86.75386.75686.75586.757
86.74886.75086.74786.742
86.73586.72586.70986.695
86.686.86.66986.66186.648
86.62986.62586.61486.599
86.5.6986.55786.53986.529
86.51386.50086.4.9486.4.82
86.4.6986.4.5886.4.5486.4.55
86.4.5386.4.5086.4.4786.4.41
6 Meteorological Data for Water Years 1988-84 from Five Weather Stations at Yucca Mountain, Nevada
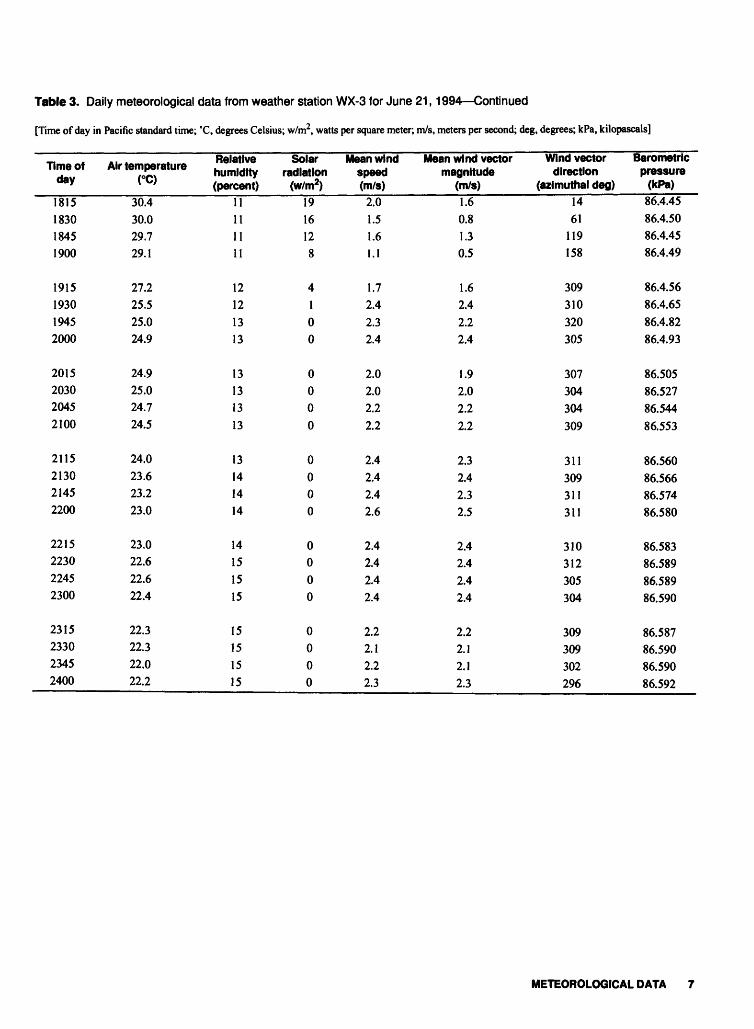
Table 3. Daily meteorological data from weather station WX-3 for June 21,1994 Continued
[Time of day in Pacific standard time; 'C, degrees Celsius; w/m2, watts per square meter; m/s, meters per second; deg, degrees; kPa, kilopascals]
Time of day
1815183018451900
1915193019452000
2015203020452100
2115213021452200
2215223022452300
2315233023452400
Air temperature (°C)
30.430.029.729.1
27.225.525.024.9
24.925.024.724.5
24.023.623.223.0
23.022.622.622.4
22.322.322.022.2
Relative humidity (percent)
11111111
12121313
13131313
13141414
14151515
15151515
Solar radiation
(w/m2)1916128
4100
0000
0000
0000
0000
Mean wind speed (m/s)
2.01.51.61.1
1.72.42.32.4
2.02.02.22.2
2.42.42.42.6
2.42.42.42.4
2.22.12.22.3
Mean wind vector magnitude
(m/s)1.60.81.30.5
1.62.42.22.4
1.92.02.22.2
2.32.42.32.5
2.42.42.42.4
2.22.12.12.3
Wind vector direction
(azimuthal deg)1461
119158
309310320305
307304304309
311309311311
310312305304
309309302296
Barometric pressure
(*Pa)86.4.4586.4.5086.4.4586.4.49
86.4.5686.4.6586.4.8286.4.93
86.50586.52786.54486.553
86.56086.56686.57486.580
86.58386.58986.58986.590
86.58786.59086.59086.592
METEOROLOGICAL DATA
the sensitivity of the data logger was improperly set, and small changes in pressure were not recorded, which can be seen in the daily data files.
The rain gage was a 1-mm-resolution tipping bucket. The high-volume bucket makes the gage insensitive to small amounts of precipitation (<1 mm) but considerably reduces errors due to high-intensity storms. The data are available as yearly files designated as WX#_PPT.OYR, where WX# is the weather station number and YR is the last two digits of the calendar year.
A yearly weather-station file is also available. These files are designated was WX#_DAY.OYR, where WX# is the weather station number and YR is the last two digits of the calendar year. The data consist of day of year, solar radiation (MJ/m2), maximum temperature (°C), mean temperature (°C), minimum temperature (°C), maximum relative humidity (percent), mean relative humidity (percent), minimum relative humidity (percent), maximum wind speed (m/s), mean wind speed (m/s), minimum wind speed (m/s), and total daily precipitation (mm). The data were based on the 15-minute averages. If data were missing for any part of the day, then -99 appears. In addition to the three types of data files, there is also a header file, WX#_HDR.OYR, which provides
information needed to identify the columns in each type of data file.
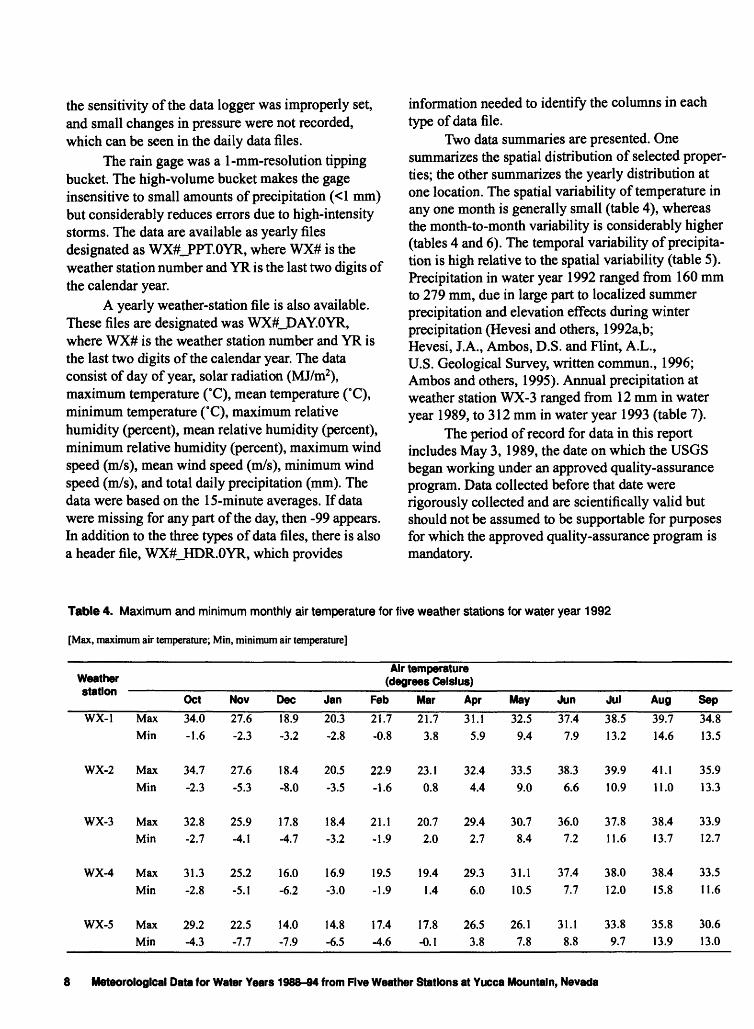
Two data summaries are presented. One summarizes the spatial distribution of selected proper ties; the other summarizes the yearly distribution at one location. The spatial variability of temperature in any one month is generally small (table 4), whereas the month-to-month variability is considerably higher (tables 4 and 6). The temporal variability of precipita tion is high relative to the spatial variability (table 5). Precipitation in water year 1992 ranged from 160 mm to 279 mm, due in large part to localized summer precipitation and elevation effects during winter precipitation (Hevesi and others, 1992a,b; Hevesi, J.A., Ambos, D.S. and Flint, A.L., U.S. Geological Survey, written commun., 1996; Ambos and others, 1995). Annual precipitation at weather station WX-3 ranged from 12 mm in water year 1989, to 312 mm in water year 1993 (table 7).
The period of record for data in this report includes May 3, 1989, the date on which the USGS began working under an approved quality-assurance program. Data collected before that date were rigorously collected and are scientifically valid but should not be assumed to be supportable for purposes for which the approved quality-assurance program is mandatory.
Table 4. Maximum and minimum monthly air temperature for five weather stations for water year 1992
[Max, maximum air temperature; Min, minimum air temperature]
Weather station
WX-1
WX-2
WX-3
WX-4
WX-5
Air temperature (degrees Celsius)
MaxMin
MaxMin
MaxMin
MaxMin
MaxMin
Oct34.0-1.6
34.7-2.3
32.8-2.7
31.3-2.8
29.2-4.3
Nov
27.6-2.3
27.6-5.3
25.9-4.1
25.2-5.1
22.5-7.7
Dec18.9-3.2
18.4-8.0
17.8-4.7
16.0-6.2
14.0-7.9
Jan20.3-2.8
20.5-3.5
18.4-3.2
16.9-3.0
14.8-6.5
Feb21.7-0.8
22.9-1.6
21.1-1.9
19.5-1.9
17.4-4.6
Mar
21.73.8
23.10.8
20.72.0
19.41.4
17.8-0.1
Apr
31.15.9
32.44.4
29.42.7
29.36.0
26.53.8
May32.5
9.4
33.59.0
30.78.4
31.110.5
26.17.8
Jun37.4
7.9
38.36.6
36.07.2
37.47.7
31.18.8
Jul
38.513.2
39.910.9
37.811.6
38.012.0
33.89.7
Aug39.714.6
41.111.0
38.413.7
38.415.8
35.813.9
Sep34.813.5
35.913.3
33.912.7
33.511.6
30.613.0
8 Meteorological Data for Water Years 1988-84 from Five Weather Stations at Yucca Mountain, Nevada
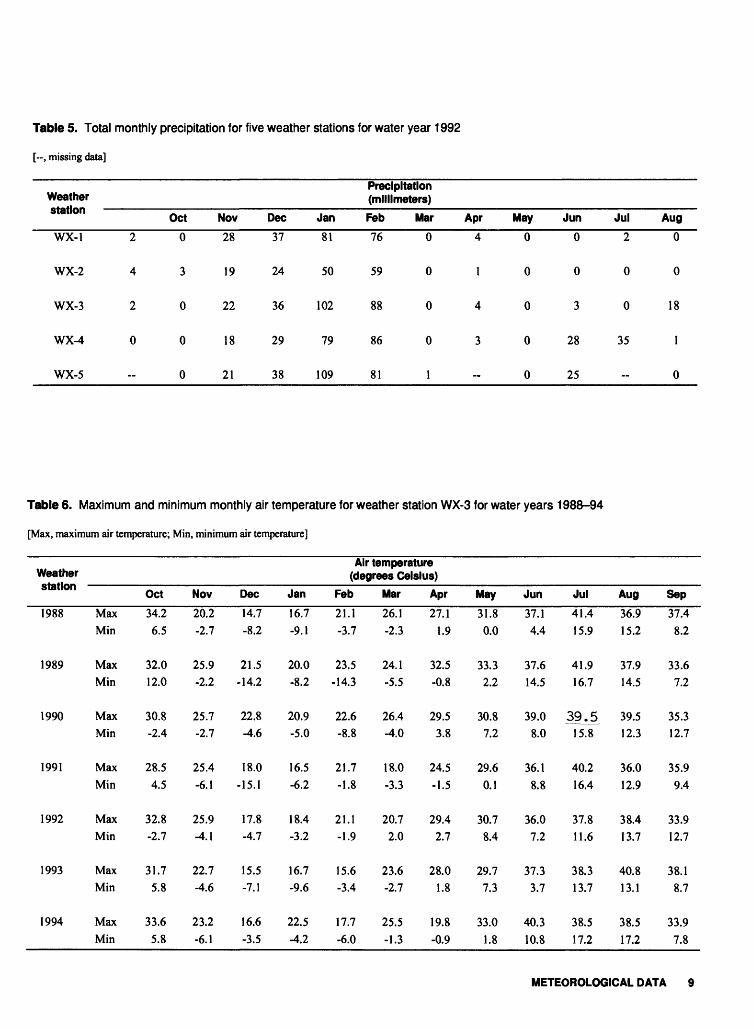
Table 5. Total monthly precipitation for five weather stations for water year 1992
[--, missing data]
Weather station
WX-1
WX-2
WX-3
WX-4
WX-5
Oct
2 0
4 3
2 0
0 0
0
Nov
28
19
22
18
21
Dec37
24
36
29
38
Jan81
50
102
79
109
Precipitation (millimeters)Feb Mar76 0
59 0
88 0
86 0
81 I
Apr
4
1
4
3
~
May
0
0
0
0
0
Table 6. Maximum and minimum monthly air temperature for weather station WX-3 for water years
Jun
0
0
3
28
25
1988-94
Jui2
0
0
35
Aug
0
0
18
1
0
[Max, maximum air temperature; Min, minimum air temperature]
Weather station
1988
1989
1990
1991
1992
1993
1994
Air temperature (degrees Celsius)
MaxMin
MaxMin
MaxMin
MaxMin
MaxMin
MaxMin
MaxMin
Oct
34.26.5
32.012.0
30.8 -2.4
28.54.5
32.8-2.7
31.75.8
33.65.8
Nov Dec
20.2 14.7-2.7 -8.2
25.9 21.5-2.2 -14.2
25.7 22.8 -2.7 -4.6
25.4 18.0-6.1 -15.1
25.9 17.8-4.1 -4.7
22.7 15.5-4.6 -7.1
23.2 16.6-6.1 -3.5
Jan
16.7-9.1
20.0-8.2
20.9 -5.0
16.5-6.2
18.4-3.2
16.7-9.6
22.5-4.2
Feb
21.1-3.7
23.5-14.3
22.6 -8.8
21.7-1.8
21.1-1.9
15.6-3.4
17.7-6.0
Mar Apr
26.1 27.1-2.3 1.9
24.1 32.5-5.5 -0.8
26.4 29.5 -4.0 3.8
18.0 24.5-3.3 -1.5
20.7 29.42.0 2.7
23.6 28.0-2.7 1.8
25.5 19.8-1.3 -0.9
May
31.80.0
33.32.2
30.87.2
29.60.1
30.78.4
29.77.3
33.01.8
Jun
37.14.4
37.614.5
39.0 8.0
36.18.8
36.07.2
37.33.7
40.310.8
Jul
41.415.9
41.916.7
39.515.8
40.216.4
37.811.6
38.313.7
38.517.2
Aug
36.915.2
37.914.5
39.5 12.3
36.012.9
38.413.7
40.813.1
38.517.2
Sep
37.48.2
33.67.2
35.3 12.7
35.99.4
33.912.7
38.18.7
33.97.8
METEOROLOGICAL DATA 9
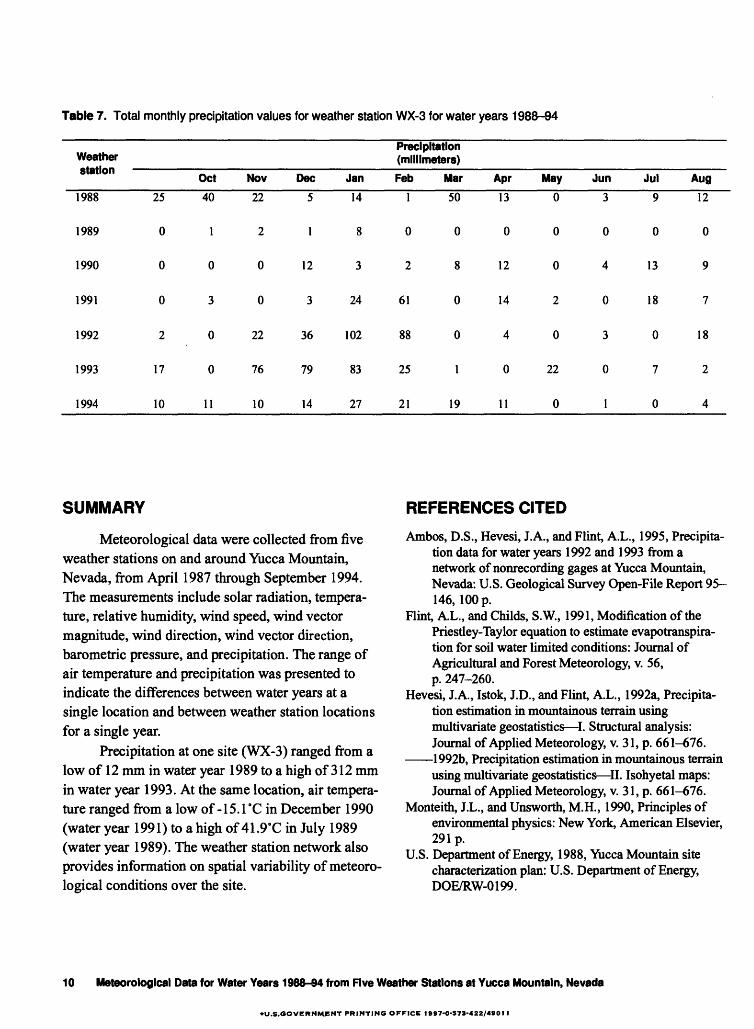
Table 7. Total monthly precipitation values for weather station WX-3 for water years 1988-94
Weather station
1988
1989
1990
1991
1992
1993
1994
Precipitation (millimeters)
25
0
0
0
2
17
10
Oct
40
1
0
3
0
0
11
Nov
22
2
0
0
22
76
10
Dec5
1
12
3
36
79
14
Jan14
8
3
24
102
83
27
Feb
1
0
2
61
88
25
21
Mar
50
0
8
0
0
1
19
Apr
13
0
12
14
4
0
11
May
0
0
0
2
0
22
0
Jun3
0
4
0
3
0
1
Jul
9
0
13
18
0
7
0
Aug12
0
9
7
18
2
4
SUMMARY
Meteorological data were collected from five weather stations on and around Yucca Mountain, Nevada, from April 1987 through September 1994. The measurements include solar radiation, tempera ture, relative humidity, wind speed, wind vector magnitude, wind direction, wind vector direction, barometric pressure, and precipitation. The range of air temperature and precipitation was presented to indicate the differences between water years at a single location and between weather station locations for a single year.
Precipitation at one site (WX-3) ranged from a low of 12 mm in water year 1989 to a high of 312 mm in water year 1993. At the same location, air tempera ture ranged from a low of -15.1 °C in December 1990 (water year 1991) to a high of 41.9'C in July 1989 (water year 1989). The weather station network also provides information on spatial variability of meteoro logical conditions over the site.
REFERENCES CITED
Ambos, D.S., Hevesi, J.A., and Flint, A.L., 1995, Precipita tion data for water years 1992 and 1993 from a network of nonrecording gages at Yucca Mountain, Nevada: U.S. Geological Survey Open-File Report 95- 146, 100 p.
Flint, A.L., and Childs, S.W., 1991, Modification of the Priestley-Taylor equation to estimate evapotranspira- tion for soil water limited conditions: Journal of Agricultural and Forest Meteorology, v. 56, p. 247-260.
Hevesi, J.A., Istok, J.D., and Flint, A.L., 1992a, Precipita tion estimation in mountainous terrain using multivariate geostatistics I. Structural analysis: Journal of Applied Meteorology, v. 31, p. 661-676.
1992b, Precipitation estimation in mountainous terrain using multivariate geostatistics II. Isohyetal maps: Journal of Applied Meteorology, v. 31, p. 661-676.
Monteith, J.L., and Unsworth, M.H., 1990, Principles of environmental physics: New York, American Elsevier, 291 p.
U.S. Department of Energy, 1988, Yucca Mountain site characterization plan: U.S. Department of Energy, DOE/RW-0199.
10 Meteorological Data for Water Years 1988-94 from Five Weather Stations at Yucca Mountain, Nevada
+U.S.COVERNMENT PRINTING OFFICE 1997-0-573-422/4901 I