meteorologicaldrought assessmentinnortheast ... filedownloaded by icelandic ministry of education at...
TRANSCRIPT

Meteorological droughtassessment in north easthighlands of Ethiopia
Yimer MohammedHawassa University, Hawassa, Ethiopia and Dilla University, Dilla, Ethiopia
Fantaw Yimer and Menfese TadesseHawassa University, Hawassa, Ethiopia, and
Kindie TesfayeInternational Maize and Wheat Improvement Center (CIMMYT),
Addis Ababa, Ethiopia
AbstractPurpose – The purpose of this paper is to investigate the patterns and trends of drought incidence in northeast highlands of Ethiopia usingmonthly rainfall record for the period 1984-2014.Design/methodology/approach – Standard precipitation index and Mann – Kendal test were used toanalyze drought incident and trends of drought occurrences, respectively. The spatial extent of droughts inthe study area has been interpolated by inverse distance weighted method using the spatial analyst tool ofArcGIS.Findings – Most of the studied stations experienced drought episodes in 1984, 1987/1988, 1992/1993, 1999,2003/2004 and 2007/2008 which were among the worst drought years in the history of Ethiopia. The year 1984was the most drastic and distinct-wide extreme drought episode in all studied stations. TheMann–Kendal testshows an increasing tendencies of drought at three-month (spring) timescale at all stations though significant(p< 0.05) only at Mekaneselam and decreasing tendencies at three-month (summer) and 12-month timescalesat all stations. The frequency of total drought was the highest in central and north parts of the region in allstudy seasons.Originality/value – This detail drought characterization can be used as bench mark to take comprehensivedrought management measures such as early warning system, preparation and contingency planning, climatechange adaptation programs.
Keywords Drought, Trends, SPI, Extremes, Mann–Kendall
Paper type Research paper
1. IntroductionDrought is a recurrent climate phenomenon which occurs in most parts of the world, withvarying frequency, severity and duration (Wilhite, 1993; Shatanawi et al., 2013). It is difficultto determine the onset and ending time of a drought. It develops slowly, and its impact may
© Yimer Mohammed, Fantaw Yimer, Menfese Tadesse and Kindie Tesfaye. Published by EmeraldPublishing Limited. This article is published under the Creative Commons Attribution (CC BY 4.0)licence. Anyone may reproduce, distribute, translate and create derivative works of this article (forboth commercial & non-commercial purposes), subject to full attribution to the original publicationand authors. The full terms of this licence may be seen at http://creativecommons.org/licences/by/4.0/legalcode
IJCCSM10,1
142
Received 21 December 2016Revised 15April 201715May 2017Accepted 15May 2017
International Journal of ClimateChange Strategies andManagementVol. 10 No. 1, 2018pp. 142-160EmeraldPublishingLimited1756-8692DOI 10.1108/IJCCSM-12-2016-0179
The current issue and full text archive of this journal is available on Emerald Insight at:www.emeraldinsight.com/1756-8692.htm
Dow
nloa
ded
by Ic
elan
dic
Min
istry
of E
duca
tion
At 0
4:43
25
Aug
ust 2
018
(PT)
remain for years after termination of the event (Morid et al., 2006). There is no universallyaccepted definition of drought that applies to all circumstances. Perhaps most definitions arebased on the deficiency of rainfall resulting in water shortage for some activities related touse of water (Wilhite, 1993; Wilhite and Glantz, 1985). Morid et al. (2006), Karavitis (1999)and Szinell et al. (1998) defined drought as “the state of adverse and wide spreadhydrological, environmental, social and economic impacts due to less than generallyanticipated water quantities”.
Droughts are one of the highest natural disasters globally having major impacts onenvironmental, economic and social conditions (Paulo et al., 2012; Morid et al., 2006). Theimpact of drought is governed by the magnitude, duration, frequency and spatial extent ofthe rainfall deficit (Degefu and Bewket, 2013; Zargar et al., 2011). Magnitude refers to theamount of rainfall or water storage deficit at a particular place and specific time. Droughtmagnitude is categorized, in most commonly used indices, into mild, moderate, severe andextreme. Frequency/return period/is the average time between drought events and durationrefers to the length of time that a given drought event stays. The spatial coverage refers tothe areal extent of a specific area affected by a given drought incidence. Usually severe andextreme drought episodes cover wider areas, while mild and moderate drought episodestend to affect localized areas (Degefu and Bewket, 2013).
Scientific literature has commonly classified droughts into four main categories asmeteorological, agricultural, hydrological and socio-economic (Wilhite and Glantz, 1985;Tallaksen and Van Lanen, 2004; Mishra and Singh, 2010). For the purpose of this study,meteorological drought was adopted where rainfall is commonly used for drought analysis.Droughts over a region can be characterized using different indices, which all use rainfalleither alone or in combination with other meteorological elements (Zargar et al., 2011;Edossa et al., 2010).
Although drought is a natural occurring recurrent extreme event (Wilhite, 1993;Shatanawi et al., 2013), various empirical and modeling studies proved that climate changeis very likely to increase the magnitude, frequency and duration of droughts over some partsof the world in the coming decades (IPCC II, 2014, Degefu and Bewket, 2013).
There were severe droughts which have had a substantial impact on the socio-economicand environmental condition of Ethiopia at different times and scales (Table I). For instance,although the recorded history of drought in Ethiopia dates back to 250 BC, its frequency hasincreased over the past few decades and still have been the hallmarks of the country (Meze-Hausken, 2000; Deressa et al., 2010). From 1950s to1980s, droughts occurred on average onceper decade, and recently, it occurred once every three years in Ethiopia (Block, 2008). On theother hand, World Bank (2006) reported that 16 drought events were experienced during1980-2004 which makes Ethiopia the most drought-affected country. The year leading toJune 2011 has been claimed to be the driest in 60 years in some regions of Somalia, NorthernKenya and Southern Ethiopia (USAID/FEWS 2011). Ethiopia faced one of the worstdroughts the country has seen in decades with over 10.2 million people in need of food aid(UN OCHA, 2015). Triggered by El Niño, the rainy seasons in 2015 failed so that the droughtbrought significant impact by limiting agricultural production, straining livelihoods andexacerbating food insecurity among poor and vulnerable households.
From 1986 until 2013, a total of nine El Niño events had occurred. The magnitude ofseven of the El Niño years (1986/1987, 1991/1992, 1994/1995, 2002/2003, 2004/2005, 2006/2007, 2009/2010) were either moderate or weak, while the magnitude of two of them (1987/1988 and 1997/1998) were strong (FAO, 2014). There is a remarkable correspondencebetween annual rainfall in Ethiopia and ENSO events (Haile, 1988).
Meteorologicaldrought
assessment
143
Dow
nloa
ded
by Ic
elan
dic
Min
istry
of E
duca
tion
At 0
4:43
25
Aug
ust 2
018
(PT)

The analysis and forecasting of extreme climatic events has become increasingly relevant tomake planning effective. Although drought is becoming the most common and damagingnatural hazard in Ethiopia, there were no as such detail studies conducted about itsmagnitude, frequency and spatial extent in different regions of Ethiopia (Degefu and Bewket,2013). The same is true in this study area. Hence, to reduce the damages from drought, it iscrucial to characterize drought. Drought characterization at regional and local scales hassignificant implications for drought management such as early warning system (farmerscould be warned before the advent of drought as to when, what and where to cultivate andwhen to sell their animals as well as how to conserve water resources and food), preparationand contingency planning (the government is working toward reorganizing its resourcesbefore the impact of drought is felt, climate change adaptation programs (introduction of off-farm activities and drought resistant crop and animal varieties).
Different indices have been developed through time to quantify the magnitude ofmeteorological drought. Most of these indices are based on direct observed measurement ofclimatic variables such as rainfall, evapotranspiration and temperature (Steinemann et al.,2005). Some of the widely used indices include the Palmer Drought Severity Index (PDSI)(Palmer, 1965), the Percent of Normal, and the Deciles approach (Gibbs andMaher, 1967), theStandard Precipitation Index (SPI) (McKee et al., 1993) and Standard PrecipitationEvapotranspiration Index (SPEI) (Vicente-Serrano et al., 2010).
Each index has its own strength and weakness. For example, PDSI is considered asuseful in monitoring drought at a regional scale and allows comparisons over relativelylarge zones (Steinemann et al., 2005). It also uses water balance models to consider the effectsof temperature and rainfall. However, it does not work well in mountainous areas wherethere are extremes in rainfall or runoff variables (Mpelasoka et al., 2008; Ellis et al., 2010).
Table I.Major drought yearsand their effects indifferent regions ofethiopia for the last50 years
Year Region Impacts
1964-1966 Tigray and Wollo About 1.5 million people were affected and300,000 livestock died
1972-1973 Tigray and Wollo Death of about 200,000 people and 30% oflivestock population in the area
1978-1979 Southern Ethiopia 1.4 million people were affected1983-1984 All regions 8 million people affected, 1 million people died1982 Northern Ethiopia 2 million people were affected1987-1988 All regions 7 million people were affected1991-1992 North, east & south Ethiopia 4 million people were affected1993-1994 Tigray and Wollo 7.6 million people were affected2000 All regions About 10.5 million people were affected2002-2003 All regions About 13 million people were affected; 1.4 million
livestock died2006 Southern Ethiopia (Borena) About 7.4 million people affected; 247,000 livestock
died2008 Southern Ethiopia (Borena) About 26,000 livestock died2008-2009 All regions About 5 million people were affected2011 South-central, southeastern, and eastern
parts of EthiopiaAbout 4.5 million were affected
2015-2016 Northern, Southern and Eastern Ethiopia About 10.2 million people were affected
Sources: Compiled from Degefu (1987), Meze-Hausken (2000), FAO (2003), Segele and Lamb (2005),Amsalu and Adem (2009), Deressa et al. (2010), Famine Early Warning Systems Network (FEWS NET)(2011), Viste et al. (2012) and FDRE (2016)
IJCCSM10,1
144
Dow
nloa
ded
by Ic
elan
dic
Min
istry
of E
duca
tion
At 0
4:43
25
Aug
ust 2
018
(PT)

Moreover PDSI requires large amount of climate and soil moisture data, and they are notsimple to calculate (Degefu and Bewket, 2013; Morid et al., 2006). A brief description of theseand other indices was given in Morid et al. (2006).
The choice of indices for drought monitoring should be based on the quantity and qualityof available climate data, purpose of the study, computational simplicity and its ability toconsistently detect spatial and temporal variations of a drought event (Morid et al., 2006).Keyantash and Dracup (2002) also indicated that drought indices must be statisticallyrobust and easily calculated, and have a clear and comprehensible calculation procedure.
In this study, SPI, which is currently used widely for its multiple advantages, has beenused. The SPI was proposed by McKee et al. (1993) and has been used frequently during thepast two decades (Hirschi et al., 2011; Vicente-Serrano et al., 2015). The robustness of SPIover the other drought indices has been reported in many studies (Vicente-Serrano et al.,2015; Viste et al., 2012; WMO, 2012; Hirschi et al., 2011; Hayes et al., 1999; Guttman, 1998;Mpelasoka et al., 2008). In addition to its simplicity and ease of calculation, in regions likeEthiopia, where the access to data is limited, there are good reasons for choosing a rainfall-based drought measure (SPI) (El Kenawy et al., 2016; Degefu and Bewket, 2013; Viste et al.,2012). Details of SPI computation can be accessed in the user guides of SPI (WMO 2012).
The objective of this paper is therefore to monitor the magnitude, duration, frequency,spatial variability and trends of drought incidence in South Wollo, north east highlands ofEthiopia.
2. Materials and methods2.1 Description of the study areaSouthWollo zone is located in the north east part of Ethiopia lying between 10°120N and 11°400N and 38°300E and 40°050E. Its zonal capital, Dessie, is found 400 kms North of AddisAbaba. It is one of the drought-prone and aid-dependent areas in Amhara Regional State(Bewket and Conway, 2007). The study area covers a total area of 17053.45 km2 with 18rural and 2 urban districts.
SouthWollo is characterized by diverse topographic features in which high mountainousand deeply incised canyons and gorges, valleys and plateaus with steep slopes dominate itsmost parts (Coltorti et al., 2007). The elevation ranged from the dry plains at 1,000 m altitudein the east to the high peaks above 3,500 m altitude in the west. However high-land areasranging between 1,500 and 3,500 m altitude are the dominating feature of South Wollo(Rosell and Holmer, 2007). Because of the diverse topography, the study area experiencesdifferent climatic conditions that range from hot and arid lowlands in the eastern part tocold and humid highlands in the western part.
The mean annual temperature varies from less than 5°C in the western highlands to 22°Cin the eastern lowlands. The annual rainfall varies between less than 1,000 mm in thewestern part to more than 1,200 mm in the eastern part. Bimodal rainfall pattern withshorter spring (March-May) and longer summer (June-August) characterizes the study areawhich leads to two harvest periods. The spring season is very influential for mid to highlatitude areas, whereas the mid lands to lowland areas mainly depend on the summer rain.Except a few pocket areas where small-scale irrigation is practiced, crop production israinfed.
As the topography is very rugged, soil erosion was a critical problem in the study area. Itis highly degraded and deforested in terms of indigenous trees but does have considerableeucalyptus plantations. Alpine species unique to extreme highland areas are found inwestern highland parts of the study area. Local people in the area are engaged in subsistenceagriculture for their livelihood. Unlike other areas of East Africa where highlands generally
Meteorologicaldrought
assessment
145
Dow
nloa
ded
by Ic
elan
dic
Min
istry
of E
duca
tion
At 0
4:43
25
Aug
ust 2
018
(PT)

are the most food secure parts of a country, the opposite often is the case in Ethiopia. In fact,the crowded, steep-sloped highlands above 2,000 metres including large parts of SouthWollo, are among the country’s most famine-prone areas (Little et al., 2006) (Figure 1).
2.2 Data sourceMonthly rainfall data from six stations for the period (1984-2014) were obtained fromEthiopian National Meteorological Agency (NMA) and used as an input variable to calculatemeteorological drought. Initially, we collected rainfall data from 10 stations found in thestudy area. However, due to their missing data and shorter length of records, we onlyselected the six stations.
2.3 Standard Precipitation Index computationSPI was designed to quantify the rainfall deficit for multiple timescales in the studiedstations. The SPI is a z-score and represents the drought event departure from the mean,expressed in standard deviation units. SPI is a normalized index in time and space. Thisfeature allows comparisons of SPI values among different locations.
Although SPI can be calculated from 1 month up to 72 months, 1-24 months is the bestpractical range of application (Guttman, 1999; WMO, 2012). We, therefore, computed the SPIvalues at two time-scales, i.e. 3 months (SPI-3) and 12 months or annual (SPI-12). The SPI-3was used to assess droughts during spring (belg) and summer (kiremt) seasons whichrepresent the shorter and longer rain seasons, respectively, and SPI-12 was used to assessthe annual drought. Positive SPI values indicated greater than mean rainfall and negativevalues indicated less than mean rainfall.
For each month of the calendar year, new data series were created, with the elementsequal to corresponding rainfall moving sums (Degefu and Bewket, 2013). Then, the SPIvalue provides a comparison of the rainfall over a specific period with the rainfall totals
Figure 1.Locationmap ofSouthWollo andmeteorologicalstations used in thisstudy
IJCCSM10,1
146
Dow
nloa
ded
by Ic
elan
dic
Min
istry
of E
duca
tion
At 0
4:43
25
Aug
ust 2
018
(PT)

from the same period for all the years included in the historical record (Shahid, 2008). It isessentially a seasonally normalized, backwards-looking moving average of precipitation.For example, the three-month SPI calculated for August 2005 used the total rainfall of June-July-August 2005 and compared with the June-August rainfall totals of all the yearsconsidered in the study. Similarly, the 12-month SPI for December 2005 used the rainfalltotal for January 2005 to December 2005.
Conceptually, SPI is equivalent to theZ-score used in statistics, and it is calculated as:
SPIij ¼Xij " m ij
aij
where SPIij is the SPI of the ith month at the jth timescale, Xij is rainfall total for the ithmonth at the jth time scale, lij and aij are the long-term mean and standard deviationassociated with the ith month at the jth time scale, respectively.
In this study, SPI values were produced for each month of the year using SPI_SL.6.exeprogram developed by Colorado Climate Center (available at http://ulysses.atmos.colostate.edu/SPI.html).
This program classified drought events in four magnitude classes, i.e. if SPI rangesbetween 0 and"0.99, it is mild drought;"1.00 and"1.49, it is moderate drought;"1.50 and"1.99, it is severe drought; and extreme drought if SPI is "2.00 or less (McKee et al., 1993;WMO, 2012). Each drought event has a duration defined by its beginning and end.
2.4 Methods for smoothing time series data and trend detectionThe rank-based nonparametric Mann–Kendall (MK) test (Mann, 1945; Kendall, 1975) hasbeen commonly used to assess the significance of monotonic trends in hydro-meteorological time series. Another rank-based nonparametric test, the Spearman’s rho(SR) test (Lehmann, 1975; Sneyers, 1990), has sometimes been applied to detect trends inhydrological data. The study of Yue et al. (2002) and Viste et al. (2012) noted that thesetwo tests have almost the same power to identify trends in time series. In comparison tothe parametric t test, the common use of the nonparametric tests is mainly due to theconsideration that they are more suitable for the situations of non-normal data,incomplete data, and missing data problems, which frequently occur in hydro-meteorological studies. MK test simply calculates whether the variable is increasing ordecreasing with time (Collins, 2009).
MK test, used by many researchers for trend detection due to its robustness for non-normally distributed data, was applied in this study to assess trends in the time series data(Kendall, 1975; Mann, 1945). However, theMK test requires the time series data to be seriallyindependent (Petrow and Merz, 2009). The standard p-values obtained from it are based onan assumption of independence between observations. The presence of a significant positiveserial correlation tends to overestimate the significance of the trend (Petrow and Merz. 2009;Yue et al., 2002). Thus, the time series data should be tested for serial correlation and shouldbe corrected if there is any significant autocorrelation (Petrow and Merz, 2009; Burn et al.,2010) before subjected the data to the MK trend test. To improve the performance of the test(MK), the most widely used procedure of the trend-free pre-whitening (TFPW) method canbe applied to remove serial correlation from the time series, and hence to eliminate the effectof serial correlation on the MK test (Yue et al., 2002, 2003; Petrow and Merz, 2009). In thisstudy, we found serial correlation of six out of eighteen time scales. However, onlyAmbamariam and Wereilu at 12-month timescale showed significant autocorrelation (p =0.59 and 0.55), respectively. TFPW method was applied to remove the autocorrelation of
Meteorologicaldrought
assessment
147
Dow
nloa
ded
by Ic
elan
dic
Min
istry
of E
duca
tion
At 0
4:43
25
Aug
ust 2
018
(PT)

these two stations following the works of Petrow and Merz (2009), Yue et al. (2002). Finally,we run the MK test. For detailed MK test statistics, see Kendall (1975) and Mann (1945) andtheMK test manual prepared by Finnish Meteorological Institute (2002).
2.5 Mapping spatial distribution of drought incidencesThe output from the SPI program is used as an input to ArcGIS to generate drought severitymaps for the study area at 3 and 12-month time scales. To assess the spatial extent ofdroughts in the study area, SPI time series values of each meteorological station have beeninterpolated by Inverse Distance Weighted (IDW) method using the Spatial Analyst tool ofArcGIS. The IDW method gives better representation for interpolation of rainfalldistribution over heterogeneous topographic terrain (Tagel et al., 2011).
3. ResultsThe results of the study are discussed under three sub-topics:
(1) frequency and magnitude of drought events;(2) trends of occurrences of drought events;(3) spatial patterns of drought events.
3.1 Magnitude and frequency of drought eventsRainfall is bimodal in the study area (Figure 2). The contribution of summer (long rainperiod) rainfall to the average annual rainfall across stations was very high rangingfrom 65.7 per cent at Ambamariam to 53.56 per cent at Dessie. The number of droughtmonths with different magnitude classes at short and long timescales (3 and 12-months)is shown on Figure 3. Drought months for 3 months (belg and kiremt rainfall) and 12months (annual rainfall) were calculated using SPI. Drought frequency, in this study,was measured by the number of years which experienced negative SPI values in thetotal time series of 30 years.
3.1.1 Spring season. The total number of drought events with mild, moderate, severe andextreme intensities computed at three-month timescale (March-May) was accounted for 46per cent in spring season in all stations except Combolcha and Ambamariam (not shownhere). However, they had varied magnitude classes. Extreme magnitude droughts occurredfor 2 months at Ambamariam, Combolcha and Dessie. As the analysis of three-monthtimescale (March-May) showed, the year 1988, 1999, 2004 and 2007-2009 were drought yearsacross all studied stations. Except Haik and Wereilu which had severe drought magnitude,
Figure 2.Bimodal rainfalldistribution of thestudy area 0
100
200
300
400
Jan Feb Mar Apr May Jun Jul Aug Sep Oct Nov Dec
Rain
fall
(mm
)
AmbamariamCombolchaDessieHaikMekaneselamWereilu
IJCCSM10,1
148
Dow
nloa
ded
by Ic
elan
dic
Min
istry
of E
duca
tion
At 0
4:43
25
Aug
ust 2
018
(PT)

Figure 3.Magnitude and
frequency of SPIvalues at annual,
summer and springtime scales
Annual
–3–2–1
0123
1984
1987
1990
1993
1996
1999
2002
2005
2008
2011
2014
SPI v
alue
Ambamariam
– 4– 3– 2– 1
0123
1984
1987
1990
1993
1996
1999
2002
2005
2008
2011
2014
SPI v
alue
Combolcha
–4–3–2–1
0123
1984
1987
1990
1993
1996
1999
2002
2005
2008
2011
2014
SPI v
alue
Dessie
–3
–2
–1
0
1
2
3
1984
1987
1990
1993
1996
1999
2002
2005
2008
2011
2014
SPI v
alue
Haik
–3–2–1
0123
1984
1987
1990
1993
1996
1999
2002
2005
2008
2011
2014
SPI v
alue
Mekaneselam
–3
–2
–1
0
1
2
1984
1987
1990
1993
1996
1999
2002
2005
2008
2011
2014
SPI v
alue
Wereilu
Summer
–3
–2
–1
0
1
2
1984
1987
1990
1993
1996
1999
2002
2005
2008
2011
2014
SPI
valu
e
Ambamariam
–4–3–2–1
012
1984
1987
1990
1993
1996
1999
2002
2005
2008
2011
2014
SPI
Valu
e
Combolcha
–4–3–2–1
0123
1984
1987
1990
1993
1996
1999
2002
2005
2008
2011
2014
SPI v
alue
Dessie
–3
–2
–1
0
1
2
3
1984
1987
1990
1993
1996
1999
2002
2005
2008
2011
2014
SPI v
alue
Haik
–4–3–2–1
012
1984
1987
1990
1993
1996
1999
2002
2005
2008
2011
2014
SPI v
alue
Mekaneselam
–3
–2
–1
0
1
2
1984
1987
1990
1993
1996
1999
2002
2005
2008
2011
2014
SPI v
alue
Wereilu
(continued)
Meteorologicaldrought
assessment
149
Dow
nloa
ded
by Ic
elan
dic
Min
istry
of E
duca
tion
At 0
4:43
25
Aug
ust 2
018
(PT)

extreme drought was recorded in 1999 in all stations ranging from "2.09 to "2.61. In theremaining drought years, the drought magnitude varied from mild to extreme in whichAmbamariam and Dessie had extreme drought in 2008 and Combolcha and Wereiluexperienced extreme drought in 2009.
3.1.2 Summer season. The total number of drought events at the three-month timescale(June-August) in the entire period of analysis was found between 12 months at Dessie and 18months at Mekaneselam, respectively. In addition to 1984 drought year, Ambamariam hadextreme (SPI value "2) drought at this timescale (June-August) in 1987 and Wereilu withSPI value of "2.39 in 1996. The worst drought was recorded in 1984 which had substantialimpact on the region. Even though its magnitude varied, drought occurred across the studyarea at this timescale in 1984, 1987, 1992-1993, 2004 and 2008. The frequency of occurrencesof drought at this season was the highest at Mekaneselam (60 per cent) and the lowest atDessie (53 per cent) implying that Mekaneselam experienced one drought episode in almostevery two to three years.
3.1.3 Annual drought. The total number of drought months at 12 month timescale(January-December) was found between 12 at Wereilu and 16 at Ambamariam whichconstitutes 40 and 53 per cent of the total number of drought incidences in the study period,respectively. At this time scale, the highest frequency of extreme drought was recorded atWereilu in 1984 and 1996 with SPI value of "2.24 and "2.33, respectively. The year 1984was the worst drought across the region with SPI value ranging from "1.9 to "3.17.Although there was varying degree of severity, drought was recorded across the studyregion in 1984, 1987, 2004 and 2008-2009. The total number of moderate droughts at 12month timescale was the highest at Ambamariam and Mekaneselam with 4 and 6 months,respectively. This study confirms that the frequency of occurrences of droughts at summerwas highest at Ambamariam.
Figure 3.
Spring
–3
–2
–1
0
1
2
1984
1987
1990
1993
1996
1999
2002
2005
2008
2011
2014
SPI
valu
e
Ambamariam
–3–2–10123
1984
1987
1990
1993
1996
1999
2002
2005
2008
2011
2014
SPI v
alue
Combolcha
–3–2–10123
1984
1987
1990
1993
1996
1999
2002
2005
2008
2011
2014
SPI v
alue
Dessie
–3
–2
–1
0
1
2
1984
1987
1990
1993
1996
1999
2002
2005
2008
2011
2014
Axi
s Ti
tle
Haik
–3–2–10123
1984
1987
1990
1993
1996
1999
2002
2005
2008
2011
2014
SPI v
alue
Mekaneselam
–3–2–10123
1984
1987
1990
1993
1996
1999
2002
2005
2008
2011
2014
SPI v
alue
Wereilu
IJCCSM10,1
150
Dow
nloa
ded
by Ic
elan
dic
Min
istry
of E
duca
tion
At 0
4:43
25
Aug
ust 2
018
(PT)

There is a remarkable correspondence between rainfall in Ethiopia and ENSO events(Haile, 1988). When past ENSO events are compared with drought and famine periodsin Ethiopia, they show a remarkable association. Recent documented droughts ofEthiopia in 1987-1988, 1991-1992, 1993-1994, 2002-2003, 2008-2009, 2011, 2015-2016were all strong El Nino years (UN OCHA, 2015; FAO, 2014). This suggests thatEthiopian intense and extended drought periods either coincide or follow El Ninoevents. In recent years, the meteorological droughts are increasing especially in spring(belg) season (Figure 3) in the study region, and they have strong correlation with the ElNino events. Forecasting the occurrences of El Nino events will provide insights toestimate drought occurrences and plan adaptation strategies to minimize the associatedrisks.
3.2 Trends of drought occurrencesTrends of drought occurrences for 3 months (spring and summer) and 12 months (annual)timescales were shown in Figure 4. SPI values of May, August and December wereconsidered to represent the drought conditions from March-May (spring season), June-August (summer season) and January-December (annual rainfall), respectively.
The computed SPI values for 3 months timescale during spring revealed that theoccurrence of negative rainfall anomalies or frequent droughts were observed in the 1980sand 2000s and positive rainfall anomalies in the 1990s at most of the meteorological stations.The SPI value for 3 months timescale during summer showed increasing trends, whichindicates declining of occurrences of droughts from time to time across the study stations.The SPI value for 12 months (annual) timescale showed negative rainfall anomalies at 1980s,the beginning of 1990s and after the mid of 2000s, while positive rainfall anomalies wereobserved at the end of 1990s and beginning of 2000s in the studied period.
Figure 4.TheMann–Kendall’strend test for spring,summer and annual
time scales
–1.5
–1
–0.5
0
SPI v
alue
Trends of SPI value at spring season
*
00.20.40.60.8
SPI v
alue
Trends of SPI value at summer season
** ** *
–0.4
–0.2
0
0.2
0.4
SPI v
alue
Trends of SPI value at annual !me scale
Notes: *Significant at p < 0.05 level;**significant at p < 0.01 level
Meteorologicaldrought
assessment
151
Dow
nloa
ded
by Ic
elan
dic
Min
istry
of E
duca
tion
At 0
4:43
25
Aug
ust 2
018
(PT)
The MK trend test showed decreasing changes in SPI values in all stations suggestingincreasing tendency of drought incidence at the three-month timescales during spring(Figure 4) However, significant trend (p < 0.05) was observed only at Mekaneselam station.On the other hand, the SPI values at the three-month timescale during summer showedincreasing changes across stations, however, significant at Dessie, Haik and Mekaneselam(p < 0.05). Similar increasing trend of drought was also observed at 12-month timescale inall stations except Combolcha and Mekaneselam. However, the changes were notsignificant.
The trend analysis shows that there was no statistical evidence of any positive ornegative trend of meteorological drought severity and frequency for the study area exceptMekaneselam at the three-month timescale during spring and Dessie, Haik andMekaneselam at the three-month timescale during summer. Although trends at all time-scales were not statistically significant, increasing tendencies of drought were observedduring spring season and decreasing tendencies of drought during summer and annualscale in the study region.
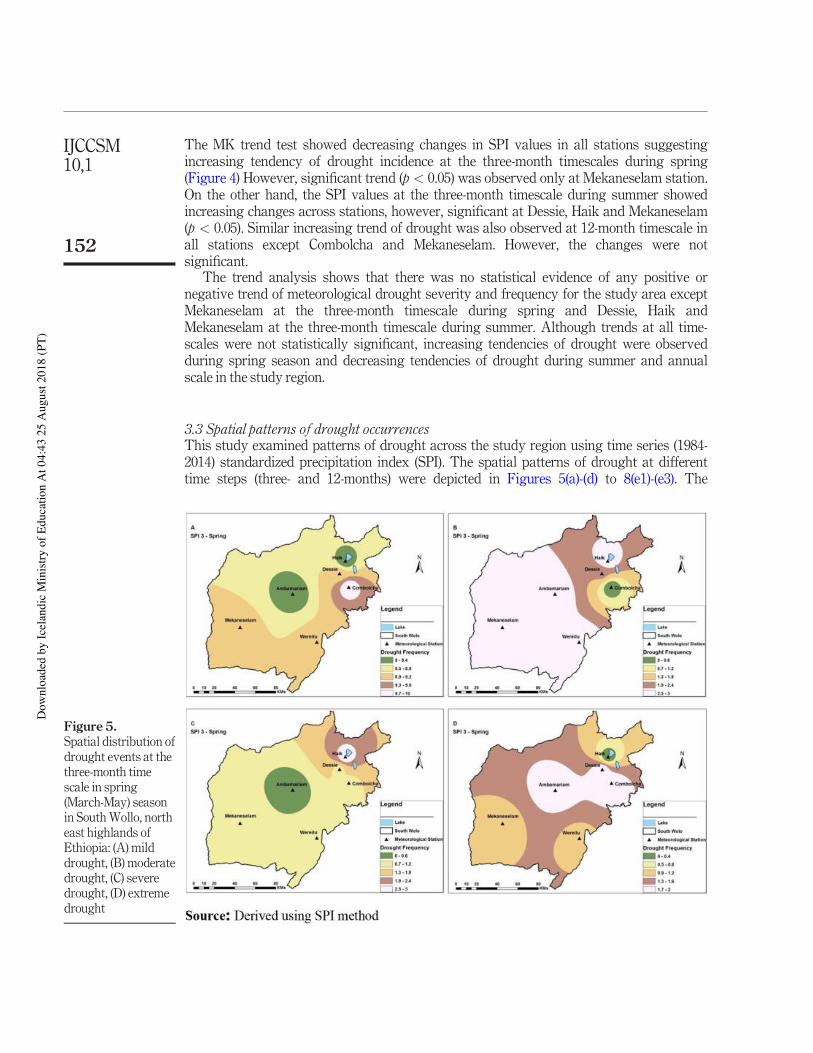
3.3 Spatial patterns of drought occurrencesThis study examined patterns of drought across the study region using time series (1984-2014) standardized precipitation index (SPI). The spatial patterns of drought at differenttime steps (three- and 12-months) were depicted in Figures 5(a)-(d) to 8(e1)-(e3). The
Figure 5.Spatial distribution ofdrought events at thethree-month timescale in spring(March-May) seasonin SouthWollo, northeast highlands ofEthiopia: (A) milddrought, (B) moderatedrought, (C) severedrought, (D) extremedrought
IJCCSM10,1
152
Dow
nloa
ded
by Ic
elan
dic
Min
istry
of E
duca
tion
At 0
4:43
25
Aug
ust 2
018
(PT)

frequencies of drought for different magnitude classes and timescales show complex andlocal scale spatial patterns.
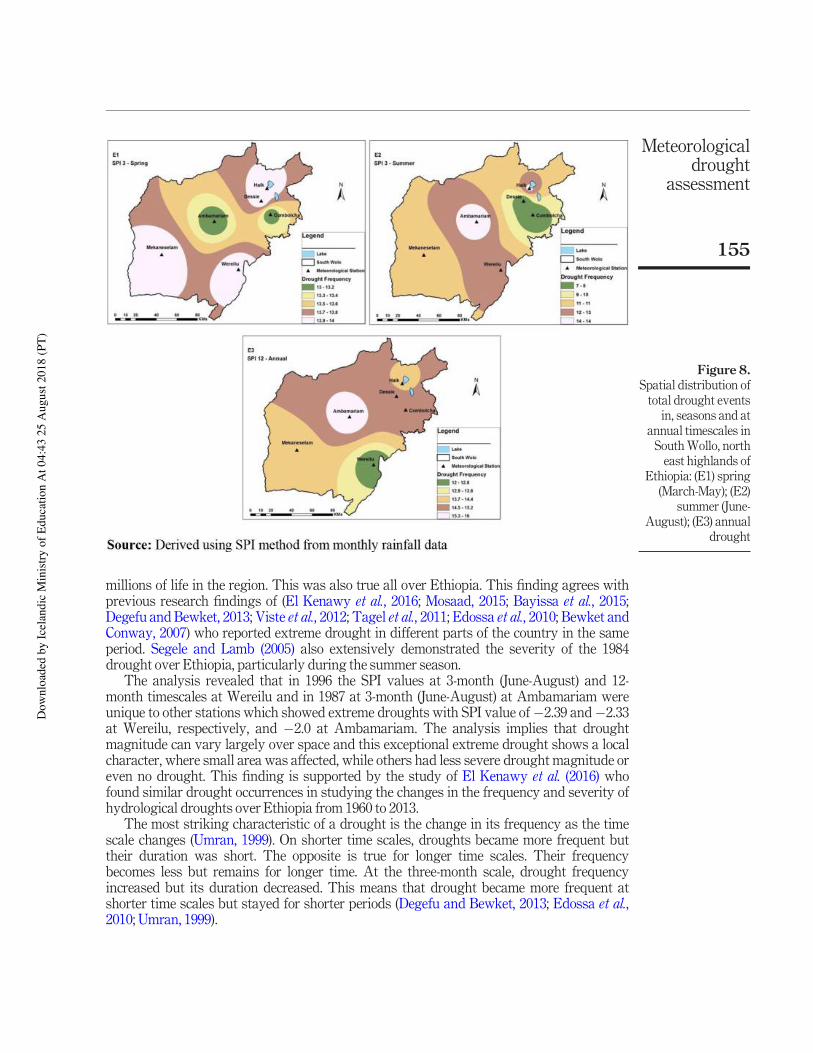
Except small pocket areas with severe droughts in eastern stations, the other stationswere prone to moderate drought magnitude during spring. Extreme drought magnitude wasalso occurred at Ambamariam, Combolcha and Dessie in the same season. During summer,the western stations (Ambamariam, Mekaneselam and Wereilu) were highly exposed tohigh frequency of mild and moderate droughts, whereas eastern stations were less exposedto droughts. At annual timescale, extensive areas in the north east part of the region(Ambamariam, Combolcha and Dessie) also experienced high frequency of drought.Generally, the total frequency of drought was the highest at Mekaneselam at spring andsummer and at Ambamariam at annual time scale.
4. DiscussionsIn this study, we presented a brief drought analysis at annual and seasonal time steps usingSPI. We assessed the magnitude, frequency, trend, spatial pattern and probability ofdrought events over South Wollo from 1984 to 2014 at 3- and 12-month time scales. As thestudy area experiences bimodal rainfall (spring and summer) occurring between March toMay and June to August respectively, we computed the SPI at three-month timescale forboth seasons.
Results indicate that occurrences of drought in South Wollo showed temporal variation.The total number of drought events was higher in summer season than spring atAmbamariam, Combolcha and Mekaneselam. Summer is the main rainy season in the study
Figure 6.Spatial distribution ofdrought events at the
three-month timescale in summer
(June-August) seasonin SouthWollo, north
east highlands ofEthiopia: (A) mild
drought, (B) moderatedrought, (C) severe
drought, (D) extremedrought
Meteorologicaldrought
assessment
153
Dow
nloa
ded
by Ic
elan
dic
Min
istry
of E
duca
tion
At 0
4:43
25
Aug
ust 2
018
(PT)

area, contributing to more than 70 per cent of the annual rainfall (Viste et al., 2012). Failing torain at this season means failure of 85-95 per cent of the Ethiopian food crop which isproduced in this season (Degefu, 1987).
Most of the studied stations experienced extreme magnitude droughts. The year 1984was the most drastic and distinct-wide drought episode. All stations experienced extrememagnitude drought ranging from "2.18 to "3.44 at 3-month (summer) and from "1.9 to"3.03 at 12-month (annual) timescales. Except Wereilu and Haik (which had severemagnitude), extreme magnitude droughts were also observed at all stations in 1999 duringspring season. This finding agrees with the findings of Viste et al. (2012) who found driestconditions all over Ethiopia during spring season in 1999. Additional extreme magnitudedrought also occurred during spring at Ambamariam and Dessie in 2008 with SPI values of"2.28 and "2.22, respectively. There were also extreme magnitude droughts at CombolchaandWereilu during spring season in 2009 with SPI value of"2.5 and"2.14, respectively. Atthe three-month timescale during summer, Ambamariam and Wereilu experienced extrememagnitude droughts in 1987 and 1996 with SPI values of"2. and"2.39, respectively.
The frequency of occurrences of drought was the highest (60 and 53 per cent) atMekaneselam and Ambamariam at 3 month during summer and 12-month annualtimescale, respectively. This shows that Mekaneselam and Ambamariam were frequentlystricken by drought compared to other studied stations in SouthWollo.
The occurrences of extreme magnitude droughts have important implications on rainfedagriculture (Ellis et al., 2010; Morid et al., 2006). The impacts of 1984 drought greatlyexpanded food insecurity, malnutrition, devastated livelihoods and caused for the loss of
Figure 7.Spatial distribution ofdrought events at 12-month time scale inSouthWollo, northeast highlands ofEthiopia: (A) milddrought, (B) moderatedrought, (C) severedrought, (D) extremedrought
IJCCSM10,1
154
Dow
nloa
ded
by Ic
elan
dic
Min
istry
of E
duca
tion
At 0
4:43
25
Aug
ust 2
018
(PT)
millions of life in the region. This was also true all over Ethiopia. This finding agrees withprevious research findings of (El Kenawy et al., 2016; Mosaad, 2015; Bayissa et al., 2015;Degefu and Bewket, 2013; Viste et al., 2012; Tagel et al., 2011; Edossa et al., 2010; Bewket andConway, 2007) who reported extreme drought in different parts of the country in the sameperiod. Segele and Lamb (2005) also extensively demonstrated the severity of the 1984drought over Ethiopia, particularly during the summer season.
The analysis revealed that in 1996 the SPI values at 3-month (June-August) and 12-month timescales at Wereilu and in 1987 at 3-month (June-August) at Ambamariam wereunique to other stations which showed extreme droughts with SPI value of"2.39 and"2.33at Wereilu, respectively, and "2.0 at Ambamariam. The analysis implies that droughtmagnitude can vary largely over space and this exceptional extreme drought shows a localcharacter, where small area was affected, while others had less severe drought magnitude oreven no drought. This finding is supported by the study of El Kenawy et al. (2016) whofound similar drought occurrences in studying the changes in the frequency and severity ofhydrological droughts over Ethiopia from 1960 to 2013.
The most striking characteristic of a drought is the change in its frequency as the timescale changes (Umran, 1999). On shorter time scales, droughts became more frequent buttheir duration was short. The opposite is true for longer time scales. Their frequencybecomes less but remains for longer time. At the three-month scale, drought frequencyincreased but its duration decreased. This means that drought became more frequent atshorter time scales but stayed for shorter periods (Degefu and Bewket, 2013; Edossa et al.,2010; Umran, 1999).
Figure 8.Spatial distribution oftotal drought events
in, seasons and atannual timescales inSouthWollo, northeast highlands of
Ethiopia: (E1) spring(March-May); (E2)
summer (June-August); (E3) annual
drought
Meteorologicaldrought
assessment
155
Dow
nloa
ded
by Ic
elan
dic
Min
istry
of E
duca
tion
At 0
4:43
25
Aug
ust 2
018
(PT)

Generally, the temporal SPI analysis shows that most of the stations measured extreme,severe, moderate and mild drought episodes in the years 1984, 1987/1988, 1992/1993, 1999,2003/2004 and 2007/08. Indeed, these years were among the worst drought years in thehistory of Ethiopia which agrees with previous findings of (Viste et al., 2012, Tagel et al.,2011 and Edossa et al., 2010). The drought years identified by this SPI analysis for SouthWollo are known for their substantial damage in terms of life and economic losses like otherparts of Ethiopia which agrees with the findings of (Bayissa et al., 2015; Tagel et al., 2011). Itis very important to remind that SPI used the monthly rainfall to analyze the droughtepisode in this study. However, the monthly rainfall data did not reflect the daily rainfallcharacteristics, such as the beginning and end time of dry spells which have a greatimplication on the effect of droughts especially for agricultural activities.
TheMK test results indicate that SPI values were ranging from"0.14 to"0.51 Z-unit perdecade at the three-month timescales during spring season suggesting increasing droughtepisodes. However, it was significant only at Mekaneselam (p< 0.05). On the other hand, theSPI values were increasing at the three-month (June-August) at all stations albeit the trendswere statistically significant at Dessie, Haik and Mekaneselam. Generally, significantincreasing tendencies of drought were observed during spring season and decreasingtendencies of drought during summer and annual scale in the study region.
5. ConclusionsIn this study, a brief drought analysis was presented using SPI. It is a very important toolfor quantifying drought and comparing its characteristics over time and space. We used SPI,in this study, to examine the magnitude and frequency, trend, patterns and probability ofdrought occurrences. Here, droughts occurrences were analyzed both at 3- and 12-monthtime scales, and the number of droughts at six stations are presented in Figure 3. Thoughalmost all stations in the study region suffer from drought, it is important to consider that allof the stations did not experience well-defined drought episode during the same periods. Inother words, temporal distribution and frequency of droughts varied markedly among eachstation.
Extreme droughts were more pronounced in stations where their altitude is above 3,000masl during spring and in stations having altitude of less than 3,000 masl during summer.Similarly, stations found in western part of the study region were exposed to high frequencyof severe and extreme droughts at annual timescale. The drought years in the study regionidentified by this SPI analysis were among the worst drought years in the history ofEthiopia. The year 1984, for example, was the most drastic and distinct-wide droughtepisode. Almost all stations experienced extreme magnitude drought at 3-month (summer)and 12-month timescales in the specified year.
Generally, the entire study area can be considered as drought prone area. Increasingtendencies of drought were observed during spring and decreasing tendencies at summerand annual timescales. The patterns of drought events in the study area are highly localized.Special attention (local-scale planning) should be given, while decision makers plan toeffectively manage drought. The findings of this study have implications for droughtmanagement, early warning system, preparedness and contingency planning and climatechange adaptation. In real sense, drought is a climatic event that cannot be prevented veryeasily, but interventions and preparedness to drought can help to cope with drought bydeveloping more resilient ecosystems, improving resilience to recover from drought andtaking various adaptation strategies like water harvesting, making irrigation system moreefficient and a geographical shift of agricultural system.
IJCCSM10,1
156
Dow
nloa
ded
by Ic
elan
dic
Min
istry
of E
duca
tion
At 0
4:43
25
Aug
ust 2
018
(PT)

ReferencesAmsalu, A. and Adem, A. (2009), Assessment of Climate Change-induced Hazards, Impacts and
Responses in the Southern Lowlands of Ethiopia, Forum for Social Studies, Addis Ababa.Bayissa, A., Moges, A., Xuan, Y., Van Andel, J., Maskey, S., Solomatine, D., Griensven, V. and Tadesse,
T. (2015), “Spatio-temporal assessment of meteorological drought under the influence of varyingrecord length: the case of upper Blue Nile basin, Ethiopia”, Hydrological Sciences Journal, Vol. 60No. 11, pp. 1927-1942, doi: 10.1080/02626667.2015.
Bewket, W. and Conway, D. (2007), “A note on the temporal and spatial variability of rainfall in thedrought-prone Amhara region of Ethiopia”,The International Journal of Climatology, Vol. 27, pp.1467-1477, doi: 10.1002/joc.1481.
Block, P.J. (2008), “Mitigating the effects of hydrologic variability in Ethiopia: an assessment ofinvestments in agricultural and transportation infrastructure, energy and hydroclimaticforecasting”, CPWF Working Paper 01: The CGIAR Challenge Program on Water and Food,Colombo, p. 53.
Burn, D.H., Sharif, M. and Zhang, K. (2010), “Detection of trends in hydrological extremes for Canadianwatersheds”,Hydrological Processes, Vol. 24 No. 13, pp. 1781-1790, doi: 10.1002/hyp.7625.
Collins, M.J. (2009), “Evidence for changing flood risk in new England since the late 20th century”,Jawra Journal of the American Water Resources Association), Vol. 45 No. 2, pp. 279-290,doi: 10.1111/j.1752-1688.2008.
Coltorti, M., Dramis, F. and Ollier, C.D. (2007), “Plantation surfaces in northern Ethiopia”,Geomorphology, Vol. 89 Nos 3/4, pp. 287-296.
Degefu, W. (1987), “Some aspects of meteorological drought in Ethiopia”, in Glantz, M.H. (Ed.), Droughtand Hunger in Africa: Denying Famine a Future, Press Syndicate of the University ofCambridge, Cambridge, MA, pp. 223-236.
Degefu, M.A. and Bewket, W. (2013), “Trends and spatial patterns of drought incidence in the omo-ghibe river basin, Ethiopia”, Geografiska Annaler: Series A, Physical Geography, doi: 10.1111/geoa.12080.
Deressa, T.T., Hassan, R.M. and Ringler, C. (2010), “Perception of and adaptation to climate change byfarmers in the Nile Basin of Ethiopia”, Journal of Agricultural Science, (Climate Change andAgriculture Paper), pp. 1-9.
El Kenawy, A.M., McCabe, M.F., Vicente-Serrano, S.M., López-Moreno, J.I. and Robaa, S.M. (2016),“Changes in the frequency and severity of hydrological droughts over Ethiopia from 1960 to2013”, Cuadernos De Investigación Geográfica, Vol. 42 No. 2, doi: 10.18172/cig.2925.
Edossa, D.C., Babel, M.S. and Gupta, A.D. (2010), “Drought analysis in the Awash river basin,Ethiopia”, Water Resources Management, Vol. 24 No. 7, pp. 1441-1460, doi: 10.1007/s11269-009-9508-0.
Ellis, A.W., Goodrich, G.B. and Garfin, G.M. (2010), “A hydroclimatic index for examining patterns ofdrought in the Colorado river basin”, International Journal of Climatology, Vol. 30, pp. 236-255,doi: 10.1002/joc.1882.
Famine Early Warning Systems Network (FEWS NET) (2011), A Climate Trend Analysis of Ethiopia,United States Geological Survey.
FAO (2014), “Understanding the drought impact of El Niño on the global agricultural areas: anassessment using FAO’s Agricultural Stress Index (ASI)”, ISBN 978-92-5-108671-1.
Gibbs, W.J. and Maher, J.V. (1967), Rainfall Deciles as Drought Indicators, Bureau of Meteorology,Bulletin no. 48, Melbourne.
Guttman, N.B. (1998), “Comparing the palmer drought index and the standardized rainfall index”,Journal of the AmericanWater Resources Association, Vol. 34 No. 1, pp. 113-121.
Guttman, N.B. (1999), “Accepting the standardized precipitation index: a calculation algorithm”, JawraJournal of the AmericanWater Resources Association, Vol. 35 No. 2, pp. 311-322.
Meteorologicaldrought
assessment
157
Dow
nloa
ded
by Ic
elan
dic
Min
istry
of E
duca
tion
At 0
4:43
25
Aug
ust 2
018
(PT)

Haile, T. (1988), “Causes and characters of drought in Ethiopia”, Ethiopian Journal of AgriculturalSciences, Vol. 10, pp. 1-2, 8-597.
Hayes, M., Wilhite, D.A., Svoboda, M. and Vanyarkho, O. (1999), “Monitoring the 1996 drought usingthe standardized rainfall index”, Bulletin of the American Meteorological Society, Vol. 80 No. 3,pp. 429-438.
Hirschi, M., Seneviratne, S.I., Alexandrov, V., Boberg, F., Boroneant, C., Christensen, O.B. and Stepanek,P. (2011), “Observational evidence for soil-moisture impact on hot extremes in south easternEurope”,Nature Geoscience, Vol. 4 No. 1, pp. 17-21.
IPCC II (2014), “Climate change 2014; Impacts, adaptations and vulnerability”, Working Group IIContribution to the Fifth Assessment Report of Intergovernmental Panel on Climate Change,Cambridge University Press, Cambridge, MA.
Karavitis, C.A. (1999), “Decision support systems for drought management strategies in metropolitanAthens”,Water International, Vol. 24 No. 1, pp. 10-21.
Kendall, M.G. (1975), Rank CorrelationMethods, Griffin, London.Keyantash, J. and Dracup, J. (2002), “The quantification of drought: an evaluation of drought indices”,
Bulletin of the AmericanMeteorological Society, Vol. 83 No. 8, pp. 1167-1180.Lehmann, E.L. (1975), Nonparametrics, Statistical Methods Based on Ranks, Holden-Day, San
Francisco, California.Little, P.D., Stone, M.P., Mogues, T., Castro, A.P. and Negatu, W. (2006), “‘Moving in place’: drought and
poverty dynamics in South Wollo, Ethiopia”, Journal of Development Studies, Vol. 42 No. 2,pp. 200-225.
Mann, H.B. (1945), “Non-parametric tests against trend”, Econometrica, Vol. 13 No. 3, pp. 245-259.McKee, T.B., Doesken, N.J. and Kleist, J. (1993), “The relationship of drought frequency and duration to
time scales”, Eighth Conference on Applied Climatology, American Meteorological Society,Anaheim, CA, 17-22 January, pp. 179-184.
Meze-Hausken, E. (2000), “Migration caused by climate change: how vulnerable are people in Drylandareas? A case-study in northern Ethiopia”, Mitigation and Adaptation Strategies for GlobalChange, Vol. 5, pp. 379-406.
Mishra, A.K. and Singh, V.P. (2010), “A review of drought concepts”, Journal of Hydrology, Vol. 391No. 1, pp. 202-216.
Morid, S., Smakhtinb, V. and Moghaddasi, M. (2006), “Comparison of seven meteorological indices fordrought monitoring in iran”, International Journal of Climatology, Vol. 26 No. 7, pp. 971-985,doi: 10.1002/joc.1264.
Mosaad, K. (2015), “Forecasting of meteorological drought using hidden Markov model (case study: theupper blue Nile river basin, Ethiopia)”,Ain Shams Engineering Journal, Vol. 7 No. 1, pp. 47-56.
Mpelasoka, F., Hennessy, K., Jones, R. and Bates, B. (2008), “Comparison of suitable drought indices forclimate change impacts assessment over Australia towards resource management”,International Journal of Climatology, Vol. 28 No. 10, pp. 1283-1292, doi: 10.1002/joc.1649.
Palmer, W.C. (1965), “Meteorological droughts”, U.S. Department of Commerce Weather BureauResearch Paper 45, p. 58.
Paulo, A.A., Rosa, R.D. and Pereira, L.S. (2012), “Climate trends and behaviour of drought indices basedon rainfall and evapotranspiration in Portugal”, Natural Hazards and Earth System Science),Vol. 12 No. 5, pp. 1481-1491, doi: 10.5194/nhess-12-1481-2012.
Petrow, T. and Merz, B. (2009), “Trends in flood magnitude, frequency and seasonality in Germany inthe period 1951-2002”, Journal of Hydrology, Vol. 371 Nos 1/4, pp. 129-141, doi: 10.1016/j.jhydrol.2009.03.024.
Rosell, S. and Holmer, B. (2007), “Rainfall change and its implications for Spring harvest in SouthWollo, Ethiopia”,Geografiska Annaler, Vol. 89 No. 4, pp. 287-299.
IJCCSM10,1
158
Dow
nloa
ded
by Ic
elan
dic
Min
istry
of E
duca
tion
At 0
4:43
25
Aug
ust 2
018
(PT)
Segele, Z.T. and Lamb, P.J. (2005), “Characterization and variability of summer rainy season overEthiopia”,Meteorology and Atmospheric Physics, Vol. 89 No. 1, pp. 153-180.
Shahid, S. (2008), “Spatial and temporal characteristics of droughts in the western part of Bangladesh”,Hydrological Processes, Vol. 22 No. 13, pp. 2235-2247, doi: 10.1002/hyp.6820.
Shatanawi, K., Rahbeh, M. and Shatanawi, M. (2013), “Characterizing, monitoring and forecastingof drought in Jordan river basin”, Journal of Water Resource and Protection, Vol. 5 No. 12,pp. 1192-1202.
Sneyers, R. (1990), “On the statistical analysis of series of observations”,Technical Note no. 143, WMO-no. 415, World Meteorological Organization, Geneva.
Steinemann, A.C., Hayes, M.J. and Cavalcanti, L.F.N. (2005), “Drought indicators and triggers”, inWilhite, D.A. (Ed.), Drought and Water Crises: Science, Technology, and Management Issues,CRC Press.
Szinell, C.S., Bussay, A. and Szentimrey, T. (1998), “Drought tendencies in Hungary”, InternationalJournal of Climatology, Vol. 24, pp. 1441-1460, doi: 10.1002/(SICI)1097- 0088(199804)18:5.
Tagel, G., Veen, A.V.D. and Maathuis, B. (2011), “Spatial and temporal assessment of drought in theNorthern highlands of Ethiopia”, International Journal of Applied Earth Observation andGeoinformation, Vol. 13, pp. 309-321.
Tallaksen, L.M. and Van Lanen, H.A.J. (2004), “Hydrological drought”, Processes and EstimationMethods for Streamflow and Groundwater, Developments in Water Science, Vol. 48,p. 579.
Umran, K.A. (1999), “Using the SPI to analyze spatial and temporal patterns of drought in Turkey”,Drought Network News (1994-2001), Paper 49, available at: http://digitalcommons.unl.edu/droughtnetnews/49
United Nations Office for the Coordination of Humanitarian Affairs (UN OCHA) (2015), El Niño:Snapshot of Impact and Projected Humanitarian Needs.
Vicente-Serrano, S.M., Beguería, S. and López-Moreno, J.I. (2010), “A multi-scalar drought indexsensitive to global warming: the standardized rainfall evapotranspiration index – SPEI”, Journalof Climate, Vol. 23, pp. 1696-1718.
Vicente-Serrano, S.M., Chura, O., López-Moreno, J.I., Azorin-Molina, C., Sánchez-Lorenzo, A., Aguilar, E.and Nieto, J.J. (2015), “Spatio-temporal variability of droughts in Bolivia: 1955-2012”,International Journal of Climatology, Vol. 35 No. 10, pp. 3024-3040, doi: 10.1002/joc.4190.
Viste, E., Korecha, D. and Sorteberg, A. (2012), “Recent drought and precipitation tendencies inEthiopia”,Theoretical and Applied Climatology, Vol. 112 Nos 3/4, pp. 535-551.
Wilhite, D.A. (1993), “Drought assessment, management, and planning: theory and case studies”,Natural ResourceManagement and Policy Series, Vol. 2, Kluwer.
Wilhite, D.A. and Glantz, M.H. (1985), “Understanding: the drought phenomenon: the role ofdefinitions”,Water International, Vol. 10 No. 3, pp. 111-120.
World Bank (2006), IDA Countries and Exogenous Shocks, IDA Resource Mobilization, World Bank,Washington, DC.
World Meteorological Organization (2012), Standardized Precipitation Index User Guide, in Svoboda,M., Hayes, M. andWood, D. (Eds), (WMO-No. 1090), Geneva.
Yue, S., Pilon, P. and Cavadias, G. (2002), “Power of the Mann-Kendall and spearman’s rho tests fordetecting monotonic trends in hydrological series”, Journal of Hydrology, Vol. 259 Nos 1/4,pp. 254-271.
Yue, S., Pilon, P. and Phinney, B. (2003), “Canadian Streamflow trend detection: impacts of serial andcrosscorrelation”,Hydrological Science Journal, Vol. 48 No. 1, pp. 51-63.
Zargar, A., Sadiq, R., Naser, B. and Khan, F.I. (2011), “A review of drought indices”, EnvironmentalReviews, Vol. 19, pp. 333 -349.
Meteorologicaldrought
assessment
159
Dow
nloa
ded
by Ic
elan
dic
Min
istry
of E
duca
tion
At 0
4:43
25
Aug
ust 2
018
(PT)

Further readingAndreu, J., et al. (2015), “Drought indicators: monitoring, forecasting and early warning at the case
study scale”, Technical Report No.33.Edwards, D.C. and McKee, T.B. (1997), “Characteristics of 20th century drought in the united states at
multiple time scales”,Atmospheric Science Paper, Vol. 634, pp. 1-30.Kumar, N., Murthy, S., Sesha Sai, R. and Roy, S. (2012), “Spatiotemporal analysis of meteorological
drought variability in the indian region using standardized precipitation index”, MeteorologicalApplications, Vol. 19, pp. 256-264, doi: 10.1002/met.277.
Labedzki, L. (2007), “Estimation of local drought frequency in central Poland using the precipitationindex SPI”, Irrigation and Drainage, Vol. 56 No. 1, pp. 67-77, doi: 10.1002/ird.285.
Lloyd-Hughes, B. and Saunders, M.A. (2002), “A drought climatology for Europe”, International Journalof Climatology, Vol. 22 No. 13, pp. 1571-1592, doi: 10.1002/joc.846.
Ntale, H.K. and Gan, T.Y. (2003), “Drought indices and their application to east Africa”, InternationalJournal of Climatology, Vol. 23 No. 11, pp. 1335-1357, doi: 10.1002/joc.93.
Robeson, S.M. (2008), “Applied climatology: drought”, Progress in Physical Geography, Vol. 32 No. 3,pp. 303-309.
Sternberg, T., Thomas, D. and Middleton, N. (2010), “Short communication drought dynamics on theMongolian steppe, 1970-2006”, International Journal of Climatology, Vol. 31 No. 12, pp. 1823-1830,doi: 10.1002/joc.2195.
Tefera, M., Chernet, T. and Harro, W. (1996), “Explanation on geological map of Ethiopia a 1:2,000,000scale”, Bulletin No 3, Addis Ababa, pp. 2-64.
Temesgen, D., Hassan, R.M. and Ringler, C. (2008), “Measuring Ethiopian farmers’ vulnerability toclimate change across regional states”, Discussion Paper, International Food Policy ResearchInstitute (IFPRI), Washington, DC.
Tonini, F., Jona Lasinio, G. and Hochmair, H.H. (2012), “Mapping return levels of absolute NDVIvariations for the assessment of drought risk in Ethiopia”, International Journal of Applied EarthObservation and Geoinformation, Vol. 18, pp. 564-572.
Wu, H., Hayes, M.J., Wilhite, D.A. and Svoboda, M.D. (2005), “The effect of the length of record on thestandard precipitation index calculation”, International Journal of Climatology, Vol. 25 No. 4,pp. 505-520, doi: 10.1002/joc.1142.
Corresponding authorYimer Mohammed can be contacted at: [email protected]
For instructions on how to order reprints of this article, please visit our website:www.emeraldgrouppublishing.com/licensing/reprints.htmOr contact us for further details: [email protected]
IJCCSM10,1
160
Dow
nloa
ded
by Ic
elan
dic
Min
istry
of E
duca
tion
At 0
4:43
25
Aug
ust 2
018
(PT)