methane emission reductions in oil and gas processing
TRANSCRIPT
EPA Middle East Meeting Washington, D.C.
2 October 2012
Methane Emission Reductions in Oil and Gas Processing
Don Robinson ICF International
Vice President
1
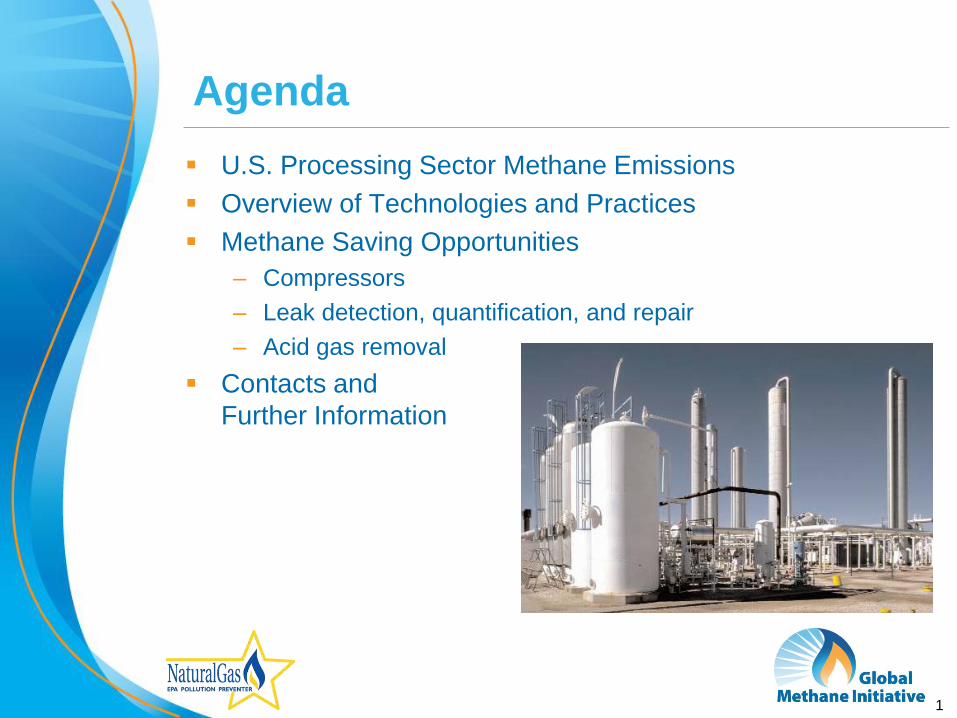
Agenda
U.S. Processing Sector Methane Emissions
Overview of Technologies and Practices
Methane Saving Opportunities
– Compressors
– Leak detection, quantification, and repair
– Acid gas removal
Contacts and
Further Information
2
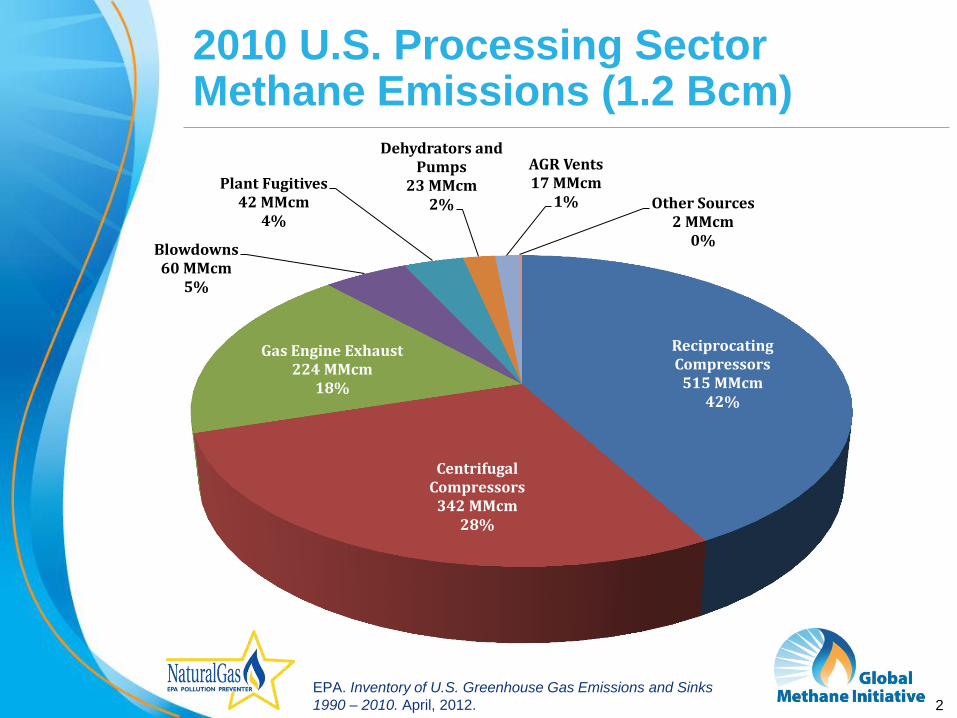
2010 U.S. Processing Sector Methane Emissions (1.2 Bcm)
EPA. Inventory of U.S. Greenhouse Gas Emissions and Sinks
1990 – 2010. April, 2012.
Reciprocating Compressors
515 MMcm 42%
Centrifugal Compressors
342 MMcm 28%
Gas Engine Exhaust 224 MMcm
18%
Blowdowns 60 MMcm
5%
Plant Fugitives 42 MMcm
4%
Dehydrators and Pumps
23 MMcm 2%
AGR Vents 17 MMcm
1% Other Sources 2 MMcm
0%
3
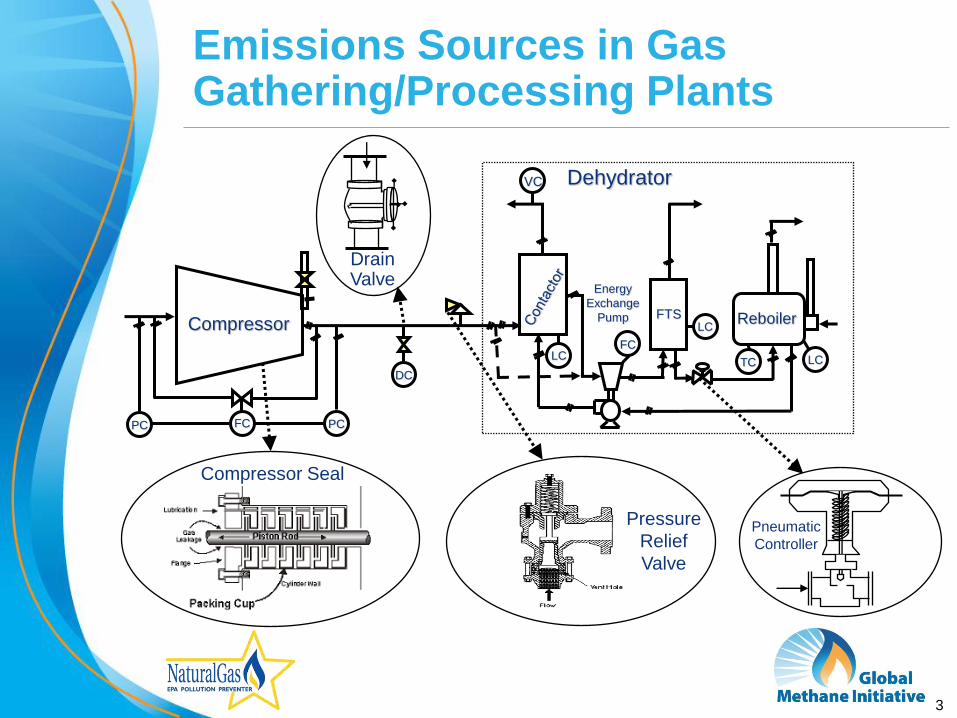
PC PC
Compressor
FC
DC
LC TC
VC
FTS
FC
LC
LC
Energy
Exchange
Pump
Dehydrator
Reboiler
Pressure
Relief
Valve
Drain Valve
Compressor Seal
Pneumatic
Controller
Emissions Sources in Gas Gathering/Processing Plants
4
Overview of Technologies and Practices
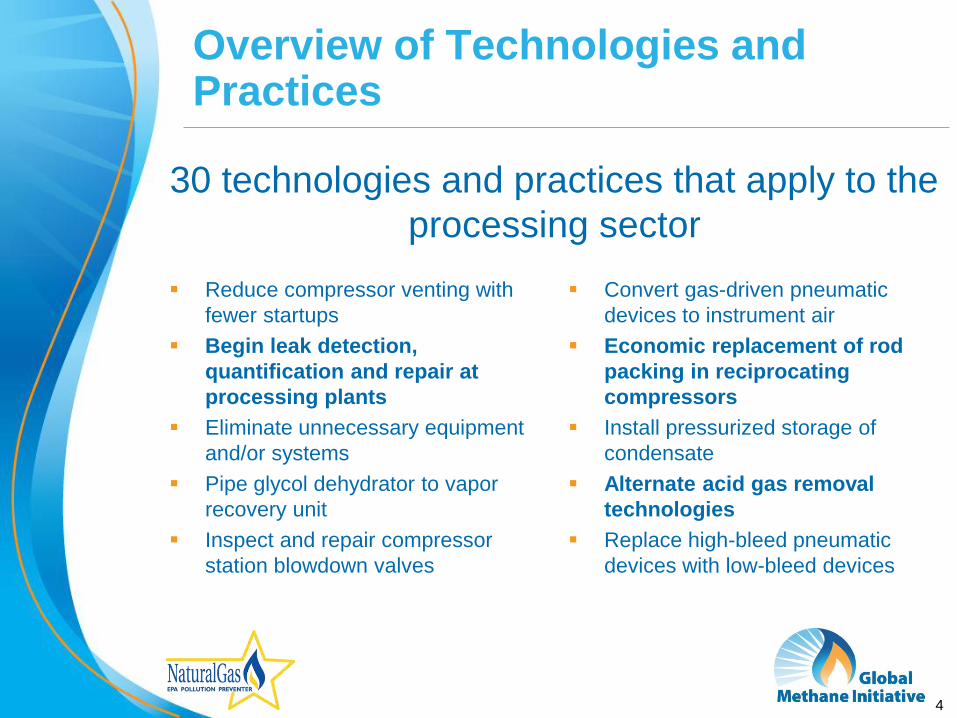
Convert gas-driven pneumatic
devices to instrument air
Economic replacement of rod
packing in reciprocating
compressors
Install pressurized storage of
condensate
Alternate acid gas removal
technologies
Replace high-bleed pneumatic
devices with low-bleed devices
Reduce compressor venting with
fewer startups
Begin leak detection,
quantification and repair at
processing plants
Eliminate unnecessary equipment
and/or systems
Pipe glycol dehydrator to vapor
recovery unit
Inspect and repair compressor
station blowdown valves
30 technologies and practices that apply to the
processing sector
5
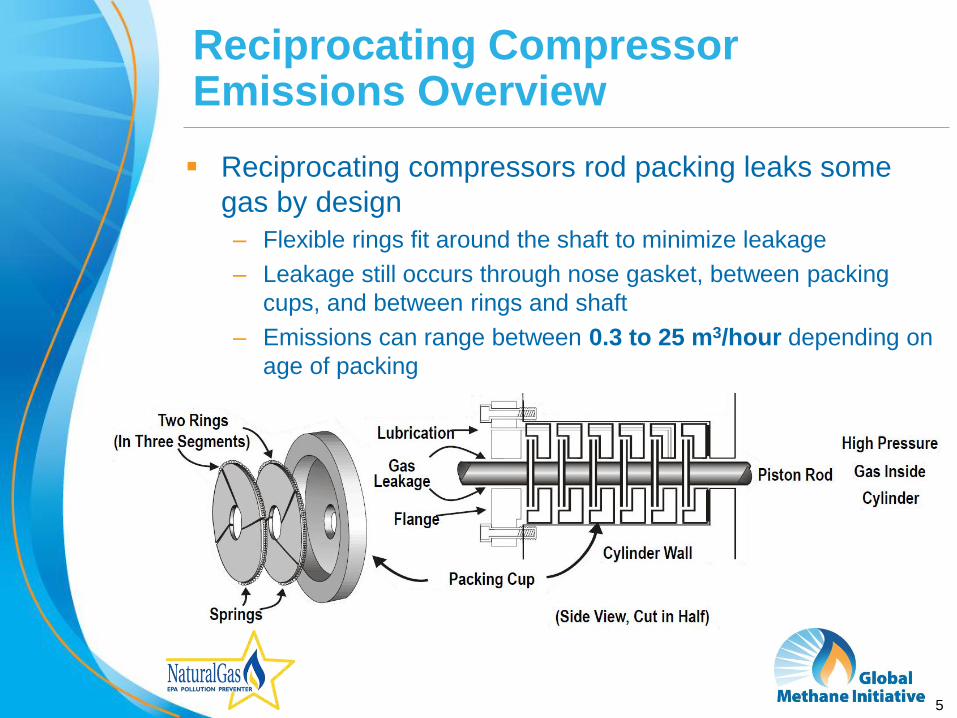
Reciprocating Compressor Emissions Overview
Reciprocating compressors rod packing leaks some
gas by design
– Flexible rings fit around the shaft to minimize leakage
– Leakage still occurs through nose gasket, between packing
cups, and between rings and shaft
– Emissions can range between 0.3 to 25 m3/hour depending on
age of packing
6
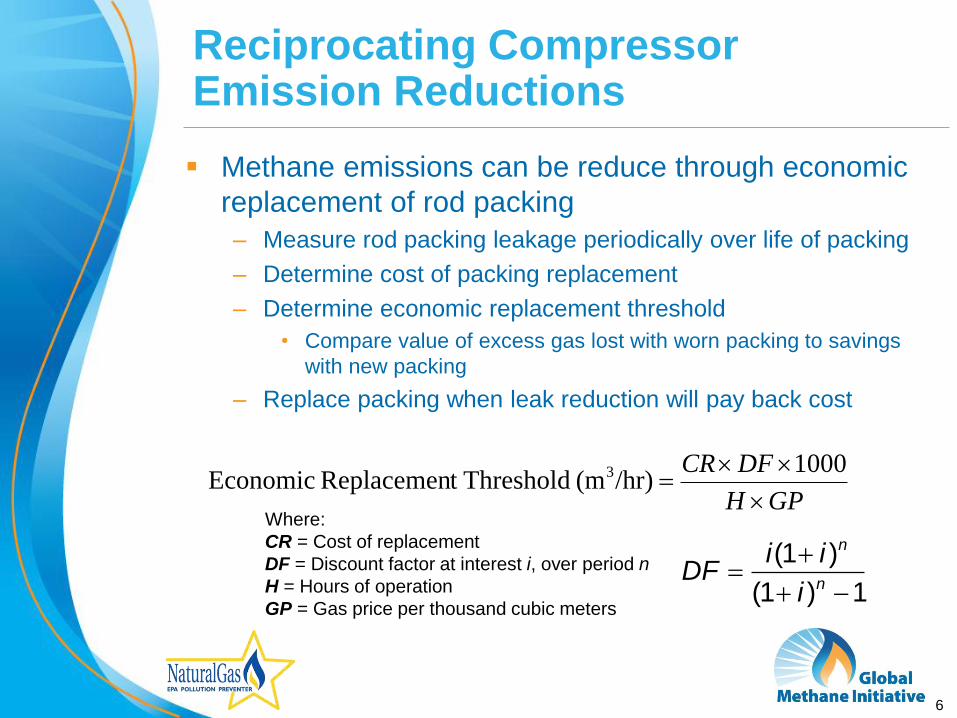
Reciprocating Compressor Emission Reductions
Methane emissions can be reduce through economic
replacement of rod packing
– Measure rod packing leakage periodically over life of packing
– Determine cost of packing replacement
– Determine economic replacement threshold
• Compare value of excess gas lost with worn packing to savings
with new packing
– Replace packing when leak reduction will pay back cost
GPH
DFCR
1000/hr)(m Thresholdt Replacemen Economic 3
1)1(
)1(
n
n
i
iiDF
Where:
CR = Cost of replacement
DF = Discount factor at interest i, over period n
H = Hours of operation
GP = Gas price per thousand cubic meters
7
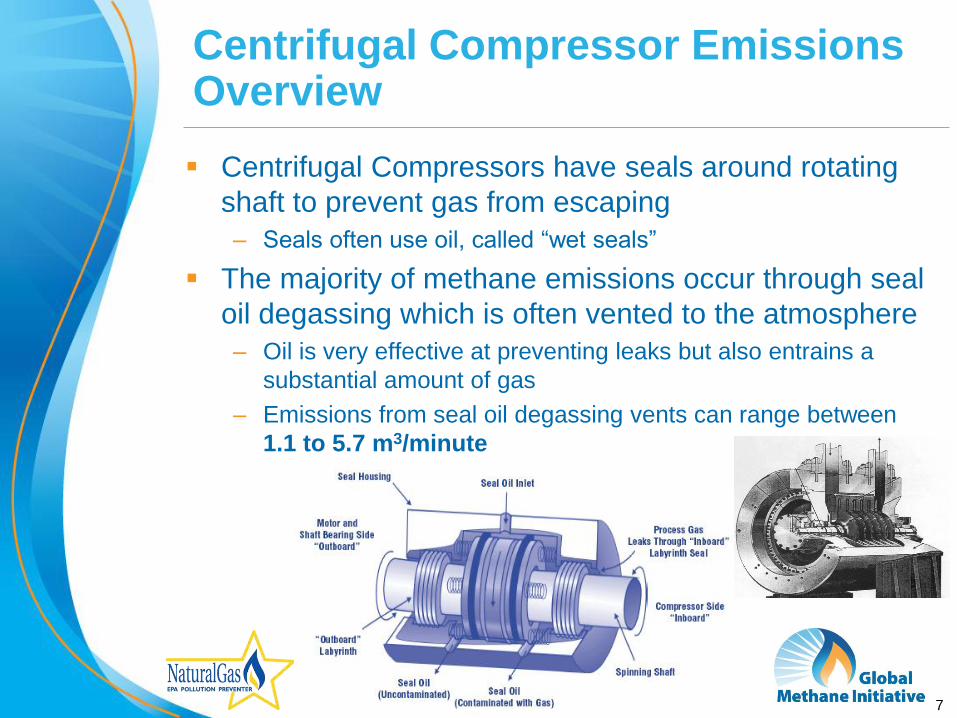
Centrifugal Compressor Emissions Overview
Centrifugal Compressors have seals around rotating
shaft to prevent gas from escaping
– Seals often use oil, called “wet seals”
The majority of methane emissions occur through seal
oil degassing which is often vented to the atmosphere
– Oil is very effective at preventing leaks but also entrains a
substantial amount of gas
– Emissions from seal oil degassing vents can range between
1.1 to 5.7 m3/minute
8
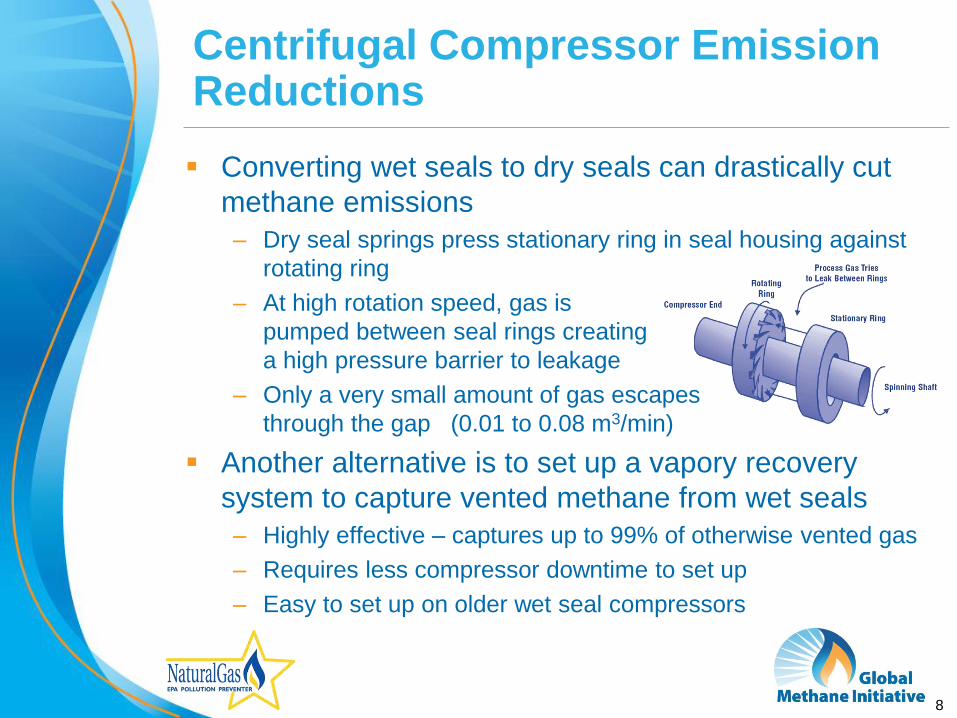
Centrifugal Compressor Emission Reductions
Converting wet seals to dry seals can drastically cut
methane emissions
– Dry seal springs press stationary ring in seal housing against
rotating ring
– At high rotation speed, gas is
pumped between seal rings creating
a high pressure barrier to leakage
– Only a very small amount of gas escapes
through the gap (0.01 to 0.08 m3/min)
Another alternative is to set up a vapory recovery
system to capture vented methane from wet seals
– Highly effective – captures up to 99% of otherwise vented gas
– Requires less compressor downtime to set up
– Easy to set up on older wet seal compressors
9
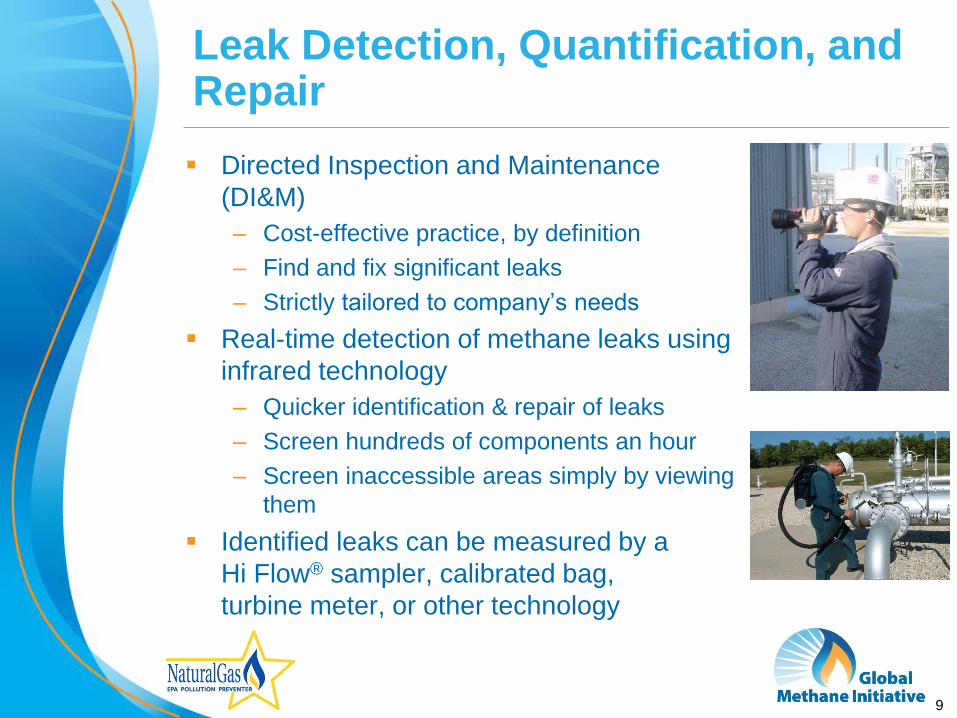
Leak Detection, Quantification, and Repair
Directed Inspection and Maintenance
(DI&M)
– Cost-effective practice, by definition
– Find and fix significant leaks
– Strictly tailored to company’s needs
Real-time detection of methane leaks using
infrared technology
– Quicker identification & repair of leaks
– Screen hundreds of components an hour
– Screen inaccessible areas simply by viewing
them
Identified leaks can be measured by a
Hi Flow® sampler, calibrated bag,
turbine meter, or other technology
10
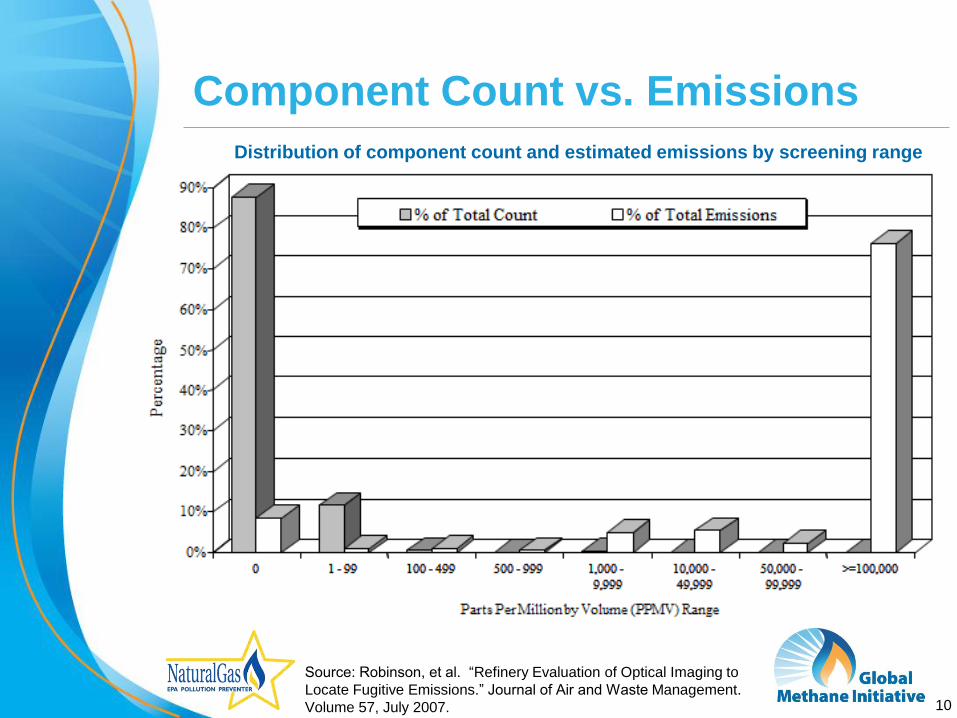
Source: Robinson, et al. “Refinery Evaluation of Optical Imaging to
Locate Fugitive Emissions.” Journal of Air and Waste Management.
Volume 57, July 2007.
Component Count vs. Emissions
Distribution of component count and estimated emissions by screening range
11
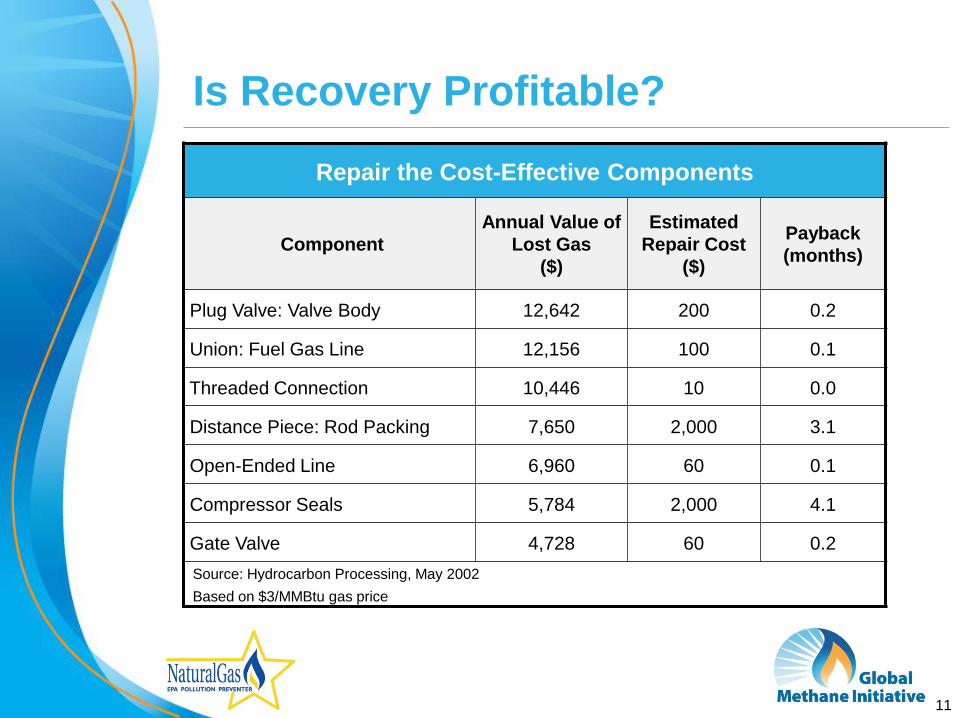
Is Recovery Profitable?
Repair the Cost-Effective Components
Component
Annual Value of
Lost Gas
($)
Estimated
Repair Cost
($)
Payback
(months)
Plug Valve: Valve Body 12,642 200 0.2
Union: Fuel Gas Line 12,156 100 0.1
Threaded Connection 10,446 10 0.0
Distance Piece: Rod Packing 7,650 2,000 3.1
Open-Ended Line 6,960 60 0.1
Compressor Seals 5,784 2,000 4.1
Gate Valve 4,728 60 0.2
Source: Hydrocarbon Processing, May 2002
Based on $3/MMBtu gas price
12
Acid Gas Removal (AGR) – What is the Problem?
Wellhead natural gas may contain acid gases
– Hydrogen sulfide (H2S) and CO2 are corrosive to pipelines,
compressors, instruments, and distribution equipment
Acid gas removal processes have traditionally used an
aqueous amine solution to absorb acid gas
– These solutions absorb methane along with the acid gases
Amine regeneration strips acid gas and absorbed methane
– If the acid gas is CO2 it is typically vented to the atmosphere,
flared, or recovered for enhanced oil recovery (EOR)
– H2S is typically flared (low concentrations) or sent to the sulfur
recovery unit (high concentrations)
There are two commercial alternatives to DEA absorption
– Membrane
– Molecular Gate®
13
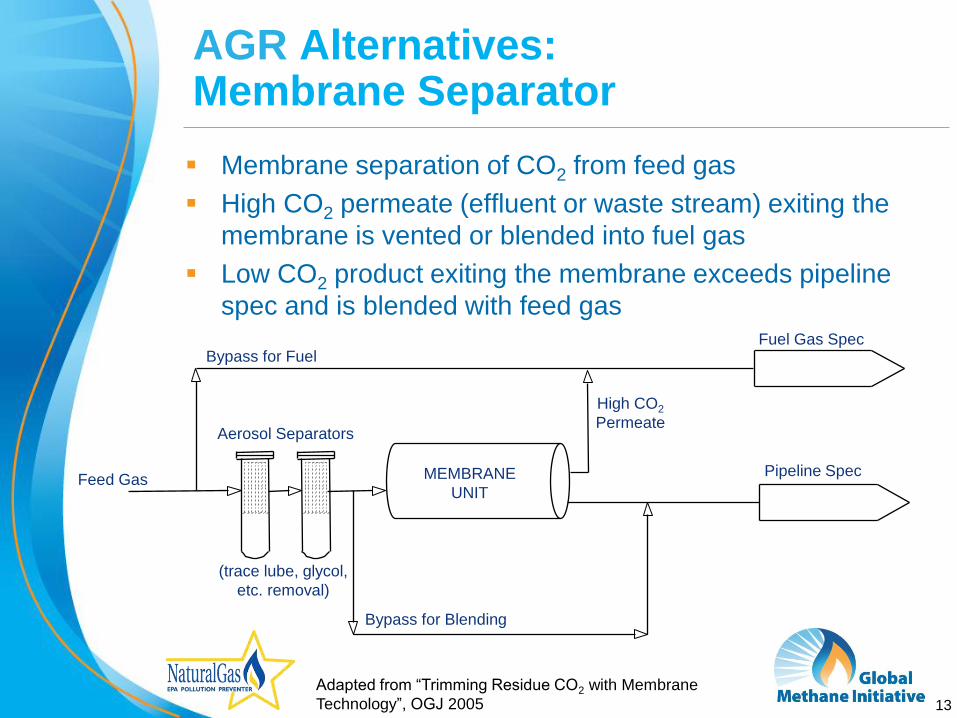
Fuel Gas Spec
Pipeline Spec
Adapted from “Trimming Residue CO2 with Membrane
Technology”, OGJ 2005
MEMBRANE
UNIT
Aerosol Separators
Bypass for Fuel
High CO2
Permeate
Feed Gas
Bypass for Blending
(trace lube, glycol,
etc. removal)
AGR Alternatives: Membrane Separator
Membrane separation of CO2 from feed gas
High CO2 permeate (effluent or waste stream) exiting the
membrane is vented or blended into fuel gas
Low CO2 product exiting the membrane exceeds pipeline
spec and is blended with feed gas
14
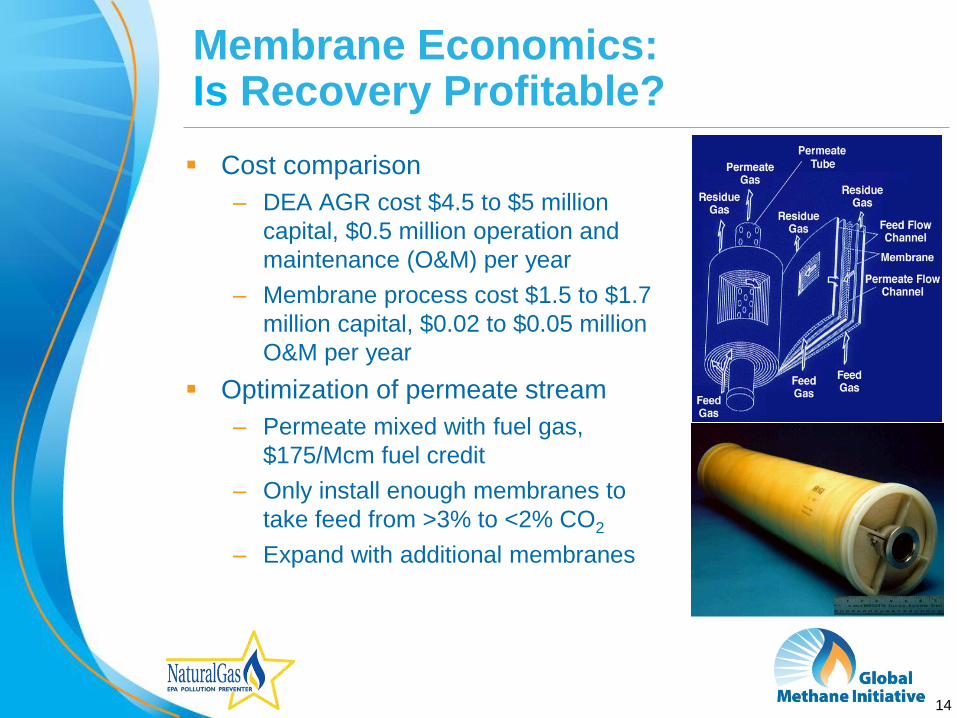
Membrane Economics: Is Recovery Profitable?
Cost comparison
– DEA AGR cost $4.5 to $5 million
capital, $0.5 million operation and
maintenance (O&M) per year
– Membrane process cost $1.5 to $1.7
million capital, $0.02 to $0.05 million
O&M per year
Optimization of permeate stream
– Permeate mixed with fuel gas,
$175/Mcm fuel credit
– Only install enough membranes to
take feed from >3% to <2% CO2
– Expand with additional membranes

15
AGR Alternatives: Molecular Gate®
Molecular Gate® adsorbs acid gas (CO2 and H2S) in fixed
bed
Molecular sieve application selectively adsorbs acid gas
molecules of smaller diameter than methane
Bed regenerated by
depressuring
– 10% of feed methane
lost in depressuring
– Route tail gas to fuel
Applicable to lean gas
sources

16
Molecular Gate® Economics: Is Recovery Profitable?
Molecular Gate® costs are 20% less than amine process
Fixed-bed tail gas vent can be used as supplemental fuel
– Eliminates venting from acid gas removal
Other Benefits
– Allows wells with high acid gas content to produce (alternative
is shut-in)
– Can dehydrate and remove acid gas to pipeline specs in one
step
– Less operator attention
17
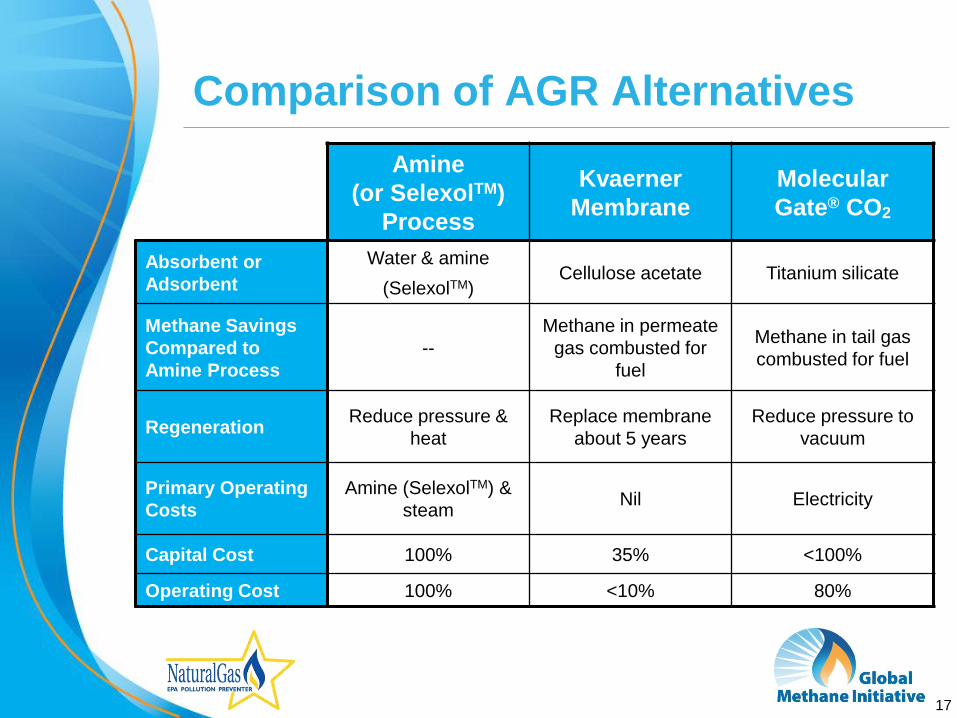
Amine
(or SelexolTM)
Process
Kvaerner
Membrane
Molecular
Gate® CO2
Absorbent or
Adsorbent
Water & amine
(SelexolTM) Cellulose acetate Titanium silicate
Methane Savings
Compared to
Amine Process
--
Methane in permeate
gas combusted for
fuel
Methane in tail gas
combusted for fuel
Regeneration Reduce pressure &
heat
Replace membrane
about 5 years
Reduce pressure to
vacuum
Primary Operating
Costs
Amine (SelexolTM) &
steam Nil Electricity
Capital Cost 100% 35% <100%
Operating Cost 100% <10% 80%
Comparison of AGR Alternatives
18
Contact and Further Information
Don Robinson ICF International
Vice President
+1 (703) 218-2512
Global Methane Initiative globalmethane.org
Recommended Technologies (Arabic) epa.gov/gasstar/tools/arabic/index.html