method 200.9 determination of trace elements · pdf file200.9-1 method 200.9 determination of...
TRANSCRIPT
200.9-1
METHOD 200.9
DETERMINATION OF TRACE ELEMENTS BY STABILIZED TEMPERATUREGRAPHITE FURNACE ATOMIC ABSORPTION
Revision 2.2EMMC Version
J.T. Creed, T.D. Martin, L.B. Lobring, and J.W. O'Dell - Method 200.9, Revision 1.2 (1991)
J.T. Creed, T.D. Martin, and J.W. O'Dell - Method 200.9, Revision 2.2 (1994)
ENVIRONMENTAL MONITORING SYSTEMS LABORATORY OFFICE OF RESEARCH AND DEVELOPMENT
U.S. ENVIRONMENTAL PROTECTION AGENCYCINCINNATI, OHIO 45268

200.9-2
METHOD 200.9
DETERMINATION OF TRACE ELEMENTS BY STABILIZED TEMPERATUREGRAPHITE FURNACE ATOMIC ABSORPTION
1.0 SCOPE AND APPLICATION
1.1 This method provides procedures for the determination of dissolved and total1
recoverable elements by graphite furnace atomic absorption (GFAA) in groundwater, surface water, drinking water, storm runoff, industrial and domesticwastewater. This method is also applicable to the determination of totalrecoverable elements in sediment, sludges, and soil. This method is applicableto the following analytes:
Analyte Registry Number (CASRN)Chemical Abstract Services
Aluminum (Al) 7429-90-5Antimony (Sb) 7440-36-0Arsenic (As) 7440-38-2Beryllium (Be) 7440-41-7Cadmium (Cd) 7440-43-9Chromium (Cr) 7440-47-3Cobalt (Co) 7440-48-4Copper (Cu) 7440-50-8Iron (Fe) 7439-89-6Lead (Pb) 7439-92-1Manganese (Mn) 7439-96-5Nickel (Ni) 7440-02-0Selenium (Se) 7782-49-2Silver (Ag) 7440-22-4Thallium (Tl) 7440-28-0Tin (Sn) 7440-31-5
1.2 For reference where this method is approved for use in compliance monitoringprograms [e.g., Clean Water Act (NPDES) or Safe Drinking Water Act (SDWA)]consult both the appropriate sections of the Code of Federal Regulation (40 CFRPart 136 Table 1B for NPDES, and Part 141 § 141.23 for drinking water), and thelatest Federal Register announcements.
1.3 Dissolved analytes can be determined in aqueous samples after suitable filtrationand acid preservation.
200.9-3
1.4 With the exception of silver, where this method is approved for the determinationof certain metal and metalloid contaminants in drinking water, samples may beanalyzed by direct injection into the furnace without acid digestion if the samplehas been properly preserved with acid, has turbidity of <1 NTU at the time ofanalysis, and is analyzed using the appropriate method matrix modifiers. Thistotal recoverable determination procedure is referred to as "direct analysis".However, in the determination of some primary drinking water metalcontaminants, such as arsenic and thallium preconcentration of the sample maybe required prior to analysis in order to meet drinking water acceptanceperformance criteria (Section 10.5).
1.5 For the determination of total recoverable analytes in aqueous and solid samplesa digestion/extraction is required prior to analysis when the elements are not insolution (e.g., soils, sludges, sediments and aqueous samples that may containparticulate and suspended solids). Aqueous samples containing suspended orparticulate material ≥1% (w/v) should be extracted as a solid type sample.
1.6 Silver is only slightly soluble is the presence of chloride unless there is a sufficientchloride concentration to form the soluble chloride complex. Therefore, lowrecoveries of silver may occur in samples, fortified sample matrices and evenfortified blanks if determined as a dissolved analyte or by "direct analysis" wherethe sample has not been processed using the total recoverable digestion. For thisreason it is recommended that samples be digested prior to the determination ofsilver. The total recoverable sample digestion procedure given in this method issuitable for the determination of silver in aqueous samples containingconcentrations up to 0.1 mg/L. For the analysis of wastewater samplescontaining higher concentrations of silver, succeeding smaller volume, well mixedaliquots should be prepared until the analysis solution contains <0.1 mg/L silver.The extraction of solid samples containing concentrations of silver >50 mg/kgshould be treated in a similar manner.
1.7 Method detection limits and instrument operating conditions for the applicableelements are listed in Table 2. These are intended as a guide and are typical ofa system optimized for the element employing commercial instrumentation.However, actual method detection limits and linear working ranges will bedependent on the sample matrix, instrumentation and selected operatingconditions.
1.8 The sensitivity and limited linear dynamic range (LDR) of GFAA often impliesthe need to dilute a sample prior to analysis. The actual magnitude of thedilution as well as the cleanliness of the labware used to perform the dilution candramatically influence the quality of the analytical results. Therefore, samplestypes requiring large dilutions (>50:1) should be analyzed by an anotherapproved test procedure which has a larger LDR or which is inherently lesssensitive than GFAA.
1.9 Users of the method data should state the data-quality objectives prior to analysis.Users of the method must document and have on file the required initial
200.9-4
demonstration performance data described in Section 9.2 prior to using themethod for analysis.
2.0 SUMMARY OF METHOD
2.1 An aliquot of a well mixed, homogeneous aqueous or solid sample is accuratelyweighed or measured for sample processing. For total recoverable analysis of asolid or an aqueous sample containing undissolved material, analytes are firstsolubilized by gentle refluxing with nitric and hydrochloric acids. After cooling,the sample is made up to volume, is mixed and centrifuged or allowed to settleovernight prior to analysis. For the determination of dissolved analytes in afiltered aqueous sample aliquot, or for the "direct analysis" total recoverabledetermination of analytes where sample turbidity is <1 NTU, the sample is madeready for analysis by the appropriate addition of nitric acid, and then diluted toa predetermined volume and mixed before analysis.
2.2 The analytes listed in this method are determined by stabilized temperatureplatform graphite furnace atomic absorption (STPGFAA). In STPGFAA, thesample and the matrix modifier are first pipetted onto the platform or a devicewhich provides delayed atomization. The furnace chamber is then purged witha continuous flow of a premixed gas (95% argon - 5% hydrogen) and the sampleis dried at a relatively low temperature (about 120°C) to avoid spattering. Oncedried, the sample is pretreated in a char or ashing step which is designed tominimize the interference effects caused by the concomitant sample matrix. Afterthe char step the furnace is allowed to cool prior to atomization. The atomizationcycle is characterized by rapid heating of the furnace to a temperature where themetal (analyte) is atomized from the pyrolytic graphite surface into a stopped gasflow atmosphere of argon containing 5% hydrogen. (Only selenium is determinedin an atmosphere of high purity argon.) The resulting atomic cloud absorbs theelement specific atomic emission produced by a hollow cathode lamp (HCL) oran electrodeless discharge lamp (EDL). Following analysis the furnace issubjected to a cleanout period of high temperature and continuous argon flow.Because the resulting absorbance usually has a nonspecific component associatedwith the actual analyte absorbance, an instrumental background correction deviceis required to subtract from the total signal the component which is nonspecificto the analyte. In the absence of interferences, the background correctedabsorbance is directly related to the concentration of the analyte. Interferencesrelating to STPGFAA (Section 4.0) must be recognized and corrected.Suppressions or enhancements of instrument response caused by the samplematrix must be corrected by the method of standard addition (Section 11.5).

200.9-5
3.0 DEFINITIONS
3.1 Calibration Blank - A volume of reagent water acidified with the same acidmatrix as in the calibration standards. The calibration blank is a zero standardand is used to auto-zero the AA instrument (Section 7.10.1).
3.2 Calibration Standard (CAL) - A solution prepared from the dilution of stockstandard solutions. The CAL solutions are used to calibrate the instrumentresponse with respect to analyte concentration (Section 7.9).
3.3 Dissolved Analyte - The concentration of analyte in an aqueous sample that willpass through a 0.45 µm membrane filter assembly prior to sample acidification(Section 11.1).
3.4 Field Reagent Blank (FRB) - An aliquot of reagent water or other blank matrixthat is placed in a sample container in the laboratory and treated as a sample inall respects, including shipment to the sampling site, exposure to the samplingsite conditions, storage, preservation, and all analytical procedures. The purposeof the FRB is to determine if method analytes or other interferences are presentin the field environment (Section 8.5).
3.5 Instrument Detection Limit (IDL) - The concentration equivalent to the analytesignal which is equal to three times the standard deviation of a series of tenreplicate measurements of the calibration blank signal at the same wavelength.
3.6 Instrument Performance Check (IPC) Solution - A solution of method analytes,used to evaluate the performance of the instrument system with respect to adefined set of method criteria (Sections 7.11 and 9.3.4).
3.7 Laboratory Duplicates (LD1 and LD2) - Two aliquots of the same sample takenin the laboratory and analyzed separately with identical procedures. Analyses ofLD1 and LD2 indicates precision associated with laboratory procedures, but notwith sample collection, preservation, or storage procedures.
3.8 Laboratory Fortified Blank (LFB) - An aliquot of LRB to which known quantitiesof the method analytes are added in the laboratory. The LFB is analyzed exactlylike a sample, and its purpose is to determine whether the methodology is incontrol and whether the laboratory is capable of making accurate and precisemeasurements (Sections 7.10.3 and 9.3.2).
3.9 Laboratory Fortified Sample Matrix (LFM) - An aliquot of an environmentalsample to which known quantities of the method analytes are added in thelaboratory. The LFM is analyzed exactly like a sample, and its purpose is todetermine whether the sample matrix contributes bias to the analytical results.The background concentrations of the analytes in the sample matrix must bedetermined in a separate aliquot and the measured values in the LFM correctedfor background concentrations (Section 9.4).

200.9-6
3.10 Laboratory Reagent Blank (LRB) - An aliquot of reagent water or other blankmatrices that are treated exactly as a sample including exposure to all glassware,equipment, solvents, reagents, and internal standards that are used with othersamples. The LRB is used to determine if method analytes or other interferencesare present in the laboratory environment, reagents, or apparatus (Sections 7.10.2and 9.3.1).
3.11 Linear Dynamic Range (LDR) - The concentration range over which theinstrument response to an analyte is linear (Section 9.2.2).
3.12 Matrix Modifier - A substance added to the graphite furnace along with thesample in order to minimize the interference effects by selective volatilization ofeither analyte or matrix components.
3.13 Method Detection Limit (MDL) - The minimum concentration of an analyte thatcan be identified, measured, and reported with 99% confidence that the analyteconcentration is greater than zero (Section 9.2.4 and Table 2).
3.14 Quality Control Sample (QCS) - A solution of method analytes of knownconcentrations which is used to fortify an aliquot of LRB or sample matrix. TheQCS is obtained from a source external to the laboratory and different from thesource of calibration standards. It is used to check either laboratory or instrumentperformance (Sections 7.12 and 9.2.3).
3.15 Solid Sample - For the purpose of this method, a sample taken from materialclassified as either soil, sediment or sludge.
3.16 Standard Addition - The addition of a known amount of analyte to the samplein order to determine the relative response of the detector to an analyte within thesample matrix. The relative response is then used to assess either an operativematrix effect or the sample analyte concentration (Sections 9.5.1 and 11.5).
3.17 Stock Standard Solution - A concentrated solution containing one or moremethod analytes prepared in the laboratory using assayed reference materials orpurchased from a reputable commercial source (Section 7.8).
3.18 Total Recoverable Analyte - The concentration of analyte determined to be ineither a solid sample or an unfiltered aqueous sample following treatment byrefluxing with hot dilute mineral acid(s) as specified in the method (Sections 11.2and 11.3).
3.19 Water Sample - For the purpose of this method, a sample taken from one of thefollowing sources: drinking, surface, ground, storm runoff, industrial or domesticwastewater.

200.9-7
4.0 INTERFERENCES
4.1 Several interference sources may cause inaccuracies in the determination of traceelements by GFAA. These interferences can be classified into three majorsubdivisions, namely spectral, matrix, and memory.
4.2 Spectral interferences are caused by the resulting absorbance of light by a molecule or atom which is not the analyte of interest or emission fromblack body radiation.
4.2.1 Spectral interferences caused by an element only occur if there is a spectraloverlap between the wavelength of the interfering element and the analyteof interest. Fortunately, this type of interference is relatively uncommonin STPGFAA because of the narrow atomic line widths associated withSTPGFAA. In addition, the use of appropriate furnace temperatureprograms and high spectral purity lamps as light sources can minimize thepossibility of this type of interference. However, molecular absorbancescan span several hundred nanometers producing broadband spectralinterferences. This type of interference is far more common in STPGFAA.The use of matrix modifiers, selective volatilization, and backgroundcorrectors are all attempts to eliminate unwanted nonspecific absorbance.The nonspecific component of the total absorbance can vary considerablyfrom sample type to sample type. Therefore, the effectiveness of aparticular background correction device may vary depending on the actualanalyte wavelength used as well as the nature and magnitude of theinterference. The background correction device to be used with thismethod is not specified, however, it must provide an analytical conditionthat is not subject to the occurring interelement spectral interferences ofpalladium on copper, iron on selenium, and aluminum on arsenic.
4.2.2 Spectral interferences are also caused by the emissions from black bodyradiation produced during the atomization furnace cycle. This black bodyemission reaches the photomultiplier tube, producing erroneous results.The magnitude of this interference can be minimized by proper furnacetube alignment and monochromator design. In addition, atomizationtemperatures which adequately volatilize the analyte of interest withoutproducing unnecessary black body radiation can help reduce unwantedbackground emission during analysis.
4.3 Matrix interferences are caused by sample components which inhibit theformation of free atomic analyte atoms during the atomization cycle.
4.3.1 Matrix interferences can be of a chemical or physical nature. In thismethod the use of a delayed atomization device which provides stabilizedtemperatures is required. These devices provide an environment whichis more conducive to the formation of free analyte atoms and therebyminimize this type of interference. This type of interference can bedetected by analyzing the sample plus a sample aliquot fortified with a

200.9-8
known concentration of the analyte. If the determined concentration ofthe analyte addition is outside a designated range, a possible matrix effectshould be suspected (Section 9.4.3).
4.3.2 The use of nitric acid is preferred for GFAA analyses in order to minimizevapor state anionic chemical interferences, however, in this methodhydrochloric acid is required to maintain stability in solutions containingantimony and silver. When hydrochloric acid is used, the chloride ionvapor state interferences must be reduced using an appropriate matrixmodifier. In this method a combination modifier of palladium,magnesium nitrate and a hydrogen(5%)-argon(95%) gas mixture is usedfor this purpose. The effects and benefits of using this modifier arediscussed in detail in Reference 2 of Section 16.0. Listed in Section 4.4 aresome typical observed effects when using this modifier.
4.4 Specific Element Interferences
Antimony: Antimony suffers from an interference produced by K SO . In the2 43
absence of hydrogen in the char cycle (1300°C), K SO produces a relatively high2 4
(1.2 abs) background absorbance which can produce a false signal, even withZeeman background correction. However, this background level can bedramatically reduced (0.1 abs) by the use of a hydrogen/argon gas mixture in thechar step. This reduction in background is strongly influenced by thetemperature of the char step.
Note: The actual furnace temperature may vary from instrument to instrument.Therefore, the actual furnace temperataure should be determined on an individualbasis.
Aluminum: The palladium matrix modifier may have elevated levels of Al whichwill cause elevated blank absorbances.
Arsenic: The HCl present from the digestion procedure can influence thesensitivity for As. Twenty µL of a 1% HCl solution with Pd used as a modifierresults in a 20% loss in sensitivity relative to the analyte in a 1% HNO solution.3
Unfortunately, the use of Pd/Mg/H as a modifier does not significantly reduce2
this suppression, and therefore, it is imperative that each sample and calibrationstandard alike contain the same HCl concentration.2
Cadmium: The HCl present from the digestion procedure can influence thesensitivity for Cd. Twenty µL of a 1% HCl solution with Pd used as a modifierresults in a 80% loss in sensitivity relative to the analyte in a 1% HNO solution.3
The use of Pd/Mg/H as a matrix modifier reduces this suppression to less than2
10%.2
Lead: The HCl present from the digestion procedure can influence the sensitivityfor Pb. Twenty µL of a 1% HCl solution with Pd used as a modifier results in a75% loss in sensitivity relative to the analyte response in a 1% HNO solution.3
200.9-9
The use of Pd/Mg/H as a matrix modifier reduces this suppression to less than2
10%.2
Selenium: Iron has been shown to suppress Se response with continuumbackground correction. In addition, the use of hydrogen as a purge gas during3
the dry and char steps can cause a suppression in Se response if not purged fromthe furnace prior to atomization.
Silver: The palladium used in the modifier preparation may have elevated levelsof Ag which will cause elevated blank absorbances.
Thallium: The HCl present from the digestion procedure can influence thesensitivity for Tl. Twenty µL of a 1% HCl solution with Pd used as a modifierresults in a 90% loss in sensitivity relative to the analyte in a 1% HNO solution.3
The use of Pd/Mg/H as a matrix modifier reduces this suppression to less than2
10%. 2
4.5 Memory interferences result from analyzing a sample containing a highconcentration of an element (typically a high atomization temperature element)which cannot be removed quantitatively in one complete set of furnace steps. Theanalyte which remains in the furnace can produce false positive signals onsubsequent sample(s). Therefore, the analyst should establish the analyteconcentration which can be injected into the furnace and adequately removed inone complete set of furnace cycles. If this concentration is exceeded, the sampleshould be diluted and a blank analyzed to assure the memory effect has beeneliminated before reanalyzing the diluted sample.
5.0 SAFETY
5.1 The toxicity or carcinogenicity of each reagent used in this method have not beenfully established. Each chemical should be regarded as a potential health hazardand exposure to these compounds should be as low as reasonably achievable.Each laboratory is responsible for maintaining a current awareness file of OSHAregulations regarding the safe handling of the chemicals specified in this method.4-
A reference file of material data handling sheets should also be made available7
to all personnel involved in the chemical analysis. Specifically, concentrated nitricand hydrochloric acids present various hazards and are moderately toxic andextremely irritating to skin and mucus membranes. Use these reagents in a fumehood whenever possible and if eye or skin contact occurs, flush with largevolumes of water. Always wear safety glasses or a shield for eye protection,protective clothing and observe proper mixing when working with these reagents.
5.2 The acidification of samples containing reactive materials may result in the releaseof toxic gases, such as cyanides or sulfides. Acidification of samples should bedone in a fume hood.

200.9-10
5.3 All personnel handling environmental samples known to contain or to have beenin contact with human waste should be immunized against known diseasecausative agents.
5.4 The graphite tube during atomization emits intense UV radiation. Suitableprecautions should be taken to protect personnel from such a hazard.
5.5 The use of the argon/hydrogen gas mixture during the dry and char steps mayevolve a considerable amount of HCl gas. Therefore, adequate ventilation isrequired.
5.6 It is the responsibility of the user of this method to comply with relevant disposaland waste regulations. For guidance see Sections 14.0 and 15.0.
6.0 EQUIPMENT AND SUPPLIES
6.1 Graphite Furnace Atomic Absorbance Spectrophotometer
6.1.1 The GFAA spectrometer must be capable of programmed heating of thegraphite tube and the associated delayed atomization device. Theinstrument must be equipped with an adequate background correctiondevice capable of removing undesirable non-specific absorbance over thespectral region of interest and provide an analytical condition not subjectto the occurrence of interelement spectral overlap interferences. Thefurnace device must be capable of utilizing an alternate gas supply duringspecified cycles of the analysis. The capability to record relatively fast(<1 s) transient signals and evaluate data on a peak area basis is preferred.In addition, a recirculating refrigeration bath is recommended forimproved reproducibility of furnace temperatures.
6.1.2 Single element hollow cathode lamps or single element electrodelessdischarge lamps along with the associated power supplies.
6.1.3 Argon gas supply (high-purity grade, 99.99%) for use during theatomization of selenium, for sheathing the furnace tube when in operation,and during furnace cleanout.
6.1.4 Alternate gas mixture (hydrogen 5% - argon 95%) for use as a continuousgas flow environment during the dry and char furnace cycles.
6.1.5 Autosampler capable of adding matrix modifier solutions to the furnace,a single addition of analyte, and completing methods of standardadditions when required.
6.2 Analytical balance, with capability to measure to 0.1 mg, for use in weighingsolids, for preparing standards, and for determining dissolved solids in digestsor extracts.
200.9-11
6.3 A temperature adjustable hot plate capable of maintaining a temperature of 95°C.
6.4 (Optional) A temperature adjustable block digester capable of maintaining atemperature of 95°C and equipped with 250 mL constricted digestion tubes.
6.5 (Optional) A steel cabinet centrifuge with guard bowl, electric timer and brake.
6.6 A gravity convection drying oven with thermostatic control capable ofmaintaining 180°C ± 5°C.
6.7 (Optional) An air displacement pipetter capable of delivering volumes rangingfrom 100-2500 µL with an assortment of high quality disposable pipet tips.
6.8 Mortar and pestle, ceramic or nonmetallic material.
6.9 Polypropylene sieve, 5-mesh (4 mm opening).
6.10 Labware - All reusable labware (glass, quartz, polyethylene, PTFE, FEP, etc.)should be sufficiently clean for the task objectives. Several procedures found toprovide clean labware include washing with a detergent solution, rinsing with tapwater, soaking for four hours or more in 20% (v/v) nitric acid or a mixture ofdilute HNO and HCl (1+2+9), rinsing with reagent water and storing clean. 3
1
Ideally, ground glass surfaces should be avoided to eliminate a potential sourceof random contamination. When this is impractical, particular attention shouldbe given to all ground glass surfaces during cleaning. Chromic acid cleaningsolutions must be avoided because chromium is an analyte.
6.10.1 Glassware - Volumetric flasks, graduated cylinders, funnels and centrifugetubes (glass and/or metal-free plastic).
6.10.2 Assorted calibrated pipettes.
6.10.3 Conical Phillips beakers, 250 mL with 50 mm watch glasses.
6.10.4 Griffin beakers, 250 mL with 75 mm watch glasses and (optional) 75 mmribbed watch glasses.
6.10.5 (Optional) PTFE and/or quartz Griffin beakers, 250 mL with PTFE covers.
6.10.6 Evaporating dishes or high-form crucibles, porcelain, 100 mL capacity.
6.10.7 Narrow-mouth storage bottles, FEP (fluorinated ethylene propylene) withscrew closure, 125 mL to 1 L capacities.
6.10.8 One-piece stem FEP wash bottle with screw closure, 125 mL capacity.
7.0 REAGENTS AND STANDARDS

200.9-12
7.1 Reagents may contain elemental impurities which might affect analytical data.Only high-purity reagents that conform to the American Chemical Societyspecifications should be used whenever possible. If the purity of a reagent is in8
question, analyze for contamination. All acids used for this method must be ofultra high-purity grade or equivalent. Suitable acids are available from a numberof manufacturers. Redistilled acids prepared by sub-boiling distillation areacceptable.
7.2 Hydrochloric acid, concentrated (sp.gr. 1.19) - HCl.
7.2.1 Hydrochloric acid (1+1) - Add 500 mL concentrated HCl to 400 mLreagent water and dilute to 1 L.
7.2.2 Hydrochloric acid (1+4) - Add 200 mL concentrated HCl to 400 mL
reagent water and dilute to 1 L.
7.3 Nitric acid, concentrated (sp.gr. 1.41) - HNO . 3
7.3.1 Nitric acid (1+1) - Add 500 mL concentrated HNO to 400 mL reagent3
water and dilute to 1 L.
7.3.2 Nitric acid (1+5) - Add 50 mL concentrated HNO to 250 mL reagent3
water.
7.3.3 Nitric acid (1+9) - Add 10 mL concentrated HNO to 90 mL reagent water.3
7.4 Reagent water. All references to water in this method refer to ASTM Type Igrade water. 9
7.5 Ammonium hydroxide, concentrated (sp. gr. 0.902).
7.6 Tartaric acid, ACS reagent grade.
7.7 Matrix Modifier, dissolve 300 mg palladium (Pd) powder in conc. HNO (1 mL3
of HNO , adding 0.1 mL of concentrated HCl if necessary). Dissolve 200 mg of3
Mg(NO ) in ASTM Type I water. Pour the two solutions together and dilute to3 2
100 mL with ASTM Type I water.
Note: It is recommended that the matrix modifier be analyzed separately in orderto assess the contribution of the modifier to the absorbance of calibration andreagent blank solutions.
7.8 Standard stock solutions may be purchased or prepared from ultra-high puritygrade chemicals (99.99-99.999% pure). All compounds must be dried for one hourat 105°C, unless otherwise specified. It is recommended that stock solutions bestored in FEP bottles. Replace stock standards when succeeding dilutions forpreparation of calibration standards can not be verified.

200.9-13
CAUTION: Many of these chemicals are extremely toxic if inhaled orswallowed (Section 5.1). Wash hands thoroughly after handling.
Typical stock solution preparation procedures follow for 1 L quantities, but for thepurpose of pollution prevention, the analyst is encouraged to prepare smallerquantities when possible. Concentrations are calculated based upon the weightof the pure element or upon the weight of the compound multiplied by thefraction of the analyte in the compound.
From pure element,
From pure compound,
where: gravimetric factor = the weight fraction of the analyte in thecompound
7.8.1 Aluminum solution, stock, 1 mL = 1000 µg Al: Dissolve 1.000 g ofaluminum metal, weighed accurately to at least four significant figures, inan acid mixture of 4.0 mL of (1+1) HCl and 1.0 mL of concentrated HN03
in a beaker. Warm beaker slowly to effect solution. When dissolution iscomplete, transfer solution quantitatively to a 1 L flask, add an additional10.0 mL of (1+1) HCl and dilute to volume with reagent water.
7.8.2 Antimony solution, stock, 1 mL = 1000 µg Sb: Dissolve 1.000 g ofantimony powder, weighed accurately to at least four significant figures,in 20.0 mL (1+1) HNO and 10.0 mL concentrated HCl. Add 100 mL3
reagent water and 1.50 g tartaric acid. Warm solution slightly to effectcomplete dissolution. Cool solution and add reagent water to volume ina 1 L volumetric flask.
7.8.3 Arsenic solution, stock, 1 mL = 1000 µg As: Dissolve 1.320 g of As O2 3
(As fraction = 0.7574), weighed accurately to at least four significantfigures, in 100 mL of reagent water containing 10.0 mL concentratedNH OH. Warm the solution gently to effect dissolution. Acidify the4
solution with 20.0 mL concentrated HNO and dilute to volume in a 1 L3
volumetric flask with reagent water.

200.9-14
7.8.4 Beryllium solution, stock, 1 mL = 1000 µg Be: DO NOT DRY. Dissolve19.66 g BeSO C4H O (Be fraction = 0.0509), weighed accurately to at least4 2
four significant figures, in reagent water, add 10.0 mL concentrated HNO ,3and dilute to volume in a 1 L volumetric flask with reagent water.
7.8.5 Cadmium solution, stock, 1 mL = 1000 µg Cd: Dissolve 1.000 g Cd metal,acid cleaned with (1+9) HNO , weighed accurately to at least four3
significant figures, in 50 mL (1+1) HNO with heating to effect dissolution.3
Let solution cool and dilute with reagent water in a 1 L volumetric flask.
7.8.6 Chromium solution, stock, 1 mL = 1000 µg Cr: Dissolve 1.923 g CrO3
(Cr fraction = 0.5200), weighed accurately to at least four significantfigures, in 120 mL (1+5) HNO . When solution is complete, dilute to3
volume in a 1 L volumetric flask with reagent water.
7.8.7 Cobalt solution, stock, 1 mL = 1000 µg Co: Dissolve 1.000 g Co metal,acid cleaned with (1+9) HNO , weighed accurately to at least four3
significant figures, in 50.0 mL (1+1) HNO . Let solution cool and dilute3
to volume in a 1 L volumetric flask with reagent water.
7.8.8 Copper solution, stock, 1 mL = 1000 µg Cu: Dissolve 1.000 g Cu metal,acid cleaned with (1+9) HNO , weighed accurately to at least four3
significant figures, in 50.0 mL (1+1) HNO with heating to effect3
dissolution. Let solution cool and dilute in a 1 L volumetric flask withreagent water.
7.8.9 Iron solution, stock, 1 mL = 1000 µg Fe: Dissolve 1.000 g Fe metal, acidcleaned with (1+1) HCl, weighed accurately to four significant figures, in100 mL (1+1) HCl with heating to effect dissolution. Let solution cool anddilute with reagent water in a 1 L volumetric flask.
7.8.10 Lead solution, stock, 1 mL = 1000 µg Pb: Dissolve 1.599 g Pb(NO )3 2
(Pb fraction = 0.6256), weighed accurately to at least four significantfigures, in a minimum amount of (1+1) HNO . Add 20.0 mL (1+1) HNO3 3
and dilute to volume in a 1 L volumetric flask with reagent water.
7.8.11 Manganese solution, stock, 1 mL = 1000 µg Mn: Dissolve 1.000 g ofmanganese metal, weighed accurately to at least four significant figures,in 50 mL (1+1) HNO and dilute to volume in a 1 L volumetric flask with3
reagent water.
7.8.12 Nickel solution, stock, 1 mL = 1000 µg Ni: Dissolve 1.000 g of nickelmetal, weighed accurately to at least four significant figures, in 20.0 mLhot concentrated HNO , cool, and dilute to volume in a 1 L volumetric3
flask with reagent water.
7.8.13 Selenium solution, stock, 1 mL = 1000 µg Se: Dissolve 1.405 g SeO2
(Se fraction = 0.7116), weighed accurately to at least four significant

200.9-15
figures, in 200 mL reagent water and dilute to volume in a 1 L volumetricflask with reagent water.
7.8.14 Silver solution, stock, 1 mL = 1000 µg Ag: Dissolve 1.000 g Ag metal,weighed accurately to at least four significant figures, in 80 mL (1+1)HNO with heating to effect dissolution. Let solution cool and dilute with3
reagent water in a 1 L volumetric flask. Store solution in amber bottle orwrap bottle completely with aluminum foil to protect solution from light.
7.8.15 Thallium solution, stock, 1 mL = 1000 µg Tl: Dissolve 1.303 g TlNO3
(Tl fraction = 0.7672), weighed accurately to at least four significantfigures, in reagent water. Add 10.0 mL concentrated HNO and dilute to3
volume in a 1 L volumetric flask with reagent water.
7.8.16 Tin solution, stock, 1 mL = 1000 µg Sn: Dissolve 1.000 g Sn shot, weighedaccurately to at least four significant figures, in an acid mixture of 10.0 mLconcentrated HCl and 2.0 mL (1+1) HNO with heating to effect3
dissolution. Let solution cool, add 200 mL concentrated HCl, and diluteto volume in a 1 L volumetric flask with reagent water.
7.9 Preparation of Calibration Standards - Fresh calibration standards (CAL Solution)should be prepared every two weeks, or as needed. Dilute each of the stockstandard solutions to levels appropriate to the operating range of the instrumentusing the appropriate acid diluent (see note). The element concentrations in eachCAL solution should be sufficiently high to produce good measurement precisionand to accurately define the slope of the response curve. The instrumentcalibration should be initially verified using a quality control sample (Sections7.12 and 9.2.3).
Note: The appropriate acid diluent for the determination of dissolved elementsin water and for the "direct analysis" of drinking water with turbidity <1 NTU is1% HNO . For total recoverable elements in waters, the appropriate acid diluent3
is 2% HNO and 1% HCl, and the appropriate acid diluent for total recoverable3
elements in solid samples is 2% HNO and 2% HCl. The reason for these3
different diluents is to match the types of acids and the acid concentrations of thesamples with the acid present in the standards and blanks.
7.10 Blanks - Four types of blanks are required for this method. A calibration blankis used to establish the analytical calibration curve, the laboratory reagent blank(LRB) is used to assess possible contamination from the sample preparationprocedure and to assess spectral background, the laboratory fortified blank isused to assess routine laboratory performance, and a rinse blank is used to flushthe instrument autosampler uptake system. All diluent acids should be madefrom concentrated acids (Sections 7.2 and 7.3) and ASTM Type I water.
7.10.1 The calibration blank consists of the appropriate acid diluent (Section 7.9note) (HCl/HNO ) in ASTM Type I water. The calibration blank should3
be stored in a FEP bottle.
200.9-16
7.10.2 The laboratory reagent blank (LRB) must contain all the reagents in thesame volumes as used in processing the samples. The LRB must becarried through the same entire preparation scheme as the samplesincluding sample digestion, when applicable.
7.10.3 The laboratory fortified blank (LFB) is prepared by fortifying an aliquotof the laboratory reagent blank with all analytes to provide a finalconcentration which will produce an absorbance of approximately 0.1 foreach analyte. The LFB must be carried through the same entirepreparation scheme as the samples including sample digestion, whenapplicable.
7.10.4 The rinse blank is prepared as needed by adding 1.0 mL of conc. HNO3
and 1.0 mL conc. HCl to 1 L of ASTM Type I water and stored in aconvenient manner.
7.11 Instrument Performance Check (IPC) Solution - The IPC solution is used toperiodically verify instrument performance during analysis. It should beprepared in the same acid mixture as the calibration standards (Section 7.9 note)by combining method analytes at appropriate concentrations to approximate themidpoint of the calibration curve. The IPC solution should be prepared from thesame standard stock solutions used to prepare the calibration standards andstored in a FEP bottle. Agency programs may specify or request that additionalinstrument performance check solutions be prepared at specified concentrationsin order to meet particular program needs.
7.12 Quality Control Sample (QCS) - For initial and periodic verification of calibrationstandards and instrument performance, analysis of a QCS is required. The QCSmust be obtained from an outside source different from the standard stocksolutions and prepared in the same acid mixture as the calibration standards(Section 7.9 note). The concentration of the analytes in the QCS solution shouldbe such that the resulting solution will provide an absorbance reading ofapproximately 0.1. The QCS solution should be stored in a FEP bottle andanalyzed as needed to meet data-quality needs. A fresh solution should beprepared quarterly or more frequently as needed.
8.0 SAMPLE COLLECTION, PRESERVATION, AND STORAGE
8.1 Prior to the collection of an aqueous sample, consideration should be given to thetype of data required, (i.e., dissolved or total recoverable), so that appropriatepreservation and pretreatment steps can be taken. The pH of all aqueous samplesmust be tested immediately prior to aliquoting for processing or "direct analysis"to ensure the sample has been properly preserved. If properly acid preserved, thesample can be held up to six months before analysis.
8.2 For the determination of the dissolved elements, the sample must be filtered
through a 0.45 µm pore diameter membrane filter at the time of collection or assoon thereafter as practically possible. (Glass or plastic filtering apparatus are

200.9-17
recommended to avoid possible contamination.) Use a portion of the filteredsample to rinse the filter flask, discard this portion and collect the requiredvolume of filtrate. Acidify the filtrate with (1+1) nitric acid immediately followingfiltration to pH <2.
8.3 For the determination of total recoverable elements in aqueous samples, samplesare not filtered, but acidified with (1+1) nitric acid to pH <2 (normally, 3 mL of(1+1) acid per liter of sample is sufficient for most ambient and drinking watersamples). Preservation may be done at the time of collection, however, to avoidthe hazards of strong acids in the field, transport restrictions, and possiblecontamination it is recommended that the samples be returned to the laboratorywithin two weeks of collection and acid preserved upon receipt in the laboratory.Following acidification, the sample should be mixed, held for 16 hours, and thenverified to be pH <2 just prior withdrawing an aliquot for processing or "directanalysis". If for some reason such as high alkalinity the sample pH is verified tobe >2, more acid must be added and the sample held for 16 hours until verifiedto be pH <2. See Section 8.1.
Note: When the nature of the sample is either unknown or is known to behazardous, acidification should be done in a fume hood. See Section 5.2.
8.4 Solid samples usually require no preservation prior to analysis other than storageat 4°C. There is no established holding time limitation for solid samples.
8.5 For aqueous samples, a field blank should be prepared and analyzed as requiredby the data user. Use the same container and acid as used in sample collection.
200.9-18
9.0 QUALITY CONTROL
9.1 Each laboratory using this method is required to operate a formal quality control(QC) program. The minimum requirements of this program consist of an initialdemonstration of laboratory capability, and the periodic analysis of laboratoryreagent blanks, fortified blanks and other laboratory solutions as a continuingcheck on performance. The laboratory is required to maintain performancerecords that define the quality of the data thus generated.
9.2 Initial Demonstration of Performance (mandatory)
9.2.1 The initial demonstration of performance is used to characterizeinstrument performance (determination of linear dynamic ranges andanalysis of quality control samples) and laboratory performance(determination of method detection limits) prior to samples beinganalyzed by this method.
9.2.2 Linear dynamic range (LDR) - The upper limit of the LDR must beestablished for the wavelength utilized for each analyte by determiningthe signal responses from a minimum of six different concentrationstandards across the range, two of which are close to the upper limit ofthe LDR. Determined LDRs must be documented and kept on file. Thelinear calibration range which may be used for the analysis of samplesshould be judged by the analyst from the resulting data. The upper LDRlimit should be an observed signal no more than 10% below the levelextrapolated from the four lower standards. The LDRs should be verifiedwhenever, in the judgement of the analyst, a change in analyticalperformance caused by either a change in instrument hardware oroperating conditions would dictate they be redetermined.
Note: Multiple cleanout furnace cycles may be necessary in order to fullydefine or utilize the LDR for certain elements such as chromium. For thisreason the upper limit of the linear calibration range may not correspondto the upper LDR limit.
Determined sample analyte concentrations that exceed the upper limit ofthe linear calibration range must either be diluted and reanalyzed withconcern for memory effects (Section 4.4) or analyzed by another approvedmethod.
9.2.3 Quality control sample (QCS) - When beginning the use of this method,
on a quarterly basis or as required to meet data-quality needs, verify thecalibration standards and acceptable instrument performance with thepreparation and analyses of a QCS (Section 7.12). If the determinedconcentrations are not within ± 10% of the stated values, performance ofthe determinative step of the method is unacceptable. The source of theproblem must be identified and corrected before either proceeding on with

200.9-19
the initial determination of method detection limits or continuing with on-going analyses.
9.2.4 Method detection limit (MDL) - MDLs must be established for all analytes,using reagent water (blank) fortified at a concentration of two to threetimes the estimated instrument detection limit. To determine MDL10
values, take seven replicate aliquots of the fortified reagent water andprocess through the entire analytical method. Perform all calculationsdefined in the method and report the concentration values in theappropriate units. Calculate the MDL as follows:
where: t = Student's t value for a 99% confidence level and astandard
deviation estimate with n-1 degrees of freedom [t = 3.14 for seven replicates]
S = standard deviation of the replicate analyses
Note: If additional confirmation is desired, reanalyze the seven replicatealiquots on two more nonconsecutive days and again calculate the MDLvalues for each day. An average of the three MDL values for each analytemay provide for a more appropriate MDL estimate. If the relativestandard deviation (RSD) from the analyses of the seven aliquots is <10%,the concentration used to determine the analyte MDL may have beeninapprop-riately high for the determination. If so, this could result in thecalculation of an unrealistically low MDL. Concurrently, determinationof MDL in reagent water represents a best case situation and does notreflect possible matrix effects of real world samples. However, successfulanalyses of LFMs (Section 9.4) and the analyte addition test described inSection 9.5.1 can give confidence to the MDL value determined in reagentwater. Typical single laboratory MDL values using this method are givenin Table 2.
The MDLs must be sufficient to detect analytes at the required levelsaccording to compliance monitoring regulation (Section 1.2). MDLsshould be determined annually, when a new operator begins work orwhenever, in the judgement of the analyst, a change in analyticalperformance caused by either a change in instrument hardware oroperating conditions would dictate they be redetermined.
9.3 Assessing Laboratory Performance (mandatory)
9.3.1 Laboratory reagent blank (LRB) - The laboratory must analyze at least oneLRB (Section 7.10.2) with each batch of 20 or fewer samples of the same
200.9-20
matrix. LRB data are used to assess contamination from the laboratoryenvironment. LRB values that exceed the MDL indicate laboratory orreagent contamination should be suspected. When LRB values constitute10% or more of the analyte level determined for a sample or is 2.2 timesthe analyte MDL whichever is greater, fresh aliquots of the samples mustbe prepared and analyzed again for the affected analytes after the sourceof contamination has been corrected and acceptable LRB values have beenobtained.
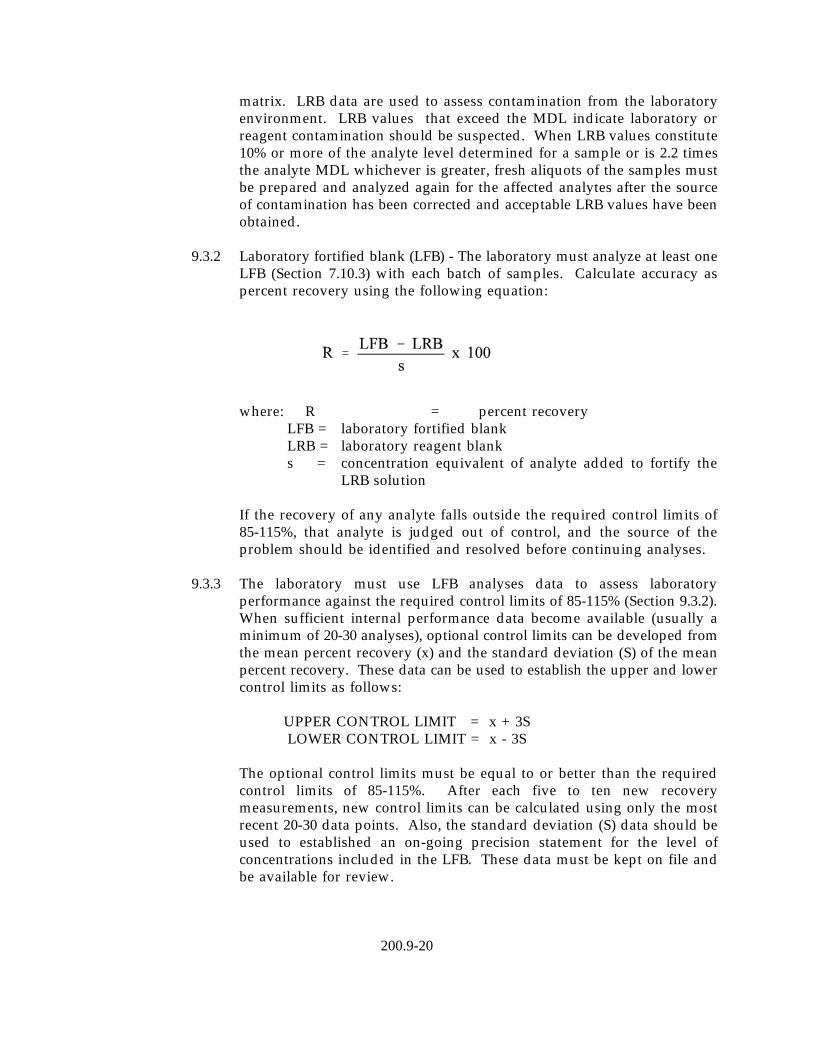
9.3.2 Laboratory fortified blank (LFB) - The laboratory must analyze at least oneLFB (Section 7.10.3) with each batch of samples. Calculate accuracy aspercent recovery using the following equation:
where: R = percent recoveryLFB = laboratory fortified blankLRB = laboratory reagent blanks = concentration equivalent of analyte added to fortify the
LRB solution
If the recovery of any analyte falls outside the required control limits of85-115%, that analyte is judged out of control, and the source of theproblem should be identified and resolved before continuing analyses.
9.3.3 The laboratory must use LFB analyses data to assess laboratoryperformance against the required control limits of 85-115% (Section 9.3.2).When sufficient internal performance data become available (usually aminimum of 20-30 analyses), optional control limits can be developed fromthe mean percent recovery (x) and the standard deviation (S) of the meanpercent recovery. These data can be used to establish the upper and lowercontrol limits as follows:
UPPER CONTROL LIMIT = x + 3SLOWER CONTROL LIMIT = x - 3S
The optional control limits must be equal to or better than the requiredcontrol limits of 85-115%. After each five to ten new recoverymeasurements, new control limits can be calculated using only the mostrecent 20-30 data points. Also, the standard deviation (S) data should beused to established an on-going precision statement for the level ofconcentrations included in the LFB. These data must be kept on file andbe available for review.

200.9-21
9.3.4 Instrument performance check (IPC) solution - For all determinations thelaboratory must analyze the IPC solution (Section 7.11) and a calibrationblank immediately following each calibration, after every 10th sample (ormore frequently, if required) and at the end of the sample run. Analysisof the calibration blank should always be less than the IDL, but greaterthan a negative signal in concentration units equal to the IDL. Analysisof the IPC solution immediately following calibration must verify that theinstrument is within ±5% of calibration. Subsequent analyses of the IPCsolution must be within ±10 % of calibration. If the calibration cannot beverified within the specified limits, reanalyze either or both the IPCsolution and the calibration blank. If the second analysis of the IPCsolution or the calibration blank confirm the calibration to be outside thelimits, sample analysis must be discontinued, the cause determinedand/or in the case of drift the instrument recalibrated. All samplesfollowing the last acceptable IPC solution must be reanalyzed. Theanalysis data of the calibration blank and IPC solution must be kept onfile with the sample analyses data.
9.4 Assessing Analyte Recovery and Data Quality
9.4.1 Sample homogeneity and the chemical nature of the sample matrix canaffect analyte recovery and the quality of the data. Taking separatealiquots from the sample for replicate and fortified analyses can in somecases assess these effects. Unless otherwise specified by the data user,laboratory or program, the following laboratory fortified matrix (LFM)procedure (Section 9.4.2) is required. Also, the analyte addition test(Section 9.5.1) can indicate if matrix and other interference effects areoperative in selected samples. However, all samples must demonstrate abackground absorbance <1.0 before the test results obtained can beconsidered reliable.
9.4.2 The laboratory must add a known amount of each analyte to a minimumof 10% of the routine samples. In each case the LFM aliquot must be aduplicate of the aliquot used for sample analysis and for total recoverabledeterminations added prior to sample preparation. For water samples, theadded analyte concentration must be the same as that used in thelaboratory fortified blank (Section 9.3.2). For solid samples, however, theconcentration added should be expressed as mg/kg and is calculated fora 1 g aliquot by multiplying the added analyte concentration (µg/L) insolution by the conversion factor 0.1 (0.001 x µg/L x 0.1L/0.001kg = 0.1,Section 12.4). Over time, samples from all routine sample sources shouldbe fortified.
9.4.3 Calculate the percent recovery for each analyte, corrected forconcentrations measured in the unfortified sample, and compare thesevalues to the designated LFM recovery range of 70-130%. Recoverycalculations are not required if the concentration added is less than 25%

200.9-22
of the unfortified sample concentration. Percent recovery may becalculated in units appropriate to the matrix, using the following equation:
where: R = percent recoveryC = fortified sample concentrations
C = sample background concentrations = concentration equivalent of analyte added to fortify
thesample
9.4.4 If the recovery of any analyte falls outside the designated LFM recoveryrange (but is still within the range of calibration) and the laboratoryperformance for that analyte is shown to be in control (Section 9.3), therecovery problem encountered with the LFM is judged to be either matrixor solution related, not system related. If the analyte recovery in the LFMis <70% and the background absorbance is <1.0, complete the analyteaddition test (Section 9.5.1) on an undiluted portion of the unfortifiedsample aliquot. The test results should be evaluated as follows:
1. If recovery of the analyte addition test (<85%) confirms the a lowrecovery for the LFM, a suppressive matrix interference isindicated and the unfortified sample aliquot must be analyzed bymethod of standard additions (Section 11.5).
2. If the recovery of the analyte addition test is between 85-115%, alow recovery of the analyte in the LFM (<70%) may be related tothe heterogeneous nature of the sample, the result of precipitationloss during sample preparation, or an incorrect addition prior topreparation. Report analyte data determined from the analysis ofthe unfortified sample aliquot.
9.4.5 If laboratory performance is shown to be in control (Section 9.3), butanalyte recovery in the LFM is either >130% or above the uppercalibration limit and the background absorbance is <1.0, complete theanalyte addition test (Section 9.5.1) on a portion of the unfortified samplealiquot. (If the determined LFM concentration is above the uppercalibration limit, dilute a portion of the unfortified aliquot accordinglywith acidified reagent water before completing the analyte addition test.)Evaluate the test results as follows:
200.9-23
1. If the percent recovery of the analyte addition test is >115%, anenhancing matrix interference (albeit rare) is indicated and theunfortified sample aliquot or its appropriate dilution must beanalyzed by method of standard additions (Section 11.5).
2. If the percent recovery of the analyte addition test is between85-115%, high recovery in the LFM may have been caused byrandom sample contamination, an incorrect addition of the analyteprior to sample preparation, or sample heterogeneity. Reportanalyte data determined from the analysis of the unfortifiedsample aliquot or its appropriate dilution.
3. If the percent recovery of the analyte addition test is <85%, eithera case of both random contamination and an operative matrixinterference in the LFM is indicated or a more plausible answer isa heterogenous sample with an suppressive matrix interference.Reported data should be flagged accordingly.
9.4.6 If laboratory performance is shown to be in control (Section 9.3), but themagnitude of the sample (LFM or unfortified aliquot) backgroundabsorbance is >1.0, a non-specific spectral interference should besuspected. A portion of the unfortified aliquot should be diluted (1+3)with acidified reagent water and reanalyzed. (Dilution may dramaticallyreduce a molecular background to an acceptable level. Ideally, thebackground absorbance in the unfortified aliquot diluted (1+3) should be<1.0. However, additional dilution may be necessary.) If dilution reducesthe background absorbance to acceptable level (<1.0), complete the analyteaddition test (Section 9.5.1) on a portion of the diluted unfortified aliquot.Evaluate the test results as follows:
1. If the recovery of the analyte addition test is between 85-115%,report analyte data determined on the dilution of the unfortifiedaliquot.
2. If the recovery of the analyte addition test is outside the range of85-115%, complete the sample analysis by analyzing the dilutionof the unfortified aliquot by method of standard additions(Section 11.5).
9.4.7 If either the analysis of a LFM sample(s) or application of the analyteaddition test routine indicate an operative interference, all other samplesin the batch which are typical and have similar matrix to the LFMs or thesamples tested must be analyzed in the same manner. Also, the data usermust be informed when a matrix interference is so severe that it preventsthe successful analysis of the analyte or when the heterogeneous natureof the sample precludes the use of duplicate analyses.

200.9-24
9.4.8 Where reference materials are available, they should be analyzed toprovide additional performance data. The analysis of reference samplesis a valuable tool for demonstrating the ability to perform the methodacceptably.
9.5 The following test can be used to assess possible matrix interference effects andthe need to complete the sample analysis by method of standard additions (MSA).Results of this test should not be considered conclusive unless the determinedsample background absorbance is <1.0. Directions for MSA are given in Section11.5.
9.5.1 Analyte addition test: An analyte standard added to a portion of aprepared sample, or its dilution, should be recovered to within 85-115%of the known value. The analyte addition may be added directly tosample in the furnace and should produce a minimum level absorbanceof 0.1. The concentration of the analyte addition plus that in the sampleshould not exceed the linear calibration range of the analyte. If theanalyte is not recovered within the specified limits, a matrix effect shouldbe suspected and the sample must be analyzed by MSA (Section 11.5).
10.0 CALIBRATION AND STANDARDIZATION
10.1 Specific wavelengths and instrument operating conditions are listed in Table 2.However, because of differences among makes and models of spectrophotometersand electrothermal furnace devices, the actual instrument conditions selected mayvary from those listed.
10.2 Prior to the use of this method the instrument operating conditions must beoptimized. The analyst should follow the instructions provided by themanufacturer while using the conditions listed in Table 2 as a guide. Ofparticular importance is the determination of the charring temperature limit foreach analyte. This limit is the furnace temperature setting where a loss in analytewill occur prior to atomization. This limit should be determined by conductingchar temperature profiles for each analyte and when necessary, in the matrix ofquestion. The charring temperature selected should minimize backgroundabsorbance while providing some furnace temperature variation without loss ofanalyte. For routine analytical operation the charring temperature is usually setat least 100°C below this limit. The optimum conditions selected should providethe lowest reliable MDLs and be similar to those listed in Table 2. Once theoptimum operating conditions are determined, they should be recorded andavailable for daily reference.
10.3 Prior to an initial calibration the linear dynamic range of the analyte must bedetermined (Section 9.2.2) using the optimized instrument operating conditions(Section 10.2). For all determinations allow an instrument and hollow cathodelamp warm up period of not less than 15 min. If an EDL is to be used, allow30 minutes for warm up.
200.9-25
10.4 Before using the procedure (Section 11.0) to analyze samples, there must be dataavailable documenting initial demonstration of performance. The required dataand procedure are described in Section 9.2. This data must be generated usingthe same instrument operating conditions and calibration routine (Section 11.4)to be used for sample analysis. These documented data must be kept on file andbe available for review by the data user.
10.5 In order to meet or achieve lower MDLs than those listed in Table 2 for "directanalysis" of drinking water with turbidity <1 NTU preconcentration of the analyteis required. This may be accomplished prior to sample introduction into theGFAA or with the use of multiple aliquot depositions on the GFAA platform orassociated delayed atomization device. When using multiple depositions, thesame number of equal volume aliquots alike of either the calibration standardsor acid preserved samples must be deposited prior to atomization. Followingeach deposition the drying cycle is completed before the next subsequentdeposition. The matrix modifier is added along with each deposition and thetotal volume of each deposition must not exceed the instrument manufacturesrecommended capacity of the delayed atomization device. To reduce analysistime the minimum number of depositions required to achieve the desiredanalytical result should be used. Use of this procedural technique for the "directanalysis" of drinking water must be completed using determined optimizedinstrument operating conditions for multiple depositions (Section 10.2) andcomply with the method requirements described in Sections 10.3 and 10.4. (SeeTable 3 for information and data on the determination of arsenic by thisprocedure.)
11.0 PROCEDURE
11.1 Aqueous Sample Preparation - Dissolved Analytes
11.1.1 For the determination of dissolved analytes in ground and surface waters,pipet an aliquot (≥20 mL) of the filtered, acid preserved sample into a50 mL polypropylene centrifuge tube. Add an appropriate volume of(1+1) nitric acid to adjust the acid concentration of the aliquot toapproximate a 1% (v/v) nitric acid solution (e.g., add 0.4 mL (1+1) HNO3
to a 20 mL aliquot of sample). Cap the tube and mix. The sample is nowready for analysis (Section 1.3). Allowance for sample dilution should bemade in the calculations.
Note: If a precipitate is formed during acidification, transport, or storage,the sample aliquot must be treated using the procedure described inSections 11.2.2 through 11.2.7 prior to analysis.
11.2 Aqueous Sample Preparation - Total Recoverable Analytes
11.2.1 For the "direct analysis" of total recoverable analytes in drinking watersamples containing turbidity <1 NTU, treat an unfiltered acid preservedsample aliquot using the sample preparation procedure described in

200.9-26
Section 11.1.1 while making allowance for sample dilution in the datacalculation (Sections 1.2 and 1.4). For the determination of totalrecoverable analytes in all other aqueous samples follow the proceduregiven in Sections 11.2.2 through 11.2.7.
11.2.2 For the determination of total recoverable analytes in aqueous samples(other than drinking water with <1 NTU turbidity), transfer a 100 mL(±1 mL) aliquot from a well mixed, acid preserved sample to a 250 mLGriffin beaker (Sections 1.2 and 1.6). (When necessary, smaller samplealiquot volumes may be used.)
Note: If the sample contains undissolved solids >1%, a well mixed, acidpreserved aliquot containing no more than 1 g particulate material shouldbe cautiously evaporated to near 10 mL and extracted using the acid-mixture procedure described in Sections 11.3.3 through 11.3.6.
11.2.3 Add 2 mL (1+1) nitric acid and 1.0 mL of (1+1) hydrochloric acid to thebeaker containing the measured volume of sample. Place the beaker onthe hot plate for solution evaporation. The hot plate should be located ina fume hood and previously adjusted to provide evaporation at atemperature of approximately but no higher than 85°C. (See the followingnote.) The beaker should be covered with an elevated watch glass orother necessary steps should be taken to prevent sample contaminationfrom the fume hood environment.
Note: For proper heating adjust the temperature control of the hot platesuch that an uncovered Griffin beaker containing 50 mL of water placedin the center of the hot plate can be maintained at a temperatureapproximately but no higher than 85 C. (Once the beaker is covered witho
a watch glass the temperature of the water will rise to approximately95 C.)o
11.2.4 Reduce the volume of the sample aliquot to about 20 mL by gentle heatingat 85°C. DO NOT BOIL. This step takes about two hours for a 100 mLaliquot with the rate of evaporation rapidly increasing as the samplevolume approaches 20 mL. (A spare beaker containing 20 mL of watercan be used as a gauge.)
11.2.5 Cover the lip of the beaker with a watch glass to reduce additionalevaporation and gently reflux the sample for 30 minutes. (Slight boilingmay occur, but vigorous boiling must be avoided to prevent loss of theHCl-H O azeotrope.)2
11.2.6 Allow the beaker to cool. Quantitatively transfer the sample solution toa 50 mL volumetric flask, make to volume with reagent water, stopperand mix.
200.9-27
11.2.7 Allow any undissolved material to settle overnight, or centrifuge a portionof the prepared sample until clear. (If after centrifuging or standingovernight the sample contains suspended solids that would clog or affectthe sample introduction system, a portion of the sample may be filteredfor their removal prior to analysis. However, care should be exercised toavoid potential contamination from filtration.) The sample is now readyfor analysis. Because the effects of various matrices on the stability ofdiluted samples cannot be characterized, all analyses should be performedas soon as possible after the completed preparation.
11.3 Solid Sample Preparation - Total Recoverable Analytes
11.3.1 For the determination of total recoverable analytes in solid samples, mixthe sample thoroughly and transfer a portion (>20 g) to tared weighingdish, weigh the sample and record the wet weight (WW). (For sampleswith <35% moisture a 20 g portion is sufficient. For samples withmoisture >35% a larger aliquot 50-100 g is required.) Dry the sample toa constant weight at 60°C and record the dry weight (DW) for calculationof percent solids (Section 12.6). (The sample is dried at 60°C to preventthe possible loss of volatile metallic compounds, to facilitate sieving, andto ready the sample for grinding.)
11.3.2 To achieve homogeneity, sieve the dried sample using a 5-meshpolypropylene sieve and grind in a mortar and pestle. (The sieve, mortarand pestle should be cleaned between samples.) From the dried, groundmaterial weigh accurately a representative 1.0 ± 0.01 g aliquot (W) of thesample and transfer to a 250 mL Phillips beaker for acid extraction(Section 1.6).
11.3.3 To the beaker add 4 mL of (1+1) HNO and 10 mL of (1+4) HCl. Cover3
the lip of the beaker with a watch glass. Place the beaker on a hot platefor reflux extraction of the analytes. The hot plate should be located in afume hood and previously adjusted to provide a reflux temperature ofapproximately 95°C. (See the following note.)
Note: For proper heating adjust the temperature control of the hot platesuch that an uncovered Griffin beaker containing 50 mL of water placedin the center of the hot plate can be maintained at a temperatureapproximately but no higher than 85°C. (Once the beaker is covered witha watch glass the temperature of the water will rise to approximately95°C.) Also, a block digester capable of maintaining a temperature of95°C and equipped with 250 mL constricted volumetric digestion tubesmay be substituted for the hot plate and conical beakers in the extractionstep.
11.3.4 Heat the sample and gently reflux for 30 minutes. Very slight boiling mayoccur, however vigorous boiling must be avoided to prevent loss of theHCl-H O azeotrope. Some solution evaporation will occur (3-4 mL).2
200.9-28
11.3.5 Allow the sample to cool and quantitatively transfer the extract to a100 mL volumetric flask. Dilute to volume with reagent water, stopperand mix.
11.3.6 Allow the sample extract solution to stand overnight to separate insolublematerial or centrifuge a portion of the sample solution until clear. (If aftercentrifuging or standing overnight the extract solution contains suspendedsolids that would clog or affect the sample introduction system, a portionof the extract solution may be filtered for their removal prior to analysis.However, care should be exercised to avoid potential contamination fromfiltration.) The sample extract is now ready for analysis. Because theeffects of various matrices on the stability of diluted samples cannot becharacterized, all analyses should be performed as soon as possible afterthe completed preparation.
11.4 Sample Analysis
11.4.1 Prior to daily calibration of the instrument inspect the graphite furnace,the sample uptake system and autosampler injector for any change in thesystem that would affect instrument performance. Clean the system andreplace the graphite tube and/or platform when needed or on a dailybasis.
11.4.2 Before beginning daily calibration the instrument system should bereconfigured to the selected optimized operating conditions as determinedin Sections 10.1 and 10.2 or 10.5 for the "direct analysis" drinking waterwith turbidity <1 NTU. Initiate data system and allow a period of not lessthan 15 minutes for instrument and hollow cathode lamp warm up. If anEDL is to be used, allow 30 minutes for warm up.
11.4.3 After the warm up period but before calibration, instrument stability mustbe demonstrated by analyzing a standard solution with a concentration20 times the IDL a minimum of five times. The resulting relative standarddeviation (RSD) of absorbance signals must be <5%. If the RSD is >5%,determine and correct the cause before calibrating the instrument.
11.4.4 For initial and daily operation calibrate the instrument according to theinstrument manufacturer's recommended procedures using the calibrationblank (Section 7.10.1) and calibration standards (Section 7.9) prepared atthree or more concentrations within the usable linear dynamic range of theanalyte (Sections 4.4 and 9.2.2).
11.4.5 An autosampler must be used to introduce all solutions into the graphitefurnace. Once the standard, sample or QC solution plus the matrixmodifier is injected, the furnace controller completes furnace cycles andcleanout period as programmed. Analyte signals must be integrated andcollected as peak area measurements. Background absorbances,background corrected analyte signals, and determined analyte

200.9-29
concentrations on all solutions must be able to be displayed on a CRT forimmediate review by the analyst and be available as hard copy fordocumentation to be kept on file. Flush the autosampler solution uptakesystem with the rinse blank (Section 7.10.4) between each solution injected.
11.4.6 After completion of the initial requirements of this method (Section 10.4),
samples should be analyzed in the same operational manner used in thecalibration routine.
11.4.7 During the analysis of samples, the laboratory must comply with therequired quality control described in Sections 9.3 and 9.4. Only for thedetermination of dissolved analytes or the "direct analysis" of drinkingwater with turbidity of <1 NTU is the sample digestion step of the LRB,LFB, and LFM not required.
11.4.8 For every new or unusual matrix, when practical, it is highlyrecommended that an inductively coupled plasma atomic emissionspectrometer be used to screen for high element concentration.Information gained from this may be used to prevent potential damage tothe instrument and to better estimate which elements may require analysisby graphite furnace.
11.4.9 Determined sample analyte concentrations that are 90% or more of theupper limit of calibration must either be diluted with acidified reagentwater and reanalyzed with concern for memory effects (Section 4.4), ordetermined by another approved test procedure that is less sensitive.Samples with a background absorbance >1.0 must be appropriately dilutedwith acidified reagent water and reanalyzed (Section 9.4.6). If the methodof standard additions is required, follow the instructions described inSection 11.5.
11.4.10 When it is necessary to assess an operative matrix interference(e.g., signal reduction due to high dissolved solids), the testdescribed in Section 9.5 is recommended.
11.4.11 Report data as directed in Section 12.0.

200.9-30
11.5 Standard Additions - If the method of standard addition is required, the followingprocedure is recommended:
11.5.1 The standard addition technique involves preparing new standards in11
the sample matrix by adding known amounts of standard to one or morealiquots of the processed sample solution. This technique compensates fora sample constituent that enhances or depresses the analyte signal, thusproducing a different slope from that of the calibration standards. It willnot correct for additive interference, which causes a baseline shift. Thesimplest version of this technique is the single-addition method. Theprocedure is as follows: Two identical aliquots of the sample solution,each of volume V , are taken. To the first (labeled A) is added a smallX
volume V of a standard analyte solution of concentration C . To theS S
second (labeled B) is added the same volume V of the solvent. TheS
analytical signals of A and B are measured and corrected for nonanalytesignals. The unknown sample concentration C is calculated: X
where: S and S = the analytical signals (corrected for the blank) ofA B
Solutions A and B, respectively. V and C should be chosen so that S S S A
is roughly twice S on the average. It is best if V is made much less than B S
V , and thus C i much greater than C , to avoid excess dilution of theX S X
sample matrix.If a separation or concentration step is used, the additions are best madefirst and carried through the entire procedure. For the results from thistechnique to be valid, the following limitations must be taken intoconsideration:
1. The analytical curve must be linear.
2. The chemical form of the analyte added must respond in the samemanner as the analyte in the sample.
3. The interference effect must be constant over the working range ofconcern.
4. The signal must be corrected for any additive interference.
12.0 DATA ANALYSIS AND CALCULATIONS
12.1 Sample data should be reported in units of µg/L for aqueous samples and mg/kgdry weight for solid samples.
200.9-31
12.2 For dissolved aqueous analytes (Section 11.1) report the data generated directlyfrom the instrument with allowance for sample dilution. Do not report analyteconcentrations below the IDL.
12.3 For total recoverable aqueous analytes (Section 11.2), multiply solution analyteconcentrations by the dilution factor 0.5, when 100 mL aliquot is used to producethe 50 mL final solution, round the data to the tenths place and report the datain µg/L up to three significant figures. If a different aliquot volume other than100 mL is used for sample preparation, adjust the dilution factor accordingly.Also, account for any additional dilution of the prepared sample solution neededto complete the determination of analytes exceeding the upper limit of thecalibration curve. Do not report data below the determined analyte MDLconcentration or below an adjusted detection limit reflecting smaller samplealiquots used in processing or additional dilutions required to complete theanalysis.
12.4 For total recoverable analytes in solid samples (Section 11.3), round the solutionanalyte concentrations (µg/L) to the tenths place. Report the data up to threesignificant figures as mg/kg dry-weight basis unless specified otherwise by theprogram or data user. Calculate the concentration using the equation below:
where: C = Concentration in the extract (mg/L)V = Volume of extract (L, 100 mL = 0.1L)D = Dilution factor (undiluted = 1)W = Weight of sample aliquot extracted (g x 0.001 = kg)
Do not report analyte data below the estimated solids MDL or an adjusted MDLbecause of additional dilutions required to complete the analysis.
200.9-32
12.5 To report percent solids in solid samples (Section 11.3) calculate as follows:
where: DW = Sample weight (g) dried at 60°C WW = Sample weight (g) before drying
Note: If the data user, program or laboratory requires that the reported percentsolids be determined by drying at 105°C, repeat the procedure given inSection 11.3 using a separate portion (>20 g) of the sample and dry to constantweight at 103-105°C.
12.6 The QC data obtained during the analyses provide an indication of the quality ofthe sample data and should be provided with the sample results.
13.0 METHOD PERFORMANCE
13.1 Instrument operating conditions used for single laboratory testing of the methodand MDLs are listed in Table 2.
13.2 Data obtained from single laboratory testing of the method are summarized inTable 1A-C for three solid samples consisting of SRM 1645 River Sediment, EPAHazardous Soil, and EPA Electroplating Sludge. Samples were prepared usingthe procedure described in Section 11.3. For each matrix, five replicates wereanalyzed, and an average of the replicates was used for determining the samplebackground concentration. Two other pairs of duplicates were fortified atdifferent concentration levels. The sample background concentration, mean spikepercent recovery, the standard deviation of the average percent recovery, and therelative percent difference between the duplicate-fortified determinations arelisted in Table 1A-C. In addition, Table 1D-F contains single-laboratory test datafor the method in aqueous media including drinking water, pond water, and wellwater. Samples were prepared using the procedure described in Section 11.2. Foreach aqueous matrix five replicates were analyzed, and an average of thereplicates was used for determining the sample background concentration. Foursamples were fortified at the levels reported in Table 1D-1F. A percent relativestandard deviation is reported in Table 1D-1F for the fortified samples. Anaverage percent recovery is also reported in Tables 1D-F.
Note: Antimony and aluminum manifest relatively low percent recoveries (seeTable 1A, NBS River Sediment 1645).
200.9-33
14.0 POLLUTION PREVENTION
14.1 Pollution prevention encompasses any technique that reduces or eliminates thequantity or toxicity of waste at the point of generation. Numerous opportunitiesfor pollution prevention exist in laboratory operation. The EPA has establisheda preferred hierarchy of environmental management techniques that placespollution prevention as the management option of first choice. Wheneverfeasible, laboratory personnel should use pollution prevention techniques toaddress their waste generation. When wastes cannot be feasibly reduced at thesource, the Agency recommends recycling as the next best option.
14.2 For information about pollution prevention that may be applicable to laboratoriesand research institutions, consult “Less is Better: Laboratory ChemicalManagement for Waste Reduction, available from the American ChemicalSociety's Department of Government Relations and Science Policy”, 1155 16thStreet N.W., Washington D.C. 20036, (202)872-4477.
15.0 WASTE MANAGEMENT
15.1 The Environmental Protection Agency requires that laboratory waste managementpractices be conducted consistent with all applicable rule and regulations. TheAgency urges laboratories to protect the air, water, and land by minimizing andcontrolling all releases from hoods and bench operations, complying with theletter and spirit of any sewer discharge permits and regulations, and bycomplying with all solid and hazardous waste regulations, particularly thehazardous waste identification rules and land disposal restrictions. For furtherinformation on waste management consult “The Waste Management Manual forLaboratory Personnel”, available from the American Chemical Society at theaddress listed in the Section 15.2.
16.0 REFERENCES
1. U.S. Environmental Protection Agency. Method 200.9, Determination of TraceElements by Stabilized Temperature Graphite Furnace Atomic AbsorptionSpectrometry, Revision 1.2, 1991.
2. Creed, J.T., T.D. Martin, L.B. Lobring and J.W. O'Dell. Environ. Sci. Technol.,26:102-106, 1992.
3. Waltz, B., G. Schlemmar and J.R. Mudakavi. JAAS, 3, 695, 1988.
4. Carcinogens - Working With Carcinogens, Department of Health, Education, andWelfare, Public Health Service, Center for Disease Control, National Institute forOccupational Safety and Health, Publication No. 77-206, Aug. 1977.
5. OSHA Safety and Health Standards, General Industry, (29 CFR 1910),
Occupational Safety and Health Administration, OSHA 2206, (Revised,January 1976).

200.9-34
6. Safety in Academic Chemistry Laboratories, American Chemical Society
Publication, Committee on Chemical Safety, 3rd Edition, 1979.
7. Proposed OSHA Safety and Health Standards, Laboratories, Occupational Safetyand Health Administration, Federal Register, July 24, 1986.
8. Rohrbough, W.G. et al. Reagent Chemicals, American Chemical SocietySpecifications, 7th edition. American Chemical Society, Washington, DC, 1986.
9. American Society for Testing and Materials. Standard Specification for ReagentWater, D1193-77. Annual Book of ASTM Standards, Vol. 11.01. Philadelphia, PA,1991.
10. Code of Federal Regulation 40, Ch. 1, Pt. 136, Appendix B.
11. Winefordner, J.D., Trace Analysis: Spectroscopic Methods for Elements,Chemical Analysis, Vol. 46, pp. 41-42.
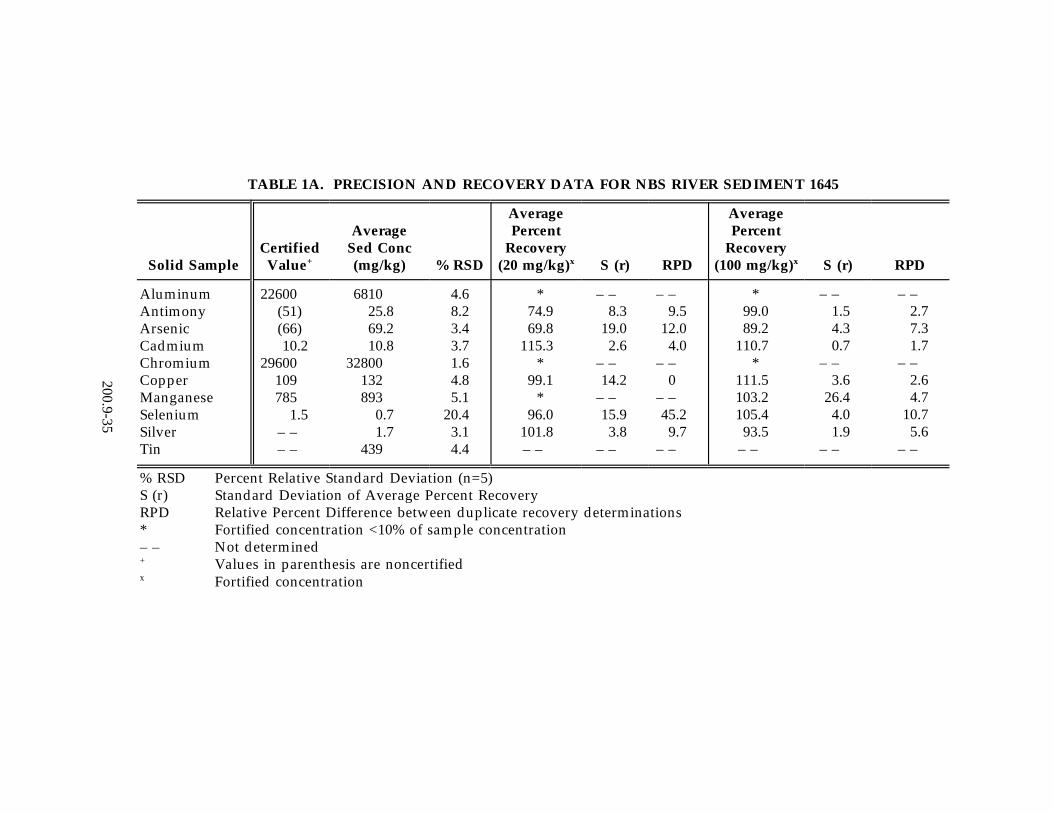
200.9-35
TABLE 1A. PRECISION AND RECOVERY DATA FOR NBS RIVER SEDIMENT 1645
Solid SampleCertified
Value+
AverageSed Conc(mg/kg) % RSD
AveragePercent
Recovery(20 mg/kg)x S (r) RPD
AveragePercent
Recovery(100 mg/kg)x S (r) RPD
AluminumAntimonyArsenicCadmiumChromiumCopperManganeseSeleniumSilverTin
22600(51)(66)10.2
29600109785
1.5– –– –
681025.869.210.8
32800132893
0.71.7
439
4.68.23.43.71.64.85.1
20.43.14.4
*74.969.8
115.3*
99.1*
96.0101.8– –
– –8.3
19.02.6
– –14.2
– –15.9
3.8– –
– –9.5
12.04.0
– –0
– –45.2
9.7– –
*99.089.2
110.7*
111.5103.2105.4
93.5– –
– –1.54.30.7
– –3.6
26.44.01.9
– –
– –2.77.31.7
– –2.64.7
10.75.6
– –
% RSD Percent Relative Standard Deviation (n=5)S (r) Standard Deviation of Average Percent RecoveryRPD Relative Percent Difference between duplicate recovery determinations* Fortified concentration <10% of sample concentration– – Not determined
Values in parenthesis are noncertified+
Fortified concentrationx

200.9-36
TABLE 1B. PRECISION AND RECOVERY DATA FOR EPA HAZARDOUS SOIL 884
Solid Sample
AverageSed Conc(mg/kg) % RSD
AveragePercent
Recovery(20 mg/kg)x S (r) RPD
AveragePercent
Recovery(100 mg/kg)x S (r) RPD
AluminumAntimonyArsenicCadmiumChromiumCopperManganeseSeleniumSilverTin
64104.68.71.8
84.0127453
0.60.9
18.4
3.314.7
4.610.3
4.24.36.07.5
18.53.7
*61.4
109.8115.4
95.5108.0
*95.0
100.1– –
– –2.72.10.8
33.815.2
– –8.43.8
– –
– –7.43.51.4
17.92.6
– –24.110.2
– –
*60.9
103.799.0
120.8117.7
99.296.993.5
– –
– –1.71.54.36.65.4
13.93.31.3
– –
– –7.13.6
12.18.95.71.69.73.8
– –
% RSD Percent Relative Standard Deviation (n=5)S (r) Standard Deviation of Average Percent RecoveryRPD Relative Percent Difference between duplicate recovery determinations* Fortified concentration <10% of sample concentration– – Not determined
Fortified concentrationx
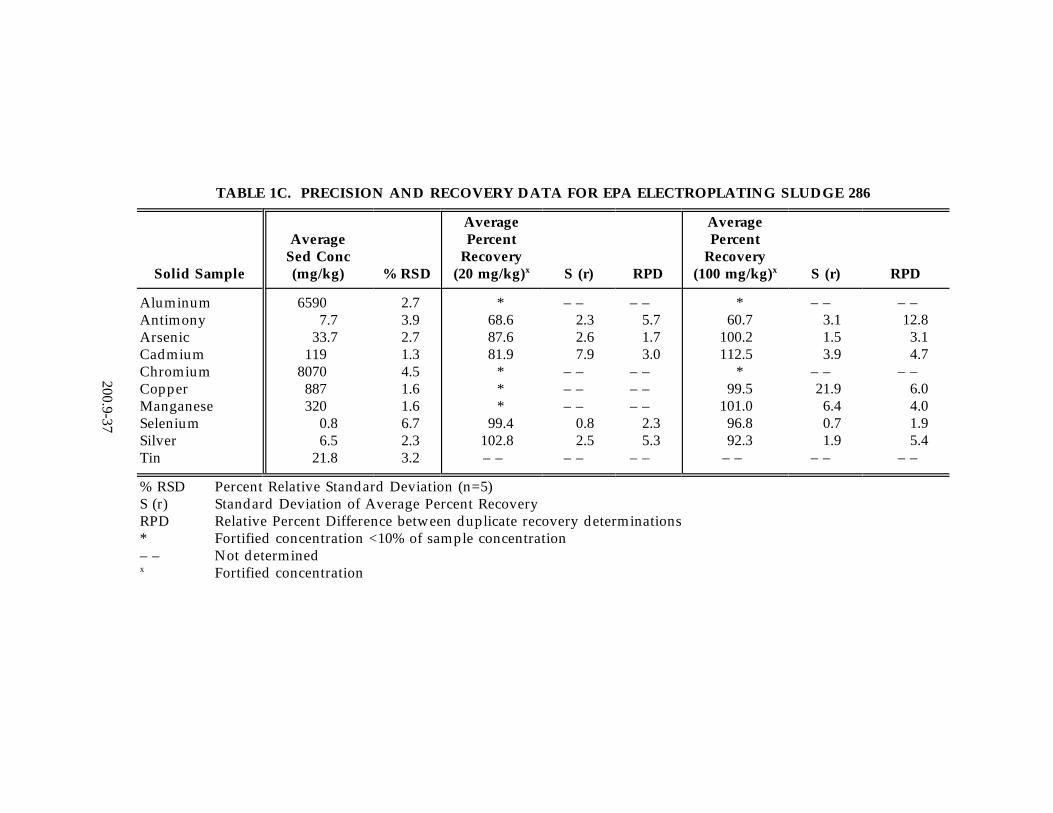
200.9-37
TABLE 1C. PRECISION AND RECOVERY DATA FOR EPA ELECTROPLATING SLUDGE 286
Solid Sample
AverageSed Conc(mg/kg) % RSD
AveragePercent
Recovery(20 mg/kg)x S (r) RPD
AveragePercent
Recovery(100 mg/kg)x S (r) RPD
AluminumAntimonyArsenicCadmiumChromiumCopperManganeseSeleniumSilverTin
65907.7
33.7119
8070887320
0.86.5
21.8
2.73.92.71.34.51.61.66.72.33.2
*68.687.681.9
***
99.4102.8– –
– –2.32.67.9
– –– –– –
0.82.5
– –
– –5.71.73.0
– –– –– –
2.35.3
– –
*60.7
100.2112.5
*99.5
101.096.892.3
– –
– –3.11.53.9
– –21.9
6.40.71.9
– –
– –12.8
3.14.7
– –6.04.01.95.4
– –
% RSD Percent Relative Standard Deviation (n=5)S (r) Standard Deviation of Average Percent RecoveryRPD Relative Percent Difference between duplicate recovery determinations* Fortified concentration <10% of sample concentration– – Not determined
Fortified concentrationx
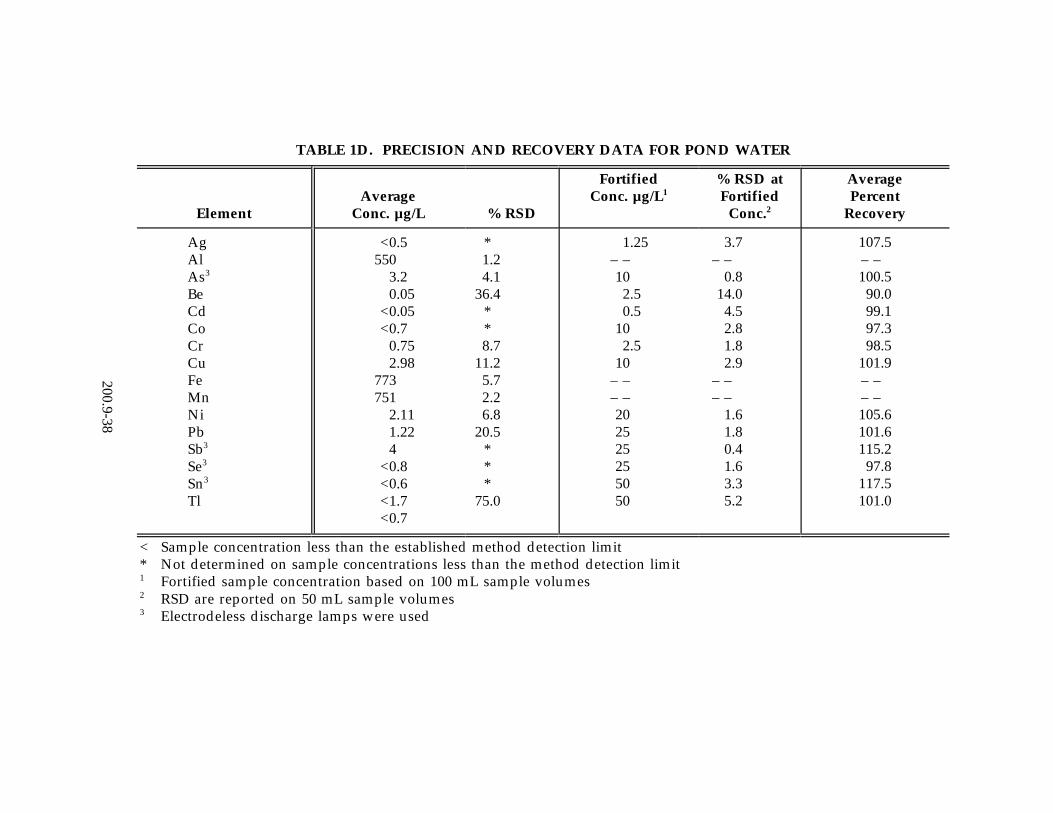
200.9-38
TABLE 1D. PRECISION AND RECOVERY DATA FOR POND WATER
ElementAverage
Conc. µg/L % RSD
FortifiedConc. µg/L1
% RSD atFortified
Conc.2
AveragePercent
Recovery
AgAlAs3
BeCdCoCrCuFeMnNiPbSb3
Se3
Sn3
Tl
<0.5550
3.20.05
<0.05<0.7
0.752.98
773751
2.111.224
<0.8<0.6<1.7<0.7
*1.24.1
36.4**8.7
11.25.72.26.8
20.5***
75.0
1.25– –10
2.50.5
102.5
10– –– –202525255050
3.7– –
0.814.0
4.52.81.82.9
– –– –
1.61.80.41.63.35.2
107.5– –100.5
90.099.197.398.5
101.9– –– –105.6101.6115.2
97.8117.5101.0
< Sample concentration less than the established method detection limit* Not determined on sample concentrations less than the method detection limit
Fortified sample concentration based on 100 mL sample volumes1
RSD are reported on 50 mL sample volumes2
Electrodeless discharge lamps were used3
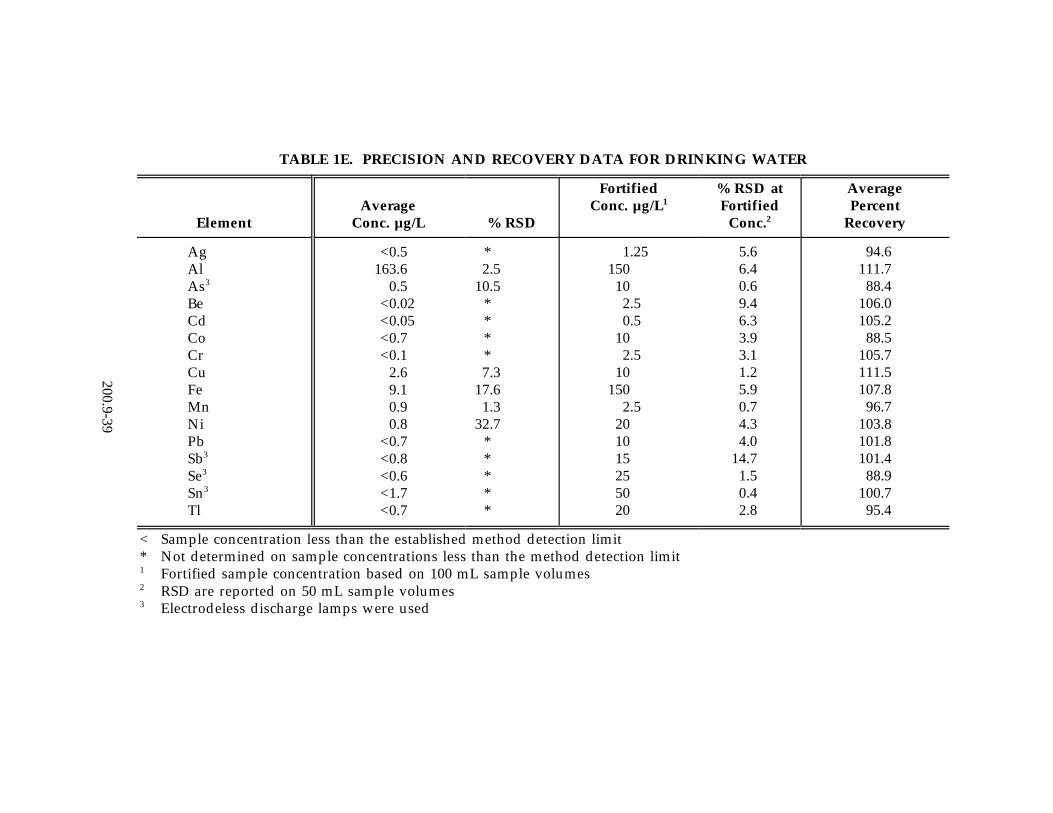
200.9-39
TABLE 1E. PRECISION AND RECOVERY DATA FOR DRINKING WATER
ElementAverage
Conc. µg/L % RSD
FortifiedConc. µg/L1
% RSD atFortified
Conc.2
AveragePercent
Recovery
AgAlAs3
BeCdCoCrCuFeMnNiPbSb3
Se3
Sn3
Tl
<0.5163.6
0.5<0.02<0.05<0.7<0.1
2.69.10.90.8
<0.7<0.8<0.6<1.7<0.7
*2.5
10.5****7.3
17.61.3
32.7*****
1.25150
102.50.5
102.5
10150
2.5201015255020
5.66.40.69.46.33.93.11.25.90.74.34.0
14.71.50.42.8
94.6111.7
88.4106.0105.2
88.5105.7111.5107.8
96.7103.8101.8101.4
88.9100.7
95.4
< Sample concentration less than the established method detection limit* Not determined on sample concentrations less than the method detection limit
Fortified sample concentration based on 100 mL sample volumes1
RSD are reported on 50 mL sample volumes2
Electrodeless discharge lamps were used3

200.9-40
TABLE 1F. PRECISION AND RECOVERY DATA FOR WELL WATER
ElementAverage
Conc. µg/L % RSD
FortifiedConc. µg/L1
% RSD atFortified
Conc.2
AveragePercent
Recovery
AgAlAs3
BeCdCoCrCuFeMnNiPbSb3
Se3
Sn3
Tl
<0.514.4
0.9<0.02
1.84.0
<0.135.9
4413580
11.8<0.7<0.8<0.6<1.7<0.7
*26.714.2
*11.9
2.9*1.26.62.73.2*****
1.25150
102.50.5
102.5
10– –– –202525255050
3.61.52.13.44.61.04.00.6
– –– –
4.00.71.21.23.01.4
108.397.1
101.6103.7109.3
95.8102.6
90.2– –– –105.7102.2114.3
95.9106.1
98.0
< Sample concentration less than the established method detection limit* Not determined on sample concentrations less than the method detection limit
Fortified sample concentration based on 100 mL sample volumes1
RSD are reported on 50 mL sample volumes2
Electrodeless discharge lamps were used3

200.9-41
TABLE 2. RECOMMEND GRAPHITE FURNACE OPERATING CONDITIONSAND RECOMMENDED MATRIX MODIFIER1-3
Element Wavelength Slit Char (C) Atom (µg/L)Temperature MDL
5
4
Ag 328.1 0.7 1000 1800 0.5Al 309.3 0.7 1700 2600 7.8As 193.7 0.7 1300 2200 0.57
Be 234.9 0.7 1200 2500 0.02Cd 228.8 0.7 800 1600 0.05Co 242.5 0.2 1400 2500 0.7Cr 357.9 0.7 1650 2600 0.1Cu 324.8 0.7 1300 2600 0.7Fe 248.3 0.2 1400 2400 –Mn 279.5 0.2 1400 2200 0.3Ni 232.0 0.2 1400 2500 0.6Pb 283.3 0.7 1250 2000 0.7Sb 217.6 0.7 1100 2000 0.87
Se 196.0 2.0 1000 2000 0.67
Sn 286.3 0.7 1400 2300 1.77
Tl 276.8 0.7 1000 1600 0.7
8
6
6
9
9
Matrix Modifier = 0.015 mg Pd + 0.01 mg Mg(NO ) .13 2
A 5% H in Ar gas mix is used during the dry and char steps at 300 mL/min.22
for all elements.
A cool down step between the char and atomization is recommended.3
Obtained using a 20 µL sample size and stop flow atomization.4
Actual char and atomization temperatures may vary from instrument to5
instrument and are best determined on an individual basis. The actual dryingtemperature may vary depending on the temperature of the water used to coolthe furnace.
A 7-s atomization is necessary to quantitatively remove the analyte from the6
graphite furnace.
An electrodeless discharge lamp was used for this element.7
An additional low temperature (approximately 200°C) per char is recommended.8
Pd modifier was determined to have trace level contamination of this element.9

200.9-42
TABLE 3. MULTIPLE DEPOSITION – ARSENIC PRECISION ANDRECOVERY DATA1,2
Drinking Water Average Fortified PercentSource Conc. µg/L % RSD Conc. µg/L % RSD Recovery
Cinti. Ohio 0.3 41% 3.8 3.9% 88%
Home Cistern 0.2 15% 4.1 1.7% 98%
Region I 0.7 7.3% 5.0 1.9% 108%
Region VI 2.6 3.4% 6.7 4.3% 103%
Region X 1.1 4.8% 5.0 1.7% 97%
NIST 1643c 3.9 7.1% – – – – 95% *
The recommended instrument conditions given in Table 2 were used in this1
procedure except for using diluted (1+2) matrix modifier and six - 36 µL depositions(30 µL sample + 1 µL reagent water + 5 µL matrix modifier) for each determination(Section 10.5). The amount of matrix modifier deposited on the platform with eachdetermination (6 x 5 µL) = 0.030 mg Pd + 0.02 mg Mg(NO ) . The determined3 2
arsenic MDL using this procedure is 0.1 µg/L.
Sample data and fortified sample data were calculated from four and five replicate2
determinations, respectively. All drinking waters were fortified with 4.0 µg/L arsenic. The instrument was calibrated using a blank and four standard solutions (1.0, 2.5,5.0, and 7.5 µg/L).
The NIST 1643c reference material Trace Elements in Water was diluted (1+19) for*
analysis. The calculated diluted arsenic concentration is 4.1 µg/L. The listedprecision and recovery data are from 13 replicate determinations collected over aperiod of four days.