method development for the determination of thiols using ...556891/fulltext01.pdf · method...
TRANSCRIPT

Method development for the
determination of thiols using
HPLC with fluorescence
detection
Anja Andersson
Student
Degree Thesis in Chemistry 30 ECTS
Bachelor’s Level
Report passed: 21 June 2012
Supervisors: Sylvain Bouchet, Erik Björn

I
Abstract
Hydrophilic thiols of low molecular weight are involved in a variety of physiological
and environmental processes. Of utmost importance are their strong binding
capacities towards class B, “soft” metals. To achieve a better understanding of the
speciation and fate of those metals, especially mercury species, the reliable analysis
of the different thiols present in the environment is first required.
Among the different methodologies reported in the literature, Reverse Phase High
Pressure Liquid Chromatography coupled with Fluorescence Detection (RP-HPLC-FD)
appears of relative easiness and fit the different requirements for thiol analyses in
relation with metal speciation studies.
The main objectives of this work consisted in the evaluation of the possibility to
analyze other thiols than the ones described in the literature and refining the
existing chromatographic methods to measure thiols.
Based on excitation-emission spectra, 11 out of 17 selected thiols were first found
to be suitable to be analyzed by RP – HPLC – FD. Different combinations of buffers,
such as ammonium acetate and citrate and organic modifiers, such as acetonitrile,
methanol, ethanol and tetrahydrofuran (THF) were tested for mobile phase. Three
different columns, two C18 and one phenyl were also tested for their retention
capacities. In the end, two chromatographic methods using an ammonium acetate
buffer and different proportions of THF were developed to analyze those
compounds.

II
Table of content
Abstract…………………………………………………………………………………………………………I
1. Introduction………………………………………………………………………………………………….3
1.1 Aim…………………………………………………………………………………………………………4
2. Method
2.1 Instrumentation……………………………………………………………………………………..5
2.2 Chemicals and reagents…………………………………………………………….……………6
2.3 Preparation…………………………………………………………………………………………….6
2.3.1 Derivatization…………………………………………………………………………………6
3. Results and Discussion
3.1 Excitation-Emission scans……………………………………………………………………….7
3.2 Test with different eluents and organic modifiers…………………………………..9
3.3 Columns……………………………………………………………………………………………….14
3.4 Calibration Curve………………………………………………………………………………….15
4. Conclusions…………………………………………………………………………………………………18
5. References………………………………………………………………………………………………….19
6. Appendix…………………………………………………………………………………………………….20

3
1. Introduction
Hydrophilic thiols of low-molecular-mass are involved in a variety of physiological
and environmental processes. Being able to determine different thiol compounds is
considered to be highly relevant as thiols play important roles in metabolism, cellular
homeostatis and antioxidant defense networks just to mention a few. Non-protein
thiols such as Cysteine (Cys) and Glutathione (GSH) have key functions in cells, as
they regulate the activity of trace metal ions. The determination of thiol compounds
in biological matrices is of interest since the trace metals such as Cu, Ag and Hg have
a high affinity for SH groups in these low molecular mass ligands [1,2]. Thiols are also
important in the transport and bioavailability of trace metals in aquatic ecosystems.
Recently, the importance of Hg complexation by thiols has been emphasized due to
the bioavailability of the complexes formed. It appeared that some Hg-thiolates
complexes are available for bacteria involved in Hg methylation and may therefore
promote the formation of monomethylmercury, a potent neurotoxic. However,
interactions between Hg and thiols are not well defined and partly rely on accurate
and sensitive thiol measurements. Many techniques have been reported for thiols
analyses but liquid chromatography coupled with fluorescence detection appears as
one of the most widely used due sensitivity and relative easiness of the
instrumentation and samples preparation.
Figure 1. The first step shows how Cysteine spontaneously oxidizes. TCEP is used to cleave the
disulfide bond and convert the oxidized forms to the reduced thiol. After reduction, SBD-F is
attached by an elimination reaction and the new molecule formed is fluorescent.

4
As thiols compounds are not themselves fluorescent, a previous derivatization step
with a fluorescent probe (SBD-F) is required before separation by reverse phase
liquid chromatography (RP-HPLC).
Figure 2. Thiol structures and acronyms

5
1.2 Aim
The aim of this project was to further develop previously published analytical
protocol for thiols [3,4]. Indeed, those two different methodologies already allow
the analysis of 6 thiols (Cys, GSH, MAC, 3-MPA, NacCys, GluCys). However, others
appeared equally important in the biogeochemistry of different trace elements.
The main objectives were:
- To evaluate the possibility of analyzing additional thiols;
- To improve the chromatographic resolution for the most hydrophilic
thiols, i.e. Cysteine (Cys), Cysteamine (Cyst) and N-Cysteineglycine
(CysGly) which are usually co-eluting.
In order to do so, excitation-emission spectra were acquired to refine the
fluorescence detector wavelength setup and ESI-MS analyses were carried out to
check for sub-products causing unknown peaks. Selected compounds were then
analyzed with the instrumental setup described below.
2. Method
2.1 Instrumentation
The instrumentation setup included:
a Perkin Elmer (PE) high performance liquid chromatography (HPLC).
a PE quaternary 200 series pump;
a PE autosampler 200 Series;
a Jasco FP-920 fluorescence detector.
A Perkin Elmer Diode Array Detector 200 EP was also used to interface the system
with TotalChrom 6.3.1 Workstation software. Emission-Excitation scans were
performed on a Waters HPLC, Acquity and ESI-MS data were also acquired on a
Perkin Elmer sciex API 2000 LC/MS/MS with a Perkin Elmer micro pump.
6
Listed columns were tested during development of the analytical protocol:
Phenomenex C18 5 μm column C18, 2.0 x 150 mm
HAMILTON C18 HxSil 5 μm column 4.6 x 150mm
Intersil Ph-3 5 μm column 2.1 x 150 mm
2.2 Chemicals and reagents
Organic solvents used were of HPLC grade. Acetonitrile was purchased from Sigma,
tetrahydrofuran from VWR, methanol and ethanol from Baker. Trifluoroacetic acid
(TFA) 99+% spectrophotometric grade, n,n-dimethyl-formamide (DMF) and thiols
were purchased from Sigma. 7-Fluorobenzo-2-oxa-1,3-diazole-4-sulfonic acid
amomonium (SBD-F), methanesulfonic acid (MSA), tris(2-carboxyethyl)phosphine
hydrochloride salt (TCEP) from Fluka. Ammonium acetate was reagent grade quality
from Scharlau and Acetic acid from Merck.
2.3 Preparation
10 mM stock solutions of thiols were prepared in a deoxygenated ammonium
acetate solution (0.1 M) in a Nitrogen-filled glove box and stored in the freezer at -
20°C until used. 3 µM standard solution was then prepared weekly from the 10 mM
thiol stock solution. Subsequent dilutions were then performed to match the mobile
phase composition and carried out from the 3 µM standard solutions to a final
volume of 1.5 ml in suitable vials.
2.3.1 Derivatization
The SBD-F was dissolved in DMF and then diluted to a ratio 1:4 mg/ml. The thiols
standards were reduced in 10 min with the addition of 10 µl of a 10 % (w/v) TCEP
solution. After the reduction step, 200 µl of 0.1 M potassium borate buffer with 2.0
mM EDTA (pH 9.5), 40 µl SBD-F and 20 µl 1 M NaOH were added. The vials were then
incubated for 60 min at 60°C. The reaction was stopped after incubation time by the
addition of 100 µl of 1M MSA.

7
3. Results and Discussion
3.1 Excitation-Emission scans
Excitation-emission scans were acquired with scan wavelength for excitation from 300
to 400 nm and emission from 430 to 700 nm. All thiol derivatives were 30 mM and
showed an excitation wavelength centered around 365nm with a quite sharp peak
(Table 1 and Appendix).
The emission wavelengths scan on the other side showed a much broader peak in the
500 nm region, demonstrating that they are less sensitive to one specific emission
wavelength. This was found to be an advantage later on as this broad peak for each
thiol allowed their detection with the same emission wavelength. As illustrated in the
table below, the majority of the emission wavelengths are located in the spectra
between 470-520 nm. By selecting a wavelength in the middle, around 510 nm, all
thiols should be detected with high sensitivity. Cysteamine, Cysteinylglycine and
Mercaptoacetic acid were also tested with different organic modifiers to check if it
had any impact on the wavelength. The results show clearly that similar Excitation-
Emission wavelengths were obtained for all organic solvents. For the compounds that
were not detected with this instrument, tests were done with ESI-MS to try to see if
they were attached to the probe or not. Unfortunately, no conclusions could be made
from it; it seems that the probe was polymerized in the ESI source, preventing the
detection of the compounds.
As Cys, CysGly, GSH, MAC, Hcys, Cyst, Glyc, ETH, SULF, 2MPA and 3MPA gave clear
excitation-emission spectra, they were therefore selected for analysis with HPLC.
GluCys, NacPEN, NacCys, PYR, SUC and PEN were also tested but could not be
detected by RP-HPLC-FD. This can be explained by lower intensity (EU) on the
excitation-emission spectra. However, the intensity of 3MPA on excitation-emission
spectra was quiet low and could only be detected on the HPLC at 1000nM.

8
Table 1 Excitation-Emission wavelengths
Thiol Abbreviated Excitation (nm) Emission (nm)
Cysteine Cys 365 494
Glutathione GSH 365 512
Penicillamine* PEN 365 455
N-Acetyl-Penicillamine* NacPEN 365 455
Mercaptoacetic acid MAC 365 527
2-mercaptopropionic acid 2MPA 365 520
3-mercaptopropionic acid 3MPA 365 520
Cysteinylglycine CysGly 365 498
Cysteamine Cyst 365 508
γ-glutamylcysteine* GluCys 365 470
N-acetyl-L-cysteine* NacCys 365 470
Mercaptopyruvate* PYR 365 455
Homocysteine HCys 365 470
Mercaptosuccinic acid* SUC 365 455
Mercaptoethanol ETH 365 520
Mercaptosulfonate SULF 365 520
Monothioglycerol Glyc 365 521
Cysteamine 5% MeOH 365 505
Cysteamine 5% THF 365 505
CysGly 5%MeOH 365 598
CysGly 5% THF 365 598
MAC 5% MeOH 365 526
MAC 5% THF 365 526
*low intensity obtained in the Excitation-Emission scans carried out with the
Waters HPLC Acquity system.

9
3.2 Test with different eluents and organic modifiers
The Phenomenex C18 column was used throughout the following tests. The first
tests regarding mobile phase composition were carried out with 0.1 % (v/v) TFA (pH
2) and acetonitrile, according to Tang’s protocol [3] but problems were observed
such as co-elution of Cysteine, Cysteamine and N-Cysteineglycine and unstable
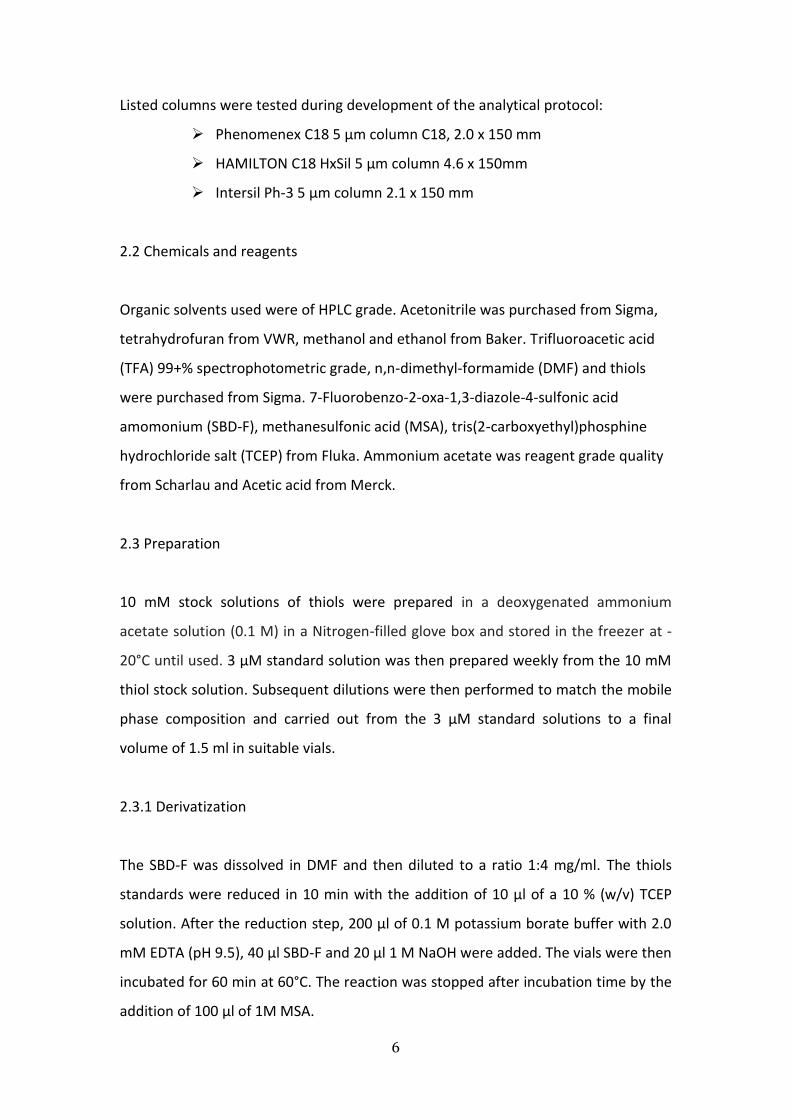
baseline. Alternative mobile phase compositions were tried as 30 mM ammonium
acetate (pH 5.8) and 30 mM ammonium citrate (pH 6.3) which showed clearly that
ammonium acetate buffer was more stable than the ammonium citrate buffer
(Figure 4) and was therefore mostly used later on. Different organic modifiers were
also tested according to different criteria: system stability including baseline drift
and bubbles formation perturbing the detector, column backpressure and signal
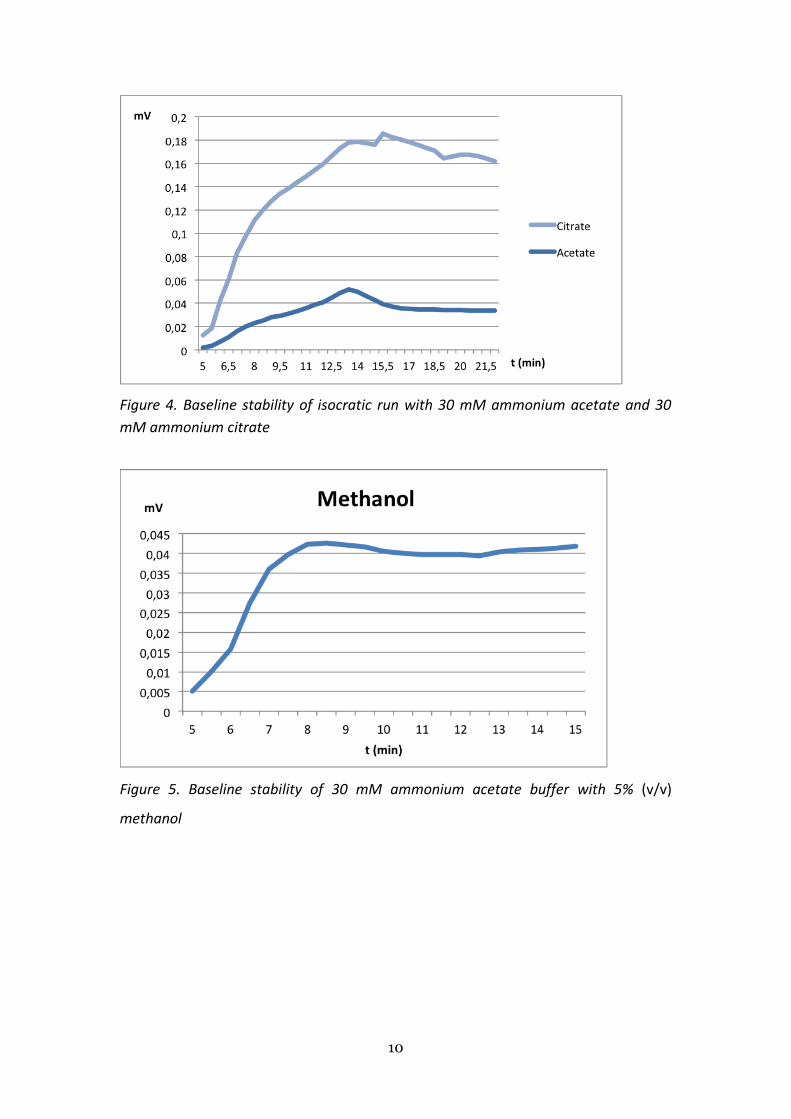
intensity. Ethanol and methanol were first tested with the citrate buffer. Ethanol is
supposed to enhance the signal intensity [5] but showed several drawbacks, such as
high column backpressure, unstable baseline and caused bubbles in the system,
whereas methanol on the other side was much more stable and there were no
problems with bubbles (figure 5 and 6). Why this happened is not clear, but one fact
could be that ethanol mixed with water has a reducing impact on the volume [6]. A
gradient with acetonitrile was also tested, but the unstable baseline made it
impossible to identify peaks (figure 7). Overall, a good gradient was hard to obtain
even with methanol where a problem with ghost peak appeared (figure 8 & 9). In the
end, THF was found out to be the best organic modifier in most aspects, i.e. good
peak shapes were obtained and the system was really stable. However, it was too
efficient for the more hydrophilic thiols and they eluted almost at the same time, at
the minimal mixing amount allowed by the pump (0.1% v/v). Therefore, a small
amount of THF (0.4 ‰ v/v) was instead added in the acetate buffer in order to
improve peak shape.
10
Figure 4. Baseline stability of isocratic run with 30 mM ammonium acetate and 30
mM ammonium citrate
Figure 5. Baseline stability of 30 mM ammonium acetate buffer with 5% (v/v)
methanol

11
Figure 6. Baseline stability of 30 mM ammonium acetate buffer and 5% (v/v) ethanol
Figure 7. A typical chromatogram obtained with the ammonium acetate buffer and
acetonitrile with a gradient from 5-20% (v/v), which shows the unstable baseline.

12
Figure 8. Chromatogram of ETH with gradient from 5-20% (v/v) methanol. The ghost
peak appears (around 10-11 min) in all the chromatogram due to the gradient
Figure 9. Chromatogram of Glyc, the same conditions as Figure 8 with the same ghost
peak.

13
Figure 10. MIX standard 250 nM of 1.Cys, 2.MAC, 3.Hcys, 4 Cysteamine/CysGly,
5.GSH (Isocratic 30 mM ammonium acetate buffer, 0.4 ‰ (v/v) THF and 0.1% (v/v)
methanol).
Figure 11. Isocratic run with 30 mM ammonium acetate buffer and 7% (v/v) THF of
MIX 250 nM 1. SULF, 2.Glyc, 3.ETH/2MPA.

14
3.3 Columns
An HAMILTON C18 and an Inertsil Phenyl columns were then tested to see if better
separation could be obtained for the co-elution between Cyst/CysGly and
ETH/2MPA. No significant improvement could be observed for the Hamilton column
and as can be seen in figure 11, the thiols eluted earlier with the phenyl column and
caused co-elution of several peaks. Up to now, the Phenomenex C18 gave the best
results.
Figure 12. Phenyl column (30 mM ammonium acetate buffer and 0.1% (v/v)
methanol)
MIX ISOCRATIC NEWC.raw
20
30
40
50
60
70
80
90
100
110
0 2 4 6 8 10 12 14 16 18 20 22 24

15
3.4 Calibration Curve
The data below have been collected from three different runs with Ex 365 - Em 510.
Table 2 and figure 13 present data from isocratic runs with 30 mM acetate buffer
and 0.1% (v/v) methanol, while Table 3 and figure 14 present data from an isocratic
run with 30 mM acetate buffer and 3% THF (v/v). The calibration curves for each
compound were drawn using the averaged peak area values from these three runs.
Standard deviations (SD) are always smaller than the markers.
In a similar way, data were processed to calculate slopes for peak heights versus
concentrations for each compound. The standard deviation of the baseline was also
calculated for different periods of the relevant chromatograms and the detection
limits (DL in nM) were calculated as:
The relative standard deviation (RSD) and detection limits (DL) are quite good for
most of the compounds, however Cys and MAC which give small peaks have much
higher DLs (20 nM respectively 24 nM) than the rest of the compounds. Detection
limits for Cyst/CysGly and ETH/2MPA are not accurate because of the co-elution, but
it gives a rough estimate. All these four compounds have high peaks, especially Cyst
and will probably be around the lowest detection limit of the compounds listed in
Table 2.

16
Table 2: Averaged peak areas (AV) standard deviation (SD) and relative standard
deviation (RSD) for different compounds.
100 250 500 1000 Slope R2 DL (nM)
Cys AV 50,5 111,3 210,2 411,5
SD 0,1 3,5 6,2 11,4 0,4155 0,99788 20
RSD 0,15 3,11 2,94 2,76
MAC AV 43,3 65,7 166,9 302,3
SD 1,5 2,9 1 1,9 0,3074 0,98848 24
RSD 3,42 4,39 0,57 0,64
Hcys AV 185,6 421,2 902,1 1808,3
SD 10,7 17 9,6 9,9 1,8021 0,9994 4
RSD 5,78 4,03 1,06 0,55
Cyst/CysGly AV 1849,4 3365,5 7367,1 19942
SD 18,9 64,3 21,2 45,4 18,64 0,96448 1
RSD 1,02 1,91 0,29 0,23
GSH AV 173,3 336,2 722,7 1579
SD 10,6 1,5 17,9 11,8 1,5439 0,99451 7
RSD 6,12 0,44 2,47 0,75
Figure 13. Calibration curve (peak area) for Cys, MAC, HCys (left y axis), Cyst/CysGly and GSH (right y axis

17
Table 3: Averaged peak areas (AV) standard deviation (SD) and relative standard
deviation (RSD) for different compounds.
100 250 500 1000 Slope R2 DL (nM)
SULF AV 50,5 111,3 210,2 411,5
SD 0,1 3,5 6,2 11,4 0,238 0,98846 2
RSD 0,15 3,11 2,94 2,76
Glyc AV 43,3 65,7 166,9 302,3
SD 1,5 2,9 1 1,9 0,1415 0,99073 3
RSD 3,42 4,39 0,57 0,64
ETH/2MPA AV 185,6 421,2 902,1 1808,3
SD 10,7 17 9,6 9,9 0,1949 0,98505 2
RSD 5,78 4,03 1,06 0,55
Figure 15. Calibration curve (peak area) of SULF, Glyc, and ETH/2MPA.

18
4. Conclusion
Excitation-emission scans were conducted to investigate excitation-emission
wavelength of the different thiols. The optimum wavelength was found out to be Ex
365 - Em 510. For better separation different buffers phases (TFA, ammonium
acetate, ammonium citrate) and organic modifiers (methanol, ethanol, THF,
acetonitrile) were tested. The most stable mobile phase was ammonium acetate
and the best organic modifier THF due to good peak shape. However the elution
strength of THF was too high for the more hydrophilic thiols so instead only a small
amount of THF were added to the ammonium acetate and methanol was used as
organic modifier. Another attempt to achieve better separation was to investigate
HAMILTON C18 and Intersil Phenyl columns instead of Phenomenex C18. No
significant improvement was observed with these two columns. 11 thiols
compounds can now be analyzed compared to only 6 with the original method. The
detection limits of the different thiols range from 2-25 nM. However, these 11 thiols
will have to be determined in 2 separate analyses because the mobile phase
conditions differed too much between the most hydrophilic and the most
hydrophobic ones. Attempts to develop a common gradient method remained
unsuccessful during this work.

19
5. Reference
[1] Damian. Shea, and William A. MacCrehan (1988) Determination of hydrophilic
thiols in sediment porewater using ion-pair liquid chromatography coupled to
electrochemical detection. Analytical Chemistry, 60 (14), 1449-1454.
[2] J. W. Rijstenbil and J. A. Wijnholds (1996) HPLC analysis of nonprotein thiols in
planktonic diatoms: pool size, redox state and response to copper and cadmium
exposure. Marine Biology, 127, 45-54.
[3] Degui Tang, Liang-Saw Wen, Peter H. Santschi (2000) Analysis of biogenic thiols
in natural water samples by high-performance liquid chromatographic separation
and fluorescence detection with ammonium 7-fluorobenzo-2-oxa-1.3-diazole-4-
sulfonate (SBD-F). Analytica Chimica Acta, 299-307.
[4] Jinzhong Zhang, Feiyue Wang, James D. House, and Bryan Page (2004) Thiols in
wetland interstitial waters and their role in mercury and methylmercury speciation.
Limnol. Oceanogr., 49 (6), 2276-2286.
[5] Toshimasa Toyo’oka and Kazuhiro Imai (1983) High-performance liquid
chromatography and fluorometric detection of biologically important thiols,
derivatized with ammonium 7-fluorobenzo-2-oxa-1,3-diazole-4-sulphonate (SBD-F)
[6] Lide, D R., ed (2000). CRC Handbook of Chemistry and Physics 81st edition. ISBN
0-8493-0481-4

20
6. Appendix
6.1 Excitation-Emission Spectra
Cysteamine (Cyst)
36.489 Extracted
508.1
EU
0.0
1000.0
2000.0
3000.0
4000.0
nm
450.00 500.00 550.00 600.00 650.00 700.00

21
Cysteine (Cys)
36.489 Extracted
493.9
EU
0.00
100.00
200.00
300.00
nm
450.00 500.00 550.00 600.00 650.00 700.00

22
Glutathione (GSH)
36.505 Extracted
512.4519.5
EU
0.00
200.00
400.00
600.00
800.00
nm
450.00 500.00 550.00 600.00 650.00 700.00

23
γ-glutamylcysteine (GluCys)
36.505 Extracted
469.7
EU
0.00
20.00
40.00
60.00
80.00
100.00
120.00
140.00
nm
450.00 500.00 550.00 600.00 650.00 700.00

24
3-mercaptopropionic acid (3MPA)
36.505 Extracted
519.5526.5
EU
0.00
50.00
100.00
150.00
200.00
250.00
nm
450.00 500.00 550.00 600.00 650.00

25
Cysteinylglycine (CysGly)
36.505 Extracted
498.2
EU
0.00
500.00
1000.00
1500.00
2000.00
nm
450.00 500.00 550.00 600.00 650.00

26
Homocysteine (HCys)
36.489 Extracted
469.7
EU
0.00
200.00
400.00
600.00
nm
450.00 500.00 550.00 600.00 650.00

27
Mercaptoacetic acid (MAC)
36.505 Extracted
526.5
EU
0.00
200.00
400.00
600.00
800.00
1000.00
1200.00
1400.00
nm
450.00 500.00 550.00 600.00 650.00

28
N-acetyl-L-cysteine (NacCys)
36.489 Extracted
469.7
EU
0.00
20.00
40.00
60.00
80.00
100.00
120.00
nm
450.00 500.00 550.00 600.00 650.00

29
2-mercaptopropionic acid (2MPA)
36.489 Extracted
519.5526.5
EU
0.0
1000.0
2000.0
3000.0
4000.0
nm
450.00 500.00 550.00 600.00 650.00

30
N-Acetyl-Penicillamine (NacPEN)
36.489 Extracted
455.4462.6
EU
0.00
50.00
100.00
150.00
nm
450.00 500.00 550.00 600.00 650.00

31
Mercaptosulfonate (SULF)
36.489 Extracted
519.5
EU
0.00
500.00
1000.00
1500.00
nm
450.00 500.00 550.00 600.00 650.00

32
Mercaptoethanol (ETH)
36.505 Extracted
519.5526.5
EU
0.0
1000.0
2000.0
3000.0
nm
450.00 500.00 550.00 600.00 650.00

33
Mercaptopyruvate (PYR)
36.505 Extracted
455.4
EU
50.00
100.00
150.00
200.00
nm
450.00 500.00 550.00 600.00 650.00

34
Monothioglycerol (Glyc)
36.489 Extracted
519.5526.5
EU
0.00
500.00
1000.00
1500.00
nm
450.00 500.00 550.00 600.00 650.00

35
Penicillamine (PEN)
36.489 Extracted
455.4462.6
EU
0.00
50.00
100.00
150.00
nm
450.00 500.00 550.00 600.00 650.00

36
Mercaptosuccinic acid (SUC)
36.439 Extracted
455.4462.6
EU
0.00
50.00
100.00
150.00
nm
450.00 500.00 550.00 600.00 650.00

37
Cysteamine (Cyst) with 5% MeOH
36.489 Extracted
505.3
EU
0.0
1000.0
2000.0
3000.0
4000.0
5000.0
nm
450.00 500.00 550.00 600.00 650.00

38
Cysteamine (Cyst) with 5% THF
36.489 Extracted
505.3
EU
0.0
1000.0
2000.0
3000.0
4000.0
nm
450.00 500.00 550.00 600.00 650.00

39
Cysteinylglycine (CysGly) with 5% MeOH
36.505 Extracted
498.2
EU
0.00
500.00
1000.00
1500.00
nm
450.00 500.00 550.00 600.00 650.00

40
Cysteinylglycine (CysGly) with 5% THF
36.424 Extracted
498.2
EU
0.00
500.00
1000.00
1500.00
nm
450.00 500.00 550.00 600.00 650.00

41
Mercaptoacetic acid (MAC) with 5% MeOH
36.472 Extracted
526.5
EU
0.00
200.00
400.00
600.00
800.00
1000.00
1200.00
1400.00
nm
450.00 500.00 550.00 600.00 650.00

42
Mercaptoacetic acid (MAC) with 5% THF
36.489 Extracted
526.5
EU
0.00
200.00
400.00
600.00
800.00
1000.00
nm
450.00 500.00 550.00 600.00 650.00

43
Department of Chemistry
S-901 87 Umeå, Sweden
Telephone +46 90 786 50 00
Text telephone +46 90 786 59 00
www.umu.se