method investments sicavmethodsicav.com/prospectus/201806_semi_annual_report.pdf · unaudited...
TRANSCRIPT
Unaudited semi-annual report as at 30th June 2018
METHOD INVESTMENTS SICAV Société d'Investissement à Capital Variable with multiple Sub-Funds Luxembourg
R.C.S. Luxembourg B 165 419

No subscription can be received on the basis of this financial report. Subscriptions are only valid if made on the basis of the prospectus and key investor information document ("KIID"), supplemented by the latest annual report and the most recent semi-annual report, if published thereafter. Subscription, redemption and conversion forms are available on request from: - the Registered Office of the Company at 2, Rue d'Alsace, L-1122 Luxembourg - the Sub-Transfer Agent, EUROPEAN FUND ADMINISTRATION, 2, Rue d'Alsace, L-1122 Luxembourg.
METHOD INVESTMENTS SICAV
Contents
1
Organisation ........................................................................................................................................... 2
General information ............................................................................................................................... 4
Combined statement of net assets ....................................................................................................... 6
Method Investments SICAV - Attractive Global Opportunities .......................................................... 7 Statement of net assets ........................................................................................................................ 7 Statement of investments and other net assets ................................................................................... 8 Industrial and geographical classification of investments ..................................................................... 9
Method Investments SICAV - Attractive Global Opportunities Plus ...............................................10 Statement of net assets ......................................................................................................................10 Statement of investments and other net assets .................................................................................11 Industrial and geographical classification of investments ...................................................................12
Method Investments SICAV - Target Selection .................................................................................13 Statement of net assets ......................................................................................................................13 Statement of investments and other net assets .................................................................................14 Industrial and geographical classification of investments ...................................................................15
Method Investments SICAV - Global Brands .....................................................................................16 Statement of net assets ......................................................................................................................16 Statement of investments and other net assets .................................................................................17 Industrial and geographical classification of investments ...................................................................19
Notes to the financial statements .......................................................................................................20
Additional information ..........................................................................................................................29
METHOD INVESTMENTS SICAV
2
Organisation
Registered Office 2, Rue d’Alsace L-1122 LUXEMBOURG Board of Directors Chairman Daniel VAN HOVE
Managing Director ORIONIS MANAGEMENT S.A. 370, Route de Longwy L-1940 LUXEMBOURG
Members Elisa BIANCHI Financial Controller and Head of Accounting METHOD INVESTMENTS & ADVISORY LTD 40 New Bond Street W1S 2RX LONDON
Carlo Alberto MONTAGNA THE DIRECTORS’ OFFICE
21st Century Building 19, Rue de Bitbourg L-1273 LUXEMBOURG
Conducting persons Eric GRENOUILLET Managing Director ORIONIS MANAGEMENT S.A. 370, Route de Longwy L-1940 LUXEMBOURG Carlo Alberto MONTAGNA THE DIRECTORS’ OFFICE
21st Century Building 19, Rue de Bitbourg L-1273 LUXEMBOURG
Francesco ROCCO VINCENTI Independent Conducting Officer
370, Route de Longwy L-1940 LUXEMBOURG
Investment Managers METHOD INVESTMENTS & ADVISORY LTD 40 New Bond Street W1S 2RX LONDON UNITED KINGDOM
FASANARA CAPITAL LTD 40 New Bond Street W1S 2RX LONDON UNITED KINGDOM
METHOD INVESTMENTS SICAV
Organisation (continued)
3
Depositary and Paying Agent KBL EUROPEAN PRIVATE BANKERS S.A.
43, Boulevard Royal L-2955 LUXEMBOURG
Administrative Agent EUROPEAN FUND ADMINISTRATION S.A. and Domiciliary Agent 2, Rue d’Alsace L-1122 LUXEMBOURG Cabinet de révision agréé DELOITTE Audit Société à responsabilité limitée 560, Rue de Neudorf L-2220 LUXEMBOURG Promoter METHOD INVESTMENTS & ADVISORY LTD 40 New Bond Street W1S 2RX LONDON UNITED KINGDOM Legal adviser DECHERT (LUXEMBOURG) LLP
Avocats à la Cour 1, Allée Scheffer B.P. 709 L-2520 LUXEMBOURG
Representative agent in Switzerland ARM SWISS REPRESENTATIVES S.A. Route de Cité-Ouest 2 CH-1196 GLAND Paying agent in Switzerland BANQUE CANTONALE DE GENEVE 17, Quai de l'Ile CH-1204 GENEVA
METHOD INVESTMENTS SICAV
4
General information
METHOD INVESTMENTS SICAV (the "Company") is an open-ended investment company organised under the laws of Luxembourg as a "Société d’Investissement à Capital Variable" (SICAV). The Company was incorporated under the form of a public limited liability company (Société Anonyme) on 14th December 2011 and is authorised under Part I of the amended law of 17th December 2010 (the "2010 Act") relating to Undertakings for Collective Investment under the Council Directive 2009/65/EC, as amended. The Company is a self-managed SICAV in accordance with article 27 of the 2010 Act. The Directive 2014/91/EU of the European Parliament and of the Council of 23rd July 2014 amending the Directive 2009/65/EC had been transposed by the law of 10th May 2016 coming into force on 1st June 2016 and amending the amended law of 17th December 2010. At the date of the present financial statements, the following Sub-Funds are open:
Method Investments SICAV - Attractive Global Opportunities in EUR
Method Investments SICAV - Attractive Global Opportunities Plus in EUR
Method Investments SICAV - Target Selection in EUR
Method Investments SICAV - Global Brands in EUR By circular resolution dated 12th May 2017, the Board of Directors has resolved to suspend any subscription and redemption of the following Sub-Fund with immediate effect until 8th June 2017 and decided to maintain the Sub-Fund under CSSF circular 12/540 during a maximum period of 18 months starting at 8th June 2017 with the view to be able to accept further subscription request.
Method Investments SICAV - Equity Rebalance in EUR (dormant since 8th June 2017)
At the date of the financial statements, the remaining cash account for this Sub-Fund amounts to EUR 11,685.97. The Board of Directors resolves on 28th December 2016 to close the following Sub-Fund temporarily on 28th December 2016 while awaiting reactivation.
Method Investments SICAV - Xingtai China Consumer in USD (dormant since 28th December 2016)
The Company reserves the right to create new Sub-Funds. If such Sub-Funds are created, the prospectus shall be amended accordingly. The following classes of shares are open at the date of the financial statements:
class I-Acc EUR shares, class I-Acc USD H shares and class P-Acc EUR shares: accumulation shares dedicated to institutional investors;
class A-Acc EUR shares, class Listing - Acc EUR shares: accumulation shares dedicated to retail investors.
The Net Asset Value of the Sub-Funds Method Investments SICAV - Equity Rebalance was determined each Business Day (each a "Valuation Day") until it was dormant. The Net Asset Value of the Sub-Funds Method Investments SICAV - Attractive Global Opportunities, Method Investments SICAV - Attractive Global Opportunities Plus, Method Investments SICAV - Target Selection and Method Investments SICAV - Global Brands is determined daily (each a "Valuation Day"). If such a day is not a Business Day, then the Net Asset Value of the Sub-Funds is calculated as at the immediately preceding Business Day in Luxembourg. The combined accounts of the Company are held in Euro (EUR). The accounts of the Company are closed on 31st December each year.

METHOD INVESTMENTS SICAV
General information (continued)
5
The complaint settlement procedure foreseen by the CSSF Regulation N° 13-02 relating to the out-of-court resolution of complaints is available at the registered office of the Company. The following documents are available for inspection by Shareholders during normal business hours on any Business Day at the Registered Office of the Company:
- the Articles of incorporation, - the Investment Management Agreement, - the General Agreement, and - the most recent annual and semi-annual financial statements of the Company.
A copy of the Prospectus, the key investor information document ("KIID"), the most recent financial statements and the Articles of incorporation may be obtained free of charge upon request at the Registered Office of the Company. Additional information for investors in Switzerland: The Prospectus, the Articles and annual financial statements can be obtained free of charge from the representative in Switzerland. The place of performance and jurisdiction is the registered office of the representative in Switzerland
METHOD INVESTMENTS SICAV
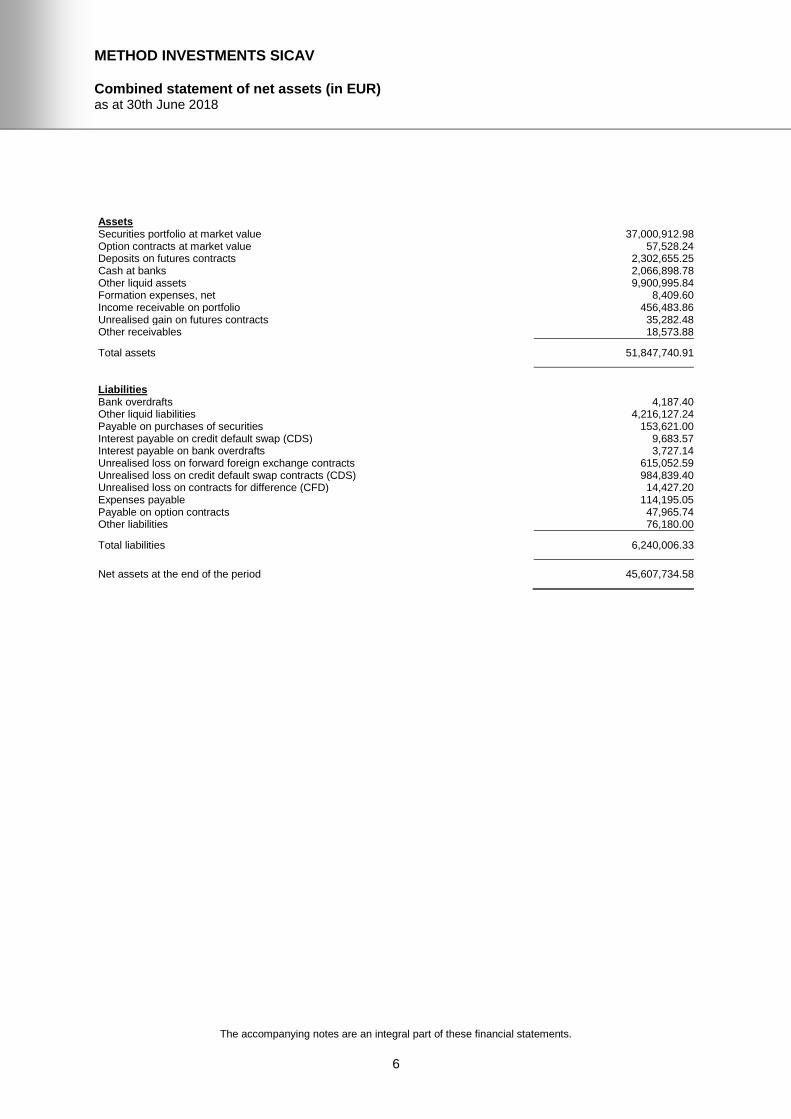
Combined statement of net assets (in EUR) as at 30th June 2018
The accompanying notes are an integral part of these financial statements.
6
Assets Securities portfolio at market value 37,000,912.98 Option contracts at market value 57,528.24 Deposits on futures contracts 2,302,655.25 Cash at banks 2,066,898.78 Other liquid assets 9,900,995.84 Formation expenses, net 8,409.60 Income receivable on portfolio 456,483.86 Unrealised gain on futures contracts 35,282.48 Other receivables 18,573.88
Total assets 51,847,740.91
Liabilities Bank overdrafts 4,187.40 Other liquid liabilities 4,216,127.24 Payable on purchases of securities 153,621.00 Interest payable on credit default swap (CDS) 9,683.57 Interest payable on bank overdrafts 3,727.14 Unrealised loss on forward foreign exchange contracts 615,052.59 Unrealised loss on credit default swap contracts (CDS) 984,839.40 Unrealised loss on contracts for difference (CFD) 14,427.20 Expenses payable 114,195.05 Payable on option contracts 47,965.74 Other liabilities 76,180.00
Total liabilities 6,240,006.33
Net assets at the end of the period 45,607,734.58

Method Investments SICAV - Attractive Global Opportunities
Statement of net assets (in EUR) as at 30th June 2018
The accompanying notes are an integral part of these financial statements.
7
Assets Securities portfolio at market value 11,933,225.94 Option contracts at market value 57,528.24 Deposits on futures contracts 2,302,655.25 Cash at banks 421,101.01 Other liquid assets 9,649,446.63 Formation expenses, net 1,888.66 Income receivable on portfolio 119,203.78 Unrealised gain on futures contracts 35,282.48 Other receivables 18,573.88
Total assets 24,538,905.87
Liabilities Bank overdrafts 4,187.40 Other liquid liabilities 4,216,127.24 Payable on purchases of securities 153,621.00 Interest payable on credit default swap (CDS) 9,683.57 Interest payable on bank overdrafts 3,727.14 Unrealised loss on forward foreign exchange contracts 28,021.14 Unrealised loss on credit default swap contracts (CDS) 984,839.40 Unrealised loss on contracts for difference (CFD) 14,427.20 Expenses payable 57,054.58 Payable on option contracts 47,965.74 Other liabilities 76,180.00
Total liabilities 5,595,834.41
Net assets at the end of the period 18,943,071.46
Breakdown of net assets per share class
Share class Number of
shares
Currency of
share class
NAV per share in currency of
share class
Net assets per share class
(in EUR)
A-Acc EUR 16,659.5151 EUR 774.60791 12,904,592.25 I-Acc EUR 6,620.3258 EUR 849.75955 5,625,685.11 I-Acc USD H 534.0784 USD 817.29644 373,876.13 Listing-Acc EUR 50.0000 EUR 778.35940 38,917.97
18,943,071.46
Method Investments SICAV - Attractive Global Opportunities
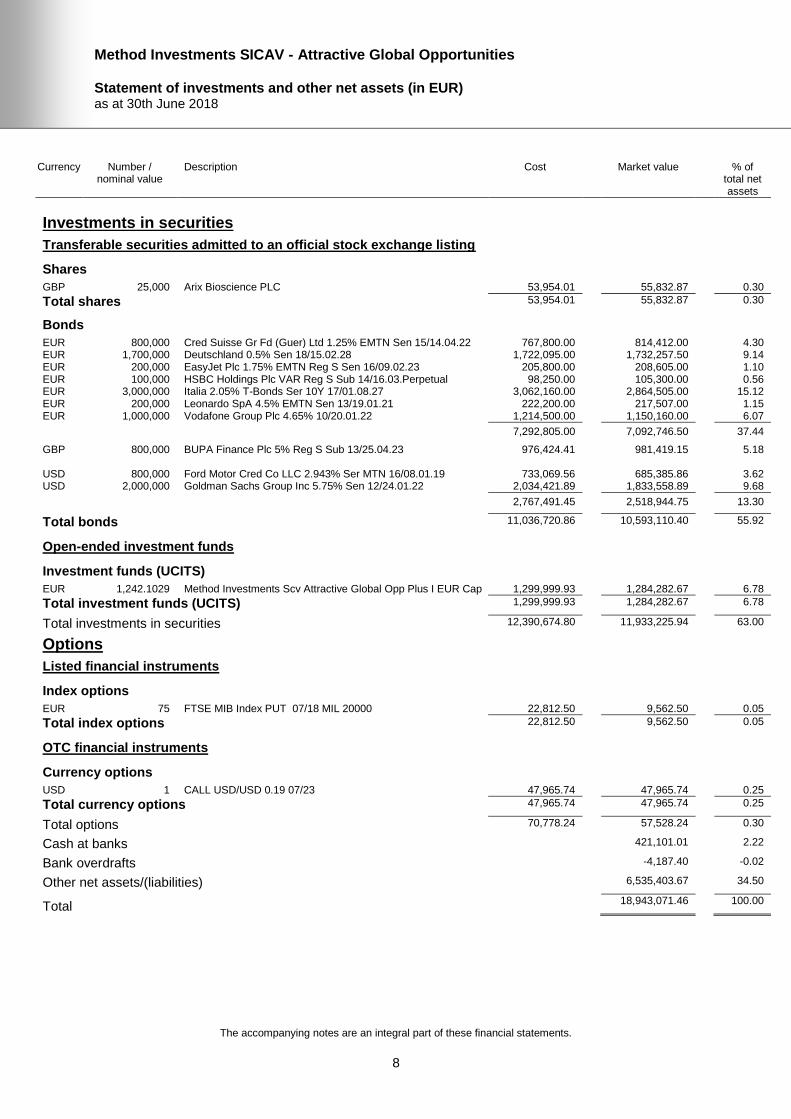
Statement of investments and other net assets (in EUR) as at 30th June 2018
The accompanying notes are an integral part of these financial statements.
8
Currency Number / nominal value
Description Cost Market value % of total net assets
Investments in securities
Transferable securities admitted to an official stock exchange listing
Shares
GBP 25,000 Arix Bioscience PLC 53,954.01 55,832.87 0.30
Total shares 53,954.01 55,832.87 0.30
Bonds
EUR 800,000 Cred Suisse Gr Fd (Guer) Ltd 1.25% EMTN Sen 15/14.04.22 767,800.00 814,412.00 4.30 EUR 1,700,000 Deutschland 0.5% Sen 18/15.02.28 1,722,095.00 1,732,257.50 9.14 EUR 200,000 EasyJet Plc 1.75% EMTN Reg S Sen 16/09.02.23 205,800.00 208,605.00 1.10 EUR 100,000 HSBC Holdings Plc VAR Reg S Sub 14/16.03.Perpetual 98,250.00 105,300.00 0.56 EUR 3,000,000 Italia 2.05% T-Bonds Ser 10Y 17/01.08.27 3,062,160.00 2,864,505.00 15.12 EUR 200,000 Leonardo SpA 4.5% EMTN Sen 13/19.01.21 222,200.00 217,507.00 1.15 EUR 1,000,000 Vodafone Group Plc 4.65% 10/20.01.22 1,214,500.00 1,150,160.00 6.07
7,292,805.00 7,092,746.50 37.44
GBP 800,000 BUPA Finance Plc 5% Reg S Sub 13/25.04.23 976,424.41 981,419.15 5.18 USD 800,000 Ford Motor Cred Co LLC 2.943% Ser MTN 16/08.01.19 733,069.56 685,385.86 3.62 USD 2,000,000 Goldman Sachs Group Inc 5.75% Sen 12/24.01.22 2,034,421.89 1,833,558.89 9.68
2,767,491.45 2,518,944.75 13.30
Total bonds 11,036,720.86 10,593,110.40 55.92
Open-ended investment funds
Investment funds (UCITS)
EUR 1,242.1029 Method Investments Scv Attractive Global Opp Plus I EUR Cap 1,299,999.93 1,284,282.67 6.78
Total investment funds (UCITS) 1,299,999.93 1,284,282.67 6.78
Total investments in securities 12,390,674.80 11,933,225.94 63.00
Options
Listed financial instruments
Index options
EUR 75 FTSE MIB Index PUT 07/18 MIL 20000 22,812.50 9,562.50 0.05
Total index options 22,812.50 9,562.50 0.05
OTC financial instruments
Currency options
USD 1 CALL USD/USD 0.19 07/23 47,965.74 47,965.74 0.25
Total currency options 47,965.74 47,965.74 0.25
Total options 70,778.24 57,528.24 0.30
Cash at banks 421,101.01 2.22
Bank overdrafts -4,187.40 -0.02
Other net assets/(liabilities) 6,535,403.67 34.50
Total 18,943,071.46 100.00
Method Investments SICAV - Attractive Global Opportunities
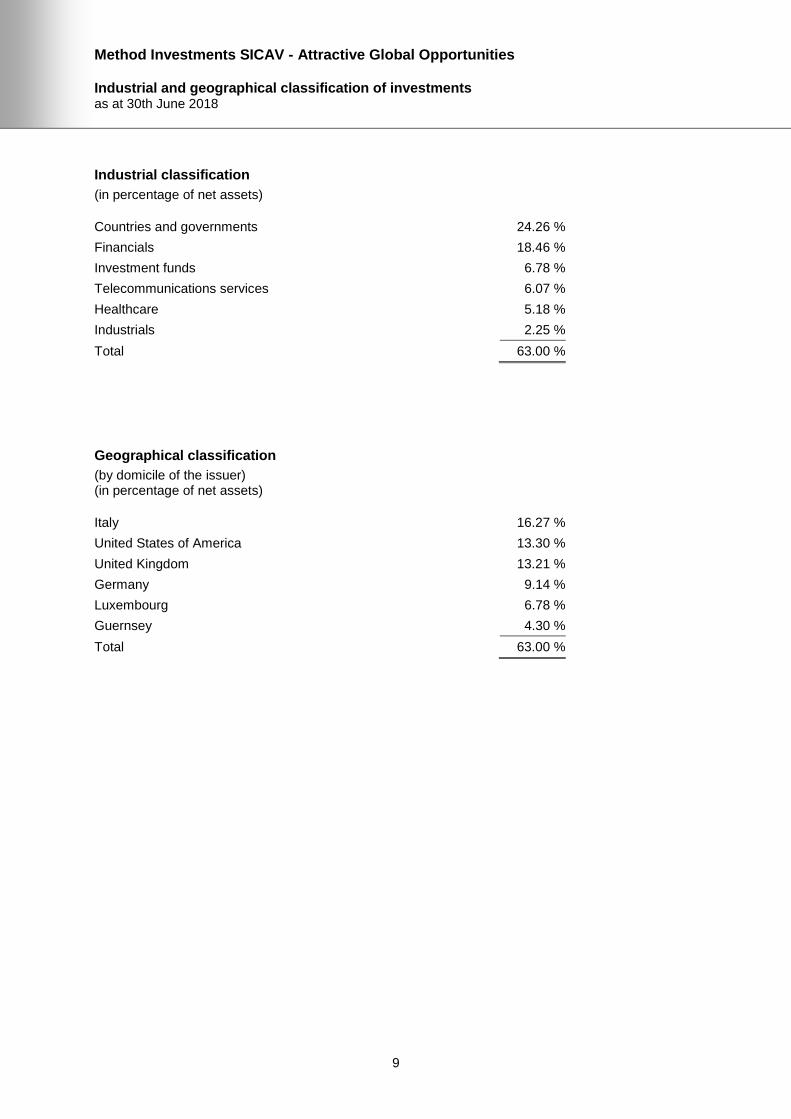
Industrial and geographical classification of investments as at 30th June 2018
9
Industrial classification
(in percentage of net assets)
Countries and governments 24.26 %
Financials 18.46 %
Investment funds 6.78 %
Telecommunications services 6.07 %
Healthcare 5.18 %
Industrials 2.25 %
Total 63.00 %
Geographical classification
(by domicile of the issuer) (in percentage of net assets)
Italy 16.27 %
United States of America 13.30 %
United Kingdom 13.21 %
Germany 9.14 %
Luxembourg 6.78 %
Guernsey 4.30 %
Total 63.00 %

Method Investments SICAV - Attractive Global Opportunities Plus
Statement of net assets (in EUR) as at 30th June 2018
The accompanying notes are an integral part of these financial statements.
10
Assets Securities portfolio at market value 887,168.24 Cash at banks 145,040.19 Other liquid assets 251,549.21 Formation expenses, net 6,119.29 Income receivable on portfolio 12,697.39
Total assets 1,302,574.32
Liabilities Unrealised loss on forward foreign exchange contracts 1,330.54 Expenses payable 16,961.11
Total liabilities 18,291.65
Net assets at the end of the period 1,284,282.67
Breakdown of net assets per share class
Share class Number of
shares
Currency of
share class
NAV per share in currency of
share class
Net assets per share class
(in EUR)
I-Acc EUR 1,242.1029 EUR 1,033.95835 1,284,282.67
1,284,282.67
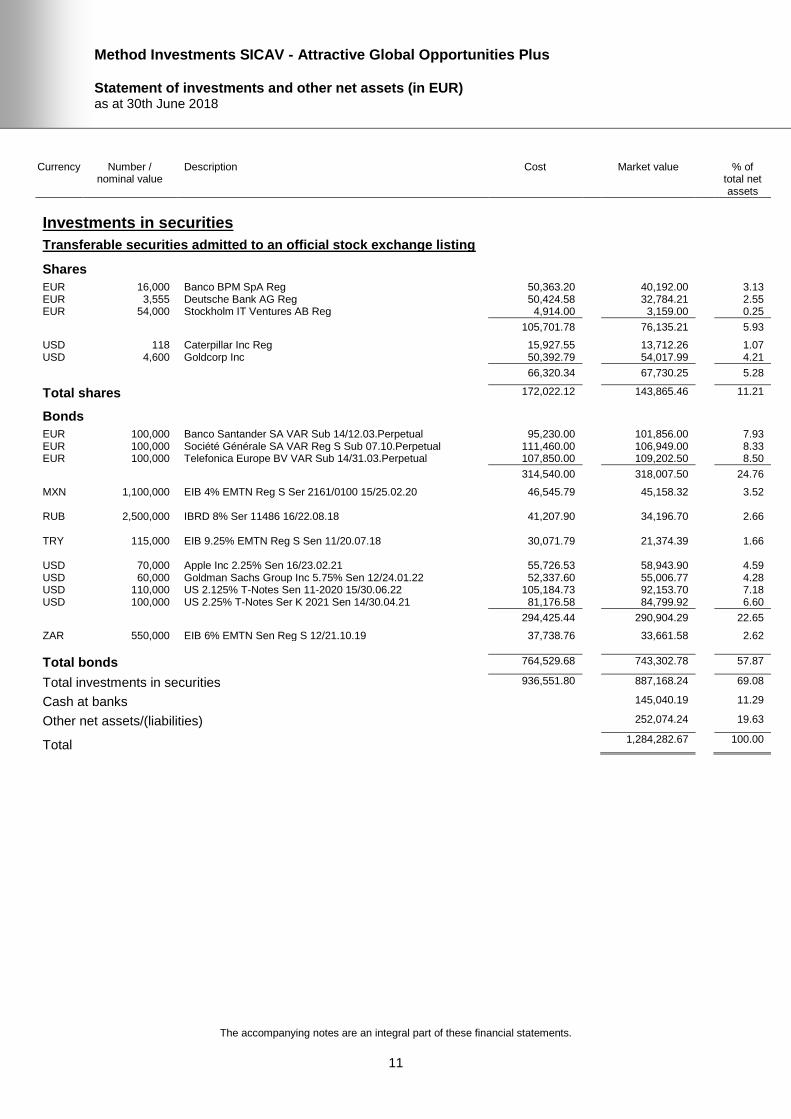
Method Investments SICAV - Attractive Global Opportunities Plus
Statement of investments and other net assets (in EUR) as at 30th June 2018
The accompanying notes are an integral part of these financial statements.
11
Currency Number / nominal value
Description Cost Market value % of total net assets
Investments in securities
Transferable securities admitted to an official stock exchange listing
Shares
EUR 16,000 Banco BPM SpA Reg 50,363.20 40,192.00 3.13 EUR 3,555 Deutsche Bank AG Reg 50,424.58 32,784.21 2.55 EUR 54,000 Stockholm IT Ventures AB Reg 4,914.00 3,159.00 0.25
105,701.78 76,135.21 5.93
USD 118 Caterpillar Inc Reg 15,927.55 13,712.26 1.07 USD 4,600 Goldcorp Inc 50,392.79 54,017.99 4.21
66,320.34 67,730.25 5.28
Total shares 172,022.12 143,865.46 11.21
Bonds
EUR 100,000 Banco Santander SA VAR Sub 14/12.03.Perpetual 95,230.00 101,856.00 7.93 EUR 100,000 Société Générale SA VAR Reg S Sub 07.10.Perpetual 111,460.00 106,949.00 8.33 EUR 100,000 Telefonica Europe BV VAR Sub 14/31.03.Perpetual 107,850.00 109,202.50 8.50
314,540.00 318,007.50 24.76
MXN 1,100,000 EIB 4% EMTN Reg S Ser 2161/0100 15/25.02.20 46,545.79 45,158.32 3.52 RUB 2,500,000 IBRD 8% Ser 11486 16/22.08.18 41,207.90 34,196.70 2.66 TRY 115,000 EIB 9.25% EMTN Reg S Sen 11/20.07.18 30,071.79 21,374.39 1.66 USD 70,000 Apple Inc 2.25% Sen 16/23.02.21 55,726.53 58,943.90 4.59 USD 60,000 Goldman Sachs Group Inc 5.75% Sen 12/24.01.22 52,337.60 55,006.77 4.28 USD 110,000 US 2.125% T-Notes Sen 11-2020 15/30.06.22 105,184.73 92,153.70 7.18 USD 100,000 US 2.25% T-Notes Ser K 2021 Sen 14/30.04.21 81,176.58 84,799.92 6.60
294,425.44 290,904.29 22.65
ZAR 550,000 EIB 6% EMTN Sen Reg S 12/21.10.19 37,738.76 33,661.58 2.62
Total bonds 764,529.68 743,302.78 57.87
Total investments in securities 936,551.80 887,168.24 69.08
Cash at banks 145,040.19 11.29
Other net assets/(liabilities) 252,074.24 19.63
Total 1,284,282.67 100.00
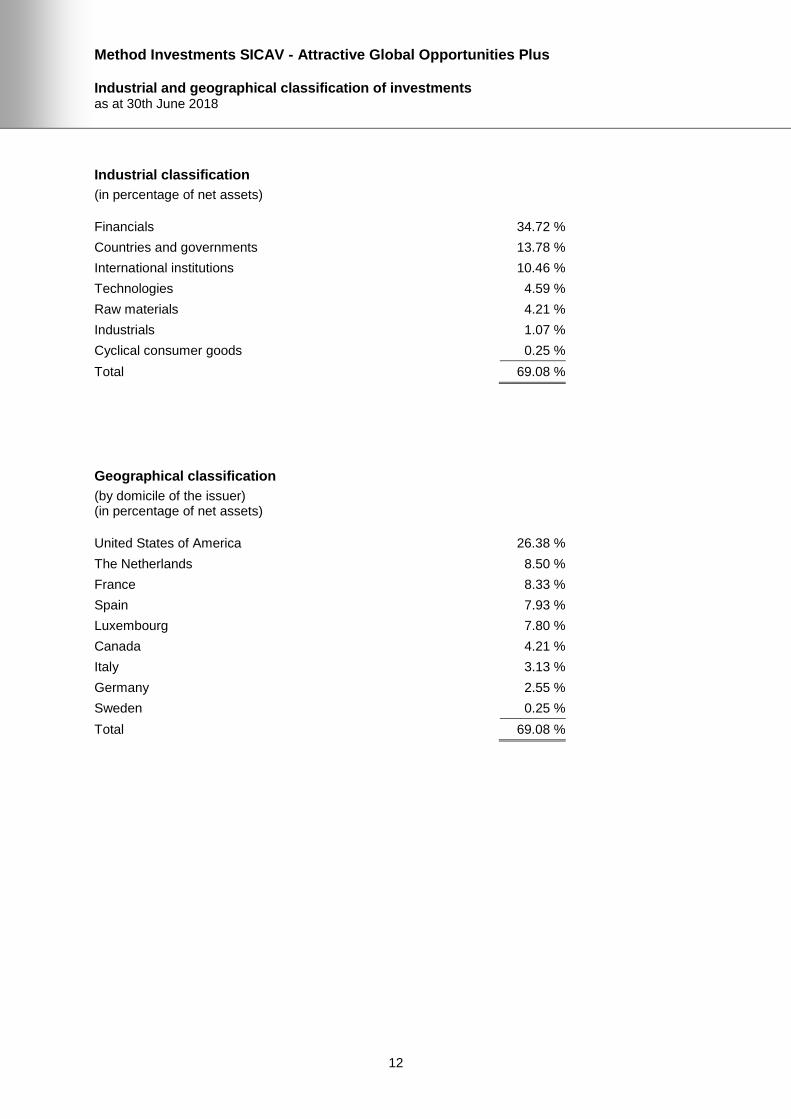
Method Investments SICAV - Attractive Global Opportunities Plus
Industrial and geographical classification of investments as at 30th June 2018
12
Industrial classification
(in percentage of net assets)
Financials 34.72 %
Countries and governments 13.78 %
International institutions 10.46 %
Technologies 4.59 %
Raw materials 4.21 %
Industrials 1.07 %
Cyclical consumer goods 0.25 %
Total 69.08 %
Geographical classification
(by domicile of the issuer) (in percentage of net assets)
United States of America 26.38 %
The Netherlands 8.50 %
France 8.33 %
Spain 7.93 %
Luxembourg 7.80 %
Canada 4.21 %
Italy 3.13 %
Germany 2.55 %
Sweden 0.25 %
Total 69.08 %
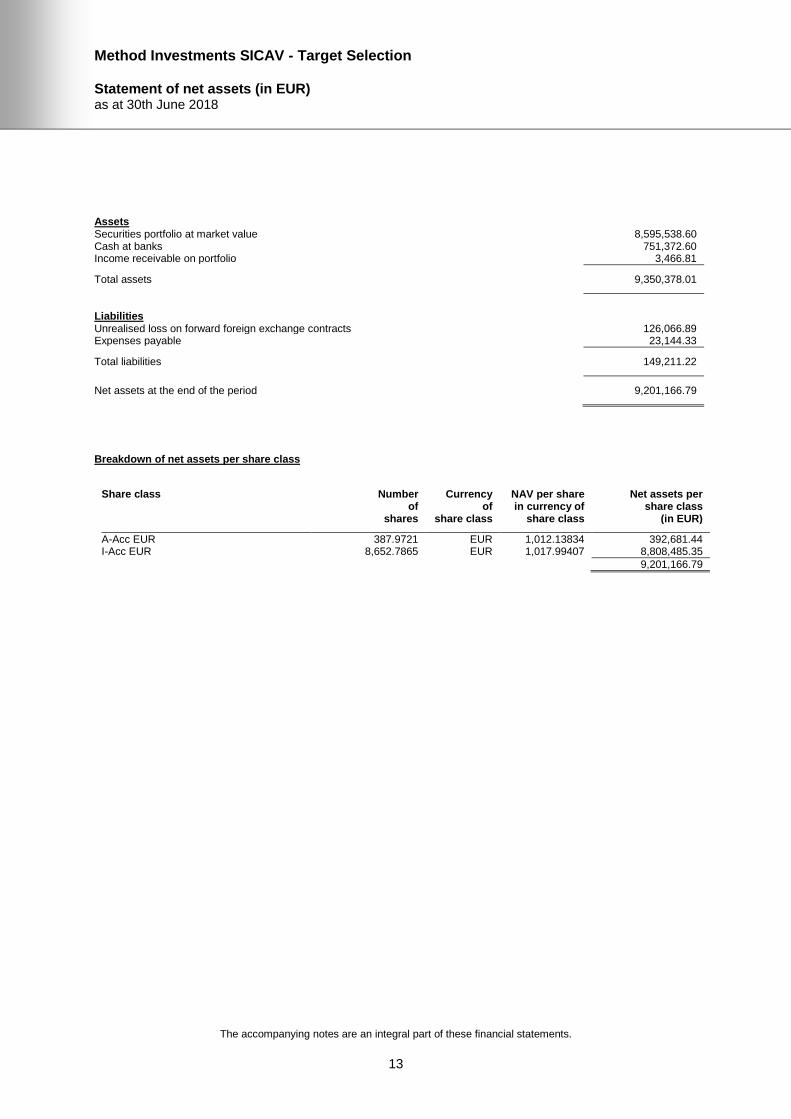
Method Investments SICAV - Target Selection
Statement of net assets (in EUR) as at 30th June 2018
The accompanying notes are an integral part of these financial statements.
13
Assets Securities portfolio at market value 8,595,538.60 Cash at banks 751,372.60 Income receivable on portfolio 3,466.81
Total assets 9,350,378.01
Liabilities Unrealised loss on forward foreign exchange contracts 126,066.89 Expenses payable 23,144.33
Total liabilities 149,211.22
Net assets at the end of the period 9,201,166.79
Breakdown of net assets per share class
Share class Number of
shares
Currency of
share class
NAV per share in currency of
share class
Net assets per share class
(in EUR)
A-Acc EUR 387.9721 EUR 1,012.13834 392,681.44 I-Acc EUR 8,652.7865 EUR 1,017.99407 8,808,485.35
9,201,166.79
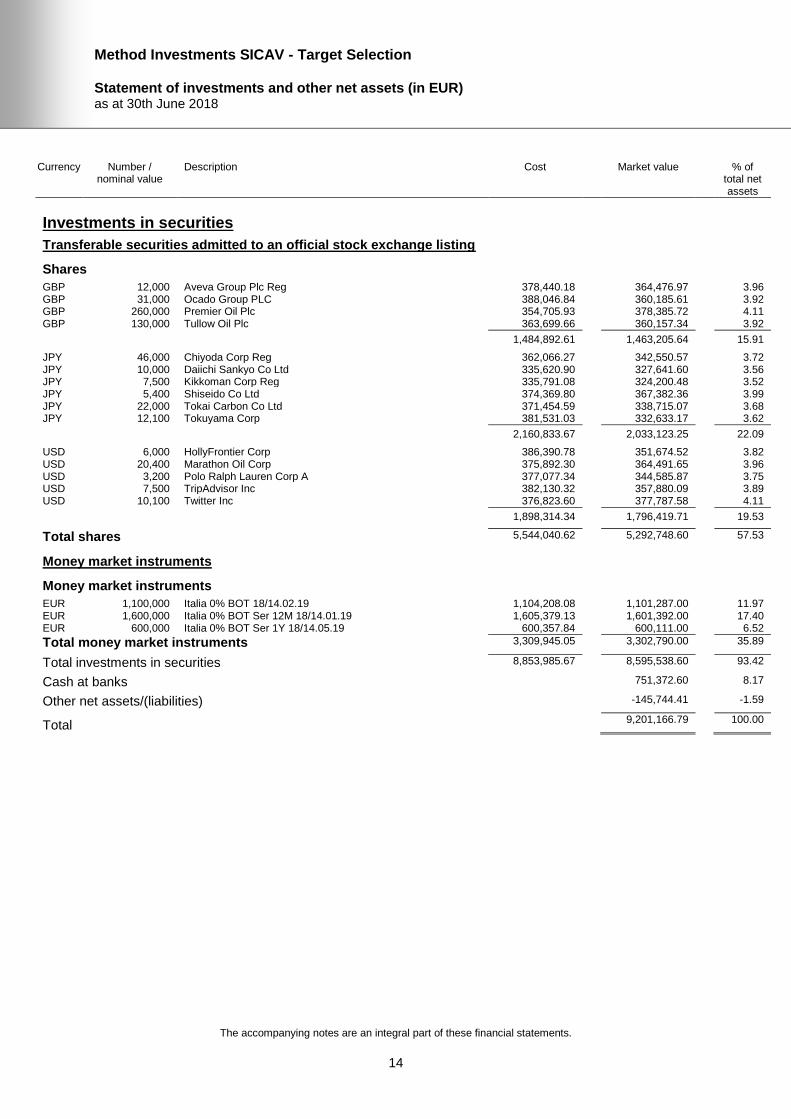
Method Investments SICAV - Target Selection
Statement of investments and other net assets (in EUR) as at 30th June 2018
The accompanying notes are an integral part of these financial statements.
14
Currency Number / nominal value
Description Cost Market value % of total net assets
Investments in securities
Transferable securities admitted to an official stock exchange listing
Shares
GBP 12,000 Aveva Group Plc Reg 378,440.18 364,476.97 3.96 GBP 31,000 Ocado Group PLC 388,046.84 360,185.61 3.92 GBP 260,000 Premier Oil Plc 354,705.93 378,385.72 4.11 GBP 130,000 Tullow Oil Plc 363,699.66 360,157.34 3.92
1,484,892.61 1,463,205.64 15.91
JPY 46,000 Chiyoda Corp Reg 362,066.27 342,550.57 3.72 JPY 10,000 Daiichi Sankyo Co Ltd 335,620.90 327,641.60 3.56 JPY 7,500 Kikkoman Corp Reg 335,791.08 324,200.48 3.52 JPY 5,400 Shiseido Co Ltd 374,369.80 367,382.36 3.99 JPY 22,000 Tokai Carbon Co Ltd 371,454.59 338,715.07 3.68 JPY 12,100 Tokuyama Corp 381,531.03 332,633.17 3.62
2,160,833.67 2,033,123.25 22.09
USD 6,000 HollyFrontier Corp 386,390.78 351,674.52 3.82 USD 20,400 Marathon Oil Corp 375,892.30 364,491.65 3.96 USD 3,200 Polo Ralph Lauren Corp A 377,077.34 344,585.87 3.75 USD 7,500 TripAdvisor Inc 382,130.32 357,880.09 3.89 USD 10,100 Twitter Inc 376,823.60 377,787.58 4.11
1,898,314.34 1,796,419.71 19.53
Total shares 5,544,040.62 5,292,748.60 57.53
Money market instruments
Money market instruments
EUR 1,100,000 Italia 0% BOT 18/14.02.19 1,104,208.08 1,101,287.00 11.97 EUR 1,600,000 Italia 0% BOT Ser 12M 18/14.01.19 1,605,379.13 1,601,392.00 17.40 EUR 600,000 Italia 0% BOT Ser 1Y 18/14.05.19 600,357.84 600,111.00 6.52
Total money market instruments 3,309,945.05 3,302,790.00 35.89
Total investments in securities 8,853,985.67 8,595,538.60 93.42
Cash at banks 751,372.60 8.17
Other net assets/(liabilities) -145,744.41 -1.59
Total 9,201,166.79 100.00

Method Investments SICAV - Target Selection
Industrial and geographical classification of investments as at 30th June 2018
15
Industrial classification
(in percentage of net assets)
Countries and governments 35.89 %
Energy 15.81 %
Technologies 11.96 %
Non-cyclical consumer goods 11.43 %
Raw materials 7.30 %
Cyclical consumer goods 3.75 %
Industrials 3.72 %
Healthcare 3.56 %
Total 93.42 %
Geographical classification
(by domicile of the issuer) (in percentage of net assets)
Italy 35.89 %
Japan 22.09 %
United States of America 19.53 %
United Kingdom 15.91 %
Total 93.42 %
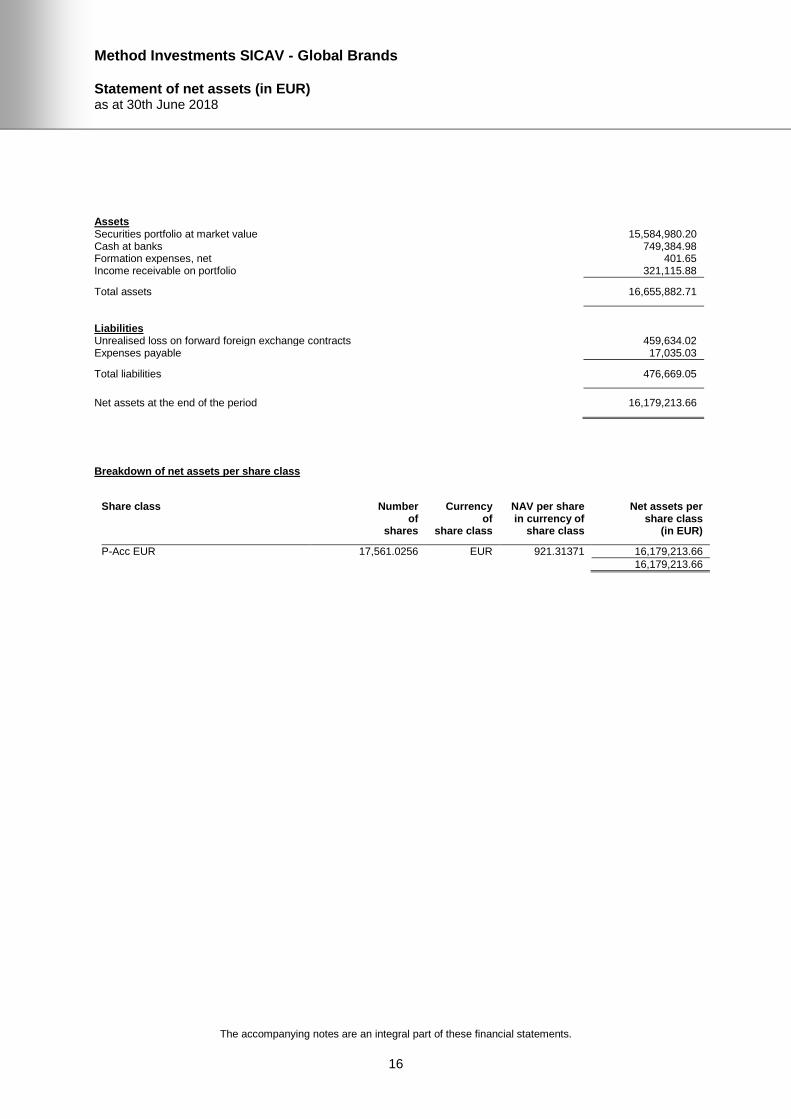
Method Investments SICAV - Global Brands
Statement of net assets (in EUR) as at 30th June 2018
The accompanying notes are an integral part of these financial statements.
16
Assets Securities portfolio at market value 15,584,980.20 Cash at banks 749,384.98 Formation expenses, net 401.65 Income receivable on portfolio 321,115.88
Total assets 16,655,882.71
Liabilities Unrealised loss on forward foreign exchange contracts 459,634.02 Expenses payable 17,035.03
Total liabilities 476,669.05
Net assets at the end of the period 16,179,213.66
Breakdown of net assets per share class
Share class Number of
shares
Currency of
share class
NAV per share in currency of
share class
Net assets per share class
(in EUR)
P-Acc EUR 17,561.0256 EUR 921.31371 16,179,213.66
16,179,213.66
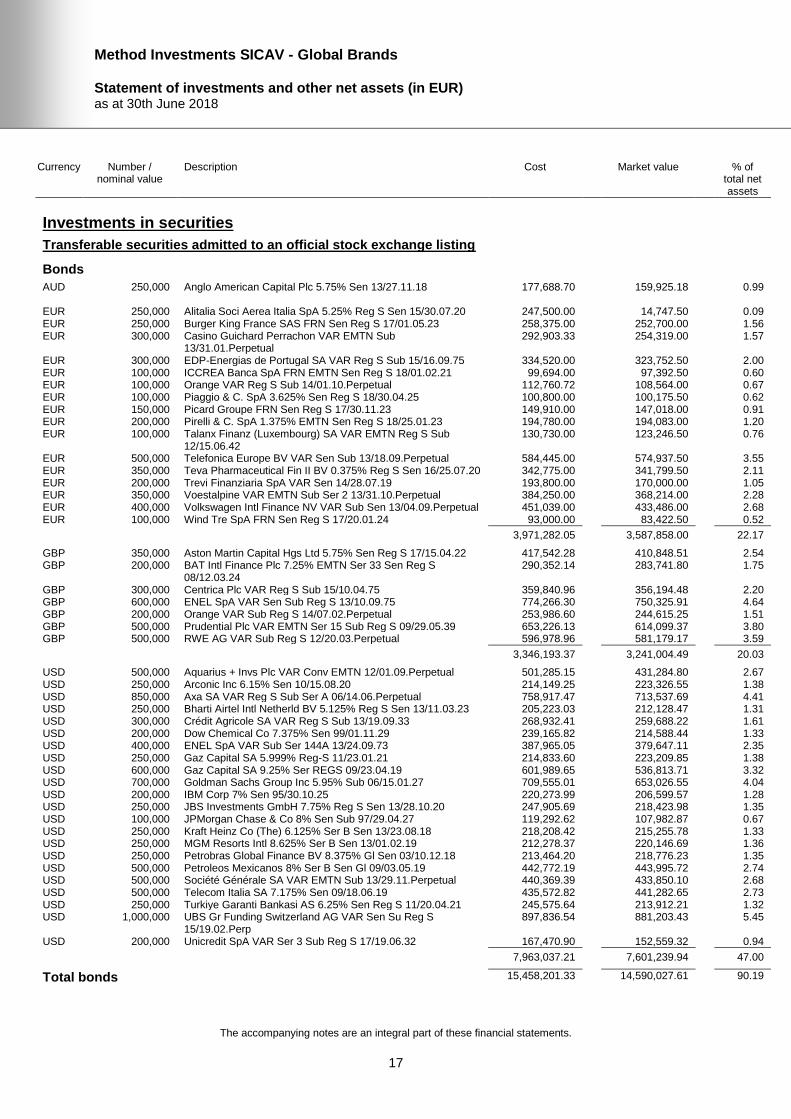
Method Investments SICAV - Global Brands
Statement of investments and other net assets (in EUR) as at 30th June 2018
The accompanying notes are an integral part of these financial statements.
17
Currency Number / nominal value
Description Cost Market value % of total net assets
Investments in securities
Transferable securities admitted to an official stock exchange listing
Bonds
AUD 250,000 Anglo American Capital Plc 5.75% Sen 13/27.11.18 177,688.70 159,925.18 0.99 EUR 250,000 Alitalia Soci Aerea Italia SpA 5.25% Reg S Sen 15/30.07.20 247,500.00 14,747.50 0.09 EUR 250,000 Burger King France SAS FRN Sen Reg S 17/01.05.23 258,375.00 252,700.00 1.56 EUR 300,000 Casino Guichard Perrachon VAR EMTN Sub
13/31.01.Perpetual 292,903.33 254,319.00 1.57
EUR 300,000 EDP-Energias de Portugal SA VAR Reg S Sub 15/16.09.75 334,520.00 323,752.50 2.00 EUR 100,000 ICCREA Banca SpA FRN EMTN Sen Reg S 18/01.02.21 99,694.00 97,392.50 0.60 EUR 100,000 Orange VAR Reg S Sub 14/01.10.Perpetual 112,760.72 108,564.00 0.67 EUR 100,000 Piaggio & C. SpA 3.625% Sen Reg S 18/30.04.25 100,800.00 100,175.50 0.62 EUR 150,000 Picard Groupe FRN Sen Reg S 17/30.11.23 149,910.00 147,018.00 0.91 EUR 200,000 Pirelli & C. SpA 1.375% EMTN Sen Reg S 18/25.01.23 194,780.00 194,083.00 1.20 EUR 100,000 Talanx Finanz (Luxembourg) SA VAR EMTN Reg S Sub
12/15.06.42 130,730.00 123,246.50 0.76
EUR 500,000 Telefonica Europe BV VAR Sen Sub 13/18.09.Perpetual 584,445.00 574,937.50 3.55 EUR 350,000 Teva Pharmaceutical Fin II BV 0.375% Reg S Sen 16/25.07.20 342,775.00 341,799.50 2.11 EUR 200,000 Trevi Finanziaria SpA VAR Sen 14/28.07.19 193,800.00 170,000.00 1.05 EUR 350,000 Voestalpine VAR EMTN Sub Ser 2 13/31.10.Perpetual 384,250.00 368,214.00 2.28 EUR 400,000 Volkswagen Intl Finance NV VAR Sub Sen 13/04.09.Perpetual 451,039.00 433,486.00 2.68 EUR 100,000 Wind Tre SpA FRN Sen Reg S 17/20.01.24 93,000.00 83,422.50 0.52
3,971,282.05 3,587,858.00 22.17
GBP 350,000 Aston Martin Capital Hgs Ltd 5.75% Sen Reg S 17/15.04.22 417,542.28 410,848.51 2.54 GBP 200,000 BAT Intl Finance Plc 7.25% EMTN Ser 33 Sen Reg S
08/12.03.24 290,352.14 283,741.80 1.75
GBP 300,000 Centrica Plc VAR Reg S Sub 15/10.04.75 359,840.96 356,194.48 2.20 GBP 600,000 ENEL SpA VAR Sen Sub Reg S 13/10.09.75 774,266.30 750,325.91 4.64 GBP 200,000 Orange VAR Sub Reg S 14/07.02.Perpetual 253,986.60 244,615.25 1.51 GBP 500,000 Prudential Plc VAR EMTN Ser 15 Sub Reg S 09/29.05.39 653,226.13 614,099.37 3.80 GBP 500,000 RWE AG VAR Sub Reg S 12/20.03.Perpetual 596,978.96 581,179.17 3.59
3,346,193.37 3,241,004.49 20.03
USD 500,000 Aquarius + Invs Plc VAR Conv EMTN 12/01.09.Perpetual 501,285.15 431,284.80 2.67 USD 250,000 Arconic Inc 6.15% Sen 10/15.08.20 214,149.25 223,326.55 1.38 USD 850,000 Axa SA VAR Reg S Sub Ser A 06/14.06.Perpetual 758,917.47 713,537.69 4.41 USD 250,000 Bharti Airtel Intl Netherld BV 5.125% Reg S Sen 13/11.03.23 205,223.03 212,128.47 1.31 USD 300,000 Crédit Agricole SA VAR Reg S Sub 13/19.09.33 268,932.41 259,688.22 1.61 USD 200,000 Dow Chemical Co 7.375% Sen 99/01.11.29 239,165.82 214,588.44 1.33 USD 400,000 ENEL SpA VAR Sub Ser 144A 13/24.09.73 387,965.05 379,647.11 2.35 USD 250,000 Gaz Capital SA 5.999% Reg-S 11/23.01.21 214,833.60 223,209.85 1.38 USD 600,000 Gaz Capital SA 9.25% Ser REGS 09/23.04.19 601,989.65 536,813.71 3.32 USD 700,000 Goldman Sachs Group Inc 5.95% Sub 06/15.01.27 709,555.01 653,026.55 4.04 USD 200,000 IBM Corp 7% Sen 95/30.10.25 220,273.99 206,599.57 1.28 USD 250,000 JBS Investments GmbH 7.75% Reg S Sen 13/28.10.20 247,905.69 218,423.98 1.35 USD 100,000 JPMorgan Chase & Co 8% Sen Sub 97/29.04.27 119,292.62 107,982.87 0.67 USD 250,000 Kraft Heinz Co (The) 6.125% Ser B Sen 13/23.08.18 218,208.42 215,255.78 1.33 USD 250,000 MGM Resorts Intl 8.625% Ser B Sen 13/01.02.19 212,278.37 220,146.69 1.36 USD 250,000 Petrobras Global Finance BV 8.375% Gl Sen 03/10.12.18 213,464.20 218,776.23 1.35 USD 500,000 Petroleos Mexicanos 8% Ser B Sen Gl 09/03.05.19 442,772.19 443,995.72 2.74 USD 500,000 Société Générale SA VAR EMTN Sub 13/29.11.Perpetual 440,369.39 433,850.10 2.68 USD 500,000 Telecom Italia SA 7.175% Sen 09/18.06.19 435,572.82 441,282.65 2.73 USD 250,000 Turkiye Garanti Bankasi AS 6.25% Sen Reg S 11/20.04.21 245,575.64 213,912.21 1.32 USD 1,000,000 UBS Gr Funding Switzerland AG VAR Sen Su Reg S
15/19.02.Perp 897,836.54 881,203.43 5.45
USD 200,000 Unicredit SpA VAR Ser 3 Sub Reg S 17/19.06.32 167,470.90 152,559.32 0.94
7,963,037.21 7,601,239.94 47.00
Total bonds 15,458,201.33 14,590,027.61 90.19
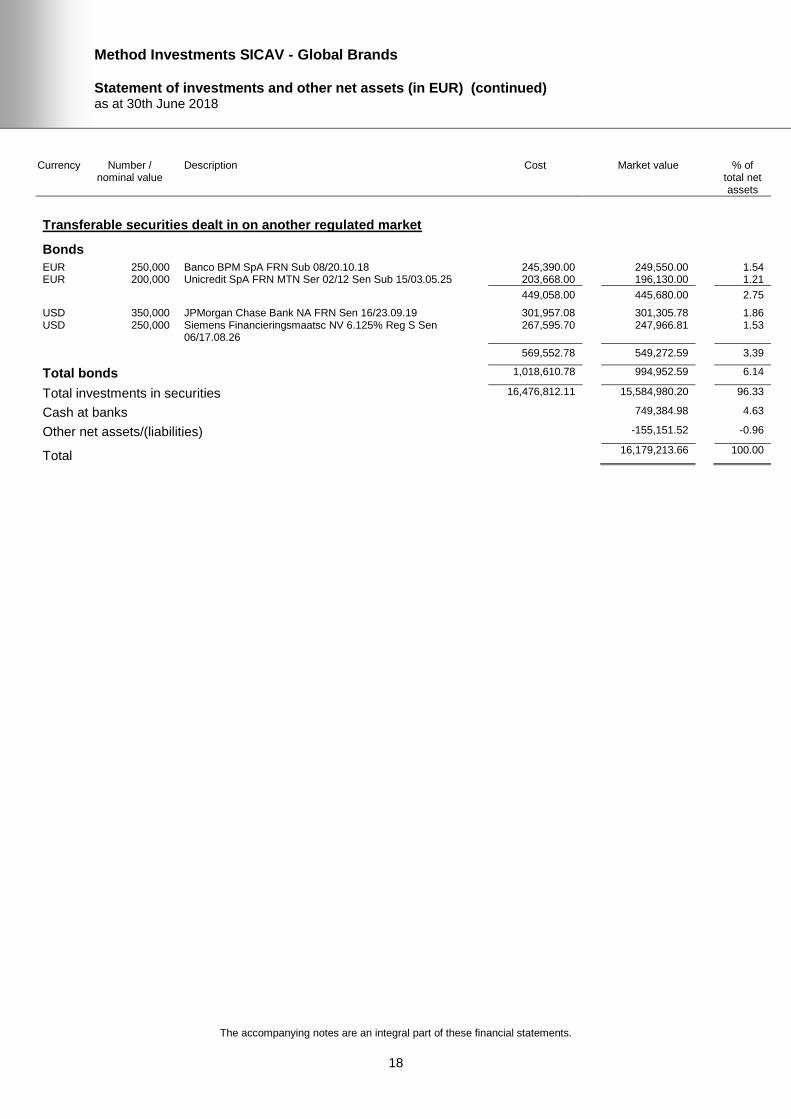
Method Investments SICAV - Global Brands
Statement of investments and other net assets (in EUR) (continued) as at 30th June 2018
The accompanying notes are an integral part of these financial statements.
18
Currency Number / nominal value
Description Cost Market value % of total net assets
Transferable securities dealt in on another regulated market
Bonds
EUR 250,000 Banco BPM SpA FRN Sub 08/20.10.18 245,390.00 249,550.00 1.54 EUR 200,000 Unicredit SpA FRN MTN Ser 02/12 Sen Sub 15/03.05.25 203,668.00 196,130.00 1.21
449,058.00 445,680.00 2.75
USD 350,000 JPMorgan Chase Bank NA FRN Sen 16/23.09.19 301,957.08 301,305.78 1.86 USD 250,000 Siemens Financieringsmaatsc NV 6.125% Reg S Sen
06/17.08.26 267,595.70 247,966.81 1.53
569,552.78 549,272.59 3.39
Total bonds 1,018,610.78 994,952.59 6.14
Total investments in securities 16,476,812.11 15,584,980.20 96.33
Cash at banks 749,384.98 4.63
Other net assets/(liabilities) -155,151.52 -0.96
Total 16,179,213.66 100.00

Method Investments SICAV - Global Brands
Industrial and geographical classification of investments as at 30th June 2018
19
Industrial classification
(in percentage of net assets)
Financials 56.50 %
Utilities 14.78 %
Cyclical consumer goods 4.74 %
Raw materials 4.60 %
Energy 4.09 %
Telecommunications services 4.01 %
Non-cyclical consumer goods 3.81 %
Industrials 2.52 %
Technologies 1.28 %
Total 96.33 %
Geographical classification
(by domicile of the issuer) (in percentage of net assets)
France 14.92 %
Italy 14.76 %
United States of America 13.25 %
The Netherlands 12.53 %
United Kingdom 8.74 %
Luxembourg 8.19 %
Switzerland 5.45 %
Austria 3.63 %
Germany 3.59 %
Mexico 2.74 %
Ireland 2.67 %
Jersey 2.54 %
Portugal 2.00 %
Turkey 1.32 %
Total 96.33 %
METHOD INVESTMENTS SICAV
Notes to the financial statements as at 30th June 2018
20
Note 1 - Significant accounting policies a) Presentation of the financial statements
The financial statements of the Company are prepared in accordance with Luxembourg legal and regulatory requirements concerning Undertakings for Collective Investment and with generally accepted accounting principles in Luxembourg.
b) Valuation of assets
The value of any cash in hand or on deposit, notes and bills payable on demand and accounts receivable (including reimbursements of fees and expenses payable by any UCI in which the Company may invest), prepaid expenses and cash dividends declared and interest accrued but not yet collected, is deemed the nominal value of these assets unless it is improbable that it can be paid and collected in full; in which case, the value will be arrived at after deducting such amounts as the Board may consider appropriate to reflect the true value of these assets. Securities and Money Market Instruments listed on an official stock exchange or dealt on any other Regulated Market are valued at their last available price on the Valuation Day and, if the security or Money Market Instrument is traded on several markets, on the basis of the last known price on the main market of this security. If the last known price is not representative, valuation is based on the fair value at which it is expected it can be sold, as determined with prudence and in good faith by the Board. Unlisted securities and securities or Money Market Instruments not traded on a stock exchange or any other Regulated Market as well as listed securities and securities or Money Market Instruments listed on a Regulated Market for which no price is available, or securities or Money Market Instruments whose quoted price is, in the opinion of the Board, not representative of actual market value, are valued at their last known price in Luxembourg or, in the absence of such price, on the basis of their probable realisation value, as determined with prudence and in good faith by the Board. The valuation of investments reaching maturity within a maximum period of 90 days may include straight-line daily amortisation of the difference between the principal 91 days before maturity and the value at maturity. The liquidation value of futures, spot, forward or option contracts that are not traded on stock exchanges or other Regulated Markets is equal to their net liquidation value determined in accordance with the policies established by the Board on a basis consistently applied to each type of contract. The liquidation value of futures, spot, forward or option contracts traded on stock exchanges or other Regulated Markets is based on the latest available price for these contracts on the stock exchanges and Regulated Markets on which these option, spot, forward or futures contracts are traded, provided that if an option or futures contract cannot be liquidated on the date on which the net assets are valued, the basis for determining the liquidation value of said contract shall be determined by the Board in a fair and reasonable manner. Liquid assets and money market instruments are valued at their nominal value plus accrued interest, or on the basis of amortised costs. The money market instruments are shown at cost and the difference between the cost and the cost of redemption on maturity is shown as interest.
Any other securities and assets are valued in accordance with the procedures put in place by the Board and with the help of specialist valuers, as the case may be, who are instructed by the Board to carry out the said valuations.
Shares or Units in underlying open-ended investment funds are valued at their last available Net Asset Value.
METHOD INVESTMENTS SICAV
Notes to the financial statements (continued) as at 30th June 2018
21
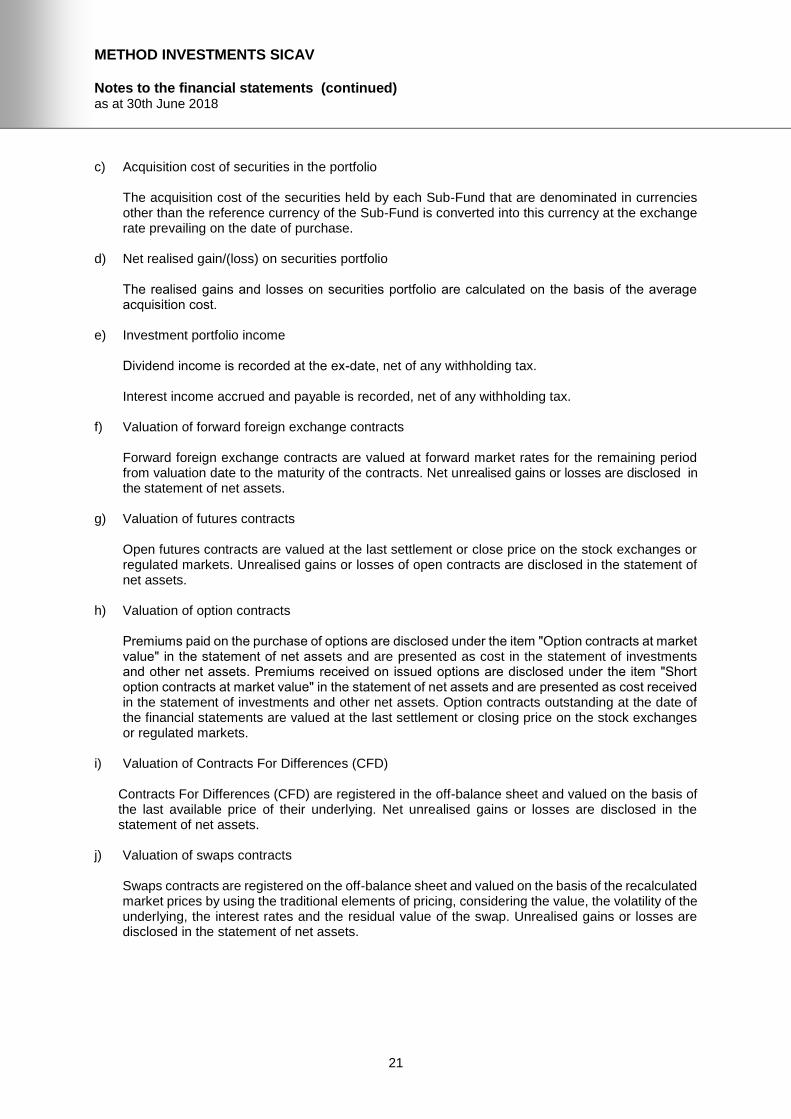
c) Acquisition cost of securities in the portfolio
The acquisition cost of the securities held by each Sub-Fund that are denominated in currencies other than the reference currency of the Sub-Fund is converted into this currency at the exchange rate prevailing on the date of purchase.
d) Net realised gain/(loss) on securities portfolio
The realised gains and losses on securities portfolio are calculated on the basis of the average acquisition cost.
e) Investment portfolio income
Dividend income is recorded at the ex-date, net of any withholding tax.
Interest income accrued and payable is recorded, net of any withholding tax. f) Valuation of forward foreign exchange contracts
Forward foreign exchange contracts are valued at forward market rates for the remaining period from valuation date to the maturity of the contracts. Net unrealised gains or losses are disclosed in the statement of net assets.
g) Valuation of futures contracts
Open futures contracts are valued at the last settlement or close price on the stock exchanges or regulated markets. Unrealised gains or losses of open contracts are disclosed in the statement of net assets.
h) Valuation of option contracts
Premiums paid on the purchase of options are disclosed under the item ̋ Option contracts at market valueʺ in the statement of net assets and are presented as cost in the statement of investments and other net assets. Premiums received on issued options are disclosed under the item ʺShort option contracts at market valueʺ in the statement of net assets and are presented as cost received in the statement of investments and other net assets. Option contracts outstanding at the date of the financial statements are valued at the last settlement or closing price on the stock exchanges or regulated markets.
i) Valuation of Contracts For Differences (CFD)
Contracts For Differences (CFD) are registered in the off-balance sheet and valued on the basis of the last available price of their underlying. Net unrealised gains or losses are disclosed in the statement of net assets.
j) Valuation of swaps contracts
Swaps contracts are registered on the off-balance sheet and valued on the basis of the recalculated market prices by using the traditional elements of pricing, considering the value, the volatility of the underlying, the interest rates and the residual value of the swap. Unrealised gains or losses are disclosed in the statement of net assets.

METHOD INVESTMENTS SICAV
Notes to the financial statements (continued) as at 30th June 2018
22
k) Formation expenses
Formation expenses are amortised on a straight line basis over a period of five years.
If the launch of a Sub-Fund occurs after the launch date of the Company, the formation expenses related to the launch of the new Sub-Fund is charged to such Sub-Fund alone and may be amortised over a maximum of five years with effect from the Sub-Fund’s launch date.
l) Conversion of foreign currencies
Cash at banks, other net assets, liabilities and the market value of the securities in portfolio expressed in currencies other than the reference currency of the Sub-Fund are converted into this currency at the exchange rate prevailing on the date of the financial statements. Income and expenses expressed in currencies other than the reference currency of the Sub-Fund are converted into this currency at the exchange rate prevailing on the date of the transaction. At the date of the financial statements, the exchange rates are as follows:
1 EUR = 1.5800514 AUD Australian Dollar 0.8843357 GBP Pound Sterling 129.3181318 JPY Japanese Yen 22.9498393 MXN Mexican Peso 73.2168453 RUB Russian Rouble 5.3506525 TRY New Turkish Lira
(1 TRY=1,000,000 TRL) 1.1675000 USD US Dollar 16.0070088 ZAR South African Rand
m) Combined financial statements
The combined financial statements of the Company are expressed in EUR and are equal to the sum of the corresponding items in the financial statements of each Sub-Fund.
n) Other liquid assets / Other liquid liabilities
The captions "Other liquid assets" and “Other liquid liabilities” disclosed in the statement of net assets are mainly composed of treasury accounts at brokers.
Note 2 - Investment Management Fee The Investment Manager is entitled to receive out of the assets of each share Class an Investment Management Fee accrued on each Valuation Day and payable monthly in arrears at the following rates p.a.:
Sub-Funds Effective rate
- Method Investments SICAV - Attractive Global Opportunities
- for class A-Acc EUR 2.25%
- for class I-Acc EUR , class I-Acc USD H and class Listing-Acc EUR 1.75%

METHOD INVESTMENTS SICAV
Notes to the financial statements (continued) as at 30th June 2018
23
Sub-Funds Effective rate
- Method Investments SICAV - Attractive Global Opportunities Plus
- for class I-Acc EUR 1.75%
- Method Investments SICAV - Target Selection
- for class A-Acc EUR 1.50%
- for class I-Acc EUR 1.00%
- Method Investments SICAV - Global Brands
- for class P-Acc EUR* 0.10%
- for class I-Acc EUR 0.75%
- Method Investment SICAV - Equity Rebalance
- for class A-Acc EUR 2.25%
- for class I-Acc EUR 1.75%
- for class P-Acc EUR 0%
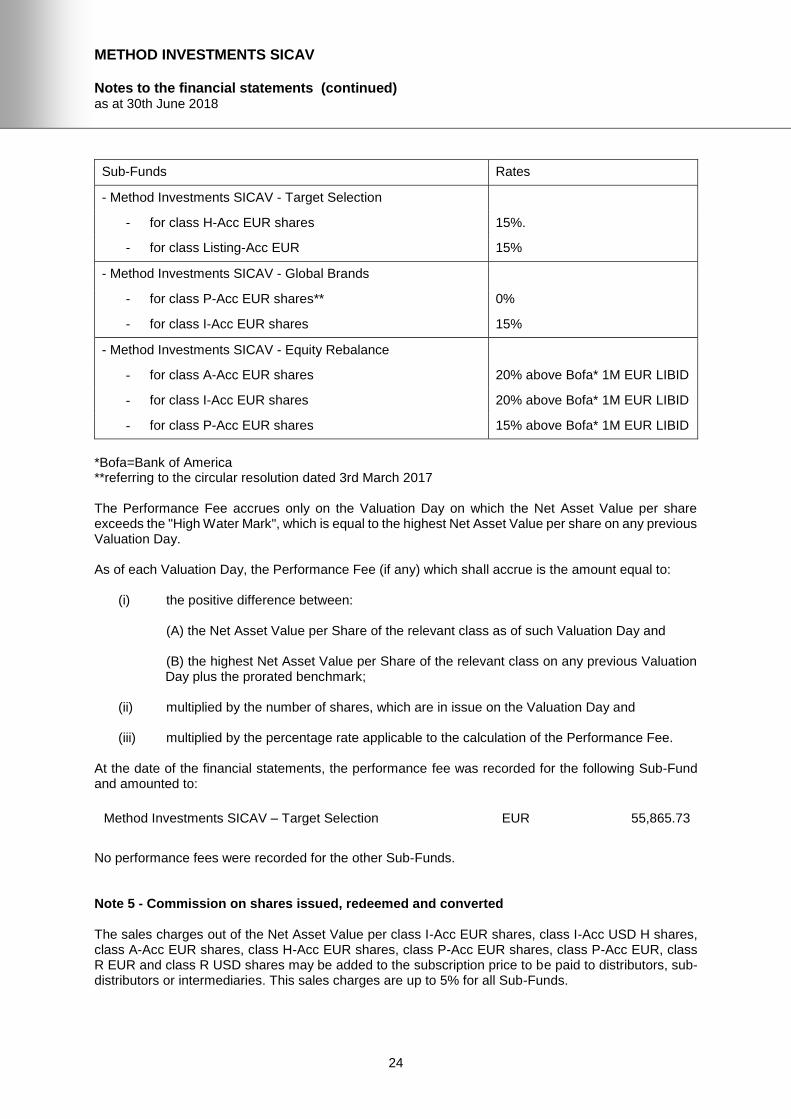
*referring to the circular resolution dated 3rd March 2017 Note 3 - Management fees of the target funds The Sub-Fund invests in UCITS and/or other UCIs whose management fees do not exceed 3% per year of the respective UCITS and/or other UCIs’ net asset value. The actual amounts charged are shown in the Company’s financial report. Note 4 - Performance Fee In addition to the Investment Management Fee, the Investment Manager is entitled to receive a Performance Fee out of the appreciation of the Net Asset Value per share and which is due as of each Valuation Day and is payable monthly in arrears. The Performance Fee is calculated with the following rates:
Sub-Funds Rates
- Method Investments SICAV - Attractive Global Opportunities
- for class A-Acc EUR 20% above Bofa* 1M EUR LIBID
- for class I-Acc EUR shares 20% above Bofa* 1M EUR LIBID
- for class I-Acc USD H shares 20% above Bofa* 1M USD LIBID
- for class Listing-Acc EUR 20% above Bofa* 1M EUR LIBID
- Method Investments SICAV - Attractive Global Opportunities
Plus
- for class I-Acc EUR 20% above Bofa* 1M EUR LIBID
METHOD INVESTMENTS SICAV
Notes to the financial statements (continued) as at 30th June 2018
24
Sub-Funds Rates
- Method Investments SICAV - Target Selection
- for class H-Acc EUR shares 15%.
- for class Listing-Acc EUR 15%
- Method Investments SICAV - Global Brands
- for class P-Acc EUR shares** 0%
- for class I-Acc EUR shares 15%
- Method Investments SICAV - Equity Rebalance
- for class A-Acc EUR shares 20% above Bofa* 1M EUR LIBID
- for class I-Acc EUR shares 20% above Bofa* 1M EUR LIBID
- for class P-Acc EUR shares 15% above Bofa* 1M EUR LIBID
*Bofa=Bank of America **referring to the circular resolution dated 3rd March 2017 The Performance Fee accrues only on the Valuation Day on which the Net Asset Value per share exceeds the "High Water Mark", which is equal to the highest Net Asset Value per share on any previous Valuation Day. As of each Valuation Day, the Performance Fee (if any) which shall accrue is the amount equal to:
(i) the positive difference between:
(A) the Net Asset Value per Share of the relevant class as of such Valuation Day and (B) the highest Net Asset Value per Share of the relevant class on any previous Valuation Day plus the prorated benchmark;
(ii) multiplied by the number of shares, which are in issue on the Valuation Day and
(iii) multiplied by the percentage rate applicable to the calculation of the Performance Fee.
At the date of the financial statements, the performance fee was recorded for the following Sub-Fund and amounted to:
Method Investments SICAV – Target Selection EUR 55,865.73
No performance fees were recorded for the other Sub-Funds. Note 5 - Commission on shares issued, redeemed and converted The sales charges out of the Net Asset Value per class I-Acc EUR shares, class I-Acc USD H shares, class A-Acc EUR shares, class H-Acc EUR shares, class P-Acc EUR shares, class P-Acc EUR, class R EUR and class R USD shares may be added to the subscription price to be paid to distributors, sub-distributors or intermediaries. This sales charges are up to 5% for all Sub-Funds.
METHOD INVESTMENTS SICAV
Notes to the financial statements (continued) as at 30th June 2018
25
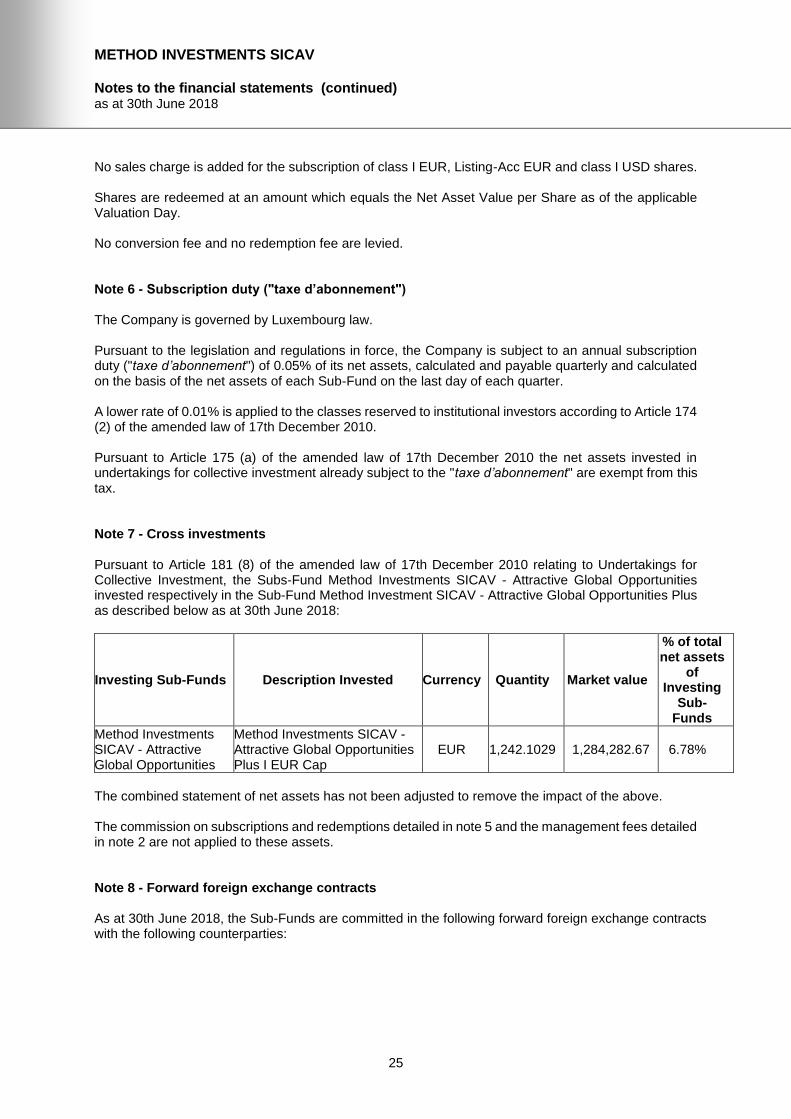
No sales charge is added for the subscription of class I EUR, Listing-Acc EUR and class I USD shares. Shares are redeemed at an amount which equals the Net Asset Value per Share as of the applicable Valuation Day. No conversion fee and no redemption fee are levied. Note 6 - Subscription duty ("taxe d’abonnement") The Company is governed by Luxembourg law. Pursuant to the legislation and regulations in force, the Company is subject to an annual subscription duty ("taxe d’abonnement") of 0.05% of its net assets, calculated and payable quarterly and calculated on the basis of the net assets of each Sub-Fund on the last day of each quarter. A lower rate of 0.01% is applied to the classes reserved to institutional investors according to Article 174 (2) of the amended law of 17th December 2010. Pursuant to Article 175 (a) of the amended law of 17th December 2010 the net assets invested in undertakings for collective investment already subject to the "taxe d’abonnement" are exempt from this tax. Note 7 - Cross investments Pursuant to Article 181 (8) of the amended law of 17th December 2010 relating to Undertakings for Collective Investment, the Subs-Fund Method Investments SICAV - Attractive Global Opportunities invested respectively in the Sub-Fund Method Investment SICAV - Attractive Global Opportunities Plus as described below as at 30th June 2018:
Investing Sub-Funds Description Invested Currency Quantity Market value
% of total net assets
of Investing
Sub-Funds
Method Investments SICAV - Attractive Global Opportunities
Method Investments SICAV - Attractive Global Opportunities Plus I EUR Cap
EUR 1,242.1029 1,284,282.67 6.78%
The combined statement of net assets has not been adjusted to remove the impact of the above.
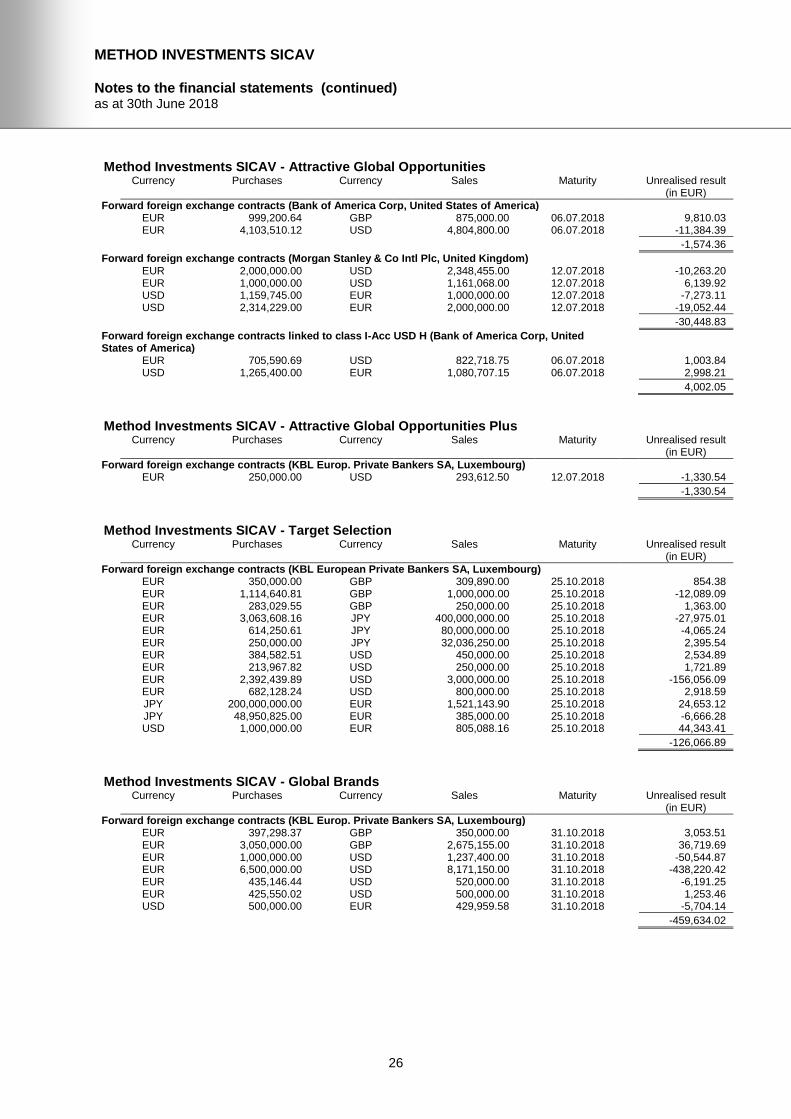
The commission on subscriptions and redemptions detailed in note 5 and the management fees detailed in note 2 are not applied to these assets. Note 8 - Forward foreign exchange contracts As at 30th June 2018, the Sub-Funds are committed in the following forward foreign exchange contracts with the following counterparties:
METHOD INVESTMENTS SICAV
Notes to the financial statements (continued) as at 30th June 2018
26
Method Investments SICAV - Attractive Global Opportunities Currency Purchases Currency Sales Maturity Unrealised result
(in EUR)
Forward foreign exchange contracts (Bank of America Corp, United States of America) EUR 999,200.64 GBP 875,000.00 06.07.2018 9,810.03 EUR 4,103,510.12 USD 4,804,800.00 06.07.2018 -11,384.39
-1,574.36
Forward foreign exchange contracts (Morgan Stanley & Co Intl Plc, United Kingdom) EUR 2,000,000.00 USD 2,348,455.00 12.07.2018 -10,263.20 EUR 1,000,000.00 USD 1,161,068.00 12.07.2018 6,139.92 USD 1,159,745.00 EUR 1,000,000.00 12.07.2018 -7,273.11 USD 2,314,229.00 EUR 2,000,000.00 12.07.2018 -19,052.44
-30,448.83
Forward foreign exchange contracts linked to class I-Acc USD H (Bank of America Corp, United States of America)
EUR 705,590.69 USD 822,718.75 06.07.2018 1,003.84 USD 1,265,400.00 EUR 1,080,707.15 06.07.2018 2,998.21
4,002.05
Method Investments SICAV - Attractive Global Opportunities Plus Currency Purchases Currency Sales Maturity Unrealised result
(in EUR)
Forward foreign exchange contracts (KBL Europ. Private Bankers SA, Luxembourg) EUR 250,000.00 USD 293,612.50 12.07.2018 -1,330.54
-1,330.54
Method Investments SICAV - Target Selection Currency Purchases Currency Sales Maturity Unrealised result
(in EUR)
Forward foreign exchange contracts (KBL European Private Bankers SA, Luxembourg) EUR 350,000.00 GBP 309,890.00 25.10.2018 854.38 EUR 1,114,640.81 GBP 1,000,000.00 25.10.2018 -12,089.09 EUR 283,029.55 GBP 250,000.00 25.10.2018 1,363.00 EUR 3,063,608.16 JPY 400,000,000.00 25.10.2018 -27,975.01 EUR 614,250.61 JPY 80,000,000.00 25.10.2018 -4,065.24 EUR 250,000.00 JPY 32,036,250.00 25.10.2018 2,395.54 EUR 384,582.51 USD 450,000.00 25.10.2018 2,534.89 EUR 213,967.82 USD 250,000.00 25.10.2018 1,721.89 EUR 2,392,439.89 USD 3,000,000.00 25.10.2018 -156,056.09 EUR 682,128.24 USD 800,000.00 25.10.2018 2,918.59 JPY 200,000,000.00 EUR 1,521,143.90 25.10.2018 24,653.12 JPY 48,950,825.00 EUR 385,000.00 25.10.2018 -6,666.28 USD 1,000,000.00 EUR 805,088.16 25.10.2018 44,343.41
-126,066.89
Method Investments SICAV - Global Brands Currency Purchases Currency Sales Maturity Unrealised result
(in EUR)
Forward foreign exchange contracts (KBL Europ. Private Bankers SA, Luxembourg) EUR 397,298.37 GBP 350,000.00 31.10.2018 3,053.51 EUR 3,050,000.00 GBP 2,675,155.00 31.10.2018 36,719.69 EUR 1,000,000.00 USD 1,237,400.00 31.10.2018 -50,544.87 EUR 6,500,000.00 USD 8,171,150.00 31.10.2018 -438,220.42 EUR 435,146.44 USD 520,000.00 31.10.2018 -6,191.25 EUR 425,550.02 USD 500,000.00 31.10.2018 1,253.46 USD 500,000.00 EUR 429,959.58 31.10.2018 -5,704.14
-459,634.02
METHOD INVESTMENTS SICAV
Notes to the financial statements (continued) as at 30th June 2018
27
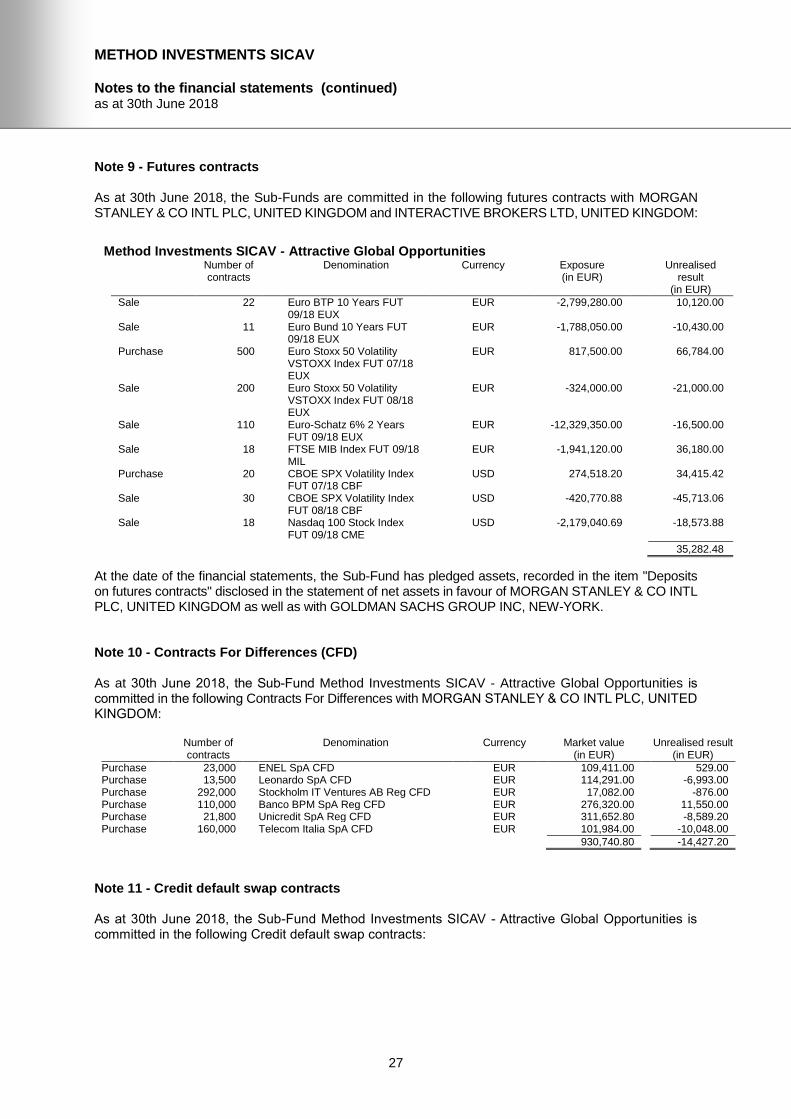
Note 9 - Futures contracts As at 30th June 2018, the Sub-Funds are committed in the following futures contracts with MORGAN STANLEY & CO INTL PLC, UNITED KINGDOM and INTERACTIVE BROKERS LTD, UNITED KINGDOM:
Method Investments SICAV - Attractive Global Opportunities Number of
contracts Denomination Currency Exposure
(in EUR) Unrealised
result (in EUR)
Sale 22 Euro BTP 10 Years FUT 09/18 EUX
EUR -2,799,280.00 10,120.00
Sale 11 Euro Bund 10 Years FUT 09/18 EUX
EUR -1,788,050.00 -10,430.00
Purchase 500 Euro Stoxx 50 Volatility VSTOXX Index FUT 07/18 EUX
EUR 817,500.00 66,784.00
Sale 200 Euro Stoxx 50 Volatility VSTOXX Index FUT 08/18 EUX
EUR -324,000.00 -21,000.00
Sale 110 Euro-Schatz 6% 2 Years FUT 09/18 EUX
EUR -12,329,350.00 -16,500.00
Sale 18 FTSE MIB Index FUT 09/18 MIL
EUR -1,941,120.00 36,180.00
Purchase 20 CBOE SPX Volatility Index FUT 07/18 CBF
USD 274,518.20 34,415.42
Sale 30 CBOE SPX Volatility Index FUT 08/18 CBF
USD -420,770.88 -45,713.06
Sale 18 Nasdaq 100 Stock Index FUT 09/18 CME
USD -2,179,040.69 -18,573.88
35,282.48
At the date of the financial statements, the Sub-Fund has pledged assets, recorded in the item "Deposits on futures contracts" disclosed in the statement of net assets in favour of MORGAN STANLEY & CO INTL PLC, UNITED KINGDOM as well as with GOLDMAN SACHS GROUP INC, NEW-YORK. Note 10 - Contracts For Differences (CFD) As at 30th June 2018, the Sub-Fund Method Investments SICAV - Attractive Global Opportunities is committed in the following Contracts For Differences with MORGAN STANLEY & CO INTL PLC, UNITED KINGDOM:
Number of contracts
Denomination Currency Market value (in EUR)
Unrealised result (in EUR)
Purchase 23,000 ENEL SpA CFD EUR 109,411.00 529.00 Purchase 13,500 Leonardo SpA CFD EUR 114,291.00 -6,993.00 Purchase 292,000 Stockholm IT Ventures AB Reg CFD EUR 17,082.00 -876.00 Purchase 110,000 Banco BPM SpA Reg CFD EUR 276,320.00 11,550.00 Purchase 21,800 Unicredit SpA Reg CFD EUR 311,652.80 -8,589.20 Purchase 160,000 Telecom Italia SpA CFD EUR 101,984.00 -10,048.00
930,740.80 -14,427.20
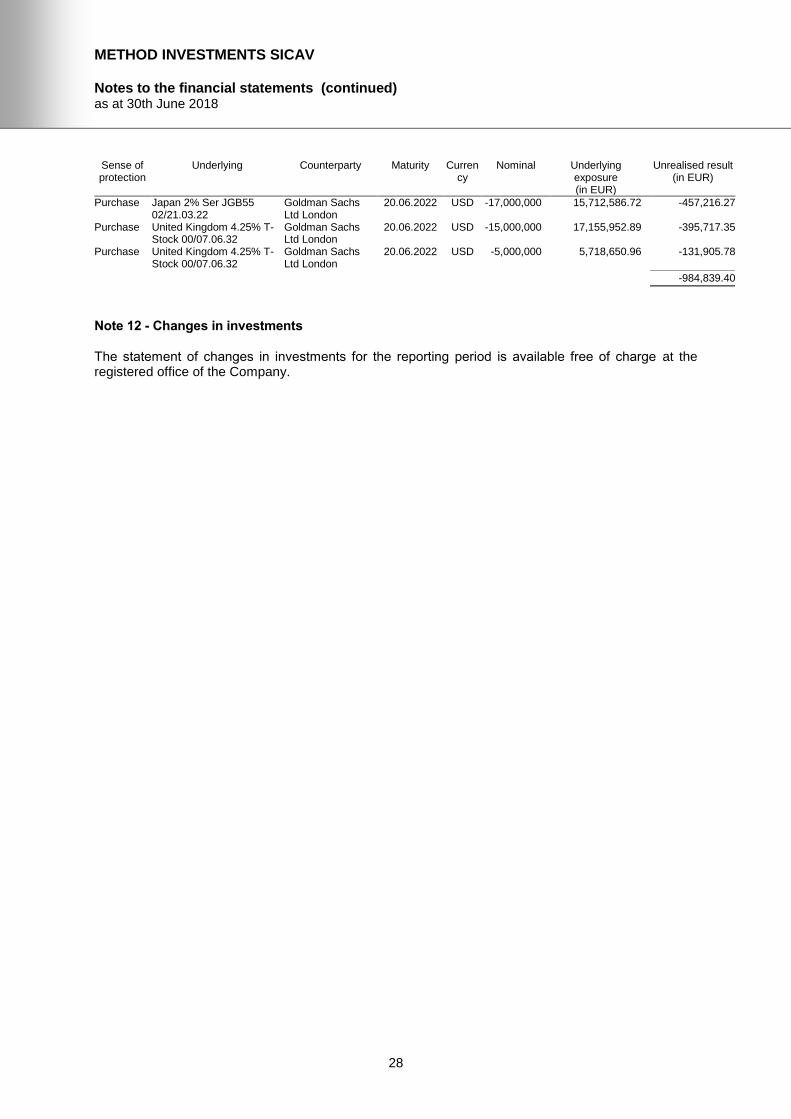
Note 11 - Credit default swap contracts As at 30th June 2018, the Sub-Fund Method Investments SICAV - Attractive Global Opportunities is committed in the following Credit default swap contracts:
METHOD INVESTMENTS SICAV
Notes to the financial statements (continued) as at 30th June 2018
28
Sense of protection
Underlying Counterparty Maturity Currency
Nominal Underlying exposure (in EUR)
Unrealised result (in EUR)
Purchase Japan 2% Ser JGB55 02/21.03.22
Goldman Sachs Ltd London
20.06.2022 USD -17,000,000 15,712,586.72 -457,216.27
Purchase United Kingdom 4.25% T-Stock 00/07.06.32
Goldman Sachs Ltd London
20.06.2022 USD -15,000,000 17,155,952.89 -395,717.35
Purchase United Kingdom 4.25% T-Stock 00/07.06.32
Goldman Sachs Ltd London
20.06.2022 USD -5,000,000 5,718,650.96 -131,905.78
-984,839.40
Note 12 - Changes in investments The statement of changes in investments for the reporting period is available free of charge at the registered office of the Company.
METHOD INVESTMENTS SICAV
Additional information as at 30th June 2018
29
Information concerning the transparency of securities financing transactions and of reuse of cash collateral (regulation EU 2015/2365, hereafter "SFTR") During the reporting period, the Company did not engage in transactions which are subject to the publication requirements of SFTR. Accordingly, no Information concerning the transparency of securities financing transactions and of reuse of cash collateral should be reported.