methodological appendix for reaching welfare time...
TRANSCRIPT

METHODOLOGICAL APPENDIX FOR
Reaching Welfare Time Limits in Los Angeles County: A Study of an Early Cohort
COUNTY OF LOS ANGELES Chief Administrative Office Service Integration Branch Research and Evaluation Services
David E. Janssen, Chief Administrative Officer Alisa Drakodaidis, Assistant Administrative Officer Manuel H. Moreno, Project Director
January 2004

i
TABLE OF CONTENTS Introduction ................................................................................................................................ 1
Study Design...................................................................................................................1
Subject Selection ............................................................................................................1
Disproportionate Stratified Random Sampling ................................................................2
Sample Selection Criteria for Timed-Out Cohort .............................................................2
Sample Selection Criteria for Comparison Group ...........................................................2
Sampling Procedure........................................................................................................3
Statistical Analysis...........................................................................................................3
Data Sources ..................................................................................................................4
Administrative Data .........................................................................................................4
Survey Data ....................................................................................................................5
Phase I.......................................................................................................................5
Phase II......................................................................................................................5
Phase III.....................................................................................................................5
Response Rate ..............................................................................................................5
Statistical Tests for Survey Questions.............................................................................6
CalWORKs Participant Survey Phase I...........................................................................7
CalWORKs Participant Survey Phase II..........................................................................10
CalWORKs Participant Survey Phase III.........................................................................13
Responses to CalWORKs Survey Questions .................................................................16
Focus Groups..................................................................................................................27
Questions for Participants in the Timed-Out Cohort ........................................................27
Questions for Comparison Group Participants ...............................................................29
Focus Group Data...........................................................................................................30

ii
Tables and Figures
Tables Table 1 Percent Distribution of CalWORKs Participants and
Study Samples .................................................................................................. 4
Table 2 Percent Distribution of Survey Response Rates among the Timed-Out
Cohort and Comparison Group by Primary Language ..................................... 6
Table 3 Demographic Characteristics of Focus Group Participants............................... 31
Figures Figure 1 Number of Adults Living in the Household between
January and June 2003 (Survey Question 1) .................................................... 16
Figure 2 Change in Number of Adults Living in the Household between
January and June 2003 (Survey Question 2) .................................................... 16
Figure 3 Change in Marital Status between January and June 2003
(Survey Question 3)........................................................................................... 17
Figure 4 Experienced Housing Problems between January and June 2003
(Survey Question 4)........................................................................................... 17
Figure 5 Types of Housing Problems Experienced between
January and June 2003 (Survey Question 4a) .................................................. 18
Figure 6 Experienced Financial Hardship between January and June 2003
(Survey Question 5)........................................................................................... 18
Figure 7 Types of Financial Hardship Problems Experienced
Between January and June 2003 (Survey Question 5a) ................................... 19
Figure 8 Education Level (Survey Question 6) ................................................................ 19
Figure 9 Attended School or Received Vocational Training
Between January and June 2003 (Survey Question 7) ..................................... 20
Figure 10 Left School for Work between January and June 2003
(Survey Question 8)........................................................................................... 20
Figure 11 Needed or Used Supportive Services Before January 2003
(Survey Question 9)........................................................................................... 21
Figure 12 Needed or Used Supportive Services
Between January and June 2003 (Survey Question 10) ................................... 21
Figure 13 Employed between January and June 2003
(Survey Question 11)......................................................................................... 22

iii
Figure 14 If Unemployed, Looking for Work between
January and June 2003 (Survey Question 11a) ................................................ 22
Figure 15 Barriers to Employment Between January and
June 2003 (Survey Question 11b)..................................................................... 23
Figure 16 Number of Times Changed Jobs between
January and June 2003 (Survey Question 12) .................................................. 23
Figure 17 Held a Second Job between January and June 2003
(Survey Question 13)......................................................................................... 24
Figure 18 Number of Hours Worked Per Week between
January and June 2003 (Survey Question 14) .................................................. 24
Figure 19 Hourly Wages between January and June 2003
(Survey Question 15)......................................................................................... 25
Figure 20 Change in Earnings between January and June 2003
(Survey Question 16)......................................................................................... 25
Figure 21 Lost Health Insurance as a Job Benefit between
January and June 2003 (Survey Question 17) .................................................. 26

1
METHODOLOGICAL APPENDIX FOR REACHING WELFARE TIME LIMITS IN LOS ANGELES COUNTY: A STUDY OF AN EARLY COHORT Introduction This appendix describes the methods used to conduct the study, “Reaching Welfare Time Limits in Los Angeles County: A Study of an Early Cohort,” and includes sample selection criteria for the timed-out cohort and comparison group; sampling procedures; data sources; and statistical analysis. The CalWORKs participant survey is included, and response tabulations for all survey questions are presented in Figures 1 through 21. The protocol used for focus group interviews is included along with the questions asked in the interviews. Study Design The Los Angeles County Board of Supervisors passed a motion on January 21, 2003, to study how CalWORKs families were faring after reaching their time limits by comparing them to participants still receiving aid. Accordingly, this study used a research design in which the experimental group (timed-out cohort and no longer receiving aid) were compared with a stratified random sample of participants in the control/comparison group (still receiving aid). Qualitative and quantitative data were collected from both groups. Participants in the timed-out cohort and the comparison group were tracked for six months, from January to June 2003. Data were collected using a survey questionnaire and focus group interviews. In addition, administrative records from Department of Public Social Services (DPSS) and unemployment insurance records from the State of California, Employment Development Department (EDD), were used to obtain information on the participant’s demographic characteristics, program participation, and employment and income levels. The survey employed questions about employment, income, family structure, housing stability, and supportive services needs. Questions were close-ended and provided quantitative information for data analyses. Qualitative information was obtained through focus group interviews with both groups of participants centered on changes related to employment, income, family structure, and housing stability status. Subject Selection
The Board motion identified 2,100 CalWORKs participants reaching their time limits on January 1, 2003. These 2,100 timed-out participants were not representative of the CalWORKs population still receiving aid in January 2003. The two groups differed primarily by gender, ethnicity, marital status, and primary language. In order to compare the timed-out cohort with a group of CalWORKs participants still receiving aid, it was essential that the comparison group share the same demographic characteristics as participants in the timed-out cohort. A disproportionate stratified random sampling technique allowed the construction of a comparison group that was demographically similar to the participants in the timed-out cohort.

2
Disproportionate Stratified Random Sampling A disproportionate stratified random sample was obtained by separating the CalWORKs population into non-overlapping groups called strata and selecting random samples from each stratum. This sampling procedure has three major advantages. First, it creates homogeneous groups (strata) from a heterogeneous population, which helps in better representing the population being sampled. Second, it yields more precise estimates for each stratum. Finally, different sampling criteria and weights can be applied to each stratum. The comparison group was over-sampled using three different strata, namely gender, ethnicity/language, and marital status. Sample Selection Criteria for Timed-Out Cohort The study was designed to examine differences between the timed-out cohort and comparison group at the household level. Therefore, collecting information from two persons in the same household would have been redundant. Hence, among two-parent households in the timed-out cohort, only one person was randomly selected to participate in the study. This reduced the number of timed-out participants in the final sample from 2,100 to 1,753. Sample Selection Criteria for Comparison Group The sample selection was limited to participants who had not reached their 60-month time limit on January 1, 2003. In order to select the comparison group, the following selection criteria were applied:
Prospective comparison group participants could not have been sanctioned or exempt for more than four months during their participation in CalWORKs.
Prospective comparison group participants could not have been sanctioned in 2003.
Prospective comparison group participants had to be between the ages of 18 and
65 years on January 1, 2003.
Prospective comparison group participants had to have received cash assistance for at least 18 months, but not for more than 48 months between January 1998 and 2003.
Approximately 18,932 participants met the above selection criteria. A random sample of participants from these households was selected within the following three strata: primary language/ethnicity, gender, and marital status. Primary Language/Ethnicity There were five language categories: English, Spanish, Armenian, Vietnamese and “Other.” Ethnicity also had five categories: White, Hispanic, African-American, Vietnamese, and “Other.” Participants who reported Spanish as their primary language or Hispanic as their ethnicity were included in the Hispanic stratum. Vietnamese, Armenian, and English participants were selected only on the basis of primary language identification. The “Other” ethnic strata included mostly other Asians, such as Chinese, Cambodians, Laotians, and Koreans.
3
Gender and Marital Status Gender and marital status were categorized as male and female, and currently married and currently not married, respectively. Sampling within the above three stratum yielded a comparison group of 1,753 participants whose demographic characteristics were similar to the demographic characteristics of the participants in the timed-out cohort. Sampling Procedure The “Survey Select” procedure using the SAS software program was used to select the samples for the comparison group and participants in the timed-out cohort. This procedure provides a variety of methods for selecting probability-based random samples, as well as sampling weights for conducting statistical tests for group comparisons. The demographic characteristics of the comparison group were similar to the demographic characteristics of participants in the timed-out cohort. Table 1 describes the characteristics of the 2,100 participants that timed out on January 1, 2003; 18,932 prospective participants for the comparison group and final sample of 1,753 participants in the timed-out cohort and comparison group. Statistical Analysis Descriptive analyses were conducted to test for group differences between the timed-out cohort and comparison group by using chi-square tests for categorical variables and one-way analysis of variance for continuous variables. Sample weights using the three sampling strata were developed and used in statistical tests to adjust for non-response bias. Multivariate analyses were used to predict outcomes about housing, family structure, supportive service needs, income, and employment. Background characteristics, such as gender, marital status, and language/ethnicity, were used as control variables. Logistic regression was used to predict the following binary variables: marital status (1 = married, 0 = no change or separated); housing problems (1 = yes, 0 = no); need for the following supportive services (1 = yes, 0 = no); transportation services, child care, Food Stamps, drug and alcohol counseling, mental health counseling, Med-Cal, domestic violence services, and housing assistance; employed between January and June 2003 (1 = yes, 0 = no); worked a second job (1 = yes, 0 = no); earned more than the minimum wage between January and June 2003 (1 = yes, 0 = no); barriers to employment (1 = yes, 0 = no); domestic violence, lack of transportation, drug or alcohol abuse, mental health problems, lack of child care, disability or health problems, and language barriers.

4
Table 1. Percent Distribution of CalWORKs Participants and Study Samples Variables
CalWORKs Participants That Timed-Out on January 1, 2003 (N = 2,100)
Prospective CalWORKs Participants for the Comparison Group (N = 18,932)
Timed-Out and Comparison Group Samples (N = 1,753)*
Gender Males Females
30.9 69.1
19.4 80.6
33.1 66.9
Ethnicity White African-American Hispanic Asian/Other
24.3 13.4 21.5 40.8
20.4 28.7 41.6 9.3
22.9 15.9 24.0 37.2
Primary Language English Spanish Armenian Vietnamese Asian/Other
26.9 16.0 18.6 21.2 17.3
66.9 17.3 9.0 2.1 4.7
30.5 17.7 17.0 18.9 15.9
Age-Group 18-29 years 30-39 years 40-49 years 50 + years
4.9 30.4 45.7 19.0
37.0 34.2 22.8 6.0
4.7 30.8 45.4 19.1
Marital Status Currently Married Currently Single
59.6 40.4
27.0 73.0
54.0 46.0
* Characteristics of the timed-out and comparison group samples are reported in one column because, after applying the sample selection criteria to the prospective comparison group participants, the distribution of the comparison group’s demographic characteristics were similar to the demographic distribution of participants in the timed-out cohort. Data Sources Three primary data sources were used for this study: administrative data, survey data, and focus group interviews. Administrative Data Administrative data included CalWORKs records from DPSS and EDD. Monthly extracts of CalWORKs records from the Los Angeles Eligibility Automated Determination and Evaluation Reporting (LEADER) system, GAIN Employment Activity Reporting System (GEARS), and employment data from EDD were merged to generate demographic, program participation, employment, and income information for CalWORKs families for six months before and after January 1, 2003.

5
Survey Data
A short survey with 17 close-ended questions was used to track changes pertaining to family structure, housing stability, supportive services needs, employment, and income. The survey was mailed to the timed-out cohort and comparison group.
The surveys were conducted in four languages: English, Spanish, Armenian, and Vietnamese. Surveys were pre-tested in the Cudahy District Office of DPSS in Southeast County of Los Angeles with CalWORKs participants who attended a workshop on time-limits in April 2003. Surveys were also pre-tested for translation accuracy by GAIN staff workers with fluency in each of the survey languages. Survey respondents received a phone card incentive worth $5.00 for completing the survey. Surveys were mailed to participants in three phases. Questions in the surveys in all phases of data collection were the same, but covered different time-periods.
Phase I
o In the first phase, surveys were mailed to all 1,753 participants in the timed-out
cohort and comparison group and covered the time period between January and March 2003. These surveys were mailed in May 2003.
Phase II
o Participants who returned the first survey were mailed a second survey which
covered the time period between April and June 2003. In the second phase, 1,255 surveys were mailed in July 2003 (702 among the timed-out group and 554 among the comparison group).
Phase III
o In order to increase the response rate, a third survey was mailed to respondents who
did not respond to the survey in the first phase. o In this phase, a total of 2,200 surveys were mailed to 1,036 participants in the timed-
out cohort and 1,169 participants in the comparison group. The survey in the third phase covered the time period between January and June 2003.
Response Rate The proportion of respondents who completed and returned the questionnaire was 39 percent. The timed-out cohort had a slightly higher response rate (41 percent) than the comparison group (36 percent). Table 2 lists the response rate by language for both timed-out cohort and comparison group.

6
Table 2. Percent Distribution of Survey Response Rates* Among the Timed-Out Cohort and Comparison Group by Primary Language Language Timed-Out
(N = 702) Comparison Group
(N = 614) Total
(N = 1316) Armenian 16.9 18.2 17.6 English 12.3 10.6 11.5 Spanish 19.2 16.1 17.8 Vietnamese 29.2 28.7 28.9 Asian/Other 22.4 26.4 24.2 Total 100.0 100.0 100.0 * The calculation of response rates excluded 100 surveys that were returned because the participants were not located. The survey questionnaire was conducted on both the timed-out cohort and comparison group. Responses to each question in the survey are depicted in Figures 1 through 21 for both timed-out cohort and comparison group. Statistical Tests for Survey Questions Differences between participants in the timed-out cohort and comparison group depicted in Figures 1 through 21 were tested using the chi-square statistic.
Chi-square tests between the timed-out cohort and comparison group in Figures 1-3, 8, 16, 18, 19 and 20 were conducted together for all the categories in the variable, yielding one chi-square statistic. Statistically significant and non-significant differences between the two groups are denoted below each figure.
Chi-square tests between the timed-out cohort and comparison group in Figures 5, 7,
11, 12, and15 were conducted separately for each category of the variable, yielding a separate chi-square statistic for each category. Each category that was significantly different is reported in the figures.
o The percentage reported in these figures is the percent of participants that
responded positively or responded yes within each category. This is also the reason why the percentages in these figures do not add up to a 100 percent.
Chi-square tests between the timed-out cohort and comparison group in Figures 4, 6, 9,
10, 13, 14, 17, and 21 were conducted for variables that had yes/no as the response categories.
o The percentage reported in these figures reflects the percent of participants that
responded positively or yes to the question in the timed-out cohort and comparison group.

7
CalWORKs Participant Survey (Phase I) This survey will help us understand how people are doing after they reach the 60-month time limit for receiving CalWORKs cash aid. It is voluntary and your answers will be kept strictly confidential. Please fill in the circles using black or dark ink like this: not like this or this Section 1 - Household and Housing Information 1. In December 2002, including yourself, how many ADULTS were living in your household? (Choose one)
o 1-2 o 3-4 o 5-6 o More than 6
2. Between January and March 2003, did the number of ADULTS in your household change? (Choose one)
o Increase o No change o Decrease
3. Between January and March 2003, did your marital status change? (Choose one)
o No change o Married o Separated o Divorced o Widowed
4. Between January and March 2003, did you experience any of the following housing problems? (Choose all that apply) o Yes o No
o Moved due to financial hardship o Lived in shelter o Evicted or received notice to evict o Difficulty paying the rent o Trouble paying utilities
5. Between January and March 2003, did you experience any of the following? (Choose all that apply) o Yes o No
o Got food from pantry or soup kitchen o Could not afford basic items like diapers, clothing, school supplies, etc. o Went hungry
Section 2 – Education 6. As of January 1, 2003, what was the highest education level you completed? (Choose one)
o Less than High School o High School diploma or GED o 2 year degree (AA or Vocational) o Some College o College degree or higher o Does not apply
7. Between January and March 2003, were you attending school or receiving vocational training?
o YES o NO
8. Between January and March 2003, did you leave school to go to work?
o YES o NO

8
Section 3 - Supportive Services 9. BEFORE January 2003, did you need or use any of the following supportive services? (Choose all that apply)
o Child care o Medi-Cal o Domestic violence services o Transportation assistance o Utility bill assistance o Drug or alcohol abuse services o Housing assistance o None of these
10. BETWEEN January and March 2003, did you need or use any of the following supportive services? (Choose all that apply)
o Child care o Medi-Cal o Food Stamps o Mental Health services o Domestic violence services o Transportation assistance o Utility bill assistance o Drug or alcohol abuse services o Housing assistance o None of these
Section 4 - Employment and Wages 11. Between January and March 2003, were you employed?
o YES o NO
a. If you were NOT employed, were you
looking for work? o YES o NO
b. If you were NOT employed what o Drug or alcohol abuse stopped you from getting a job? o Domestic violence
(Choose all that apply) o Lack of transportation o Mental health problems
o Lack of child care o Disability or health problems
o Language barriers
12. Between January and March 2003, how many times did you change jobs? (Choose one)
o None o 1 o 2 o 3 or more
13. Between January and March 2003, were you working a second job?
o YES O No

9
14. Between January and March 2003, about how many hours a week did you work at all jobs combined? (Choose one)
o None o 1-10 hours o 11-20 hours o 21-30 hours o 31-40 hours o More than 40 hours
15. Between January and March 2003, what was your hourly wage from your main or primary job? (Choose one)
o More than 40 hours o Less than $6.75 o $6.75 o $6.76 to $8.00 o More than $8.00 o No wages
16. Between January and March 2003, did your TOTAL wages (from all jobs combined) change? (Choose one)
o Increase o No change o Decrease
17. Between January and March 2003, did you lose job benefits, such as health insurance?
o YES o NO
THANK YOU FOR PARTICIPATING IN THIS SURVEY

10
CalWORKs Participant Survey (Phase II) This survey will help us understand how people are doing after they reach the 60-month time limit for receiving CalWORKs cash aid. It is voluntary and your answers will be kept strictly confidential. Please fill in the circles using black or dark ink like this: not like this or this Section 1 - Household and Housing Information 1. Between April and June 2003, including yourself, how many ADULTS were living in your household? (Choose one)
o 1-2 o 3-4 o 5-6 o More than 6
2. Between April and June 2003, did the number of ADULTS in your household change? (Choose one)
o Increase o No change o Decrease
3. Between April and June 2003, did your marital status change? (Choose one)
o No change o Married o Separated o Divorced o Widowed
4. Between April and June 2003, did you experience any of the following housing problems? (Choose all that apply) o Yes o No
o Moved due to financial hardship o Lived in shelter o Evicted or received notice to evict o Difficulty paying the rent o Trouble paying utilities
5. Between April and June 2003, did you experience any of the following? (Choose all that apply) o Yes o No
o Got food from pantry or soup kitchen o Could not afford basic items like diapers, clothing, school supplies, etc. o Went hungry
Section 2 – Education 6. As of July 1, 2003, what was the highest education level you completed? (Choose one)
o Less than High School o High School diploma or GED o 2 year degree (AA or Vocational) o Some College o College degree or higher o Does not apply
7. Between April and June 2003, were you attending school or receiving vocational training?
o YES o NO
8. Between April and June 2003, did you leave school to go to work?
o YES o NO

11
Section 3 - Supportive Services 9. Between April and June 2003, did you need or use any of the following supportive services? (Choose all that apply)
o Child care o Medi-Cal o Domestic violence services o Transportation assistance o Utility bill assistance o Drug or alcohol abuse services o Housing assistance o None of these
Section 4 - Employment and Wages 10. Between April and June 2003, were you employed?
o YES o NO
a. If you were NOT employed, were you
looking for work? o YES o NO
b. If you were NOT employed what o Drug or alcohol abuse stopped you from getting a job? o Domestic violence
(Choose all that apply) o Lack of transportation o Mental health problems
o Lack of child care o Disability or health problems
o Language barriers
11. Between April and June 2003, how many times did you change jobs? (Choose one)
o None o 1 o 2 o 3 or more
12. Between April and June 2003, were you working a second job?
o YES O No
13. Between April and June 2003, about how many hours a week did you work at all jobs combined? (Choose one)
o None o 1-10 hours o 11-20 hours o 21-30 hours o 31-40 hours o More than 40 hours
12
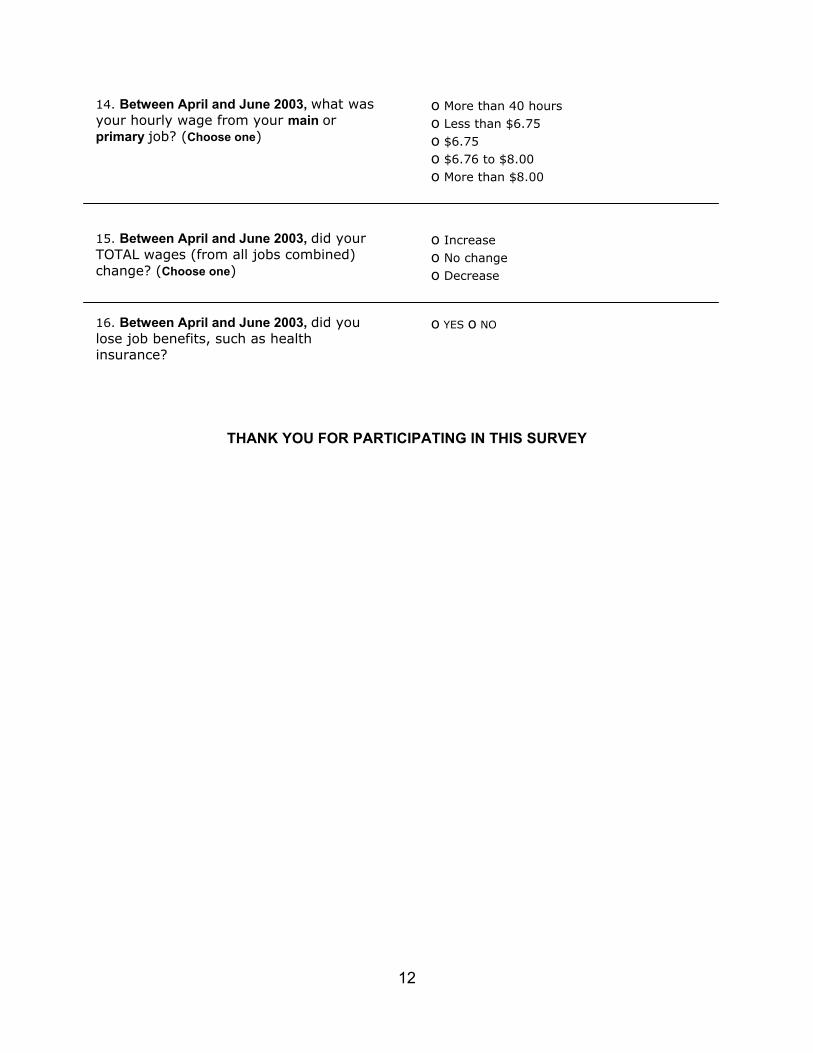
14. Between April and June 2003, what was your hourly wage from your main or primary job? (Choose one)
o More than 40 hours o Less than $6.75 o $6.75 o $6.76 to $8.00 o More than $8.00
15. Between April and June 2003, did your TOTAL wages (from all jobs combined) change? (Choose one)
o Increase o No change o Decrease
16. Between April and June 2003, did you lose job benefits, such as health insurance?
o YES o NO
THANK YOU FOR PARTICIPATING IN THIS SURVEY

13
CalWORKs Participant Survey (Phase III) This survey will help us understand how people are doing after they reach the 60-month time limit for receiving CalWORKs cash aid. It is voluntary and your answers will be kept strictly confidential. Please fill in the circles using black or dark ink like this: not like this or this Section 1 - Household and Housing Information 1. Between January and June 2003, including yourself, how many ADULTS were living in your household? (Choose one)
o 1-2 o 3-4 o 5-6 o More than 6
2. Between January and June 2003, did the number of ADULTS in your household change? (Choose one)
o Increase o No change o Decrease
3. Between January and June 2003, did your marital status change? (Choose one)
o No change o Married o Separated o Divorced o Widowed
4. Between January and June 2003, did you experience any of the following housing problems? (Choose all that apply) o Yes o No
o Moved due to financial hardship o Lived in shelter o Evicted or received notice to evict o Difficulty paying the rent o Trouble paying utilities
5. Between January and June 2003, did you experience any of the following? (Choose all that apply) o Yes o No
o Got food from pantry or soup kitchen o Could not afford basic items like diapers, clothing, school supplies, etc. o Went hungry
Section 2 – Education 6. As of July 1, 2003, what was the highest education level you completed? (Choose one)
o Less than High School o High School diploma or GED o 2 year degree (AA or Vocational) o Some College o College degree or higher o Does not apply
7. Between January and June 2003, were you attending school or receiving vocational training?
o YES o NO
8. Between January and June 2003, did you leave school to go to work?
o YES o NO

14
Section 3 - Supportive Services 9. BEFORE January 2003, did you need or use any of the following supportive services? (Choose all that apply)
o Child care o Medi-Cal o Domestic violence services o Transportation assistance o Utility bill assistance o Drug or alcohol abuse services o Housing assistance o None of these
10. BETWEEN January and June 2003, did you need or use any of the following supportive services? (Choose all that apply)
o Child care o Medi-Cal o Food Stamps o Mental Health services o Domestic violence services o Transportation assistance o Utility bill assistance o Drug or alcohol abuse services o Housing assistance o None of these
Section 4 - Employment and Wages 11. Between January and June 2003, were you employed?
o YES o NO
a. If you were NOT employed, were you
looking for work? o YES o NO
b. If you were NOT employed what o Drug or alcohol abuse stopped you from getting a job? o Domestic violence
(Choose all that apply) o Lack of transportation o Mental health problems
o Lack of child care o Disability or health problems
o Language barriers
12. Between January and June 2003, how many times did you change jobs? (Choose one)
o None o 1 o 2 o 3 or more

15
13. Between January and June 2003, were you working a second job?
o YES O No
14. Between January and June 2003, about how many hours a week did you work at all jobs combined? (Choose one)
o None o 1-10 hours o 11-20 hours o 21-30 hours o 31-40 hours o More than 40 hours
15. Between January and June 2003, what was your hourly wage from your main or primary job? (Choose one)
o More than 40 hours o Less than $6.75 o $6.75 o $6.76 to $8.00 o More than $8.00 o No wages
16. Between January and June 2003, did your TOTAL wages (from all jobs combined) change? (Choose one)
o Increase o No change o Decrease
17. Between January and June 2003, did you lose job benefits, such as health insurance?
o YES o NO
THANK YOU FOR PARTICIPATING IN THIS SURVEY

16
Responses to CalWORKs Survey Questions
Figure 1. Number of Adults Living in the Household Between January and June 2003
(Survey Question 1)
Figure 2. Change in Number of Adults Living in the Household Between January and June 2003
(Survey Question 2)
0.7
96.6
2.70.8
96.7
2.5
0
20
40
60
80
100
Increased Decreased No Change
Perc
ent
Timed-OutComparison Group
Note: No significant difference between the timed-out cohort and comparison group
64.3
27.8
6.7
69.7
22.1
8.1
1.2 0.10
10
20
30
40
50
60
70
1-2 Adults 3-4 Adults 5-6 Adults 6+ Adults
Perc
ent Timed-Out
Comparison Group
Note: Significant difference between the timed-out cohort and comparison group at p < .001

17
Figure 3. Change in Marital Status Between January and June 2003 (Survey Question 3)
Figure 4. Experienced Housing Problems Between January and June 2003 (Survey Question 4)
3.0 3.8
93.3
0.73.9
95.4
0
20
40
60
80
100
Married Separated No Change
Perc
ent
Timed-OutComparison Group
Note: Significant different between the timed-out cohort and the comparison group at p < .001
49.553.0
0
10
20
30
40
50
60
Timed-Out Comparison Group
Perc
ent
Note: Significant difference between the timed-out cohort and comparison group at p < .001

18
Figure 5. Types of Housing Problems Experienced Between January and June 2003 (Survey Question 4a) 1
Figure 6. Experienced Financial Hardship Between January and June 2003 (Survey Question 5)
33.9
42.0
0
5
10
15
20
25
30
35
40
45
50
Timed-Out Comparison Group
Perc
ent
Note: Significant difference between the timed-out cohort and comparison group at p < .001
42.2
32.9
6.24.6
1.8
41.3
32.1
7.25.2
1.00
5
10
15
20
25
30
35
40
45
50
Rent Utilities Eviction Moved Lived in a Shelter
Perc
ent
Timed-OutComparison Group
*
* Significant difference between timed-out cohort and comparison group at p <.05
1 Percentages are calculated within each category for the timed-out cohort and the comparison group

19
Figure 7. Types of Financial Hardship Problems Experienced Between January and June 2003 (Survey Question 5a) 1
Figure 8. Highest Education Completed (Survey Question 6)
7.1
25.626.2
41.1
4.7
35.6
22.3
37.4
0
5
10
15
20
25
30
35
40
45
50
Less Than High School High School Some College College or More
Perc
ent
Timed-OutComparison Group
Note: Significant difference between the timed-out cohort and comparison group at p < .0001
5.36.7
33.1
6.0 6.4
38.6
0
5
10
15
20
25
30
35
40
45
50
Went to a Soup Kitchen Went Hungry Unable to Afford Basic Items
Perc
ent
Timed-OutComparison Group
*
* Significant difference between timed-out cohort and comparison group at p < .001
1 Percentages are calculated within each category for the timed-out cohort and the comparison group

20
Figure 9. Attended School or Received Vocational Training Between January and June 2003
(Survey Question 7)
Figure 10. Left School for Work Between January and June 2003 (Survey Question 8)
17.5
37.1
0
5
10
15
20
25
30
35
40
45
50
Timed-Out Comparison Group
Perc
ent
Note: Significant difference between the timed-out cohort and comparison group at p < .0001
13.1
11.2
0
2
4
6
8
10
12
14
16
18
20
Timed-Out Comparison Group
Perc
ent
Note: Significant difference between the timed-out cohort and comparison group at p < .05

21
Figure 11. Needed or Used Supportive Services Before January 2003 (Survey Question 9) 1
Figure 12. Needed or Used Supportive Services Between January and June 2003 (Survey Question 10) 1
31.1
14.2
16.7
69.6
0.8
3.6
1.4
18.1
42.3
15.3
30.6
73.3
2.0
8.5
73.8
1.7
18.7
70.9
0 10 20 30 40 50 60 70 80 90 100
Transportation *
Utility Bill
ChildCare *
Food Stamps *
Substance Abuse *
Mental Health *
Medi-Cal *
Domestic Violence
Housing
Percent
Comparison Group
Timed-Out
* Significant difference between timed-out cohort and comparison group at p < .001
1 Percentages are calculated within each category for the timed-out cohort and the comparison group
34.1
21.8
20.6
75.8
1.6
6.0
77.6
1.4
22.1
45.0
20.5
33.9
77.2
0.8
10.1
76.8
0.3
20.6
0.0 10.0 20.0 30.0 40.0 50.0 60.0 70.0 80.0 90.0 100.0
Transportation *
Utility Bill
ChildCare *
Food Stamps
Substance Abuse *
Mental Health *
Medi-Cal
Domestic Violence *
Housing
Percent
Comparison GroupTimed-Out
* Significant difference between timed-out cohort and comparison group at p <.001
1 Percentages are calculated within each category for the timed-out cohort and the comparison group

22
Figure 13. Employed Between January and June 2003 (Survey Question 11)
Figure 14. If Unemployed, Looking for Work Between January and June 2003
(Survey Question 11a)
46.1
69.7
0
10
20
30
40
50
60
70
80
90
100
Timed-Out Comparison Group
Perc
ent
Note: Significant difference between the timed-out cohort and comparison group at p < .0001
69.0
59.2
0
10
20
30
40
50
60
70
80
90
100
Timed-Out Comparison Group
Perc
ent
Note: Significant difference between the timed-out cohort and comparison group at p < .0001

23
Figure 15. Barriers to Employment Between January and June 2003 (Survey Question 11b) 1
Figure 16. Number of Times Changed Jobs Between January and June 2003
(Survey Question 12)
92.088.1
8.3
2.06.0
3.6
0
10
20
30
40
50
60
70
80
90
100
None Once Two or More Times
Perc
ent
Timed-OutComparison Group
Note: Significant difference between the timed-out cohort and comparison group at p < .0001
38.4
32.4
41.0
12.8
1.8
22.5
3.1
20.3
34.737.2
11.5
1.1
32.6
1.60
5
10
15
20
25
30
35
40
45
50
DomesticViolence *
Transportation * SubstanceAbuse
Mental Health Child Care * PhysicalDisability
Language *
Perc
ent
Timed-OutComparison Group
* Significant difference between the timed-out cohort and comparison group at p < .05
1 Percentages are calculated within each category for the timed-out cohort and the comparison group

24
Figure 18. Number of Hours Worked Per Week Between January and June 2003
(Survey Question 14)
Figure 17. Held a Second Job Between January and June 2003 (Survey Question 13)
7.8
6.3
0
2
4
6
8
10
12
14
16
18
20
Timed-Out Comparison Group
Perc
ent
Note: Significant difference between the timed-out cohort and comparison group at p < .0001
31.5
4.3
14.912.6
32.3
51.9
5.4
10.4
7.3
19.8
4.4 5.2
0
10
20
30
40
50
60
None 1-10 Hours 11-20 Hours 21-30 Hours 31-40 Hours 40 + Hours
Perc
ent
Timed-OutComparison Group
Note: Significant difference between the timed-out cohort and comparison group at p < .001

25
Figure 19. Hourly Wages Between January and June 2003 (Survey Question 15)
Figure 20. Change in Earnings Between January and June 2003 (Survey Question 16)
8.1
49.6
28.5
2.7
30.2
40.2
26.9
13.8
0
10
20
30
40
50
60
70
80
90
100
< $6.75 $6.75 $6.76-$8.0 > $8.0
Perc
ent
Timed-OutComparison Group
Note: Significant difference between the timed-out cohort and comparison group at p < .001
5.09.3
85.7
4.7
9.5
85.8
0
10
20
30
40
50
60
70
80
90
100
Increase Decrease No Change
Perc
ent
Timed-OutComaprison Group
Note: No significant difference between timed-out cohort and comparison group

26
Figure 21. Lost Health Insurance as a Job Benefit Between
January and June 2003 (Survey Question 17)
6.3
9.1
0
1
2
3
4
5
6
7
8
9
10
Timed-Out Comparison Group
Perc
ent
Note: Significant difference between the timed-out cohort and comparison group at p < .001

27
Focus Groups The purpose of focus groups was to provide in-depth information on the well-being of participants after reaching time limits, and further probe the questions asked in the surveys. Participants for the focus groups were selected by drawing a random sample from participants who responded to the Phase I of the surveys.
The focus groups were conducted in two waves in July and August of 2003. The first wave was conducted in July and the second wave was conducted in August. The second wave was lagged by one-month in order to conduct phone interviews with participants who participated in the first wave of the focus groups.
Information obtained from phone interviews was used to enhance and better understand
the information obtained in focus group interviews.
Focus group participants in the timed-out cohort were recruited from regionally concentrated populations that were representative of the main languages spoken by them, i.e. English, Spanish, Vietnamese, and Armenian. Focus groups for the timed-out cohort were conducted in all of these four languages.
Armenian and Vietnamese participants are a smaller proportion of the CalWORKs
population still receiving aid. Therefore, focus groups with the comparison group were conducted only in English and Spanish.
Participants were given information on the confidentiality of the study and were asked to
sign a consent form. They were assured that their identity would not be revealed to either DPSS or any County or government organization. The consent forms were signed in English, Spanish, Vietnamese, or Armenian, depending on the primary language of the participants.
After signing the consent form, the participants were given a brief introduction, which
included the background of the facilitators, the purpose of the discussion, and the importance of the study.
The interviews were transcribed and summarized to provide a qualitative assessment of
the economic and family situation of participants who reached time limits by comparing them with those who continue to receive aid.
Questions for Participants in the Timed-Out Cohort
Were you aware that your aid was ending?
How did you feel when your aid ended?
Getting off of welfare is often hard for families. How have things been for you and your family since you reached your 60-month time limit for receipt of aid? Have things gotten better, worse, or about the same and in what ways?
Have you changed your priorities? What, if anything, have you had to give up or defer?

28
We would like to know if you’ve experienced times when you ran short of essentials – food, utilities, money for transportation, or to pay your rent.
Have you had to make changes in your living situation or delay taking care of health or
other essential needs? (After they answer the above, ask:) Are these shortages worse since coming off of welfare? Please give examples.
How do you stretch your dollars or what did you do when this (shortages) happened?
(Probe for additional sources of income and where have they gone for help in making it.)
Next, we would like you to think back to the time before your aid ended. Were you
aware that your aid would be ending, and did you receive any help (job training, counseling, or other supportive services) to prepare for the end of your aid?
How helpful were these services?
What other services (Medi-Cal, subsidized housing, food stamps, etc.) did you receive
before your aid ended? Are you receiving transitional services (child care, Medi-Cal, Food Stamps)?
If not receiving these services, why?
(If not receiving these services, how are they meeting these needs?)
What information did you receive about services that would be available once your aid
ended and are you using them?
Are there services that you need to sustain your family, but can’t get?
Now we would like to know some things about your efforts to find work. What jobs have you held since your welfare ended and how did you chose them?
o If you left a job, what led to your decision?
o If you’re not working, are you looking for work?
o If you are working, are you bringing in more money now than you did while on
welfare?
o If not, what is the biggest barrier to getting a better job?
While you were on welfare, what were you able to do to prepare for a better job? What have you been able to do to prepare for a better job since welfare
ended?

29
What has been the most positive thing about getting off of welfare?
What has been the impact of the end of welfare on your family?
(Probe for positive and negative impact.) What is the greatest difficulty that you have encountered since your welfare ended?
How have you tried to overcome it?
If you could talk to the Board of Supervisors, what would you tell them that you need? Questions for Comparison Group Participants
How have things been for you and your family since you have been receiving aid and in the GAIN program? Has receiving aid and being in GAIN helped or been bad for you and in what ways?
Making ends meet on welfare is often hard for families. We would like to know if you’ve
experienced times when you ran short of essentials – food, utilities, money for transportation, or to pay your rent.
o Have you had to make changes in your living situation or delay taking care of
health or other essential needs? Please give examples. o How do you stretch your dollars or what did you do when this (shortages)
happened?
(Probe for additional sources of income and help. Remind them that their answers will remain confidential).
How do you feel about the time-limit to the receipt of your aid?
Do you know when your time clock for receiving aid will end?
How prepared do you think you’ll be to survive without aid?
What are you doing to prepare for the time when your aid will end?
Are you receiving any help from GAIN to prepare for that time (e.g., job training,
education, counseling, or other supportive services) ?
o How helpful are these services?
o Are there services that you think would be helpful to prepare for the time when your aid will end but can’t get?
What other services/benefits (child care, transportation assistance, Medi-Cal, subsidized
housing, Food Stamps, etc.) do you receive?
o Have you ever had trouble getting services/benefits?

30
What information have you received about services that will be available once your aid ends?
o Are there services that you think you’ll need to sustain your family but may not be
able to get?
Now we would like to know some things about your efforts to find work. What jobs have you held since you have been in GAIN, how many hours per week do you work, and what is your hourly pay?
o How did you choose your job? o If you left a job, what led to your decision? o If you’re not working, are you looking for work? o If you are working, are you bringing in more money now than you did while on
welfare?
o If not, what is the biggest barrier to getting a better job?
GAIN says that you should take whatever job you can get and then get a better job. What are you doing to prepare for a better job?
o What difficulties do you have in getting further education or training to prepare for
a better job?
How do you think GAIN has helped you move toward self-sufficiency?
What could GAIN be doing better to help you move toward self-sufficiency?
o How have you tried to overcome these deficiencies or barriers to self-sufficiency?
What do you think will be the impact of reaching your 60-month time limit on your family?
(Probe for positive and negative impact.) If you could talk to the Board of Supervisors, what would you tell them that you need?
Focus Group Data
Questions in focus group interviews among both groups of participants covered areas of income, employment, housing, supportive services, and family structure.
Facilitators further probed how participants were coping with meeting life’s necessities
and if they experienced shortages of food, money, etc.
They were asked about the types of supportive services they received prior to reaching their time limits and the services they still continue to receive, such as child care.

31
Finally, participants were asked to add their comments and any other additional information.
Table 3 lists the sample characteristics of the participants that participated in the focus group interviews.
Table 3. Demographic Characteristics of Focus Group Participants
English Spanish Armenian Vietnamese Timed-
out (N= 5)
Compar-ison
Group (N= 5)
Timed-out
(N= 8)
Compar-ison
Group (N= 6)
Timed-out
(N= 7)
Compar-ison
Group *
Timed-out
(N= 9)
Compar-ison
Group *
Ethnicity White African- American Hispanic Vietnamese Cambodian Armenian
4
1
2
2 1
8
6
7
Gender Males Females
1 4
5
3 5
1 5
7
3 6
Marital Status Single Married
4 1
5
5 3
2 4
1 7
1 8
Mean Age NA NA 41 37 42 47 Education No formal education Less than high-school High School Some College Masters
NA
NA
6 2
5 1
3 3 1
9
* Focus group interviews were not conducted for Armenian and Vietnamese speaking participants in the comparison group because they were a smaller proportion of the CalWORKs population.