methodological framework, analytical tool and...
TRANSCRIPT

Per Skougaard KaspersenKirsten HalsnæsJay GreggMartin DrewsDecember 2012
Report 11.2012
DTU Management Engineering
Methodological framework, analytical tool and database for the assessment of climate change impacts, adaptation and vulnerability in Denmark
Data Sheet
Title: Methodological framework, analytical tool and database for the assessment of climate change impacts, adaptation and vulnerability in Denmark.
Authors: Per Skougaard Kaspersen, Kirsten Halsnæs, Jay Gregg and Martin Drews
Publisher: Climate Change and Sustainable Development Programme (CCSD), Systems Analysis Division, DTU Management Engineering
URL: http://www.dtu.dk/subsites/ClimateDTU/KlimaDTU/KlimaDTU_CCSD.aspx
Release: December 2012
Keywords: Climate change, adaptation, impact analysis, integrated assessment, vulnerability, exposure, methodological framework.
Page number: 36
Internet version: The report is available in electronic format (PDF) at www.man.dtu.dk/English/About/Reports/2012.asp

2
Preface This report was prepared at the request of and funded by the Coordination Unit for Research in
Climate Change Adaptation (KFT).
The report is a milestone of the project titled “Udvikling af metodisk ramme for dansk analytisk
værktøj og database over klimasårbarhed og klimatilpasning”, funded by KFT. The project is one of
seven initiatives proposed by KFT for 2012. The methodology report includes definitions of major
concepts, an outline of an analytical structure, a presentation of models and their applicability, and the
results of case studies.
The work presented in this report draws on intensive research collaboration with several Danish
universities and Centres of Excellence, including DMI, GEUS, DHI, Aarhus University, Copenhagen
University, and DTU. Work carried out by our research partners has been co-funded by a number of
different sponsors, including KFT and the Danish Strategic Research Council.
The flood hazard maps presented in this report constitute the first preliminary results of on-going
methodological and analysis development in mapping potential impacts in relation to flooding from
extreme precipitation in the city of Aarhus. For all purposes the Aarhus flood maps presented in this
report should be considered work-in-progress. The analysis was conducted by DHI as part of the DSF
project Centre for Regional Change of the Earth System (CRES).

3
Contents Data Sheet ........................................................................................................................................... 1
Preface ................................................................................................................................................ 2
1. Introduction ................................................................................................................................. 4
2. Scope of the report ...................................................................................................................... 4
3. Climate change vulnerability, risk and adaptation ...................................................................... 5
4. Framework for integrated climate change impact and adaptation analysis................................. 6
Climate and socioeconomic projections.......................................................................................... 6
Impact assessment ........................................................................................................................... 8
Mapping physical impacts .............................................................................................................. 8
Risk and adaptation cost assessment ............................................................................................... 9
Decision support ........................................................................................................................... 10
5. Danish Integrated Assessment System (DIAS)......................................................................... 11
6. Data inventory ........................................................................................................................... 16
7. Vulnerability and exposure to climate change .......................................................................... 22
Vulnerability indicators................................................................................................................. 22
8. Case example - Integrated impact assessment of flooding from extreme rainfall in Aarhus .... 25
9. Conclusions and perspectives ................................................................................................... 35
10. References ............................................................................................................................. 36
4
1. Introduction This report provides a short introduction to a methodological and modelling framework that can be
used to assess climate risks and adaptation options. The framework has been developed in a Danish
context as part of an on-going collaboration between Danish universities and other research
institutions in research projects as well as in the context of the Coordination Unit for Danish Research
in Climate Change Adaptation (KFT).
In the following the major focus is how integrated assessments of climate change adaptation related to
decision making can be structured and established through linking of data, modelling tools and
conceptual models from various disciplines including climatology, ecology, hydrology, agricultures
sciences, energy systems, urban systems, economics, sociology, etc.. Obviously, it is not possible to
be comprehensive within such a broad field, and hence the present manuscript aims at providing an
overview of linkages and analytical structures that are particularly illustrating related to specific case
studies in the urban and rural areas.
The described system follows a bottom up approach, which implies that the idea is to support context
specific assessments of areas, which are expected to be particularly vulnerable to climate change
impacts (hotspots). Such assessments, while being specific, also have a strong generic methodological
element, and a major aim of the paper is to develop and apply this element.
Application of an approach for detailed context specific assessments as in the present context is
extremely demanding in terms of data access, and it has therefore been a major part of the work to
retrieve relevant data sets and to establish a proper database related to the included Danish case
examples. The complexities in data access are manifold and include the multidisciplinary character of
the data, formatting problems, property rights, and commercial issues. Being part of a several research
projects has helped to overcome many of these barriers, but it also means that some of the data and
modelling tools mentioned herein are not freely available to the public. This hindrance is unfortunate,
as these tools could be highly interesting for broader use by, e.g. stakeholders and local governments.
2. Scope of the report The report is presenting a general methodological framework and an analytical tool that can be used
to assess climate change impacts, vulnerabilities, and adaptation options in Denmark. The report
includes definitions of major concepts, outlines an analytical structure, identify models and
applications, and finally present case study results based on the approach.
The scope of the framework is on the provision of policy relevant information where climate change
impact data and potential adaptation options and costs can be assessed in an integrated manner. There
are marked differences as to how data will be used in relation to different climate change impacts and
adaptation studies in a sectorial or geographical scope. The analytical tool and the data system
presented in this report reflects the scope of on-going research projects including CRES (Centre of
Regional Change in the Earth System) and RiskChange (Risk Based Design in a Changing Climate),
both funded by DSF (Det Strategiske Forskningsråd). This means that the system in no manner may
be considered comprehensive in covering all relevant areas and sectors for Danish climate change
adaptation analysis.
The final part of the report presents the results of a case study on flood impacts from extreme
precipitation in the city centre of Aarhus. This case study highlights key methodological issues and
5
documents the requirements for data integration and further development of analytical tools including
detailed climate models, impact models and tools for socioeconomic analysis.
3. Climate change vulnerability, risk and adaptation The published literature on climate change impacts and adaptation offer various definitions of risk and
vulnerabilities. In many cases they are designed in order to reflect specific issues of policy relevance
within the area. At the same time, very comprehensive and integrated concepts are suggested, that
take several cross sectorial and interdisciplinary aspects into consideration, which often leads to rather
complicated approaches. In the following we propose a specific methodological framework that may
be used to develop and apply a bottom up based integrated assessment tool. The concept definitions
and analytical structure will reflect the aim to support climate risks assessment as support to decision
making on adaptation options.
A key focus of climate change impacts and adaptation studies is to determine the vulnerability of a
system, and to propose decision making to support the development of effective adaptation strategies
to reduce vulnerability. According to the Intergovernmental Panel on Climate Change - Working
Group II (2007) “Vulnerability to climate change is the degree to which a system is susceptible to, or
unable to cope with, adverse effects of climate change, including climate variability and extremes.
Vulnerability is a function of the character, magnitude, and rate of climate variation to which a system
is exposed, its sensitivity, and its adaptive capacity”.
A full implementation of this vulnerability concept in comprehensive studies is likely to prove
extremely demanding if a broad range of climate sensitive sectors are to be covered, and even then it
will remain to be determined how valuable it is to establish such detailed overviews of
vulnerabilities. The present approach is to address vulnerabilities as a broader screening exercise,
which as a first qualitative step is used to select areas for in depth adaptation analysis.
Following the definition of vulnerability, proper adaptation strategies should aim at reducing
vulnerabilities related to specific climate risks, and assessments should therefore focus on how
climate change affects natural and human systems, determination of physical, social, and economic
consequences, and thereby measure climate change risks. Following that, adaptation strategies aim at
balancing potential risk reduction and adaptation costs.
Climate change risks are here defined as the consequence of a climate event times the probability of
the event.

6
4. Framework for integrated climate change impact and adaptation
analysis A generic structure for generating technical information for climate change adaptation is illustrated in
Figure 1. This figure demonstrates how information about the climate system, impacts, and related
costs may support decision making. The approach for generating information can be structured into
five different analytical steps:
Climate and socioeconomic projections
Impact assessment
Mapping of physical impacts
Risk and adaptation costs assessment
Decision support
Each of the five steps is discussed in detail below.
Figure 1: Generic structure for providing information for decision support in relation to climate change adaptation.
Climate and socioeconomic projections
In this step, various possible scenarios are created for future conditions. Typically, we will have two
classes of scenarios:
1. A reference scenario (where current trends are projected into the future)
2. A climate change scenario (where additional forcing from a changing climate is considered)
Regional
Climate Data
Socio-
economic
scenario
Downscaled
Projections
Projected state
of human
controlled
system
Cost of
Adaptation
Options
Climate
Change Cost
Assumptions
Risks
Adaptation
Plan
Adaptation
Cost
Assumptions
Statistical
Model
Scenario
Model
Impacts
Assessment
Assessment
tool
Step 1
Climate and
Socioeconomic projections
Step 2
Impacts
assessment
Step 3
Mapping physical
impacts
Step 4
Risk and adaptation
cost assessment
Step 5
Decision support
Physical Impacts
Adaptation Options
7
The Reference scenario
From Figure 1, there are at least two dimensions in developing a reference scenario: the physical
climatic projections and the socioeconomic projections. The reference scenario projects the likelihood
for unchanged climatic conditions (including the probability for extreme weather events) into the
future, as well as serves to establish a plausible storyline for future socioeconomic conditions. There
may be several reference scenarios developed in order to conduct sensitivity analyses on different
parameter values to determine which are the most important to target for further study in order to
reduce uncertainty.
Physical parameters (e.g., temperature and precipitation) are predicted using climate models or earth
system models. In some cases, such as urban flooding, detailed precipitation data are necessary.
Typically, output from coarse resolution (global or regional) climate models must be statistically
downscaled to a finer spatial resolution. This can be one of the challenging aspects of this step, and
the distribution of local climate parameters (such as precipitation) is potentially highly uncertain.
The reference case also aims at projecting socioeconomic activities in the area of interest. In order to
subsequently link climate impacts and socioeconomic activities, it will often be relevant to develop a
geographical representation of the activities, which is not directly built into the structure of economic
modelling tools. The socioeconomic scenario may also include estimates for the uncertainty bounds
for the historic data and projected scenarios, or have important assumptions noted in the projections as
determined from a sensitivity analysis.
The Climate change scenario
The climate change scenario is based on outputs from climate models or earth system models.
Depending on the time frame considered for the adaptation options, climate change projections will be
strongly conditioned on different emission scenarios (see, for example Intergovernmental Panel on
Climate Change., Working Group 3, 2000 for further discussion). Since 2000 the SRES family of
emission scenarios have been used almost exclusively, these scenarios are, however, presently being
replaced by a new family of scenarios called the Representative Concentration Pathways (RCP).
If the relevant time horizon for a specific purpose is the "near future" (i.e. up to 2050), there is not
much difference in the predicted climate parameters across various climate change scenarios; the
difference in the scenarios due to emissions is seen exclusively on longer time scales (towards 2100
and beyond). Thus, for assessments of climate change impacts using the longer time horizon, it may
be necessary to consider multiple climate change scenarios, as no inherent probability have been
asserted to the underlying emission scenarios.
The two different scenarios (reference vs. climate change) allow us to discern how climate change
affects individual parameters and will lead to a better understanding of the impacts in the next step.
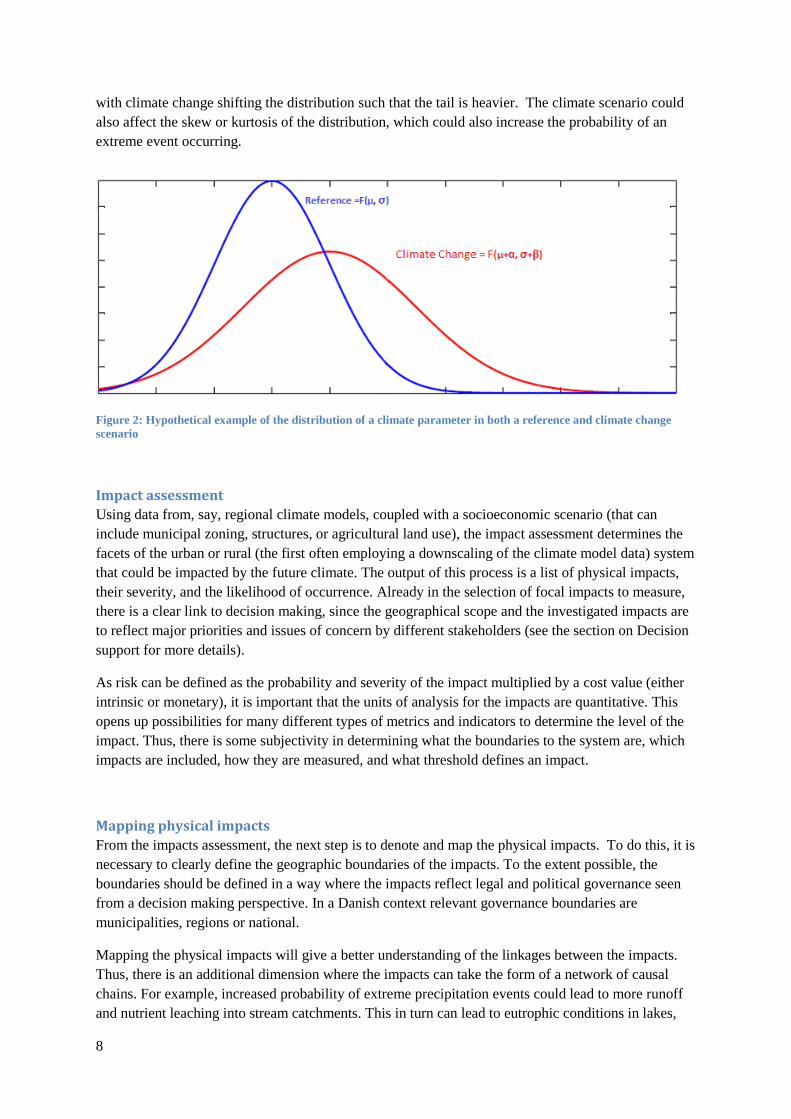
Often, it will be necessary to determine the probability distribution of climate parameters in order to
determine how climate change affects the probability of events with different levels of severity. In
Figure 2, we have a hypothetical physical climate parameter whose value is normally distributed with
a specific mean (µ) and standard deviation (σ). In this example, climate change causes the distribution
to change, with both an increase in the mean (µ+α) and standard deviation (σ+β). Thus, climate
change increases the probability of a more extreme event, because the distribution is shifted to the
right (increase in the parameter mean) and the distribution has heavier tails (increase in the parameter
standard deviation). For some parameters, the shape of the distribution would likely be single-tailed,
8
with climate change shifting the distribution such that the tail is heavier. The climate scenario could
also affect the skew or kurtosis of the distribution, which could also increase the probability of an
extreme event occurring.
Figure 2: Hypothetical example of the distribution of a climate parameter in both a reference and climate change
scenario
Impact assessment
Using data from, say, regional climate models, coupled with a socioeconomic scenario (that can
include municipal zoning, structures, or agricultural land use), the impact assessment determines the
facets of the urban or rural (the first often employing a downscaling of the climate model data) system
that could be impacted by the future climate. The output of this process is a list of physical impacts,
their severity, and the likelihood of occurrence. Already in the selection of focal impacts to measure,
there is a clear link to decision making, since the geographical scope and the investigated impacts are
to reflect major priorities and issues of concern by different stakeholders (see the section on Decision
support for more details).
As risk can be defined as the probability and severity of the impact multiplied by a cost value (either
intrinsic or monetary), it is important that the units of analysis for the impacts are quantitative. This
opens up possibilities for many different types of metrics and indicators to determine the level of the
impact. Thus, there is some subjectivity in determining what the boundaries to the system are, which
impacts are included, how they are measured, and what threshold defines an impact.
Mapping physical impacts
From the impacts assessment, the next step is to denote and map the physical impacts. To do this, it is
necessary to clearly define the geographic boundaries of the impacts. To the extent possible, the
boundaries should be defined in a way where the impacts reflect legal and political governance seen
from a decision making perspective. In a Danish context relevant governance boundaries are
municipalities, regions or national.
Mapping the physical impacts will give a better understanding of the linkages between the impacts.
Thus, there is an additional dimension where the impacts can take the form of a network of causal
chains. For example, increased probability of extreme precipitation events could lead to more runoff
and nutrient leaching into stream catchments. This in turn can lead to eutrophic conditions in lakes,

9
and consequently lead to loss of aquatic biodiversity. In urban areas, for example, power line damage
may increase the risk of fire which would lead to property damage.
For rural areas, mapping the physical impacts can be done within a Geographical Information System
(GIS), and dedicated spatially explicit agricultural and land cover models. Because topography,
hydrology, and pedology are spatially explicit information and as they are essential inputs to the
analysis models, it follows that the impacts will also be defined spatially. When modelling sediment
and nutrient flows, the scale of analysis will typically be a catchment or watershed.
The urban system can also be modelled using a GIS. As for rural areas this requires the application of
a combination of spatially explicit hydrological and land use/land cover models. In mapping the
physical impacts from flooding from extreme precipitation events of different levels of severity
(different return periods), hazard maps showing the extent of flooding from the individual
precipitation events are created using a pipe flow model and an surface flow model (such as MIKE
URBAN & FLOOD1, models used to simulate water drainage in sewer systems and related overland
flow). Combining the hazard map with a geographical representation showing the assets of interest
within the urban area will provide a detailed map of the expected physical damage categories.
Identifying the assets potentially affected is essential in performing the next step: risk and adaptation
cost assessment.
Risk and adaptation cost assessment
Decisions about climate change adaptation rely on technical information about the risks of climate
change compared with the costs of mitigating the risks through adaptation. Climate risk, as defined in
this report is the probability multiplied by the consequence of an event. The probability can be
expressed in terms of either a return time or an annual probability. For phenomena that are expected
to become increasingly likely, such as extreme precipitation, it may be more illuminating to plot this
in terms of annual probability, since return time assumes a constant probability of occurrence though
time. Moreover, annual probabilities are more conducive to this analysis, since the annual probability
is the multiplicand in the risk calculation.
The next step is to assess the various adaptation options in terms of their cost, and how well do they
perform in reducing the risk from extreme climate events. It is also important to note any other
potential benefits from specific actions, and as with the risks, whether or not a specific monetary
value can be assigned.
Not all costs are straightforward to monetize. For example, flooding can destroy homes and the cost
of this impact can be determined by the homes’ replacement values. The impacts on physical assets
are the easier to value since they are related to the market and a cost can be associated with handling
the damages. Climate change and extreme climate events can also impact human health. Health
impacts in terms of injuries and mortality are often represented by standard economic valuation
approaches in terms of the value of a statistical life (VSL) (Murphy and Topel, 2006), but it can be
argued that there are specific health impact aspects that are not fully represented by monetary values.
Thus it might be informative both to supply monetary and non-monetary information about health
impacts and injuries related to a climate extremes.
1 Hydrological models provided by DHI. http://www.dhisoftware.com/.

10
It is particularly difficult to provide information about the value of natural and historical heritage and
other values related to recreational areas, since these “assets” are not related to markets and cannot be
totally replaced if they negatively affected. There are a number of economic techniques that can be
used to estimate monetary value in these areas, but as with health impacts it can be argued that such
values do not fully represent the assets and monetary information should be supplemented with
physical descriptions. Hence, adaptation options that prevent these impacts will have a value that is
much more difficult to quantify specifically (parameter uncertainty).
Nevertheless, the comparison of the costs of adaptation versus the climate risks can avoid some
climate change impact valuation problems. For instance, it may be possible to identify adaptation
options that have a lower cost than what is included in the integrated assessment of climate risks,
considering that these risks only represent part of the climate change consequences. It can also be
argued that in some cases, it can be worth spending more on climate change adaptation than what is
included in a risk assessment, for example, if we adhere to the precautionary principle.
Decision support
The climate and socioeconomic projections, impact assessment, mapping and risk and adaptation
assessment finally feed into the last analytical step Decision Support, where the total “balance” of
evidence of expected climate change consequences is going to be balanced in relation to costs and
other impacts of implementing adaptation options. More formally, all impacts are here considered
jointly in a decision making framework, which can be thought of as an objective function for
measuring adaptation options, where the arguments in the function should reflect social perspectives
as well as various private stakeholder interests.
As previously emphasised in the Impact assessment section, the final analytical step on Decision
support has a lot of implications for previous analytical steps, since decision support is demanding
very specific information based on, what is relevant to stakeholders and society. It is therefore
recommended to organise an ongoing interaction between the decision support component and other
analytical steps right from the beginning of adaptation assessments. Examples of key feedbacks from
decision support to other analytical steps are:
Screening of vulnerabilities and selection of areas for in depth adaptation analysis.
Selection of focal climate impact areas to assess.
Consideration of values and measurement units for different climate impacts in relation to
physical assets, health, ecosystems, historical heritage etc.
Risk aversion attitudes.
Uncertainties.
Equity aspects.
A number of these aspects can be addressed in specific studies on preferences, perceptions, values,
and stakeholder priorities.
11
5. Danish Integrated Assessment System (DIAS) The generic analytical structure described above has been implemented in a Danish integrated
database and analytical tool. This system will be introduced below.
The scope of the system may briefly be described by highlighting a few key examples of policy
relevant questions that have guided the development. These include:
Which climate risks are particularly important to various stakeholders recognizing
preferences, risk attitudes, and the relationship to decision making.
Adaptation options related to flooding in urban areas including technical measures,
behaviour, and responses by the private sector.
Adaptation options in urban areas related to hot spells and health including urban structures
and health support to elderly people.
Adaptation options related to ecosystems e.g. in relation to agriculture and the Water
Framework Directive.
Critical infrastructure including harbours, bridges, and roads.
Agricultural investments e.g. related to husbandry.
Water conflicts related to groundwater demand.
Land use structure in agriculture and forestry given climate change impacts and adaptation.
Biodiversity impacts of changed temperature in freshwater systems, relationship to
agricultural land use, and other human systems.
Urban development, demands for nature conservation areas, and the relationship to
adaptation options in cities and the open land.
Despite differences in focus and modelling tools for studies related to different policy relevant
questions as those mentioned above, the Danish integrated assessment system (DIAS) for climate
adaptation studies has been developed in order to support different research groups and other experts
to share data and modelling results given the understanding, that the multidisciplinary character of the
work demands such a structured approach to collaboration.
The system at its present stage of development includes data on climate, land use, ground water
resources, soil types, special ecosystems, critical infrastructure, population, income, buildings,
historical heritage, infrastructure, traffic, industry, and social institutions in a GIS system for
Denmark. The variety of studies that can benefit from adapting a data and modelling framework as the
DIAS also need to be supported by different sector specific detailed models as for example climate
models, storm surge models, groundwater models, drainage system models, flood models, agricultural
crop models, ecosystem water models, and various cost and social impact assessment tools. These
models and analytical tools are available at Danish universities and other climate change centres of
excellence. DIAS draws on a subset of data developed by these institutions, and in itself constitute an
excellent platform for facilitating a sharing of data and study outputs and a possible framework, where
they can feed into the common GIS system for Denmark.
The DIAS structure is shown in Figure 3 below. It should be noticed that present elements included
reflect present data availability, and that the system will be further developed in the future.

12
Figure 3: Analytical structure and major elements of the DIAS
As is illustrated in Figure 3 DIAS is structured around five analytical elements. These are:
Climate data: Temperature, precipitation, wind, air pressure etc.
Land cover data: Land use activities, buildings, infrastructure, protected nature areas,
administrative units, elevation data etc.
Socioeconomic data: Population, income, employment, education, traffic, behaviour etc.
Thematic impact maps: Climate risks in relation to ecosystems, physical assets, humans,
society etc.
Results: Integrated information about climate risk and adaptation options.
These five columns represent a progression in the assessment moving from left to the right towards
the final conclusions on potential climate change adaptation options, which can be used in relation to
further decision support activities.
The emphasis of the assessment system is on different analysis tools as highlighted by the three
coloured columns in figure 3. The first group of analysis tools (yellow column) links climate
13
modelling data with land cover data. The tools here include various climate data downscaling
methods and models. The next step is to link climate specific land data and socioeconomic data,
which serve as input to assessments of climate change impacts. Climate impacts are assessed with
analytical tools like flood models, hydrological models, ecosystems models, agricultural models,
health models etc., and the output of these models in DIAS can be various physical impact maps. An
example of such an impact map is shown in Figure 4 which shows a flood map for the city of
Aarhus based on modelling performed by DHI in MIKE Urban and MIKE Flood surface and sub-
surface hydrological models.
The final step is to assess climate change risks and adaptation options based on the physical impacts
that are identified from the impact maps. There are many complicated issues related to preferences
and valuation of impacts involved in this step, and it is recommended that these issues are explicitly
addressed, when standard analytical approaches such as cost benefit analysis and /or Multi Criteria
Analysis (MCA) apply. Some of the complicated valuation issues in the Aarhus case are illustrated
in Figure 5. Figure 5 highlights that in the case of flooding risks in Aarhus, various physical, human
and historical values are at risk including building damages, health risks to children, and 1000 year
old churches. Risk attitudes and preferences matter a lot here in assessing adaptation options and
costs and should be considered specifically in the integrated assessment.

14
Figure 4: Flooding map of Aarhus during extreme rainfall with different return periods

15
Figure 5: Examples of complicated valuation areas in Aarhus
Numerous Frescos
Baroque Organ: Largest Church Organ in DK
Viking Museum:
Archaeological Site
Kindergarten:
Health Impacts
16
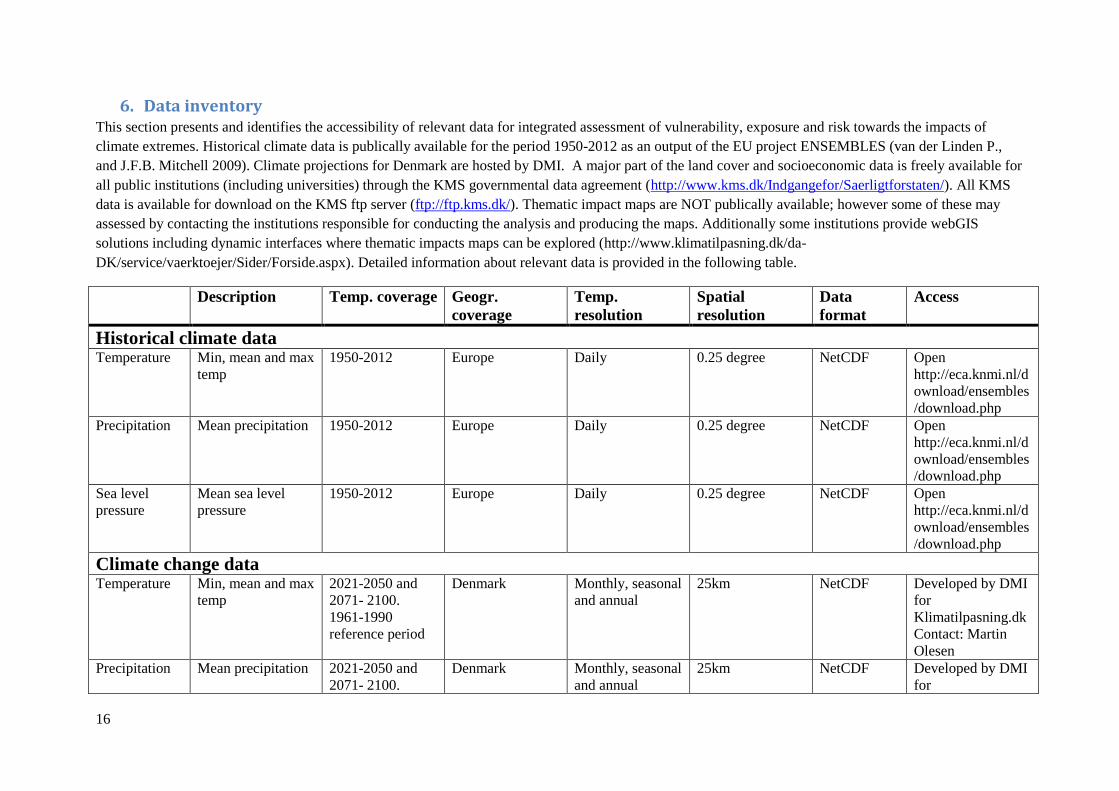
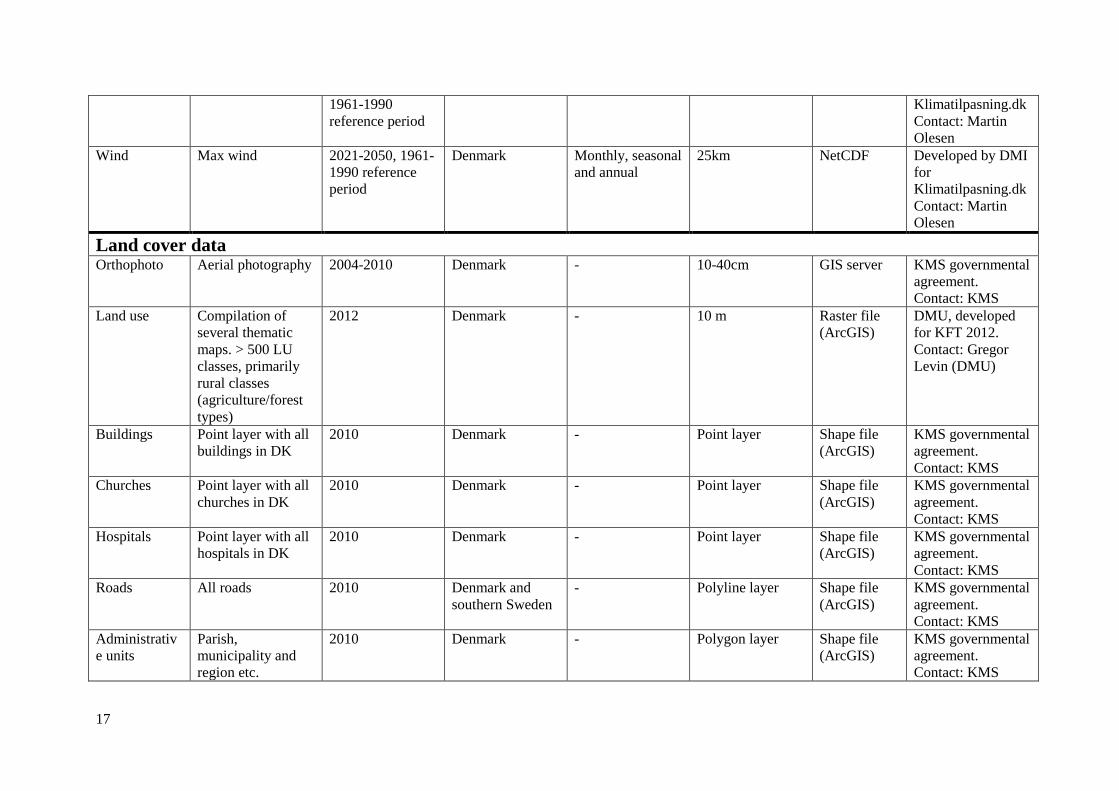
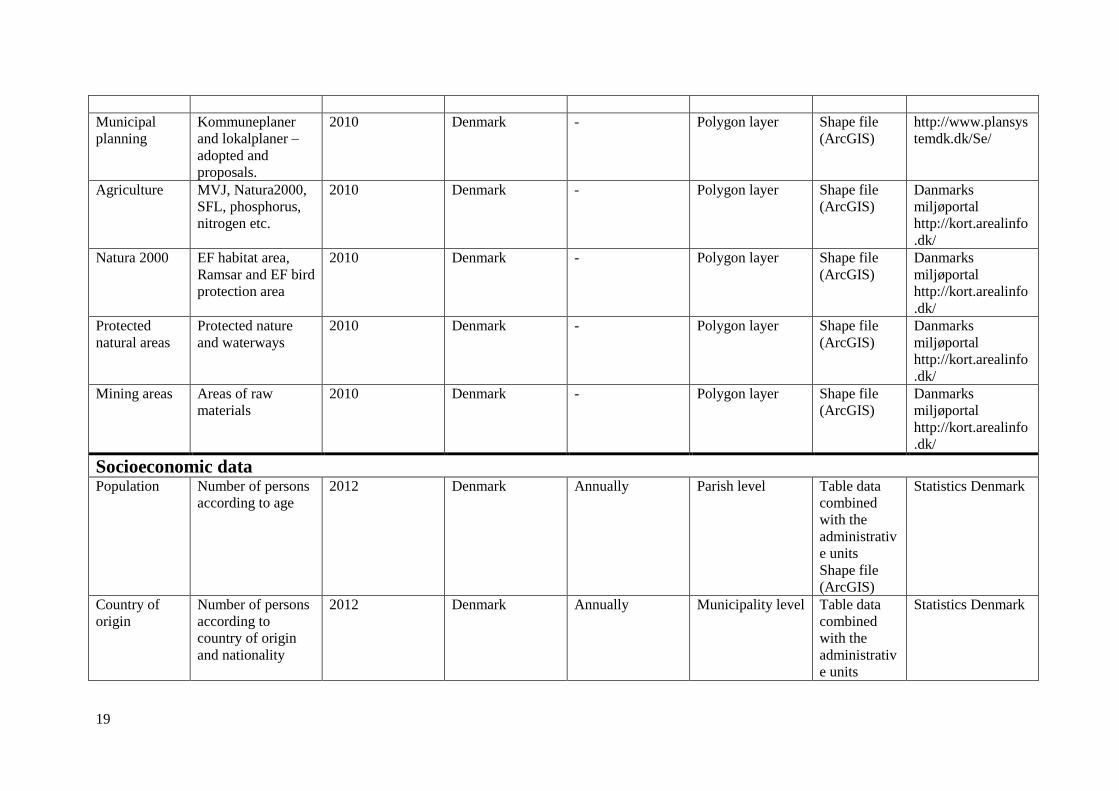
6. Data inventory This section presents and identifies the accessibility of relevant data for integrated assessment of vulnerability, exposure and risk towards the impacts of
climate extremes. Historical climate data is publically available for the period 1950-2012 as an output of the EU project ENSEMBLES (van der Linden P.,
and J.F.B. Mitchell 2009). Climate projections for Denmark are hosted by DMI. A major part of the land cover and socioeconomic data is freely available for
all public institutions (including universities) through the KMS governmental data agreement (http://www.kms.dk/Indgangefor/Saerligtforstaten/). All KMS
data is available for download on the KMS ftp server (ftp://ftp.kms.dk/). Thematic impact maps are NOT publically available; however some of these may
assessed by contacting the institutions responsible for conducting the analysis and producing the maps. Additionally some institutions provide webGIS
solutions including dynamic interfaces where thematic impacts maps can be explored (http://www.klimatilpasning.dk/da-
DK/service/vaerktoejer/Sider/Forside.aspx). Detailed information about relevant data is provided in the following table.
Description Temp. coverage Geogr.
coverage
Temp.
resolution
Spatial
resolution
Data
format
Access
Historical climate data Temperature Min, mean and max
temp
1950-2012 Europe Daily 0.25 degree NetCDF Open
http://eca.knmi.nl/d
ownload/ensembles
/download.php
Precipitation Mean precipitation 1950-2012 Europe Daily 0.25 degree NetCDF Open
http://eca.knmi.nl/d
ownload/ensembles
/download.php
Sea level
pressure
Mean sea level
pressure
1950-2012 Europe Daily 0.25 degree NetCDF Open
http://eca.knmi.nl/d
ownload/ensembles
/download.php
Climate change data Temperature Min, mean and max
temp
2021-2050 and
2071- 2100.
1961-1990
reference period
Denmark Monthly, seasonal
and annual
25km NetCDF Developed by DMI
for
Klimatilpasning.dk
Contact: Martin
Olesen
Precipitation Mean precipitation 2021-2050 and
2071- 2100.
Denmark Monthly, seasonal
and annual
25km NetCDF Developed by DMI
for
17
1961-1990
reference period
Klimatilpasning.dk
Contact: Martin
Olesen
Wind Max wind 2021-2050, 1961-
1990 reference
period
Denmark Monthly, seasonal
and annual
25km NetCDF Developed by DMI
for
Klimatilpasning.dk
Contact: Martin
Olesen
Land cover data Orthophoto Aerial photography 2004-2010 Denmark - 10-40cm GIS server KMS governmental
agreement.
Contact: KMS
Land use Compilation of
several thematic
maps. > 500 LU
classes, primarily
rural classes
(agriculture/forest
types)
2012 Denmark - 10 m Raster file
(ArcGIS)
DMU, developed
for KFT 2012.
Contact: Gregor
Levin (DMU)
Buildings Point layer with all
buildings in DK
2010 Denmark - Point layer Shape file
(ArcGIS)
KMS governmental
agreement.
Contact: KMS
Churches Point layer with all
churches in DK
2010 Denmark - Point layer Shape file
(ArcGIS)
KMS governmental
agreement.
Contact: KMS
Hospitals Point layer with all
hospitals in DK
2010 Denmark - Point layer Shape file
(ArcGIS)
KMS governmental
agreement.
Contact: KMS
Roads All roads 2010 Denmark and
southern Sweden
- Polyline layer Shape file
(ArcGIS)
KMS governmental
agreement.
Contact: KMS
Administrativ
e units
Parish,
municipality and
region etc.
2010 Denmark - Polygon layer Shape file
(ArcGIS)
KMS governmental
agreement.
Contact: KMS

18
Digital
elevation
model (DEM)
Digital Elevation
Model. Due to the
total data size
(109GB) the DEM
is divided into
multiple files (653).
2010 Denmark - 1.6 m Ascii (import
to ArcGis)
KMS governmental
agreement.
Contact: KMS
Soil type DJF data – 8 soil
types
Based on
mapping from
1975-1979
Denmark - Polygon layer Shape file
(ArcGIS)
Cost: 4000 kr.
Contact: Mogens
Humlekrog Greve,
DJF
Protected
areas
Includes both
nature, culture,
buildings etc.
2010 Denmark - Polygon layer Shape file
(ArcGIS)
Danmarks
miljøportal
http://kort.arealinfo
.dk/
Groundwater Areas of special
drinking water
interests
2010 Denmark - Polygon layer Shape file
(ArcGIS)
Danmarks
miljøportal
http://kort.arealinfo
.dk/
Nature and
wildlife
reserves
Wildlife reserves
established under
the Law on hunting
and wildlife
management in
order to protect and
nurture populations
of wild birds and
mammals
2010 Denmark - Polygon layer Shape file
(ArcGIS)
Danmarks
miljøportal
http://kort.arealinfo
.dk/
Soil
contamination
Areas where the
activities on the site
or activities in other
areas may have
been a source of
contamination on
the site
2010 Denmark - Polygon layer Shape file
(ArcGIS)
Danmarks
miljøportal
http://kort.arealinfo
.dk/
19
Municipal
planning
Kommuneplaner
and lokalplaner –
adopted and
proposals.
2010 Denmark - Polygon layer Shape file
(ArcGIS)
http://www.plansys
temdk.dk/Se/
Agriculture MVJ, Natura2000,
SFL, phosphorus,
nitrogen etc.
2010 Denmark - Polygon layer Shape file
(ArcGIS)
Danmarks
miljøportal
http://kort.arealinfo
.dk/
Natura 2000 EF habitat area,
Ramsar and EF bird
protection area
2010 Denmark - Polygon layer Shape file
(ArcGIS)
Danmarks
miljøportal
http://kort.arealinfo
.dk/
Protected
natural areas
Protected nature
and waterways
2010 Denmark - Polygon layer Shape file
(ArcGIS)
Danmarks
miljøportal
http://kort.arealinfo
.dk/
Mining areas Areas of raw
materials
2010 Denmark - Polygon layer Shape file
(ArcGIS)
Danmarks
miljøportal
http://kort.arealinfo
.dk/
Socioeconomic data Population Number of persons
according to age
2012 Denmark Annually Parish level Table data
combined
with the
administrativ
e units
Shape file
(ArcGIS)
Statistics Denmark
Country of
origin
Number of persons
according to
country of origin
and nationality
2012 Denmark Annually Municipality level Table data
combined
with the
administrativ
e units
Statistics Denmark

20
Shape file
(ArcGIS)
Life
expectancy
Average life
expectancy
2011 Denmark Annually Municipality level Table data
combined
with the
administrativ
e units
Shape file
(ArcGIS)
Statistics Denmark
Income Personal and family
income
2012 Denmark Annually Municipality level Table data
combined
with the
administrativ
e units
Shape file
(ArcGIS)
Statistics Denmark
Socioeconomi
c status
Employed,
unemployed,
retired etc.
2012 Denmark Annually Municipality level Table data
combined
with the
administrativ
e units
Shape file
(ArcGIS)
Statistics Denmark
Traffic data Avg. number of
cars passing
specific road
sections per day.
Updated annually
for most road
sections.
Denmark Annually Potentially all
public roads in
Denmark
Shape file
(ArcGIS)
Table data
added to the
road section
polyline
layer. This is
done using
the join tool
in GIS.
Data available for
all roads sections as
table data through
vejman.dk (the
Danish Road
directorate). Most
municipalities have
data as a GIS layer
and it may be
possible to gain
access through the
individual

21
municipalities.
Thematic impact maps Flooding
maps
Surface water
levels in relation to
extreme rainfall
events with various
return periods
Return periods: 5-
1000year events.
City of Aarhus - 10 meter Raster data Prepared by DHI
for DSF project.
Contact: Henrik
Madsen, DHI
Flooding
maps
Surface water
levels in relation to
extreme rainfall
events with various
return periods.
The various
scenarios are
presented in the
Climate Adaptation
plan of the
municipality of
Copenhagen (2012)
Return periods:
20 and 100 year
return period and
100 year return
period in 2100
(with climate
change). More
return periods
should be
available.
City of
Copenhagen
- 2 meter Raster data Prepared by COWI
for the
Municipality of
Copenhagen.
Contact: Jan
Rasmussen,
municipality of
Copenhagen
Climate
groundwater
maps
Climate effects on
hydrology and
groundwater levels
Changes in
groundwater
levels and
groundwater
recharge in 2021-
2050 as compared
to the reference
period 1961-1990
Denmark - 500 meter Raster data Prepared by GEUS
for KFT. Contact:
Louise Grøndahl,
Naturstyrelsen -
Miljøministeriet
22
7. Vulnerability and exposure to climate change As pointed out in previous sections, climate change vulnerability indicators can be used as a screening
tool for selecting areas that should undergo a more detailed assessment of climate risks and adaptation
options (section 3 and 4). Vulnerability is treated as a key indicator of particular high risk areas, and
we have argued that the vulnerability assessment is a rather general entrance to the more detailed risk
and adaptation analysis, which is outlined in more detail in section 4.
In the following our focus in the choice of vulnerability indicators will be how extreme events could
influence society. This is in spite of the most commonly used denominators of climate change, which
are the recent and expected future change in global average air temperature and annual mean
precipitation. However, although changes in the average climate are seemingly much easier and more
certain to project as compared to the changes in probability, distribution and severity of extreme
events, long term changes in average biophysical/climatic parameters are often not very important in
terms of asserting the impacts of climate change on the anthropogenic and natural environments.
Rather in a climate impacts assessment and or vulnerability study, changes in climate variability and
the associated occurrences of extreme events becomes much more important since the human and
natural environment (which more often than not are also affected by human settlements, agriculture
etc.) are often not very resilient towards the impacts of extreme events. The degree of resilience
towards the impacts of extremes is site specific property and varies substantially in time and space.
This must be considered when assessing potential impacts of climate extremes.
The severity of a climate extreme is frequently not solely related to the extremes themselves but is
rather the consequence of a combination of the extreme event and the exposure and vulnerability of
the affected area. Exposure can here be defined as the presence of people, ecosystem services and
resources, infrastructure or economic, social or cultural assets in the area potentially affected.
Vulnerability refers to predisposition to be adversely affected (Cardona & Van Aalst 2012).
In the following, different types of key vulnerability indicators in relation to the impacts of climate
extremes will be highlighted.
Vulnerability indicators
Important vulnerability indicators in relation to impact assessment of climate extremes can be divided
into the following types: Physical indicators, social/health indicators, environmental and economic
indicators. The vulnerability indicators emphasized in this section should not be interpreted as being a
complete list useful for measuring vulnerability towards any thinkable climate extreme, however they
represent the most important ones in a Danish context, and primarily in relation to flooding, heat
waves and storm surges.
It is important to recognize, that individual vulnerability indicators are not equally important and local
expert knowledge is often needed in order to evaluate the significance of each individual indicator
based on the local/regional characteristics of the case area. In some cases, it might also be valuable to
normalize the different data values to create a single vulnerability index in order to identify
vulnerability hot-spots. Different methods are suitable for combining information from several criteria
to create a single index including Multi Criteria Analysis (MCA)(Alexander 2011). MCA enables the
inclusion and quantitative comparison of different types of criteria, e.g. number of elders in an area
23
may be compared with the total length of the road network or traffic loads to create a final index. As
the impacts of climate change are expected to vary significantly in different regions the included
vulnerability data should preferably have a geographic dimension as it enables spatial analysis and
comparison with for instance downscaled projections of climate variables or flood simulation data. It
should here be mentioned that the accessibility to data with a geographical dimension is often limited
(physical or economic access) which can be a severe constraint to performing a comprehensive
vulnerability analysis.
Physical indicators
The physical dimension deals with the direct and indirect effects of the physical impacts of a climate
extreme. In relation to urban flooding in Denmark this includes damage to buildings, roads, railways,
critical infrastructure (government buildings, hospitals, energy production and supply units,
communication infrastructure etc.) and tourist relevant buildings. Direct effects can be defined as the
actual damage to any given asset while indirect effects are the secondary consequences of the physical
impact. Examples of secondary effect include the “costs” related to the extra time needed to evacuate
people, or for people to get to work, when roads are flooded. If tourist relevant buildings, e.g. the
Little Mermaid in Copenhagen, is affected the secondary effects includes the loss of income as a
consequence of less tourists visiting in the aftermath of a climate extreme.
Useful physical indicators include buildings, roads, railways, government buildings, tourist related
buildings, historical buildings, critical infrastructure, nursing homes, kinder gardens, schools etc.
Social/Health indicators
The social dimension considers specific population groups who differ with respect to age, income,
employment conditions, education level, gender or origin. The different social indicators are included
in order to describe the level of human welfare in a given area and can potentially express the level of
social integration and mental and physical health within a given area. In relation to extreme event
impact assessments, in particular flooding and heat waves, the included indicators may be used as
proxies for the fragility of an area, and are therefore useful to include in a vulnerability study.
Vulnerable population groups include elders and children, due to the weakness of their physical and
sometimes mental condition. This is the case both in relation to flooding and heat waves.
Employment rate is another social indicator which may contain information on the vulnerability of an
area towards the impacts of a climate extreme, in particular urban flooding. Unemployed groups often
have fewer savings and lower access to financial support to buffer them against the impact of a
climate extreme. Consequently employment is correlated with less vulnerable conditions.
Access to services and funding in a pre- and post-disaster phase may be influenced by cultural and
language barriers and points to the inclusion of population origin in the social vulnerability
dimension. In this case native speakers are considered to be less vulnerable as compared to
immigrants (Alexander 2011).
In relation to health impacts, floods are usually associated with an increased risk of infections and
direct contact with contaminated water (cleaning up of flooded basements, roads etc.) is a common
source of infection in relation to urban flooding events (Alexander 2011).

24
Environmental indicators
The environmental dimension deals with the vulnerability and fragility of the biophysical systems and
their functions and services for humans and biodiversity.
Rivers, lakes, wetlands, forests and other pristine natural areas are rich in species and provide
important services for human consumption and as recreational areas, especially in relation to
agriculture and water supply. Ecosystem functioning may be affected severely by climate extremes,
both in relation to their role as habitat for a wide range of species and as a provider of services for
human wellbeing. Common impacts of climate extremes on ecosystems in Denmark include forest
damage, habitat loss/fragmentation, river overflows, coastal and inland erosion, soil loss, increased
flow of nutrients to natural waterways, increased occurrences of eutrophication, general water quality
impacts. Relevant examples of environmental vulnerability indicators include information on the
location and functioning of rivers, lakes, wetlands, forests and other natural areas.
Economic indicators
The economic dimension deals with the cost related to the potential damage and/or the disruption of
the systems productive capacity as a result of the impact of a climate extreme. The first category
covers the costs of repairing/rebuilding the affected areas and infrastructure, and includes repairing of
roads, buildings (residential and industry) and other infrastructure, and replacing damaged or lost
assets. The second category is related to the degree to which the systems productive capacity is
affected by the climate extreme. This includes the cost of lost working time due to traffic delays
where roads are flooded, lost working time where parents have to stay at home to watch their children
in areas where kindergartens/schools are affected and the loss of production interruption where
industry and agriculture are affected.
Useful indicators in relation to the economic dimension include the location of residential and
commercial buildings, public service facilities (e.g. hospitals, kindergartens, nursing homes etc.),
building of historical or cultural value, industry, agriculture, roads and other critical infrastructure.
Furthermore information on road specific traffic volumes, number of children in kindergartens, area
specific income and industry turnover can be useful in assessing the potential disruption of an areas
productive capacity and/or monetary loss related to the impact of a climate extreme.

25
8. Case example - Integrated impact assessment of flooding from
extreme rainfall in Aarhus
Introduction
The objective of the following case example is to demonstrate the usefulness of the methodology
implemented by DIAS for integrated assessment of climate change exposure, vulnerability, impacts
and adaptation. For this purpose an integrated assessment of the impacts of urban flooding from
extreme rainfall was carried out for the city of Aarhus. Aarhus was chosen to serve as a case area as it
is one of the focal areas of DSF projects CRES and Risk Change, hereby enabling us easy access to
the data and models required to complete a detailed impact assessment analysis.
Scope
The impacts considered in the assessment are not to be considered exhaustive, however, they
represent some of the major impact areas, both in relation to direct monetary costs and risk aversion
and preferences in relation to urban flooding. Considering the latter is important as many of the
impacts may not be straightforward to calculate in terms on monetary values as they depend on the
risk aversion attitudes of various stakeholders which may vary considerably between individuals.
Examples of impact areas where risk aversion attitudes are of major importance include health
impacts, environmental impacts and the loss of irreplaceable cultural, historical, religious and
symbolic assets.
The impacts considered in the analysis include the following:
Infrastructure
o Residential buildings
o Industrial and commercial buildings
o Basements
o Roads
Transportation
o Delays
o Trips avoided
Health
o Injuries and deaths
o illness
Other
o Historical and cultural values
o Symbolic and religious values
Impact assessment
As a consequence of the geographical characteristics of the impacts of flooding from an extreme
rainfall event (flooding is obviously not evenly distributed geographically but varies as a result of
topography, water collection systems etc.) the major part of the impact analysis was carried out using
a GIS (Geographic Information System). A major challenge in relation to this is the collection of and

26
access to relevant datasets with a geographic dimension. The utilized datasets for the current analysis
include:
Climate data
Precipitation data
Land cover data Buildings
Basements
Roads
Socioeconomic data
Traffic data
Google maps travel time estimates
Population
o Age distribution (parish data)
Other Churches
Museums
Impact assessment procedure
Infrastructure In order to estimate the direct monetary impact of flooding from extreme rainfall on infrastructure
(residential, industrial and commercial buildings, basements and roads) flood hazard maps showing
the maximum surface water level for extreme precipitation events with different return periods (from
5 year-1000 year return periods) was combined with a unit cost for each asset impacted by flooding.
The extent of flooding for the different precipitation events was calculated using the MIKE
Urban/MIKE Flood software package (MIKE by DHI). In order to calculate the number of flooded
buildings for the different return periods an impact model was created in Model builder in ArcGIS
overlaying the flood hazard map with information on the location of the different types of
infrastructure included in the impact analysis.
For the damage cost estimate of buildings a unit cost of 500,000 DKK was multiplied with the total
number of buildings inundated by more than 20cm of surface water (Zhou et al. 2012).
For the impact assessment of flooded buildings flooding damage costs for basements was calculated
on the basis of flood hazard maps combined with a unit cost and a water level threshold for where the
unit cost applies. For basements a unit cost of 25,000 DKK was applied for all basements located in
areas with > 0.3 cm of surface water (Zhou et al. 2012).
Road damage during flooding from extreme rainfall was calculated using a similar approach as for
buildings and basements. A GIS model was developed to calculate the length of road network
inundated by > 20 cm of surface water. A unit cost of 3,400,000 DKK was applied to account for
repairing/cleaning 1 km of flooded road. The unit cost is based on the findings of the WEATHER
project (Doll & Sieber 2011) which is funded under the 7th framework program of the European
Commission. From the synthesis of literature findings from this project an asset damage cost of
27
450.336 €/km was estimated. This corresponds to unit cost of approx. 3,400,000 Dkk per km of
flooded road.
Traffic Flooding impacts on traffic is divided into two distinctive categories: Traffic delays and avoided
trips due to roads being inundated.
To assess traffic delays, roads inundated with more than 15 cm of water were mapped. In order to get
an estimate of the total traffic volumes on an average working day, traffic data for the major roads
within the city of Aarhus was included in the analysis. Combining the flood hazard maps with the
road specific traffic data allows for an estimate of the total amount of traffic affected by the inundated
roads. The actual delay due to flooding is then calculated based on the assumption that the total delay
in Aarhus is equal to the summarized difference in travel time (and choosing alternate routes) between
travel times at rush hour and the travel times at times with no congestion. Thus the extra travel time
(delay) is calculated by multiplying the averaged difference in travel time for the major routes going
in and out of Aarhus by the number of persons travelling to and from Aarhus on an average day.
Google Maps was used to estimate the daily variation in travel time between the outer ring road and
the center of Aarhus for every hour of the day. Furthermore, roads are assumed to be flooded for an
entire day. The time period in which the roads are flooded is assumed constant and does not vary with
the severity (return period) of the extreme precipitation event.
In order to calculate the trips avoided due to several roads being inundated it is assumed that the
number of vehicles traveling is reduced by the proportion of residential areas that are flooded during a
given extreme event. In other words, if there is flooding at a residence, we assume that the inhabitants
will not travel. This corresponds to a 5 % - 29 % decrease in traffic for extreme precipitation events
with return periods of 5-1000 year. For the current cost assessment roads are considered flooded for
24hrs (one day) and the Value Of Time (VOT) applied is 80 DKK/hour. It is further assumed than
none of the people having to avoid travelling are able to perform their work tasks from home. As a
result there is a cost of 600 DKK ((7.5 hours * 80 DKK/hour * 1 day (duration of flood)) associated
with every person having to stay at home due to flooding.
Health Health impacts are divided into two distinct impact categories; physical health impacts (injuries and
deaths) and illness related impacts.
The procedure for estimating the physical health impacts from a flooding event are adapted from the
methodology developed by Penning-Rowsell et al. 2005. This approach employs the water depth,
maximum velocity, anticipated debris loads, housing type, warning systems and location of vulnerable
population in order to calculate the impact of flooding. In relation to flooding from extreme
precipitation vulnerable population groups include children (< 5 years of age) and elderly (above 70
years of age). The cost of relative disutility as presented in table 1 are used to estimate the total
monetary impact of flooding on physical health conditions. From table 1 it is seen that fatalities
related to extreme precipitation are associated with a cost of 41,760,000 DKK.

28
Severity Fraction of VSL
(Value of Statistical
Life)
Cost/injury (DKK) Share of physical
impact severity in
Aarhus case
Minor 0,2 % 83,520 50 %
Moderate 1,6 % 647,280 35 %
Serious 5,8 % 2,401,200 13 %
Severe 18,8 % 7,830,000 3 %
Critical 16,3 % 31,842,000 0 %
Fatal 100 % 41,760,000 0 % Table 1: Cost of relative disutility by injury severity level. Adopted from Murphy & Topel 2006
Illness related health impacts are calculated on the basis of the estimated number of persons
exposed to surface water during flooding from extreme precipitation. In combining the calculated
number of flooded basements (GIS overlay model) with a factor of 1.7 person/basement it is
possible to estimate the total number of persons exposed to flooding during extreme precipitation
events with varying severity (Zhou et al. 2012). The total number of exposed persons is then
combined with a unit cost of 6687 DKK in order to estimate to total monetary impact of flooding on
illness related health conditions.
Damage category Unit cost Surface water threshold (cm)
Buildings 500.000 DKK/house 20
Basements 25.000 DKK/basement 0.3
Roads 3.400.000 DKK/km 20
Traffic 80 DKK/hour 15
Health – physical 987.624 DKK/injury see Penning-Rowsell et al 2005
Health – Illness 6687 DKK/exposed person 0.3 Table 2: Damage categories, unit costs and surface water threshold applied for the economic assessment of flooding
damage costs from extreme precipitation.
Other
It is particularly difficult to provide information on the values of cultural, religious and historical
heritage and other values related to recreational areas, since these “assets” are not related to markets
and cannot be totally replaced if they are negatively affected. Aarhus the Cathedral is an example of
such an asset. The monetary value of the numerous frescos (1300-1500) and the largest Baroque
church organ in Denmark, both situated within the cathedral, may be very difficult to estimate and
different people may have very different opinions (risk aversion attitudes) towards the importance of
preserving such assets. Therefore in the current analysis the economic impacts of flooding on these
assets have NOT been quantified. However, it is noticeable that the cathedral is situated in an area
which is going to be inundated during floods with a return period of > 20 years (see Figure 4). See
the illustration below for information on other assets in Aarhus which may be difficult to valuate.

29
Result
Infrastructure impacts
Figure 6 and 7 show the results of the impact analysis of flooding from extreme precipitation on
buildings and basements in Aarhus. Buildings within the Aarhus city area (residential, commercial
and industrial) are represented by a red colour and showing the actual extent of each building (left
map in Figure 6). The left map in Figure 6 also depicts the flooding extent and maximum surface
water level (m) during an extreme precipitation event with a return period of 100 years. The
maximum surface water level increases with the darkness of the blue colour and various from < 1cm
to above 5m. The right map in Figure 6 shows the buildings which are going to be flooded by more
than 20 cm of surface water during an extreme precipitation event with a 100 year return period.
Figure 7 show the total number of buildings and basements flooded during extreme precipitation
events with varying severity. The assessment is performed for flooding from extreme precipitation
with return periods of 5-1000 years. The corresponding numbers of building and basements which can
be expected to be affected by flooding are 216-650 buildings and 689-1923 basements.
Figure 6: Flooded buildings in Aarhus during extreme precipitation with a return period of 100 years.

30
Figure 7: Number of buildings and basements flooded due to flooding from extreme precipitation events with various
return periods.
Figure 8 and Figure 9 present the results of the analysis of the flooding impacts on roads. Figure 8
(left map) shows the location of major roads within the Aarhus city centre area. The modelled
maximum flood extent and surface water depth during a precipitation event with a 100 year return
period is overlaid the road layer and base map. On the right map in Figure 8 the road sections which
are expected to be flooded with more than 20 cm of surface water are highlighted in red. From Figure
9 it is seen that 0,7 km – 4,5 km of road is expected to be flooded as a consequence of extreme
precipitation events with return periods of 5-1000 years.
Figure 8: Road sections flooded during a 100 year extreme rainfall event.
216 326
453
650 689
985
1452
1923
0
500
1000
1500
2000
2500
5 20 100 1000
Return period (years)
Flooded buildings
Flooded basements

31
Figure 9: Road sections flooded due to flooding from extreme precipitation events with various return periods.
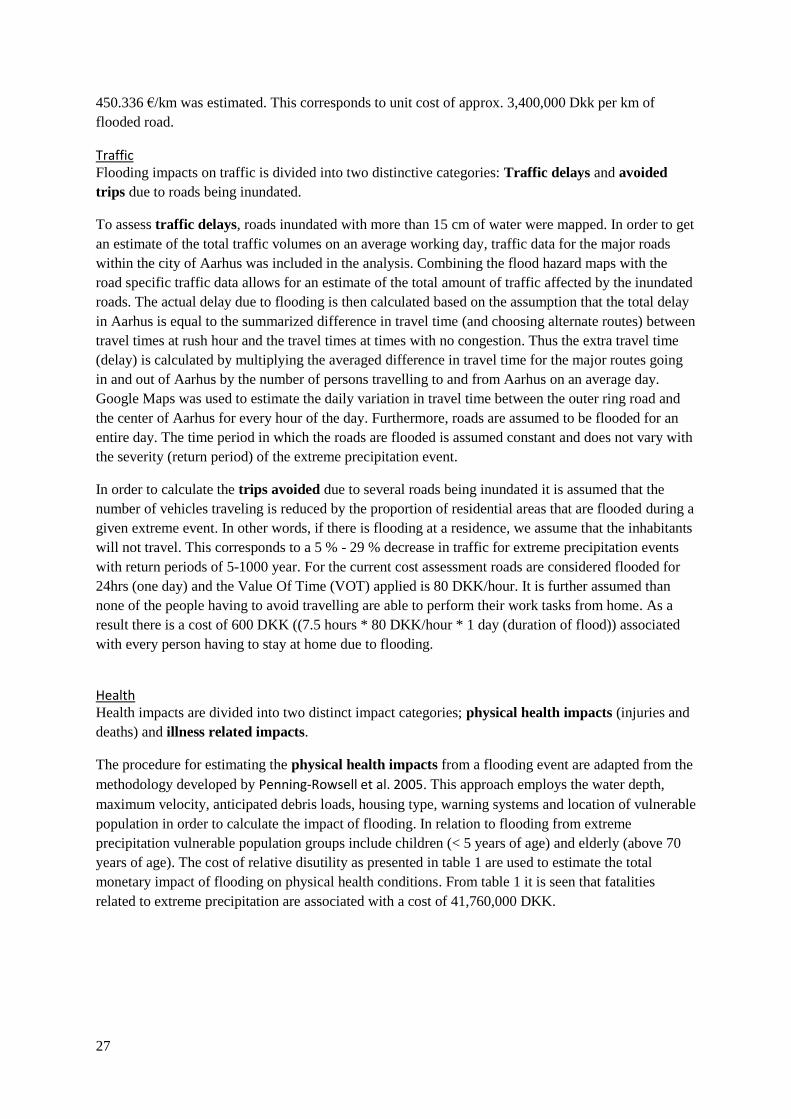
Traffic impacts
The results of the impact assessment of flooding on traffic are highlighted in Figure 10. The impact is
divided into two distinctive categories; traffic delays and lost working time due to avoided trips. The
former refers to the extra time needed to transport from A to B due to additional congestion and/or
having to select a non-optimal route while the latter considers the cost (time loss) of not being able to
perform the normal work tasks. The results of the analysis indicate that the cost of lost working time
is far greater than the cost of traffic delays. From Figure 10 it is seen that the impacts of flooding from
extreme precipitation on traffic delays and lost working time amounts to 31.000-23.000 hours and
128.000-473.000 hours respectively. Furthermore it is seen that the cost of lost working time becomes
more important than traffic delays as the severity of the extreme event increases (cost of delay
decreases with increasing return period and vice versa for lost working time). However, this is not
surprisingly as the total travel time (and traffic), and therefore also the potential traffic delay,
decreases as the flood extent increases. Notice that the share of trips avoided due to flooding is
considered equal to the share of the residential area affected by flooding.
0.7
1.6
2.4
4.5
0
1
2
3
4
5
5 20 100 1000
Km
Return period (years)
Flooded roads
32
Figure 10: Traffic impacts of flooding from extreme precipitation with various return periods.
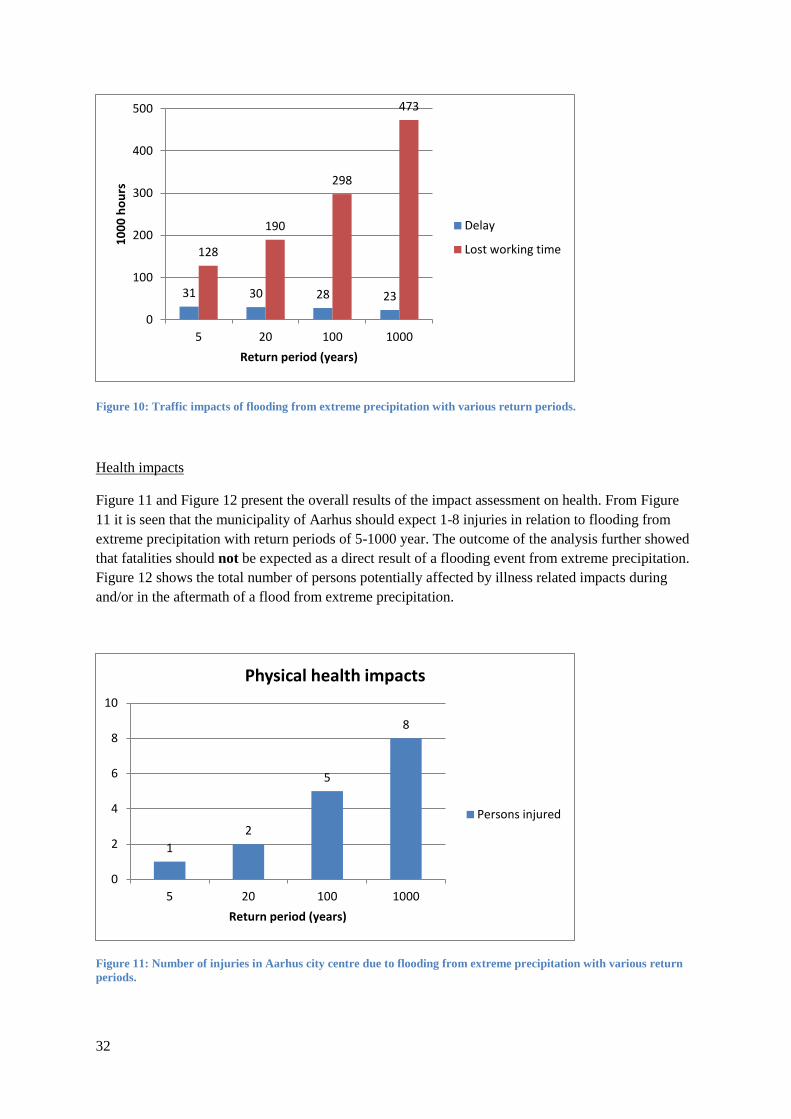
Health impacts
Figure 11 and Figure 12 present the overall results of the impact assessment on health. From Figure
11 it is seen that the municipality of Aarhus should expect 1-8 injuries in relation to flooding from
extreme precipitation with return periods of 5-1000 year. The outcome of the analysis further showed
that fatalities should not be expected as a direct result of a flooding event from extreme precipitation.
Figure 12 shows the total number of persons potentially affected by illness related impacts during
and/or in the aftermath of a flood from extreme precipitation.
Figure 11: Number of injuries in Aarhus city centre due to flooding from extreme precipitation with various return
periods.
31 30 28 23
128
190
298
473
0
100
200
300
400
500
5 20 100 1000
10
00
ho
urs
Return period (years)
Delay
Lost working time
1
2
5
8
0
2
4
6
8
10
5 20 100 1000
Return period (years)
Physical health impacts
Persons injured

33
Figure 12: Number of persons exposed to surface water from flooding in Aarhus city centre during extreme
precipitation events with various return periods.
Overall results of the integrated assessment
The result of the economic dimension of the integrated impact assessment is presented in Figure 13,
showing the cost summary. From here it is seen that the largest costs of flooding are related to those
of repairing buildings and replacing lost or broken assets within buildings. Road damage and the cost
of lost working time were likewise found to be of importance in relation to urban flooding in Aarhus.
On the other hand the cost of health impacts and traffic delays were found to be of minor importance
from an economic point of view. From the outcome integrated impact assessment it can be seen that
the total cost of flooding from extreme precipitation in Aarhus city centre amounts to 150 – 460
million DKK dependent on the severity of the extreme precipitation event. It should here be noticed
that risk aversion factors and various stakeholder preferences have not been included in determining
the cost of flooding for the different impact areas. The cost summary as presented above rely solely
on simple calculations of unit costs (as found in the literature) and the modelled severity of flooding
from extreme precipitation events with varying severity. Considering various stakeholder preferences
may potentially alter the importance of the different impact categories significantly.
1288
1842
2715
3596
0
1000
2000
3000
4000
5 20 100 1000
Return period (years)
Illness related health impacts
Exposed population

34
Figure 13: Cost summary – Impacts of flooding in Aarhus city centre from extreme precipitation with return periods
of 5-1000 years.
kr-
kr100,000,000
kr200,000,000
kr300,000,000
kr400,000,000
kr500,000,000
5 10 20 50 100 200 500 1000
Return period (years)
Impacts of flooding from extreme precipitation - Aarhus city centre
Traffic - delay
Health
Roads
Traffic - unable to work
Basements
Buildings
35
9. Conclusions and perspectives In this report we provide recommendations about how more consistent studies and data can be
provided based on available modelling tools and data for integrated assessment of climate change
risks and adaptation options. It is concluded that integrated assessments within this area requires the
use of a wide range of data and models in order to cover the full chain of elements including climate
modelling, impact, risks, costs, social issues, and decision making. As an outcome of this activity a
comprehensive data and modelling tool named Danish Integrated Assessment System (DIAS) has
been developed, this may be used by researchers within the field.
DIAS has been implemented and tested in a case study on urban flooding caused by extreme
precipitation in Aarhus, and this study highlights the usefulness of integrating data, models, and
methods from several disciplines into a common framework. DIAS is an attempt to describe such a
framework with regards to integrated analysis of climate impacts and adaptation.
The final product of the DTU KFT project “Tool for Vulnerability analysis” is NOT a user friendly
Climate Adaptation tool ready for various types of analysis that may directly be used by decision
makers and consultant on their own. Rather developed methodology and collected/available data can
serve as a starting point for case specific analyses. For this reason alone this work should very much
be viewed as an attempt to coordinate research, data and models outputs between different research
institutes from various disciplines.
It is unquestionable that there is a future need to integrate information for areas not yet included, and
it is very likely that such efforts will depend on research projects conducted in different climate
change adaptation areas and sectors in Denmark.
36
10. References Alexander, D., 2011. Methods for the Improvement of Vulnerability Assessment in Europe -
Handbook of Vulnerability Assessment in Europe.
Cardona, O. & Van Aalst, M., 2012. IPCC SREX Chapter 2: Determinants of Risk - Exposure and Vulnerability.
Doll, C. & Sieber, N., 2011. Weather - Assessment of Impacts on Transport Systems and Hazards for European Regions: Deliverable 2 - Transport Sector Vulnerability - Annex 3 Vulnerability Assessment for Road Transport,
Intergovernmental Panel on Climate Change. Working Group II., 2007. Climate Change 2007 : impacts, adaptation and vulnerability : working group II contribution to the Fourth Assessment Report of the IPCC, Cambridge: Cambridge University Press.
Intergovernmental Panel on Climate Change., Working Group 3, 2000. Special Report on Emission Scenarios (SRES).
Murphy, K.M. & Topel, R.H., 2006. The Value of Health and Longevity. Journal of Political Economy, 114(5), pp.871–904.
Penning-Rowsell, E. et al., 2005. Estimating injury and loss of life in Floods: A Deterministic Framework. Natural Hazards, 2005(36), pp.43–64.
van der Linden P. and J.F.B. Mitchell (eds.) 2009: ENSEMBLES: Climate Change and its Impacts: Summary of research and results from the ENSEMBLES project. Met Office Hadley Centre, FitzRoy Road, Exeter EX1 3PB, UK. 160pp.
Zhou, Q. et al., 2012. Framework for economic pluvial flood risk assessment considering climate change effects and adaptation benefits. Journal of Hydrology, 414-415, pp.539–549.
This report provides a short introduction to a methodological and modelling framework that can be used to assess climate risks and adaptation options. The framework has been developed in a Danish context as part of an on-going collaboration between Danish universities and other research institu-tions in research projects as well as in the context of the Coordination Unit for Danish Research in Climate Change Adaptation (KFT).
A major focus is how integrated assessments of climate change adaptation related to decision mak-ing can be structured and established through linking of data, modelling tools and conceptual models from various disciplines including climatology, ecology, hydrology, agricultures sciences, energy systems, urban systems, economics, sociology, etc.. Obviously, it is not possible to be comprehensive within such a broad field, and hence the present manuscript aims at providing an overview of link-ages and analytical structures that are particularly illustrating related to specific case studies in the urban and rural areas.
ISBN 978-87-92706-86-7
DTU Management Engineering
Department of Management Engineering
Technical University of Denmark
Produktionstorvet
Building 424
DK-2800 Kongens Lyngby
Denmark
Tel. +45 45 25 48 00
Fax +45 45 93 34 35
www.man.dtu.dk