methodologies to measure direct and indirect land … · methodologies to measure direct and...
TRANSCRIPT

“Quantifying and managing land use effects of bioenergy”
www.iconebrasil.org.br
Campinas, Sept, 19 2011
Marcelo Moreira ICONE
Methodologies to measure direct and indirect land
use effects of sugarcane bioethanol

The evolution of land use data and
modeling
*
*
Non GIS
GIS
Merged
Crop specific:
production; price; cost…
Suitability
Land cover
Legal Restrictions
Integrated land availability dataset
Deforestation rate
Amazon, Cerrado, Mata Atlântica…
Agricultural-economic model
Land use model
Substitution Matrix
(Allocation methodology)
Conversion of natural vegetation
“Land use post-deforestation” Explained expansion
and competition effects
(LUC model)
… Bovine prod systems
Pasture data

Improving GIS database and models:
The BLUM model

Brazilian Biomes and BLUM Regions
AM
MT
PA
MS
RS
TO
GO
MA
PI
SC
PR
SP
MG
BA
RO
APAP
CERNPB
PEAL
SE
ES
RJ
AC
AM
MT
PA
MS
RS
TO
GO
MA
PI
SC
PR
SP
MG
BA
RO
APRR
CERNPB
PEAL
SE
ES
RJ
AC
Amazon Forest
Atlantic
ForestSavanna
Steppe
Pantanal wetland
South Grassland

Structure of the Supply and Demand Section
Source: ICONE.
Domestic
consumption
Demand
Supply
Price
Costs
Expected
return
Net exports
Final
stocks
Production
Initial
stocks
Yields
Area (t-1)
Exogenous
variable Endogenous
variable
Exogenous macroeconomic data
- Population;
- World and national GDP;
- World oil price and domestic gasoline price;
- Exchange rate;
- Inflation rate;
- Fertilizer price index;
- Vehicle fleet.

Land Supply Curve and Elasticities
Agric. Land
Average profitability
• The share of total area that is dedicated to agricultural production follows a function such as:
Al
rllt
Tlt lt
l
Am kr
A
Al
lt rllt
Tlt lt
l
Am kr
A
01 lt l
Tlt
l
A AA
Where:
k is a parameter to be defined, rt is the average revenue of the region, ε is the land supply elasticity.
The parameter αlt is positive, higher or lower than one and is defined in each t.
Total area used for Agriculture is defined by the Agland elasticity (scale effect)

,T
ilt lt ilt ilt ilta A m r s r r
Share of agricultural land that is dedicated to one product is defined by own return and (negatively) by the return of the
other activities
• The area of each i activity in region l and time t (ailt) is defined as
, ,
,li
l i l lt ilt ilt iltlt ilt iltr
lt ilt l lt ilt ilt ilt ilt
m r s r rr r r
r r m r r s r r
, ,
,lj
jlt jltl i l lt ilt ilt iltltr
lt jlt l lt jlt ilt ilt ilt
r rm r s r rr
r r m r r s r r
Cross elasticities
Own elasticities
Scale Competition
Competition and TOTAL elasticities
,ilt ilt ilts f r r

Evidences: GIS inputs for
economic models

Example of Sugarcane Direct Substitution:
Remote Sensing
Source: CANASAT/INPE, published in Nassar, A.M., Rudorff, B. F. T., Antoniazzi, L. B., Aguiar, D. A., Bacchi, M. R. P. and Adami, M, 2008. Prospects of the
Sugarcane Expansion in Brazil: Impacts on Direct and Indirect Land Use Changes. In: Sugarcane Ethanol: Contributions to Climate Change Mitigation and
the Environment. Zuurbier, P, Vooren, J (eds). Wageningen: Wageningen Academic Publishers.
South-Central Region: Classes of Land Use Converted to Sugarcane, 2007 and 2008
(1,000 ha)

Example of Expansion in the Amazon: Data
from Soybean Moratorium Project
Source: Abiove e Globalsat (www.abiove.com.br).
Amazon Biome: Deforestated Area under Monitoring from 2006 to 2008 by
Land Use Classes (hectares)
Total area cleared
monitored by the
moratorium:
157,896 hectares

Deforestation on the Cerrado Biome
Source: ICONE (original GIS data from LAPIG);
Polygons with deforestation characterized with agriculture or pasture (hectares, 2006/07)
State Agriculture (ha) Pasture (ha) Total (ha) % of total area % agriculture % pasture
BA 55,242 15,889 71,130 0.47% 78% 22%
GO 17,808 28,095 45,904 0.14% 39% 61%
MA 16,998 10,674 27,672 0.13% 61% 39%
MG 9,584 18,403 27,986 0.08% 34% 66%
MS 8,318 30,665 38,982 0.18% 21% 79%
MT 76,967 96,315 173,282 0.48% 44% 56%
PI 38,163 7,358 45,521 0.49% 84% 16%
SP 4,955 2,793 7,748 0.10% 64% 36%
TO 8,336 35,137 43,473 0.17% 19% 81%
Total 236,371 245,329 481,698 2.24% 47% 53%
State Agriculture (ha) Pasture (ha) Total (ha) % of total area % agriculture % pasture
BA 83,404 8,648 92,052 0.61% 91% 9%
GO 6,756 29,525 36,281 0.11% 19% 81%
MA 20,196 17,580 37,775 0.18% 53% 47%
MG 27,253 44,735 71,988 0.22% 37% 63%
MS 28,609 19,991 48,600 0.22% 59% 41%
MT 35,501 31,755 67,256 0.19% 52% 48%
PI 27,000 1,064 28,064 0.30% 96% 4%
SP 3,848 0 3,848 0.05% 100% 0%
TO 7,961 50,508 58,469 0.23% 13% 87%
Total 240,528 203,806 444,334 2.10% 54% 46%

Results
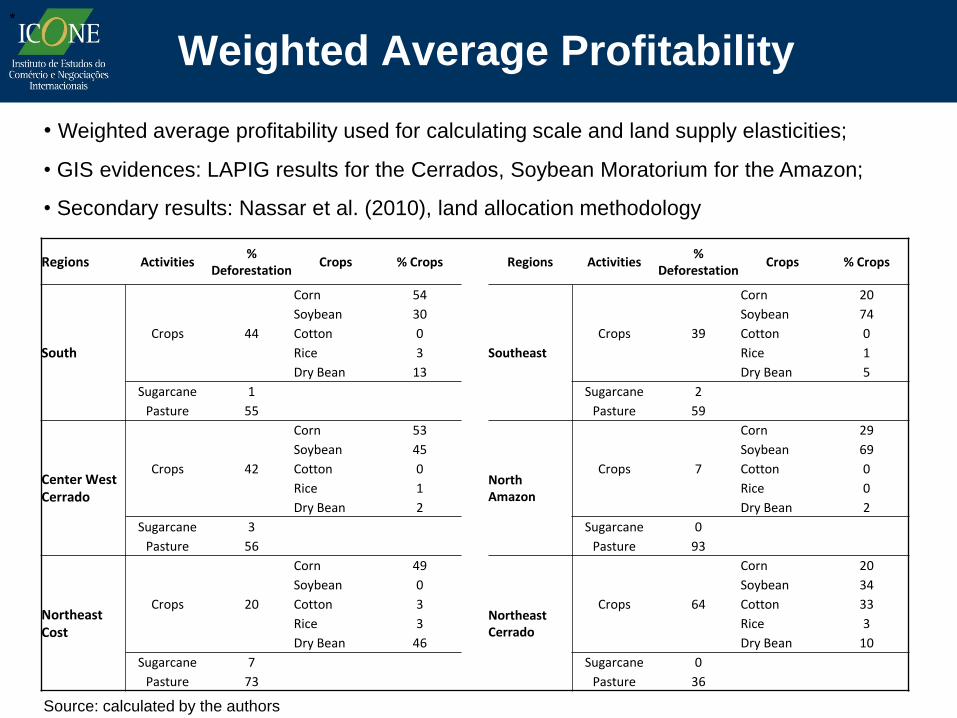
Weighted Average Profitability
• Weighted average profitability used for calculating scale and land supply elasticities;
• GIS evidences: LAPIG results for the Cerrados, Soybean Moratorium for the Amazon;
• Secondary results: Nassar et al. (2010), land allocation methodology
*
*
Source: calculated by the authors
Regions Activities %
Deforestation Crops % Crops Regions Activities
% Deforestation
Crops % Crops
South
Crops 44
Corn 54
Southeast
Crops 39
Corn 20
Soybean 30 Soybean 74
Cotton 0 Cotton 0
Rice 3 Rice 1
Dry Bean 13 Dry Bean 5
Sugarcane 1 Sugarcane 2
Pasture 55 Pasture 59
Center West Cerrado
Crops 42
Corn 53
North Amazon
Crops 7
Corn 29
Soybean 45 Soybean 69
Cotton 0 Cotton 0
Rice 1 Rice 0
Dry Bean 2 Dry Bean 2
Sugarcane 3 Sugarcane 0
Pasture 56 Pasture 93
Northeast Cost
Crops 20
Corn 49
Northeast Cerrado
Crops 64
Corn 20
Soybean 0 Soybean 34
Cotton 3 Cotton 33
Rice 3 Rice 3
Dry Bean 46 Dry Bean 10
Sugarcane 7 Sugarcane 0
Pasture 73 Pasture 36
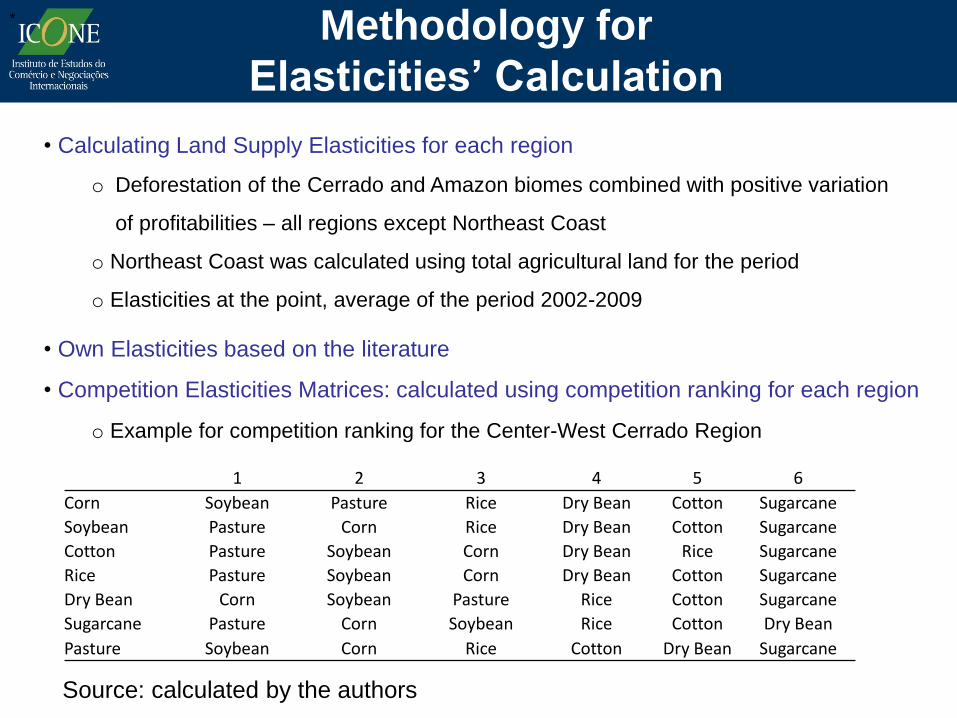
Methodology for
Elasticities’ Calculation
• Calculating Land Supply Elasticities for each region
o Deforestation of the Cerrado and Amazon biomes combined with positive variation
of profitabilities – all regions except Northeast Coast
o Northeast Coast was calculated using total agricultural land for the period
o Elasticities at the point, average of the period 2002-2009
*
*
• Own Elasticities based on the literature
• Competition Elasticities Matrices: calculated using competition ranking for each region
Source: calculated by the authors
1 2 3 4 5 6
Corn Soybean Pasture Rice Dry Bean Cotton Sugarcane
Soybean Pasture Corn Rice Dry Bean Cotton Sugarcane
Cotton Pasture Soybean Corn Dry Bean Rice Sugarcane
Rice Pasture Soybean Corn Dry Bean Cotton Sugarcane
Dry Bean Corn Soybean Pasture Rice Cotton Sugarcane
Sugarcane Pasture Corn Soybean Rice Cotton Dry Bean
Pasture Soybean Corn Rice Cotton Dry Bean Sugarcane
o Example for competition ranking for the Center-West Cerrado Region

Elasticities
• Land Supply Elasticities:
*
*
Regions Previous Version Updated Version
South 0.057 0.002
Southeast 0.067 0.007
Center West Cerrado 0.180 0.031
Northern Amazon 0.250 0.103
Northeast Coast 0.010 0.056
Northeast Cerrado 0.100 0.066
• Own Elasticities not changed, based on literature.
• Scale and Competition elasticities recalculated based on new land supply elasticities
and on competition ranking.
• New elasticities matrices for each one of the six regions in BLUM: very different from
previous version.
Source: calculated by the authors

Final Remarks
• Different land uses have different expansion characteristics
• Data limitations are important, but significant improvements have been
achieved
• Expansion characteristics should be taken into account as soon as data
becomes available.
• BLUM model is now calibrated with GIS data from 2002 to 2009.
• Further disaggregation of results is desirable,
Check the consistence of the macro results
Better inputs for other studies (GHG emissions, infrastructure, water
resources..)
• Integration of economic and biophysical models is also desirable, but the
methodological challenge is significant.

Avenida General Furtado Nascimento, 740, conj. 81
05465-070 São Paulo-SP Brasil
Phone/Fax: 55 11 30210403
www.iconebrasil.org.br
Sponsors Partners Institutional Support
Thank you [email protected]