methodology applications series 2019-2020
TRANSCRIPT

Methodology Applications Series2019-2020

Cluster Randomized Trials in Education: Lessons Learned, Migraines Overcome, and
Crises Averted
James A. Bovaird, PhDFounding Director, Nebraska Academy for Methodology, Analytics & Psychometrics
Associate Professor of Educational PsychologyProgram Director, Quantitative, Qualitative & Psychometric Methods Program
Courtesy Associate Professor of Survey Research & Methodology

Abstract
• The Reading Excellence Act passed by Congress in 1998 started a renewed push toward experimentation and random assignment as the foundation for scientifically based research in education. It has since been learned that simple random assignment is often insufficient, and the number of student participants is not always the solution.
Random assignment continues to be the cornerstone of social, behavioral and education research on program effectiveness or efficacy, especially in applied settings such as schools.
This presentation will discuss features of modern applied cluster randomized trials in school-based settings and some of their intricacies that are still overlooked or misunderstood despite the past two decades in the spotlight.

It’s All About Accountability
• Walters (2009) suggests that three particular historical developments have led to the era of accountability in education:
• A long-standing effort to establish education research as a scientific discipline (i.e. scientific legitimacy)
• An emergence of program evaluation as a new scientific field external to education research,
• A growing anecdotal perception that education research is unhelpful in providing good evidence for practitioners and policymakers.

Challenges to Public Education
• President's Task Force on Education (Gardner, 1964)
• U.S. Department of Education (USDE) formed in 1979• Replaced the Office of Research under the Department of Health, Education, and
Welfare. • Within USDE, the Office of Educational Research and Improvement (OERI) was
created to oversee research efforts funded by the federal government• OERI was reorganized in 1985, and the National Institute of Education was eliminated
• Creation of the Institute of Education Sciences (IES) in 2002• Abolished OERI was eventually abolished by Education Sciences Reform Act of 2002• Replaced by IES
• Race to the Top initiative funded through the American Recovery and Reinvestment Act of 2009

Acts of Congress Set the Context
• Reading Excellence Act of 1998
• Elementary and Secondary Education Act of 1965 (ESEA; 1965) • No Child Left Behind Act of 2001 (NCLB; 2002)
• Every Student Succeeds Act of 2015 (ESSA; 2015)
• Education Sciences Reform Act of 2002 (ESRA; 2002)• Reauthorizations of the U.S. Department of Education’s research arm
• Established in the 1950s as the Bureau of Research within the U.S. Department of Health, Education, and Welfare

Reading Excellence Act of 1998
• Evolution of an initiative that began earlier in the 1990s• Involved experimental studies of reading instruction methods
• Studies conducted through the National Institute of Health’s (NIH) Child Development and Behavior Branch
• Provided a legislative definition of scientifically-based research that applied to reading research. • The definition was broad
• Included terms such as “empirical methods” and “rigorous data analyses”
• Avoided labeling certain research paradigms as “scientific” or “rigorous”
• It did set a precedent for federally funded research opportunities

No Child left Behind Act of 2001
• Provides the vast majority of federal funding for state and local education agencies
• Directly impacts schools by including strict implications for the results of state accountability testing• Made funding contingent upon showing “adequate yearly progress”
• Indirectly impacts educational research by placing restrictions on the types of education practices and policies that are deemed acceptable• Requires that educators must only use programs, practices, etc. whose efficacy and
effectiveness evidence is grounded in “scientifically based research” (i.e. randomized experiments).
• While not specifically requiring experimental studies, the legislation expanded upon the Reading Excellence Act to further set a legislative precedent for establishing a definition of what constitutes “scientifically rigorous.”
• Indirectly required federally-funded researchers to use randomized experiments in order for their work to “count.”

Education Sciences Reform Act of 2002
• Provides for improvement of federal education research, statistics, evaluation, information, and dissemination, etc.
• Applies directly to researchers and to researchers’ largest source of funding. • Abolished the Office of Educational Research and Improvement (OERI) within
the U. S. Department of Education
• Created the Institute of Education Sciences (IES).
• The definition of scientifically based research presented in ESRA was broader than the one put forth by NCLB• But still indicates a clear preference for random-assignment experiments.

Components of Randomized Experimental Research• Random Assignment
• Participants are assigned randomly to experimental/comparison groups
• Control/comparison groups• Control/comparison groups are used as a reference for comparison of effects
• Systematic manipulation of the IV(s)• The IV(s), and ONLY THE IV(s), are manipulated by the investigator• Procedural variations across study groups are clearly operationalized

Random Assignment
• Effective method for balancing confounding factors between treatment groups
• Method• A coin is flipped or a random number table is used for each participant to determine his/her
assignment to experimental/comparison groups • Should not be confused with “random selection”
• Requirements• Should be completed in impartial manner• Approach cannot be “partially” random”– introduces bias or potential threats to validity
(these threats are often systematic)

Why Randomized Experimental Research Permits Strong Causal Inferences
• Control/comparison groups provide a reference for comparison of effects (helps rule out internal-validity threats)
• Random assignment of participants…• equates groups at the onset of the study by randomly distributing their variability across conditions
• in studying the effect of an academic intervention, we can reduce the likelihood through RA that low or high achievers are assigned to study groups disproportionately
• reduces the plausibility that threats to internal validity (e.g., selection, history, maturation) are “confounded” with the treatment by distributing variation in participant characteristics/influences randomly across conditions
• E.g., in examining effect of behavioral therapy on stress, we want to rule out other life events impacting stress (e.g., having a baby); through RA, reduce the likelihood that a particular life event effects people in the therapy group or control group differentially (participants experiencing the life event are randomly distributed between conditions)
• Systematic manipulation of the IV(s) helps to ensure that other variables are not varying between conditions and causing the effects

Randomization
• 2 procedures• Randomization procedure – generate an unpredictable sequence of allocations to
condition(s)• Allocation concealment – stringent precautions taken to ensure that group assignment is not
revealed to investigators prior to allocation and during intervention
• Statistical issues• Balance
• sample sizes
• Selection bias• randomization structure can lead to knowledge of future group assignment
• Accidental bias• important covariates are ignored, especially if unequally distributed across conditions

Randomization Procedures
• Complete randomization
• Permuted block randomization
• Urn randomization
• Covariate-adaptive randomization
• Outcome-adaptive randomization

Allocation Concealment
• Sequentially-numbered, opaque, sealed envelopes (SNOSE)
• Sequentially-numbered containers
• Pharmacy controlled
• Central randomization

Selecting & Assigning Participants
• The sample should be representative of the population of interest
• Random selection from a population is not necessary (usually totally unfeasible)
• All participants should have a equal chance of being assigned to each condition
• Careful consideration should be given to the unit of randomization• For optimal randomization, the unit of randomization = the unit of
intervention • e.g., if the intervention is provided to individuals, randomize individuals, not classrooms• Participants within groups are NOT independent of one another (potential group influences)
• If groups (e.g., schools, classrooms) are randomized rather than individuals, the sample size should be the number of groups
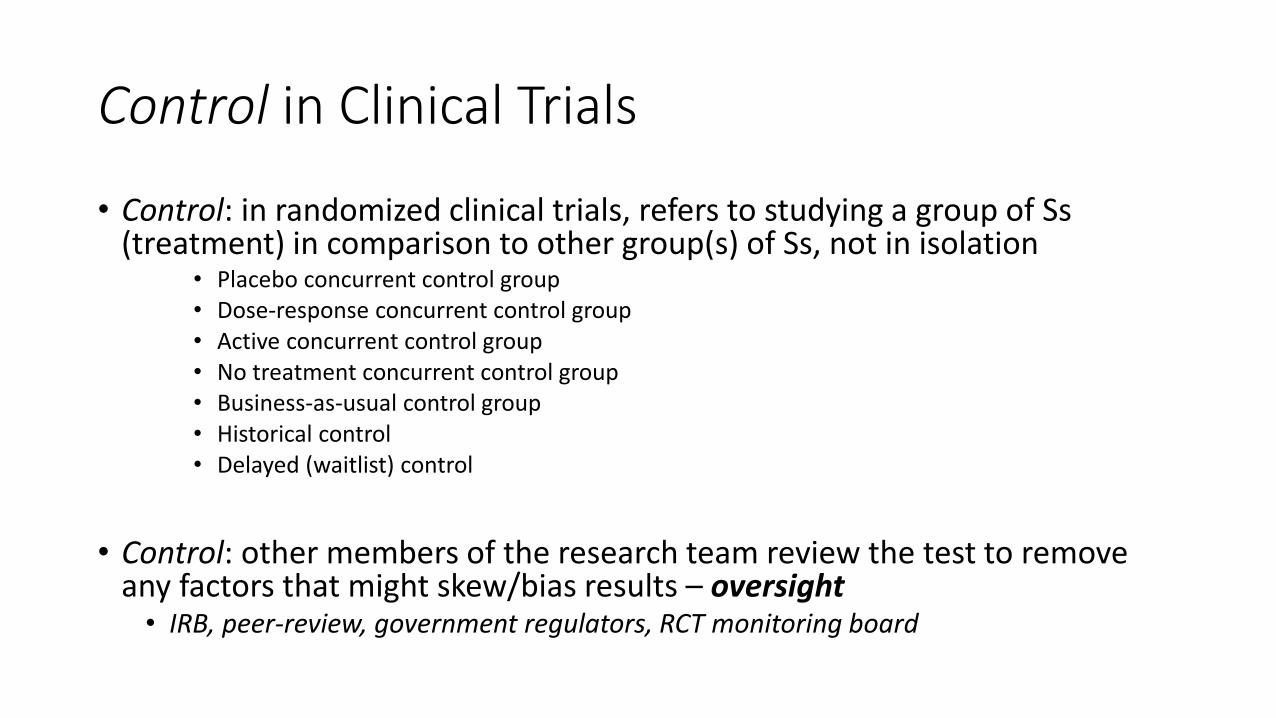
Control in Clinical Trials
• Control: in randomized clinical trials, refers to studying a group of Ss(treatment) in comparison to other group(s) of Ss, not in isolation
• Placebo concurrent control group• Dose-response concurrent control group• Active concurrent control group• No treatment concurrent control group• Business-as-usual control group• Historical control• Delayed (waitlist) control
• Control: other members of the research team review the test to remove any factors that might skew/bias results – oversight• IRB, peer-review, government regulators, RCT monitoring board
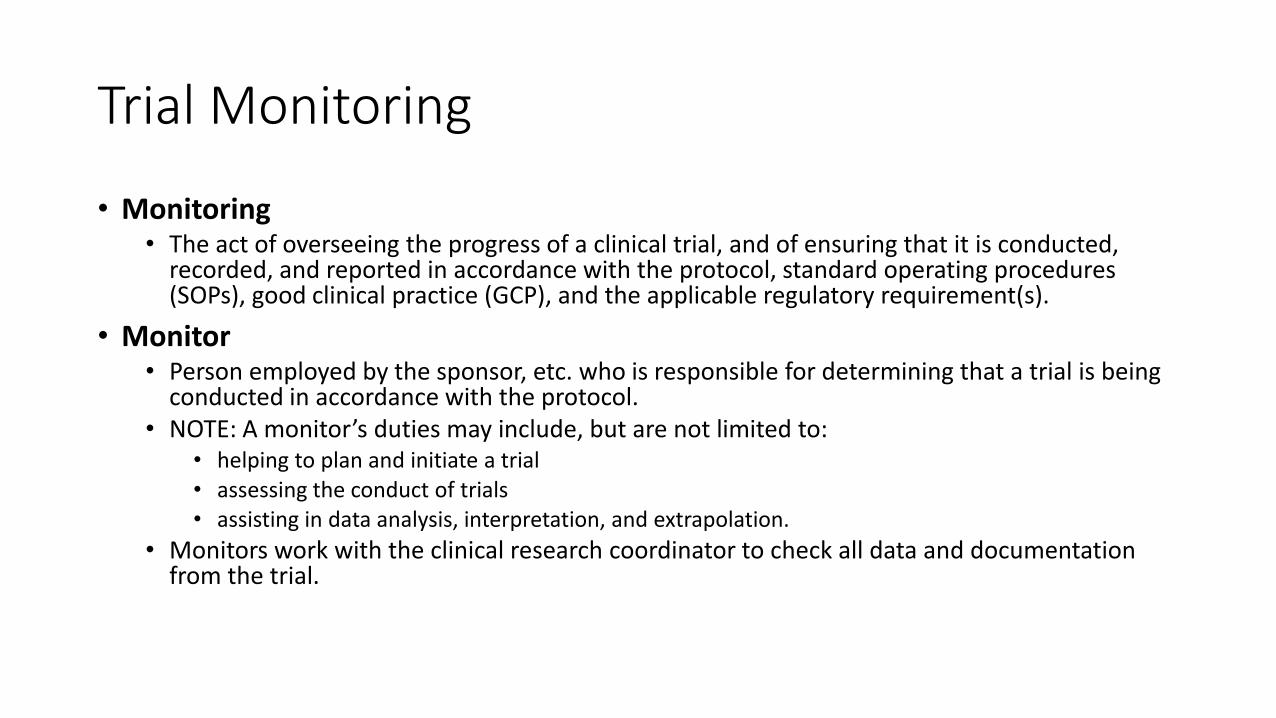
Trial Monitoring
• Monitoring• The act of overseeing the progress of a clinical trial, and of ensuring that it is conducted,
recorded, and reported in accordance with the protocol, standard operating procedures (SOPs), good clinical practice (GCP), and the applicable regulatory requirement(s).
• Monitor • Person employed by the sponsor, etc. who is responsible for determining that a trial is being
conducted in accordance with the protocol. • NOTE: A monitor’s duties may include, but are not limited to:
• helping to plan and initiate a trial• assessing the conduct of trials• assisting in data analysis, interpretation, and extrapolation.
• Monitors work with the clinical research coordinator to check all data and documentation from the trial.

Trial Monitoring
• Independent data monitoring committee (IDMC)• A committee established by the sponsor to assess at intervals the progress of a clinical trial,
safety data, and critical efficacy variables and recommend to the sponsor whether to continue, modify, or terminate the trial.
• Data monitoring committee (DMC)• Group of individuals with pertinent expertise that reviews on a regular basis accumulating
data from an ongoing clinical trial. The DMC advises the sponsor regarding the continuing safety of current participants and those yet to be recruited, as well as the continuing validity and scientific merit of the trial.
• NOTE: A DMC can stop a trial if it finds toxicities or if treatment is proved beneficial.

Scope of the IV Manipulation
• The scope of the IV manipulation should be precise enough to make meaningful conclusions that advance science• A kitchen sink approach (bad)
• Outcomes are evaluated for participants assigned to 2 conditions:
• Control group
• Multi-component intervention group – reading instruction, motivational strategy instruction, behavioral supports, and extra supplementary study time
• Narrowed scope (better)• Outcomes are evaluated for participants assigned to 4 conditions:
• Control group
• Reading intervention group
• Behavioral intervention group
• Reading and behavioral intervention group

Types of Trials
• Equivalence Trials• Aim: to show that the response to two or more treatments differs by an amount that is clinically
unimportant. • Usually demonstrated by showing that the true treatment difference is likely to lie between a lower and
an upper equivalence margin of clinically acceptable differences
• Non-Inferiority Trials• Aim: to show that the effect of a new treatment is not worse than that of an active control by more
than a specified margin. • May sometimes be necessary when a placebo group can not be ethically included.
• Comparative Trials• Aim: to compare an investigative treatment against another treatment, either active treatment or
placebo
• Superiority Trials• Aim: to show that a new treatment has an advantage over another treatment, either active treatment
or placebo

Difficulties
• Outside pressure• RCTs are expensive (accountability)
• Usually the culmination of a long line of previous research (researcher’s career)
• Political issues (H1N1 vaccine has no side effects)
• Vested interests
• Statistical errors• False negatives & false positives are possible
• Tendency to capitalize on false positives to make personal cases
• Blinding• Placebo may not be possible (too dangerous, active participation may be necessary)
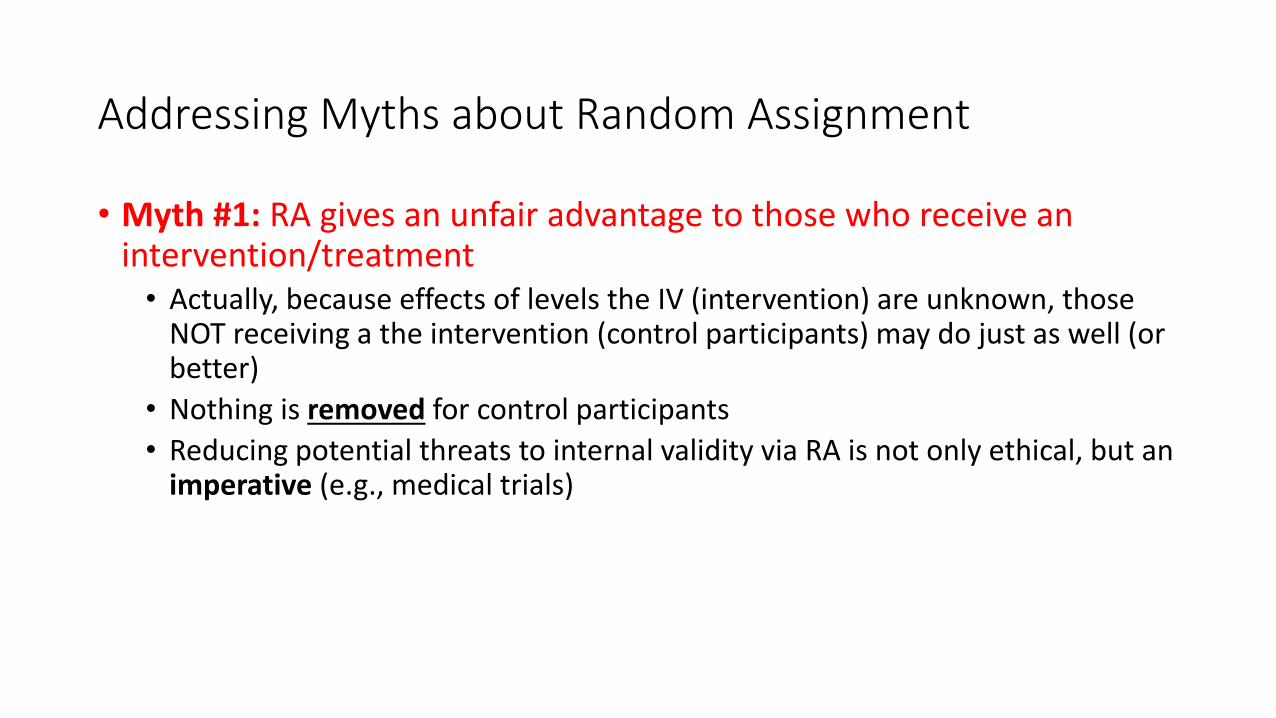
Addressing Myths about Random Assignment
• Myth #1: RA gives an unfair advantage to those who receive an intervention/treatment• Actually, because effects of levels the IV (intervention) are unknown, those
NOT receiving a the intervention (control participants) may do just as well (or better)
• Nothing is removed for control participants
• Reducing potential threats to internal validity via RA is not only ethical, but an imperative (e.g., medical trials)

Addressing Myths about Random Assignment
• Myth #2: Conducting a study with RA is too costly and time intensive• Actually, the adoption of ineffective practices or policies in the real world is
much greater than the cost of conducting a study with RA
• Myth #3: Many participants randomly assigned to the control condition will drop out• Actually, offering $$ or delayed participation in an intervention can
significantly reduce attrition
Cluster Randomized Trials
• Experiments in which social units/groups/clusters are randomly allocated rather than individual Ss• Communities
• Classrooms/schools
• Clinics
• Families

Cluster Randomized Trials
• Why Cluster Randomization?• Need to minimize or remove contamination
• In a trial for the prevention of coronary heart disease, factories were chosen as units of randomization to minimize the likelihood of subjects in different intervention groups sharing information concerning preventive advice on coronary risk factors.
• The “teachers’ lounge” effect
• Basic feasibility considerations• Evaluate a program to enhance the effectiveness of hypertension screening and management in
general practice. It was recognized that such a program would not function effectively if some patients in a practice but no others were entered into it. Unit of randomization: physician practice.
• Group vs individualized instruction
• Only natural choice• Intervention programs that use mass education. It is difficult to provide general recommendations
concerning diet, smoking, or exercise to some people and not to others in the same community• Policy-making

Impacts of Cluster Randomization
• Theory of experimental design assumes that experimental unit which is randomized is also the unit of analysis.• In C-RCTs, inferences are frequently intended to apply at the individual level, while
randomization is applied at the cluster level.
• Problem with individual level analysis: lack of independence among members in a cluster (clustering effect).• Application of standard sample size formulas will lead to underpowered studies
• C-RCTs = larger sample sizes
• Application of standard statistical methods will tend to bias p-values downward risking a spurious claim of statistical significance• C-RCTs = more sophisticated statistical methods
• Several other issues related to the conduct and interpretation of clinical trials are also affected.

Common Cluster RCT Designs
• Completely randomized• Intervention randomly allocated to clusters.• Suitable when randomizing a large number of clusters
• Matched pairs• Clusters are paired and each cluster within a pair is randomly assigned to the
intervention/control conditions• Provides explicit balancing of potentially prognostic factors at baseline
• Stratified• Clusters are grouped in homogeneous strata & then randomly allocated to
condition
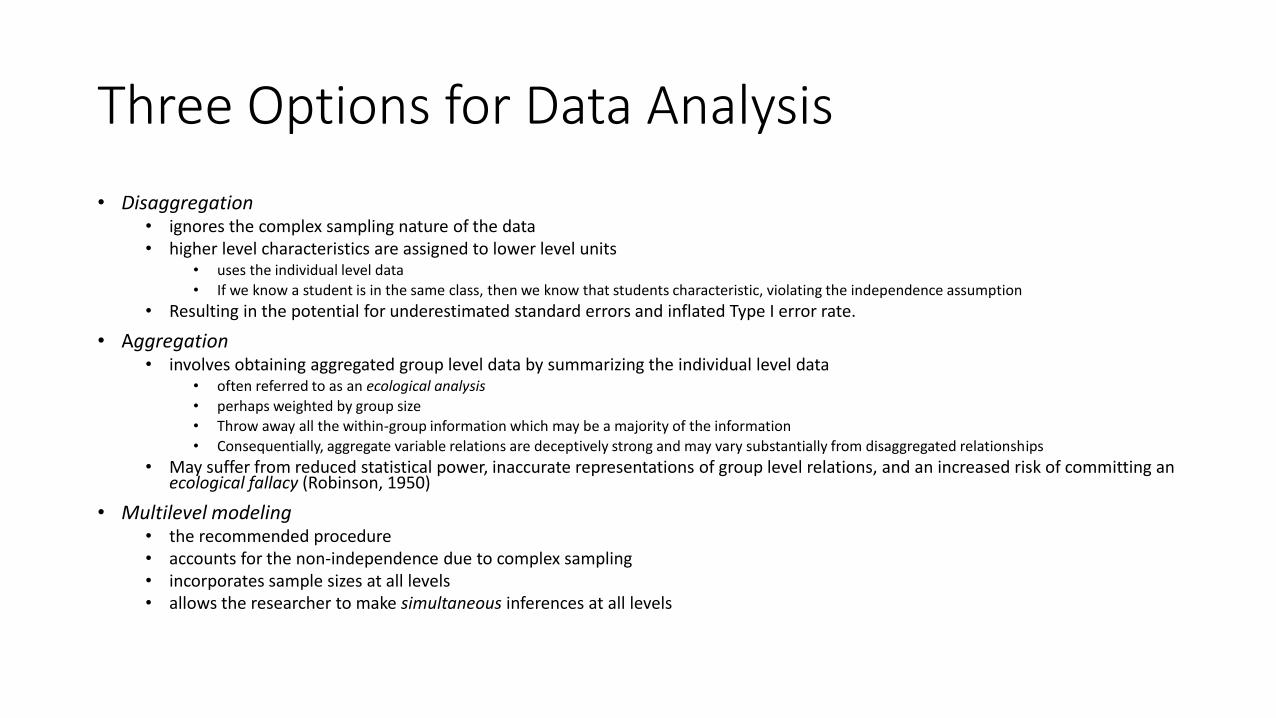
Three Options for Data Analysis
• Disaggregation• ignores the complex sampling nature of the data• higher level characteristics are assigned to lower level units
• uses the individual level data
• If we know a student is in the same class, then we know that students characteristic, violating the independence assumption
• Resulting in the potential for underestimated standard errors and inflated Type I error rate.
• Aggregation• involves obtaining aggregated group level data by summarizing the individual level data
• often referred to as an ecological analysis
• perhaps weighted by group size• Throw away all the within-group information which may be a majority of the information
• Consequentially, aggregate variable relations are deceptively strong and may vary substantially from disaggregated relationships
• May suffer from reduced statistical power, inaccurate representations of group level relations, and an increased risk of committing an ecological fallacy (Robinson, 1950)
• Multilevel modeling• the recommended procedure• accounts for the non-independence due to complex sampling• incorporates sample sizes at all levels• allows the researcher to make simultaneous inferences at all levels
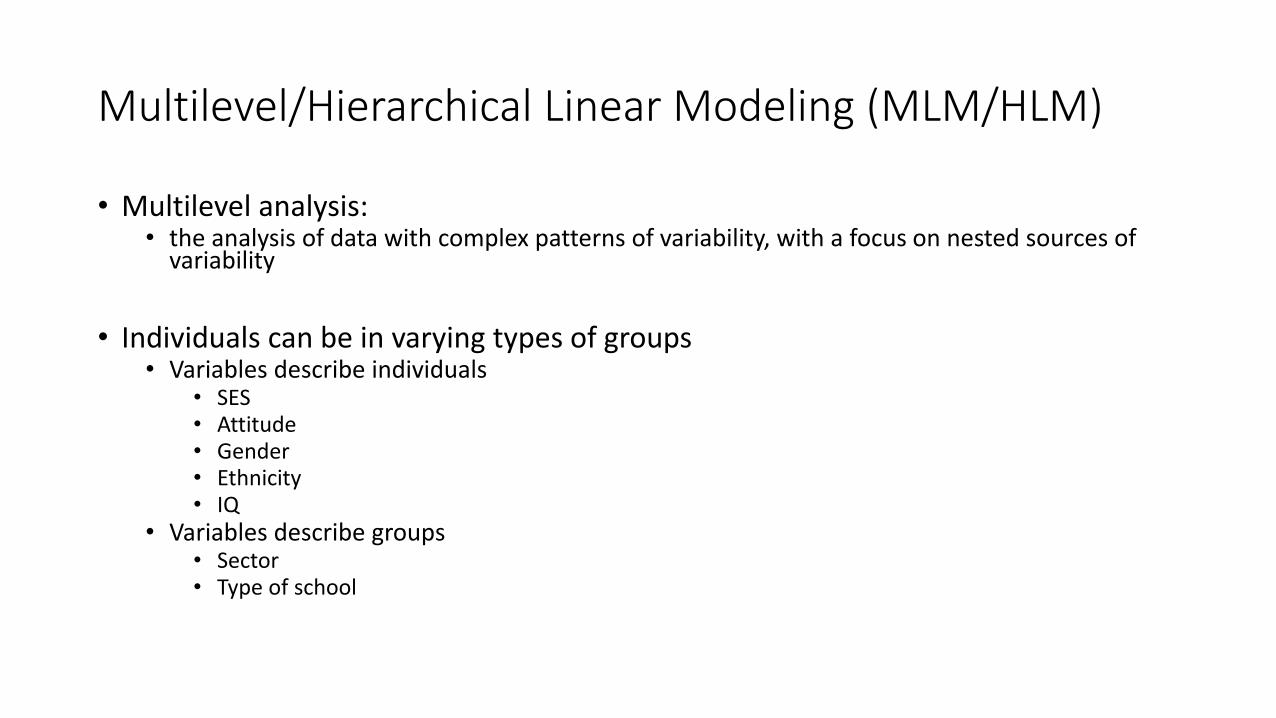
Multilevel/Hierarchical Linear Modeling (MLM/HLM)
• Multilevel analysis: • the analysis of data with complex patterns of variability, with a focus on nested sources of
variability
• Individuals can be in varying types of groups• Variables describe individuals
• SES• Attitude• Gender• Ethnicity• IQ
• Variables describe groups• Sector• Type of school

Broad Definition of MultiLevel Modeling (MLM)
• A multilevel model simply contains variables measured at different levels of a sampling hierarchy• Clearly identified levels of aggregation• Complex or stratified sampling procedures
• Do not confuse• Hierarchically nested data• Hierarchically ordered set of regression equations
• Two data analysis perspectives leading to the need for multilevel modeling procedures• Complex sampling & random parameters• Both perspectives lead to the need to decompose the variability in outcome
measures into between-group (contextual) and within-group (individual) sources• A general effect of a variable on an outcome within each contextual group
• But that effect can vary randomly to a degree across groups

Source of Dependency
• School Example• Students share the same school environment
• Students share the same teachers
• Students communicate directly with each other or are affected by shared group norms
• Students come from same neighborhood
• Longitudinal data• measurement within Ss

Two Perspectives on (Multilevel) Dependency• As a Nuisance
• Observations should be sampled independently• Random sampling with replacement from an infinite
population
• Multi-stage sampling• Two-stage sample: only one subpopulation level
• More cost-efficient
• Population of interest contains subpopulations where selection takes place
• Always requires multilevel analysis (at least initially)
• Common mistake:• Ignore that the sampling is two-stage
• Selecting a primary unit increases the chance of selecting a secondary unit from that primary unit
• Leads to dependent observations
• As an Interesting Phenomenon
• We commonly want to make inference at both the macro and micro levels
• Macro-level units
• Macro-units• Primary units• Clusters• Level-2 units
• Micro-level units
• Micro-units• Secondary units• Elementary units• Level-1 units

Unit of Assignment vs. Unit of Inference
• In cluster randomized trials, unit of analysis and unit of assignment (randomization) can be different, depending on the level of inference:• Inference at individual level:
• Antenatal Care Trial used clinics as the unit of randomization and women as unit of analysis
• Inference at cluster level:• Second Opinion Trial evaluated the effect of an intervention to lower the rate of
caesarean section. The target of the intervention is defined explicitly as the hospital rate of caesarian section.

Types of Relationships
• Tacq (1986): 3 propositions• Macro-unit
• Micro-unit
• Macro-micro relations
• Emergent (micro-macro) proposition
• Causal chain propositions

Macro-unit propositions
• Hardly obvious, but often still necessary
• when either or both variables are not directly observable, but are measured at the macro-level
• When level-2 units are aggregates of level-1 units

Micro-Unit Propositions
• Less obvious need for MLM• from cost-effectiveness perspective
• Macro-level in the sampling design• dependency is a nuisance

Macro-Micro Propositions
• Obvious need for MLM
• Multilevel propositions• Macro and micro effects on y
• Macro-micro relations• Macro-to-micro:
• more explicit social norms lead to more conservative individual views
• Effect of macro on DV, given micro
• Cross-level interaction:• effect of micro on y is a function of macro

Other Propositions
• Emergent (micro-macro) proposition• Micro affects macro (student
attitude affects teacher stress)
• Causal chain propositions• Macro-macro relationship through
micro variables
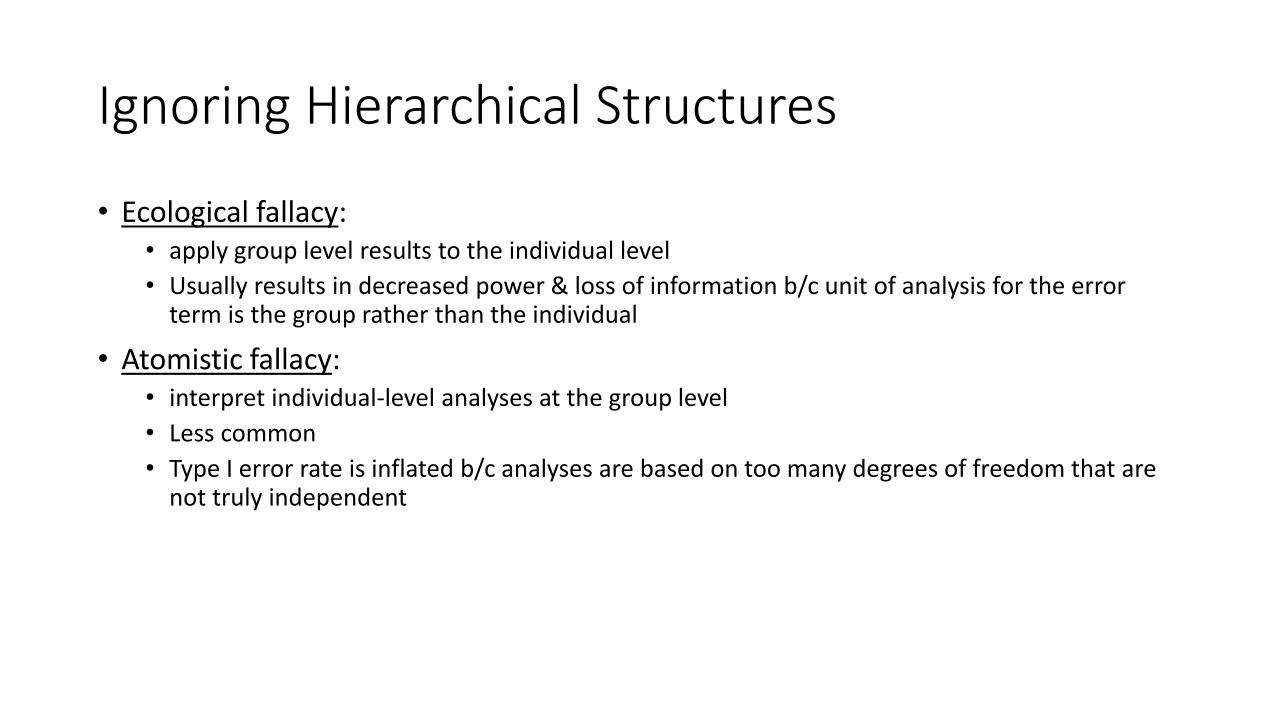
Ignoring Hierarchical Structures
• Ecological fallacy:• apply group level results to the individual level
• Usually results in decreased power & loss of information b/c unit of analysis for the error term is the group rather than the individual
• Atomistic fallacy:• interpret individual-level analyses at the group level
• Less common
• Type I error rate is inflated b/c analyses are based on too many degrees of freedom that are not truly independent

Multiple Sets of Equations
• As a 2-level MLM, the analysis framework can be specified by two sets of equations.
• The micro-level regression equation is
• yti is the outcome variable score (e.g., language score) at time t for child i, • Tti is the representation of time that varies within child i
• As in a pre-post design• 0i represents the overall average performance when time equals zero (intercept), • 1i represents the average change or gain in performance from the intercept • eti is a within-person observation-level residual
• This equation models the change in performance within an individual (longitudinal) or group (cross-sectional).
• Conceptually defines a separate regression equation for each of the i individuals, such that across individuals, there is a typical intercept and typical slope, but individuals are allowed to deviate.
titiiiti eTy ++= 10
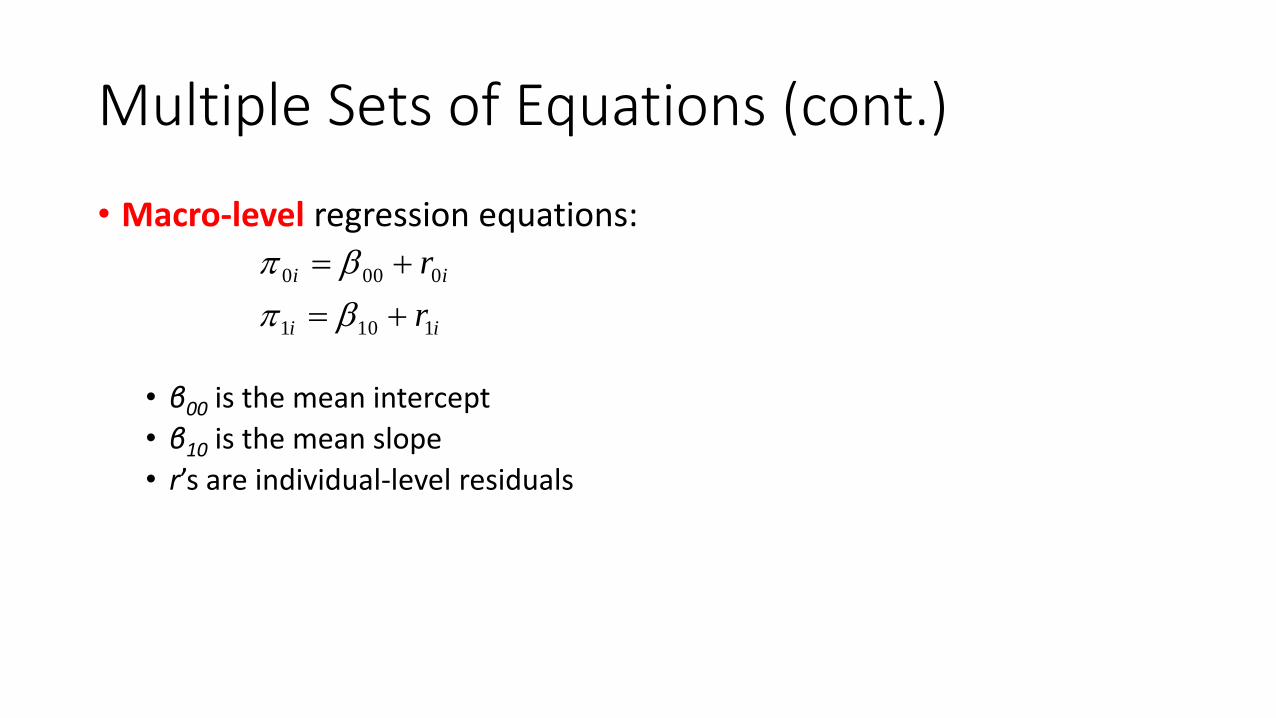
Multiple Sets of Equations (cont.)
• Macro-level regression equations:
• β00 is the mean intercept
• β10 is the mean slope
• r’s are individual-level residuals
ii
ii
r
r
1101
0000
+=
+=

Multiple Sets of Equations (cont.)
• Substitute the macro-level equations into the micro-level equation:
• β00 and β10 become the traditional fixed effects as would be seen in a GLM approach
• The single GLM random effect (i.e. the error term) has been divided into three random separate sources of variance.
• Can be easily expanded to include additional predictors or covariates by adding additional or β parameters.
tiitiititi erTrTy ++++= 101000

Variance Components
• T is the symmetric covariance matrix of the random effects• individual differences in intercept τ00
• individual differences in slope τ11
• covariance between intercept and slope τ10
( )ii Nri Nr IΣ
2,0~ =
=
1110
00,
0
0~
Tu Ni

FLASHBACK: Selecting & Assigning Participants
• Careful consideration should be given to the unit of randomization• For optimal randomization, the unit of randomization = the unit of
intervention • e.g., if the intervention is provided to individuals, randomize individuals, not classrooms• Participants within groups are NOT independent of one another (potential group influences)
• If groups (e.g., schools, classrooms) are randomized rather than individuals, the sample size should be the number of groups

Denominator Degree of Freedom Method (DDFM)
• DDFM • Specifies the method for computing the denominator degrees of freedom for
the tests of fixed effects
• Common options:• BETWEEN/WITHIN
• RESIDUAL
• SATTERTHWAITE
• KENWARD-ROGER
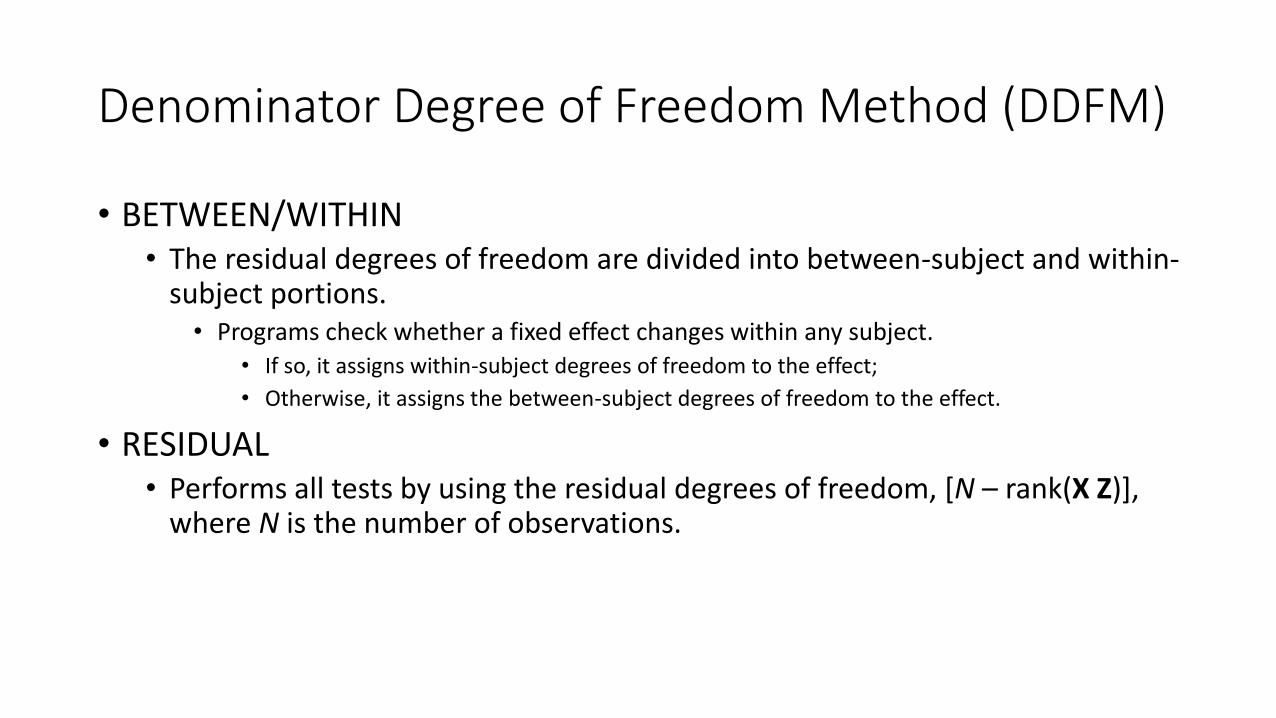
Denominator Degree of Freedom Method (DDFM)
• BETWEEN/WITHIN• The residual degrees of freedom are divided into between-subject and within-
subject portions. • Programs check whether a fixed effect changes within any subject.
• If so, it assigns within-subject degrees of freedom to the effect;
• Otherwise, it assigns the between-subject degrees of freedom to the effect.
• RESIDUAL• Performs all tests by using the residual degrees of freedom, [N – rank(X Z)],
where N is the number of observations.

SATTERTHWAITE
• This method is a generalization of the techniques described in Giesbrecht & Burns (1985), McLean & Sanders (1988) & Fai & Cornelius (1996)
• The Satterthwaite method is intended to produce an accurate Fapproximation
• The small sample properties of this approximation have not been extensively investigated

KENWARD-ROGER
• Performs the df calculations detailed by Kenward and Roger (1997).
• Steps:• The estimated variance-covariance matrix of the fixed and random effects is inflated by the
method proposed by Prasad and Rao (1990) and Harville and Jeske (1992); see also Kackarand Harville (1984).
• Satterthwaite-type degrees of freedom are then computed based on this adjustment. • By default, the observed information matrix (i.e. standard errors) of the covariance parameter
estimates is used in the calculations.
• For covariance structures that have nonzero second derivatives with respect to the covariance parameters, the Kenward-Roger covariance matrix adjustment includes a second-order term. • This term can result in standard error shrinkage.
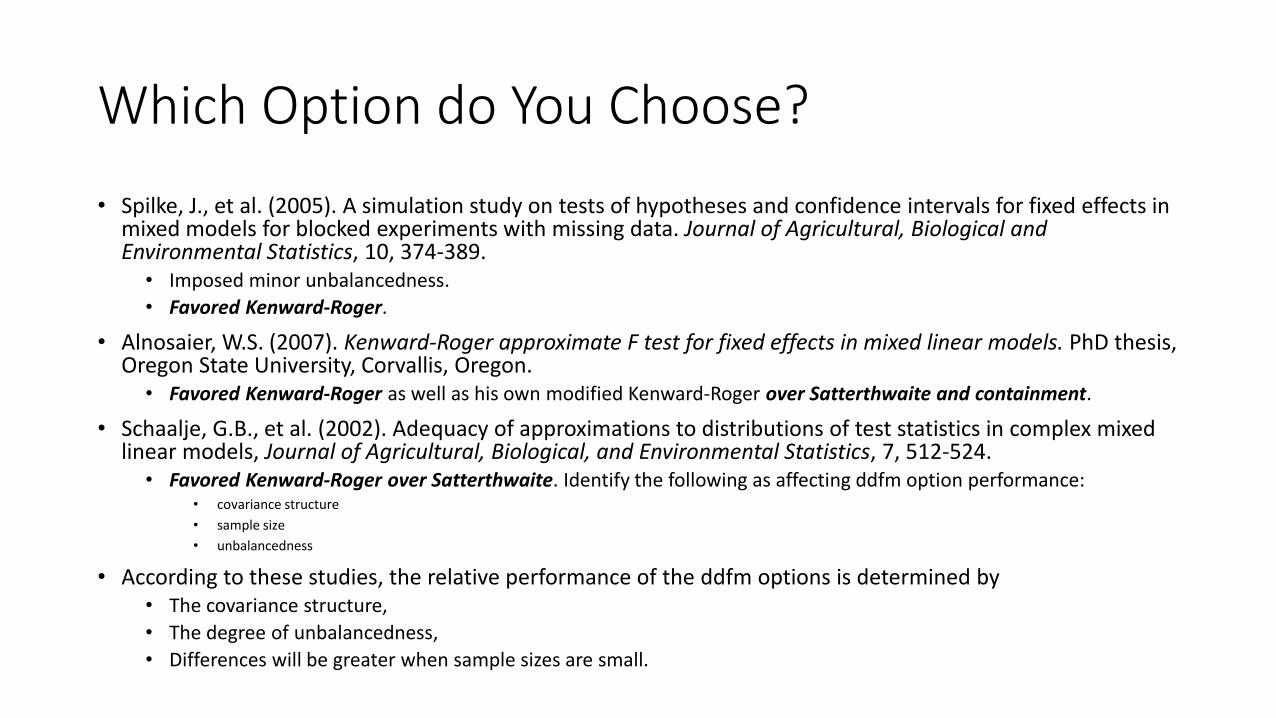
Which Option do You Choose?
• Spilke, J., et al. (2005). A simulation study on tests of hypotheses and confidence intervals for fixed effects in mixed models for blocked experiments with missing data. Journal of Agricultural, Biological and Environmental Statistics, 10, 374-389.
• Imposed minor unbalancedness.
• Favored Kenward-Roger.
• Alnosaier, W.S. (2007). Kenward-Roger approximate F test for fixed effects in mixed linear models. PhD thesis, Oregon State University, Corvallis, Oregon.
• Favored Kenward-Roger as well as his own modified Kenward-Roger over Satterthwaite and containment.
• Schaalje, G.B., et al. (2002). Adequacy of approximations to distributions of test statistics in complex mixed linear models, Journal of Agricultural, Biological, and Environmental Statistics, 7, 512-524.
• Favored Kenward-Roger over Satterthwaite. Identify the following as affecting ddfm option performance:• covariance structure
• sample size
• unbalancedness
• According to these studies, the relative performance of the ddfm options is determined by• The covariance structure,
• The degree of unbalancedness,
• Differences will be greater when sample sizes are small.

Cluster Randomized Trials – Simple Example
• Question:• Is there a difference in achievement between classrooms that implement the new phonics program and
those that use the regular program?
• Rely on assignment of clusters to treatments• Clusters: schools, classrooms, etc.
• An example • New phonics program for 1st graders
• 5-year program, Ss assessed at the beginning of each year
• 40 classrooms (20 assigned to treatment, 20 assigned to control) • Note: Ss are not assigned to conditions
• 25 students per classroom participate (N = 1,000)• 5 observations (level 1) are nested within student (level 2)• Students (level 2) are nested within classrooms (level 3)
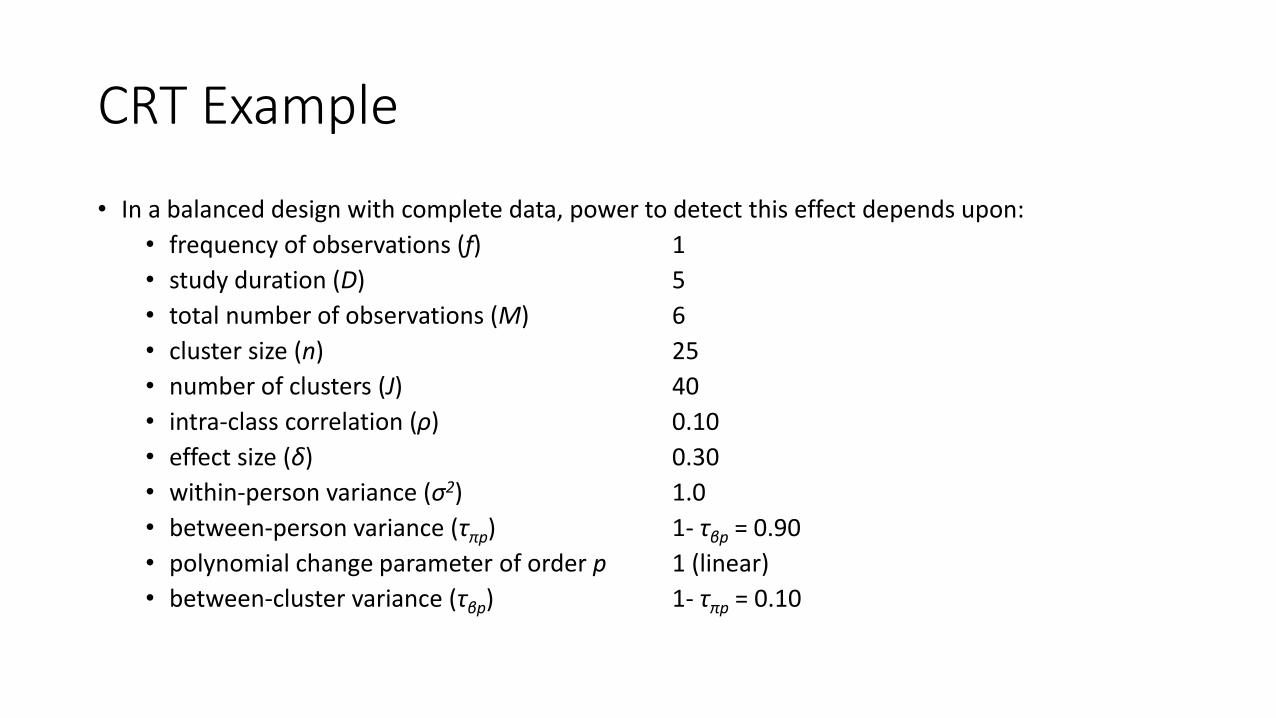
CRT Example
• In a balanced design with complete data, power to detect this effect depends upon:
• frequency of observations (f) 1
• study duration (D) 5
• total number of observations (M) 6
• cluster size (n) 25
• number of clusters (J) 40
• intra-class correlation (ρ) 0.10
• effect size (δ) 0.30
• within-person variance (σ2) 1.0
• between-person variance (τπp) 1- τβp = 0.90
• polynomial change parameter of order p 1 (linear)
• between-cluster variance (τβp) 1- τπp = 0.10
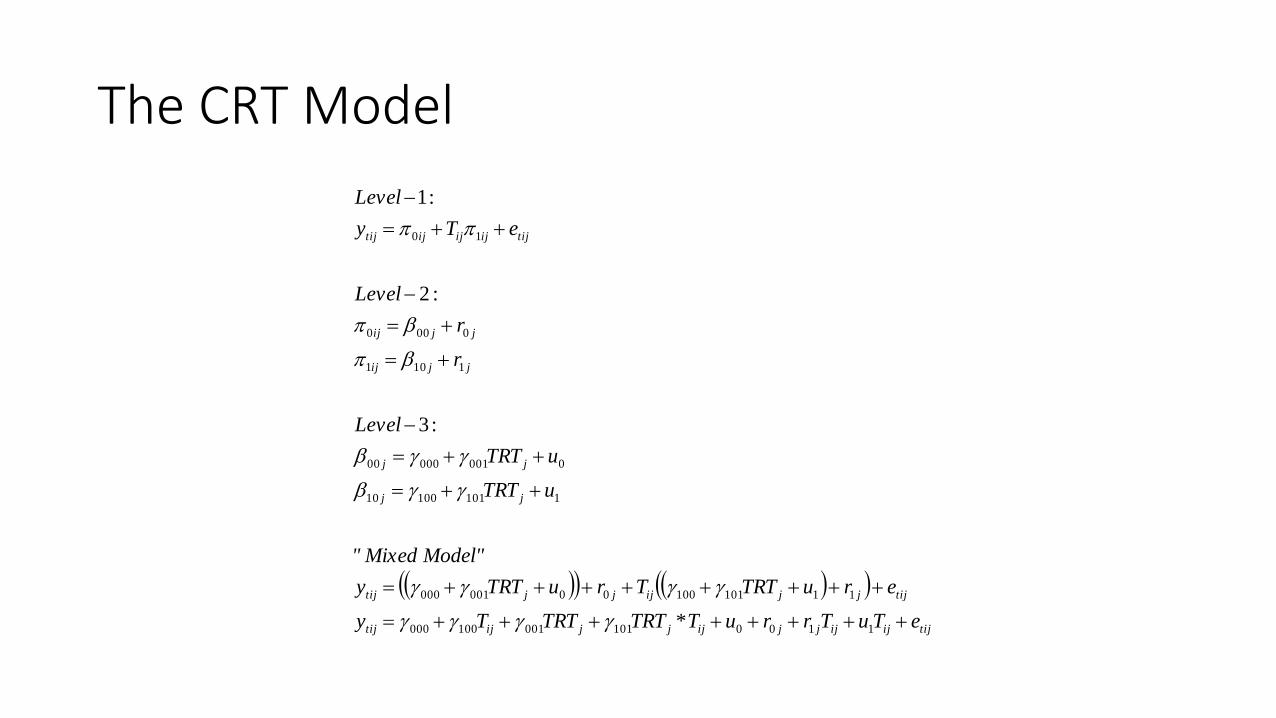
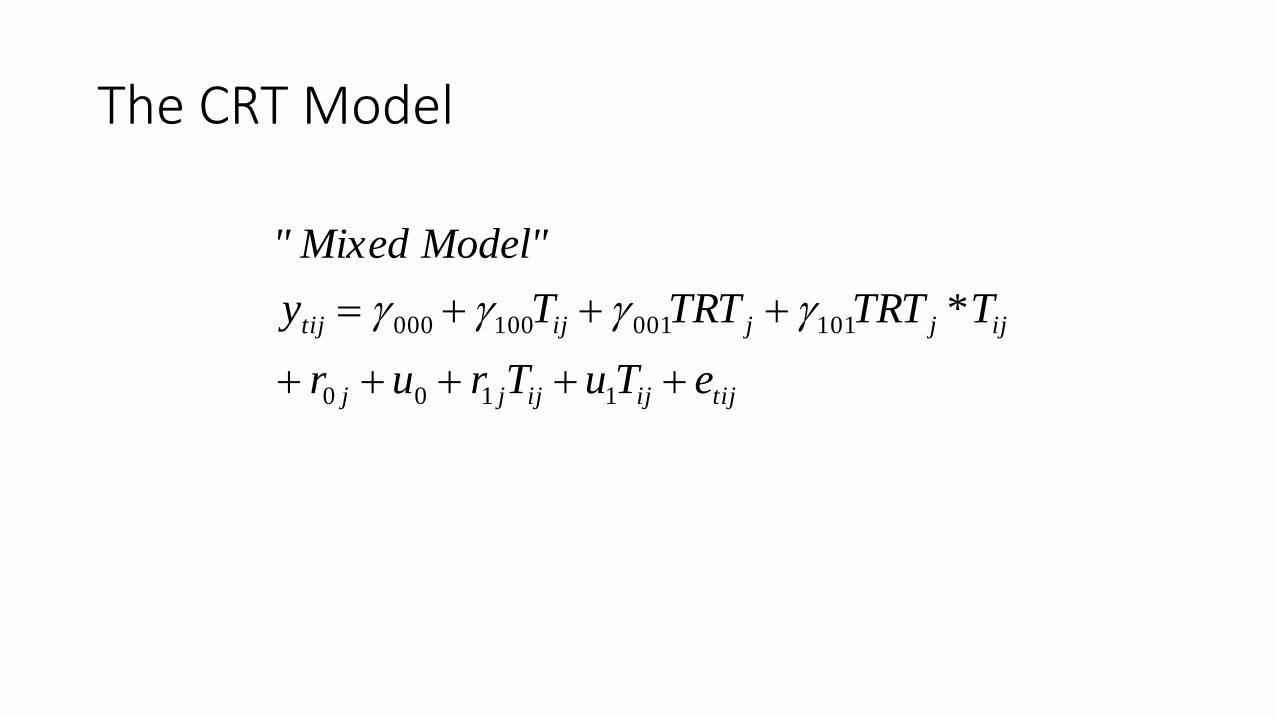
The CRT Model
( )( ) ( )( )
tijijijjjijjjijtij
tijjjijjjtij
jj
jj
jjij
jjij
tijijijijtij
eTuTrruTTRTTRTTy
eruTRTTruTRTy
Model"Mixed"
uTRT
uTRT
Level
r
r
Level
eTy
Level
++++++++=
++++++++=
++=
++=
−
+=
+=
−
++=
−
1100101001100000
1110110000001000
110110010
000100000
1101
0000
10
*
:3
:2
:1
The CRT Model
tijijijjj
ijjjijtij
eTuTrur
TTRTTRTTy
Model"Mixed"
+++++
+++=
1100
101001100000 *

Crossed Random Coefficients
• Students within SCHOOLS & NEIGHBORHOODS• Schools may be nested within neighborhoods, but they draw across
neghborhoods
• Students within CLASSES & TEACHERS within schools• Classes may be taught by several teachers, students may have several
teachers
• Responses within ITEM & SUBJECT• All Ss receive all items and all items are responded to by all Ss
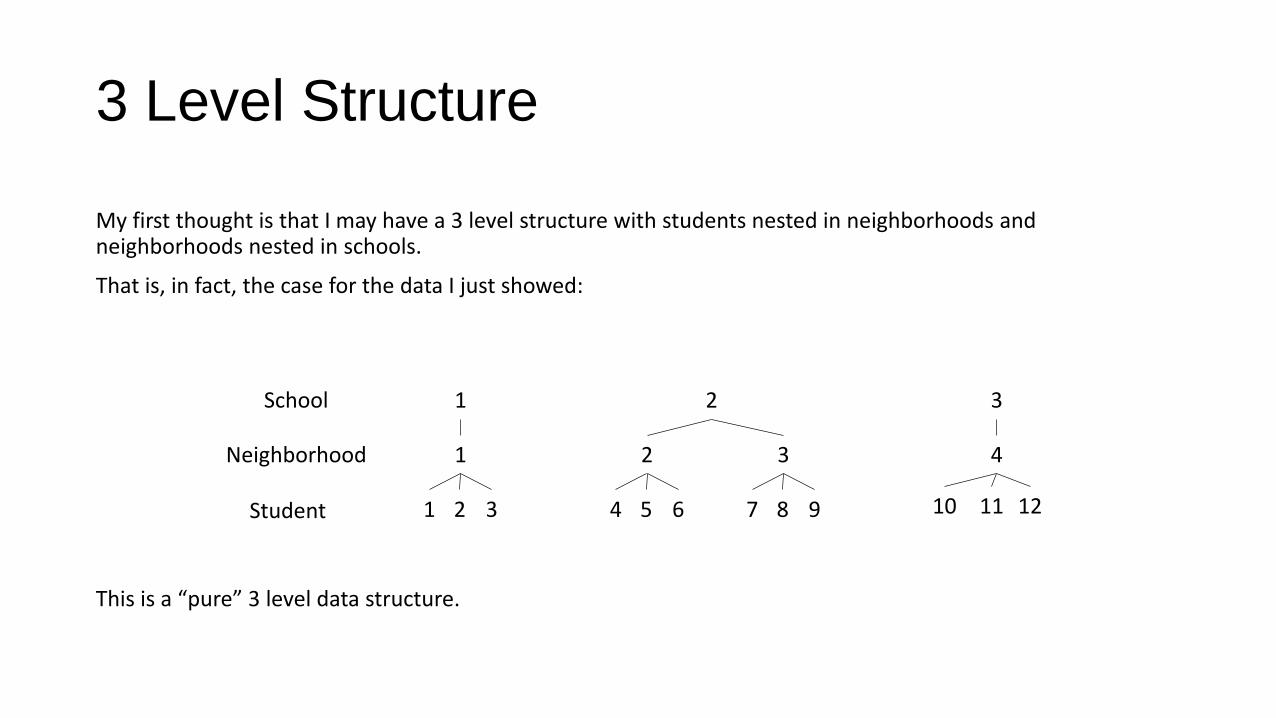
3 Level Structure
My first thought is that I may have a 3 level structure with students nested in neighborhoods and neighborhoods nested in schools.
That is, in fact, the case for the data I just showed:
This is a “pure” 3 level data structure.
1
1
2 3
2 3 4
1 2 3 4 5 6 7 8 9 10 11 12
School
Neighborhood
Student

Cross-Classification
Here is a graph of the data structure:
1) Each student lives in a single neighborhood.
BUT
2) Neighborhoods 2 and 3 feed students into multiple schools.
- Some neighborhoods “belong” to multiple schools
1
1
2 3
2 3 4
1 2 3 4 5 6 7 8 9 10 11 12
School
Neighborhood
Student

An Expanded Model• γ0 is the grand mean for all Ss
• b00j is the random effect of context A
• c00j is the random effect of context B
• d00j is the random interaction effect of being in both context A and context B
• this is often dropped from the analysis because of small within-cell sample sizes( )
( )
( )
( )000
0000
0000
2
000000
0000000
0
,0~
,0~
,0~
,0~
djk
ck
bj
ijk
ijkjkkjijk
jkkjjk
ijkjkijk
Nd
Nc
Nb
Ne
edcbY
dcb
eY
++++=
+++=
+=

Broader Analytic Perspectives
• 3 main statistical techniques provide different information regarding the clinical outcome• intent-to-treat, missing equals failure (ITT M = F)
• most conservative type• it includes all patients who entered the study, and all missing data are treated as representing
failure • true failures, toxicity-related withdrawals, dropouts and others lost to follow-up, and treatment switches
• underestimates the treatment effect in practice.
• intent-to-treat, last observation carried forward (ITT LOCF)• missing data are handled by assigning the value recorded at the last patient visit.
• observed, or on-treatment, analysis• most common way of presenting clinical data• provides results only for patients for whom follow-up data are available; missing values are
disregarded.• tends to overestimate the treatment effect in practice by ignoring patients who are unable to
receive therapy or who change therapy because of an insufficient response.

Intention-to-Treat
• The principle that asserts that the effect of a treatment policy can be best assessed by evaluating the basis of the intention to treat a subject (i.e., the planned treatment regimen) rather than the actual treatment given. • NOTE: This has the consequence that subjects allocated to a treatment group should be
followed up, assessed, and analyzed as members of that group irrespective of their compliance with the planned course of treatment.
• The principle is intended to prevent bias caused by loss of participants that may reflect non-adherence to the protocol and disrupt baseline equivalence established by random assignment.

Reliability of the Outcome:Aggregated vs. Disaggregated Measurement Models (Y)

Reliability & Validity of the Outcome:Concept Map →Measurement Model

Reliability of the IV:Aggregated vs. Disaggregated Assignment (X)
Disaggregation ≈ Reliability (of X) ≈ Fidelity

Dimensions Intervention Fidelity
• Little consensus on what is meant by the term “intervention fidelity”.
• But Dane & Schneider (1998) identify 5 aspects:• Adherence/compliance – program components are delivered/used/received,
as prescribed;• Exposure – amount of program content delivered/received by participants;• Quality of the delivery – theory-based ideal in terms of processes and
content;• Participant responsiveness – engagement of the participants; and • Program differentiation – unique features of the intervention are
distinguishable from other programs (including the counterfactual)

Why is this Important?
• Statistical Conclusion validity• Unreliability of Treatment Implementation: Variations across participants in
the delivery receipt of the causal variable (e.g., treatment). Increases error and reduces the size of the effect; decreases chances of detecting covariation.
• Resulting in a reduction in statistical power or the need for a larger study….
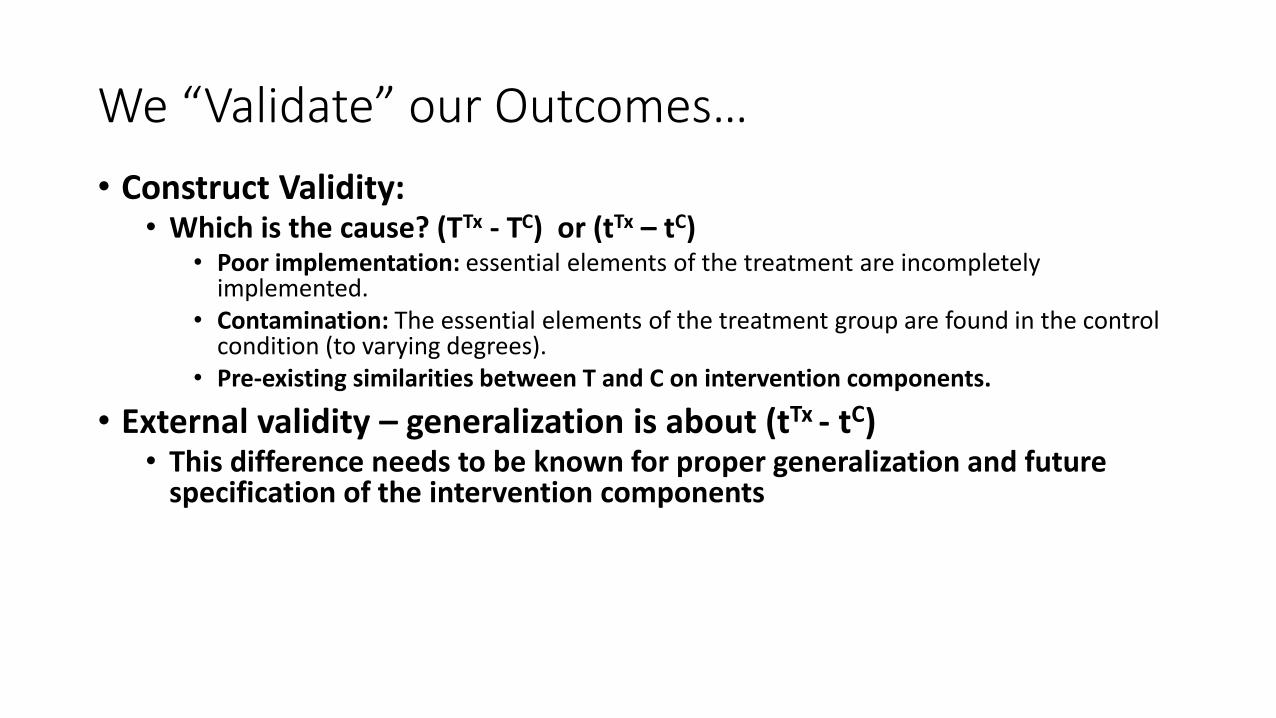
We “Validate” our Outcomes…
• Construct Validity: • Which is the cause? (TTx - TC) or (tTx – tC)
• Poor implementation: essential elements of the treatment are incompletely implemented.
• Contamination: The essential elements of the treatment group are found in the control condition (to varying degrees).
• Pre-existing similarities between T and C on intervention components.
• External validity – generalization is about (tTx - tC)• This difference needs to be known for proper generalization and future
specification of the intervention components

Fidelity Assessment Starts With a Model or
Framework for the Intervention
From: Gamse et
al. 2008

Fidelity as a Complex Phenomenon
• Common Grant Structure
• Aim 1: Does the intervention work?• efficacy
• Aim 2: Why does the intervention work?• mediation
• Aim 3: Under what conditions or for whom does the intervention work?• moderation

National Center for Research on Rural Education(PI: Sheridan; Co-PIs: Glover, Nugent, Kunz, & Bovaird)

A Randomized Trial of CBC in Rural EducationalSettings: Efficacy for Elementary Students with Disruptive Behaviors(PI: Sheridan; Co-PIs: Glover, Kunz, & Bovaird)

Let’s Reconsider the Order of Operations
• Revised Grant Structure• Aim -1: Why should the intervention work?
• Concept map of what constitutes the intervention• Prior task decomposition through pilot work, development studies, single-case designs,
etc.• Identify mediators to be explicitly studied in the future
• Aim 0: Under what conditions or for whom does the intervention work?• Quasi-experimental design studies, etc.
• Aim 1: Does the intervention work?• Yes, it does, because we’ve determined a priori how, for whom, and under what
conditions, and controlled for them.
Prior Studies
Replication + Extension

Perhaps a Simpler Construct Space for Evaluating Efficacy?

Thank you!
http://mapacademy.unl.edu
https://cehs.unl.edu/edpsych/faculty/james-
bovaird