methodology element assessment report...
TRANSCRIPT

METHODOLOGY ELEMENT ASSESSMENT REPORT: VCS
Version 3
v3.0 1
METHODOLOGY ELEMENT
ASSESSMENT REPORT
CAMPUS CLEAN ENERGY EFFICIENCY
METHODOLOGY
Document Prepared By: TÜV Rheinland (China) Ltd
Methodology Element Title
Campus Clean Energy Efficiency Methodology
Campus Clean Energy Efficiency Campus Wide Module
Campus Clean Energy Efficiency LEED Certified Buildings Module
Version 1.4, October 2013
Methodology Element Category
Methodology
Methodology Revision
Module
Tool
Sectoral Scope(s) 1 Energy industries (renewable / non-renewable sources)
3 Energy demand
METHODOLOGY ELEMENT ASSESSMENT REPORT: VCS
Version 3
v3.0 2
Report Title Methodology Element Assessment Report for Campus Clean Energy
Efficiency Methodology
Report Version 1.4
Report Number 01 997 91050_VCS-Meth2
Client Bonneville Environmental Foundation with the nominated contact person
being Sue Hall of Climate Neutral Business Network
Pages 85
Date of Issue 15-October-2013
Prepared By TÜV Rheinland (China) Ltd
Contact Unit 707, AVIC Building, No. 10B, Central Road, East 3rd Ring
Road,
Chaoyang District, Beijing 100022,
People’s Republic of China.
Tel.: +86 10 65 66 66 60 (ext.169)
FAX: +86 1065 66 66 67
E-mail: [email protected]
Approved By Mr. Henri Phan
Work Carried Out By Mr. Ma. Paa. Puratchikkanal
Mr. R Narendra Kumar
Mr. R. Murali
Work Reviewed by Dr. Manfred Brinkmann
Summary:
The VCS methodology team assigned by the DOE (TÜV Rheinland (China) Ltd.), here
after called TRC, is been assigned by “Bonneville Environmental Foundation” to
perform the assessment of the new VCS methodology “Campus Clean Energy
Efficiency”. The scope of the assessment is defined as an independent and objective
review of the methodology framework and associated modules. The information in
these documents is reviewed against VCS Validation and Verification manual v03.0,
VCS Program Guide v3.4, VCS Standard, v3.3 and other VCS rules.
The report is based on the assessment of the methodology framework & associated
modules undertaken through stakeholder consultations, application of standard
auditing techniques including but not limited to document reviews and interviews.

METHODOLOGY ELEMENT ASSESSMENT REPORT: VCS
Version 3
v3.0 3
Validation methodology and process
The assessment constitutes the following steps:
- Desk review of the methodology and the relevant documents
- Interviews
- Issuance of list of findings.
- Resolution of outstanding issues
- Issuance of final assessment report and opinion
Assessment criteria
The following VCS requirements have been considered:
- VCS Validation and Verification manual v03.0
- VCS Program Guide v3.4
- VCS Standard, v3.3
- VCS Program Definitions V. 3.4, 4
- VCS Guidance for Standardized Methods V. 3.2
The assessment protocol describes a total of (32) findings (Observations) which
include:
-(12) Corrective Action Requests (CARs);
-(10) Clarification Requests (CLs);
All the findings are successfully closed based on the response provided by the client.
TRC concludes that the description of methodology element “Campus Clean Energy
Efficiency” meets all relevant requirements of the VCS criteria for methodology
development.
The TRC therefore recommends that the approval of the methodology element as a
VCS methodology element.
METHODOLOGY ELEMENT ASSESSMENT REPORT: VCS
Version 3
v3.0 4
Abbreviations
ACUPCC American College & University Presidents’ Climate Commitment
ASHRAE American Society of Heating, Refrigerating and Air-Conditioning
Engineers
BAU Business As Usual
CACP Clean Air Cool Planet
CDD Cooling Degree Days
CAR Corrective Action Request
CDM Clean Development Mechanism
CH4 Methane
CL Clarification request
CO2 Carbon dioxide
CO2e Carbon dioxide equivalent
DOE Designated operational entity
GHG Greenhouse gas(es)
HDD Heating Degree Days
IPCC Intergovernmental Panel on Climate Change
LEED Leadership in Energy and Environmental Design
NGO Non-governmental Organization
tCO2e Tonnes of CO2 equivalents
TRC TÜV Rheinland (China) Ltd.
USGBC US Green Building Council
VCS Verified Carbon Standard
GWP Global Warming Potential
Table of Contents
1 Introduction ............................................................................................................... 7
1.1 Objective ............................................................................................................ 7
1.2 Scope and Criteria ............................................................................................. 7
1.3 Summary Description of the Methodology Element ........................................... 7

METHODOLOGY ELEMENT ASSESSMENT REPORT: VCS
Version 3
v3.0 5
2 ASSESSMENT APPROACH ..................................................................................... 8
2.1 Method and Criteria ............................................................................................ 8
2.2 Document Review .............................................................................................. 8
2.3 Interviews ......................................................................................................... 11
2.4 Assessment Team ........................................................................................... 11
2.5 Resolution of Any Material Discrepancy ........................................................... 11
2.6 Internal Quality Control .................................................................................... 12
3 ASSESSMENT FINDINGS ...................................................................................... 12
3.1 Applicability Conditions .................................................................................... 12
3.2 Project Boundary .............................................................................................. 15
3.3 Procedure for Determining the Baseline Scenario ........................................... 18
3.4 Procedure for Demonstrating Additionality ....................................................... 20
3.5 Baseline Emissions .......................................................................................... 26
3.6 Project Emissions ............................................................................................. 27
3.7 Leakage ........................................................................................................... 28
3.8 Quantification of Net GHG Emission Reductions and/or Removals ................. 29
3.9 Monitoring ........................................................................................................ 29
3.10 Data and Parameters .................................................................................... 31
3.11 Use of Tools/Modules ................................................................................... 31
3.12 Adherence to the Project Principles of the VCS Program ............................. 32
3.13 Relationship to Approved or Pending Methodologies ................................... 32
3.14 Stakeholder Comments ................................................................................ 32
4 Resolution of corrective action requests and Clarification requests ........................ 32
5 Assessment Conclusion .......................................................................................... 32

METHODOLOGY ELEMENT ASSESSMENT REPORT: VCS
Version 3
v3.0 6
6 Report reconciliation ................................................................................................ 33
7 Evidence of fulfilment of VVB eligibility requirements .............................................. 33
8 Signature ................................................................................................................. 33
Appendix-A List of Findings
Appendix-B Assessment of specific requirements pertaining to Performance
Benchmark Methodologies
Appendix-C Addendum regarding validation of VCS Standard requirement 4.5.6
(eligibility of ACUPCC reporting data)

METHODOLOGY ELEMENT ASSESSMENT REPORT: VCS
Version 3
v3.0 7
1 INTRODUCTION
1.1 Objective
The purpose of this assessment process is to have an independent third party
assess the proposed methodology with respect to VCS Validation verification
manual, VCS Standard, the Guidance for Standardized Methods and any other
applicable requirements set out under the VCS Program.
1.2 Scope and Criteria
The scope of the assessment is to assess the proposed methodology with
respect to the various VCS requirements. Besides the general requirements for
Standardized Methods these include in particular:
1. Eligibility criteria: Assessment of whether the methodology’s eligibility criteria are appropriate and adequate.
2. Baseline approach: Assessment of whether the approach for determining the project baseline is appropriate and adequate.
3. Additionality: Assessment of whether the approach/tools for determining whether the project is additional are appropriate and adequate.
4. Project boundary: Assessment of whether an appropriate and adequate approach is provided for the definition of the project’s physical boundary and sources and types of gases included.
5. Emissions: Assessment of whether an appropriate and adequate approach is provided for calculating baseline emissions, project emissions and emission reductions.
6. Leakage: Assessment of whether the approach for calculating leakage is appropriate and adequate.
7. Monitoring: Assessment of whether the monitoring approach is appropriate and adequate.
8. Data and parameters: Assessment of whether monitored and not monitored data and parameters used in emissions calculations are appropriate and adequate.
9. Adherence to the project-level principles of the VCS Program: Assessment of whether the methodology adheres to the project-level principles of the VCS Program.
1.3 Summary Description of the Methodology Element
The methodology element ‘Campus Clean Energy Efficiency’ is developed for US colleges and schools to quantify reductions in greenhouse gas (GHG) emissions which are achieved from energy efficiency measures. The Campus Clean Energy Efficiency Methodology document explains how the methodology

METHODOLOGY ELEMENT ASSESSMENT REPORT: VCS
Version 3
v3.0 8
can be applied to campuses. There are two ways to apply this methodology, and they are described in two separate modules:
· Campus Clean Energy Efficiency Campus Module: It describes Campus-wide energy-based GHG reductions, based on an inclusive campus-wide boundary. and
· Campus Clean Energy Efficiency LEED Certified Buildings Module: It describes energy-based GHG reductions from individual LEED certified New Construction (NC) or Existing Building (EB) buildings.
2 ASSESSMENT APPROACH
2.1 Method and Criteria
The methodology assessment consists of the following phases:
I a desk review of the proposed methodology and related documents
II follow up interviews
III Issue of a list of observations and findings, resulting in a draft assessment report
IV the resolution of outstanding issues and the issuance of the final assessment report
and opinion.
The following sections outline each step in more detail.
The draft methodology is reviewed against the relevant criteria (see above) and VCS policy
documents. The assessment is not meant to provide any consulting towards the developer of
the methodology. However, stated requests for clarifications and/or corrective actions may have
provided input for improvement of the methodology.
.
2.2 Document Review
The following table outlines the documentation reviewed during the verification:
Ref no. Reference Document
/P1/ /P1.1/ Methodology framework “Campus Clean Energy Efficiency”, version
1.2 dated 20-June-2013
/P1.2/ Methodology framework “Campus Clean Energy Efficiency”, version
1.3 dated September 5 2013
/P2/ /P2.1/ Campus-Wide Module, version 1.2, dated 18-June-2013
LEED Certified Buildings Module, version 1.2, dated 21-June-2013
/P2.2/ Campus-Wide Module, version 1.3, dated September 5-2013
LEED Certified Buildings Module, version 1.3, dated September 5-

METHODOLOGY ELEMENT ASSESSMENT REPORT: VCS
Version 3
v3.0 9
2013
/P3/ Methodology element assessment report of ‘Campus clean energy efficiency methodology’, prepared by DNV Climate Change Services AS, version 1.2, dated 15-August-2013
/P4/ VCS Association, Validation and Verification Manual, Version 3.0, 4 October 2012 VCS Association, VCS Standard, Version 3.3, 4 October 2012 VCS Association, VCS Program Guide, Version 3.4, 4 October 2012 VCS Association, VCS Program Definitions, Version 3.4, 4 October 2012 VCS Association, VCS Guidance for Standardized Methods, Version 3.2, 4 October 2012 VCS Association ,VCS Methodology Approval Process, Version 3.4, 4 October 2012
/P5/ C. Pyke, Existing building Energy Star scores for 2008 and 2009 from USGBC
database (EBOM.EAc1.pivot.for.Sue.xlsx)
/P6/ C. Pyke, Statistics on reductions in energy consumption for institutions of higher education and laboratory space, and K-12 institutions for the state of North Carolina (NC_Stats_EAc1_breakdown_for_Sue.xlsx)
/P7/ C. Pyke, NCCombined statistics on reductions in energy consumption for institutions of higher education and laboratory space, and K-12 institutions for
the state of North Carolina (Stats_EAc1_breakdown_for_Sue_1.xlsx)
/P8/ S. Hall, Energy Star leaders in buildings for 2005-2012 from Energy Star PM
Tool.
/P9/ S. Hall, 2011-2013 log of calls with advisors and contributors to the methodology
development (Communications Log draft.docx)
/P10/ S. Hall, Documentation of discussion with First Advantage and Second Nature about the draft methodologies, and additional information on the EPA PM tool (White Paper Summaries DRAFT May 9 2012 vs. 4[1].docx)
/P11/ S. Hall, July, 2012 summary of the methodological approach for LEED EB and NC using USGBC certified reporting data (White Paper Summary LEED July
3[1].docx)
/P12/ S. Hall, Summary of the methodological approach for campus wide scope 1
stationary source emissions (White Paper Summary Campus Wide Reductions
July 11 2012[1].docx)
/P13/ S. Hall, 2012 documentation of draft methodology including use of ACUPCC data and approach to stratification of institutions (White Paper Summaries Oct 29
update Campus wide MAIN[1].docx)
/P14/ S. Hall, Summary of general approach and requirements for the methodology
(White Paper Summary LEED July 3 Upgrades vs. 1 Aug 2 Sept 11 vs. 3 post
VCS oct 4 post chris oct 10 Oct 18 Oct 30 Nov 13 ADV[1].docx)
/P15/ S. Hall, Summary of the revised methodological approach for LEED EB and NC with further definition of segmentation and performance metrics (White Paper
Summary LEED Nov 2012[1].docx)
/P16/ S. Hall, Summary of the revised methodological approach for campus wide scope 1 stationary source emissions (White Paper Summary Campus Wide Reductions
Nov 2012[1].docx)
/P17/ Pyke, C. Transparency for a project http://www.gbig.org/activities/leed-
1000000117

METHODOLOGY ELEMENT ASSESSMENT REPORT: VCS
Version 3
v3.0 10
Click on LEED Dashboard and Compare to show the distributions used in the
methodology.
/P18/ The Green Building Information Gateway, Transparency for a building over time bridging new construction to
operations (http://www.gbig.org/buildings/2777%20Crystal%20Dr,%20Arlington
,%20VA%2022202,%20USA)
/P19/ The Green Building Information Gateway, Transparency for an existing building
over time
(http://www.gbig.org/buildings/320%20Park%20Ave,%20New%20York,%20NY
%2010022,%20USA)
/P20/ Chevy “Carbon Stories” web site http://www.chevrolet.com/environmental-
projects/carbon-reduction/
/P21/ C.Pyke to Sue Hall, Climate Leadership Awards Recognize Sustainable Colleges
(http://planetforward.org/climate-leadership-awards/) 21 March 2012
/P22/ S. Hall, Carbon Map Draft V 1.0, xls. 15 March, 2012, Estimates of carbon reductions at example campuses based on data from Second Nature and
ACUPCC.
/P23/ S. Hall, Chevy_Carbon_Credit_Data analysis 6 SN funds - PAT April30 SH May
3 Bottom 50%.xls, 7 May 2012, Data from ACUPCC sorted according to degree granting type, and including emissions and building areas.
/P23/ R. Koester, rjk_tweaks_VCS Methodology Template v3-1 2 College Draft 9 Dec
10.doc. Review of draft methodology by Dr. R. Koester, Ball State U.
/P25/ P. Nye, S. Muzzy and S. Hall, Email on data analysis, 27 March 2012
/P26/ S. Hall, Summary of the adjustment equations for increase/decrease of building area (sq. ft.) to be used in methodology (SQ Ft Eq 2A (2).xls), 11 April 2013,.
/P27/ EPA PM tool https://www.energystar.gov/index.cfm?fuseaction=target_finder
/P28/ EPA Energy Star Target Finder
https://www.energystar.gov/index.cfm?c=new_bldg_design.bus_target_finder
/P29/ About Energy Star https://www.energystar.gov/index.cfm?c=about.ab_index
/P30/ ACUPCC Reporting System http://rs.acupcc.org/stats/
/P31/ USGBC data http://www.gbig.org/about/data
/P32/ S. Hall, Stakeholder comments, 28 May 2013. PDF of correspondence listing issues addressed.
/P33/ US, DOE, EIA Commercial Buildings Energy Consumption Survey (CBECs) :
http://www.eia.gov/consumption/commercial/2012-cbecs-building-sampling.cfm
Since 1979, a national survey that collects information U.S. commercial buildings, their energy-related building characteristics,. Commercial buildings
include all buildings in which at least half of the floor space is used for a purpose that is not residential, industrial, or agricultural,
/P34/ World Business Council for Sustainable Development (WBCSD) & World
Resources Institute (WRI), The Greenhouse Gas Protocol: A Corporate Accounting and Reporting Standard, March 2004
/P35/ International Organization for Standardization, ISO 14064-2:2006 - Greenhouse gases -- Part 2: Specification with guidance at the project level for quantification,
monitoring and reporting of greenhouse gas emission reductions or removal
METHODOLOGY ELEMENT ASSESSMENT REPORT: VCS
Version 3
v3.0 11
enhancements
/P36/ The Ohio State University Scope 1 & 2 GHG Emissions (Spreadsheet)
/P37/ ACUPCC Data Stat1 Scope2 Curves Outliers Removed 21February2013.xlsx
(Spreadsheet, confirmed vs. ACUPCC homepage)
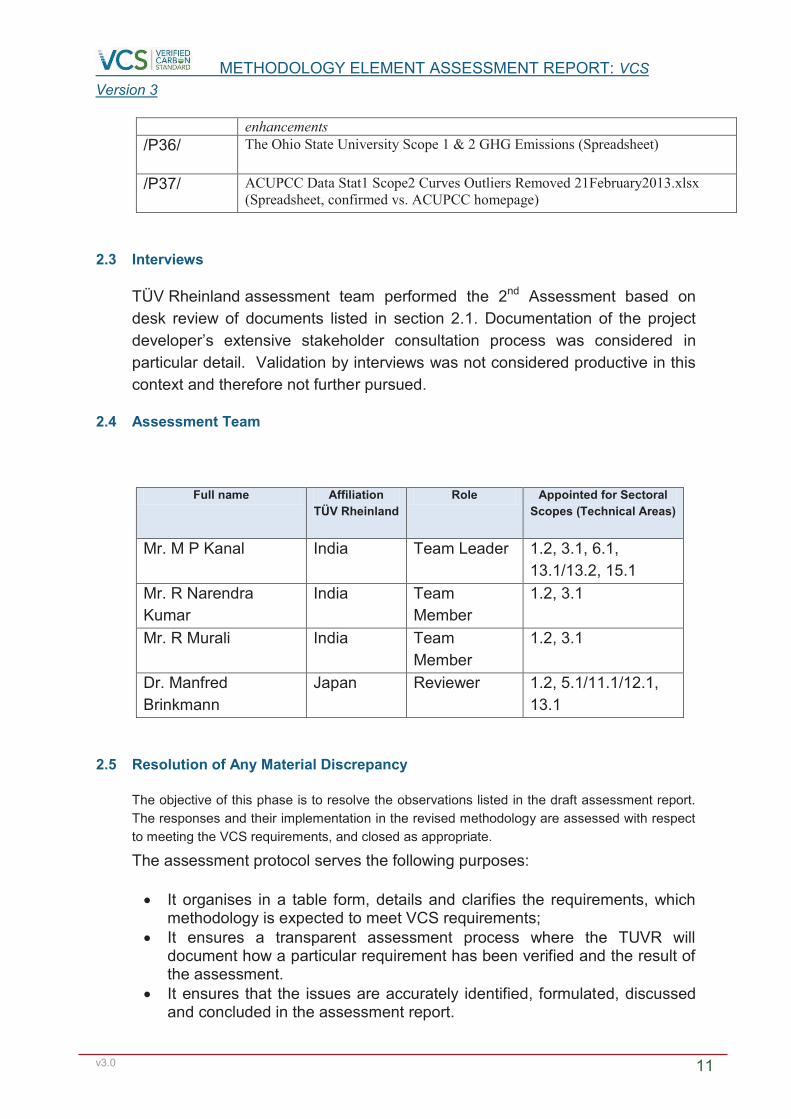
2.3 Interviews
TÜV Rheinland assessment team performed the 2nd Assessment based on
desk review of documents listed in section 2.1. Documentation of the project
developer’s extensive stakeholder consultation process was considered in
particular detail. Validation by interviews was not considered productive in this
context and therefore not further pursued.
2.4 Assessment Team
Full name Affiliation TÜV Rheinland
Role Appointed for Sectoral Scopes (Technical Areas)
Mr. M P Kanal India Team Leader 1.2, 3.1, 6.1,
13.1/13.2, 15.1
Mr. R Narendra
Kumar
India Team
Member
1.2, 3.1
Mr. R Murali India Team
Member
1.2, 3.1
Dr. Manfred
Brinkmann
Japan Reviewer 1.2, 5.1/11.1/12.1,
13.1
2.5 Resolution of Any Material Discrepancy
The objective of this phase is to resolve the observations listed in the draft assessment report.
The responses and their implementation in the revised methodology are assessed with respect
to meeting the VCS requirements, and closed as appropriate.
The assessment protocol serves the following purposes:
· It organises in a table form, details and clarifies the requirements, which methodology is expected to meet VCS requirements;
· It ensures a transparent assessment process where the TUVR will document how a particular requirement has been verified and the result of the assessment.
· It ensures that the issues are accurately identified, formulated, discussed and concluded in the assessment report.

METHODOLOGY ELEMENT ASSESSMENT REPORT: VCS
Version 3
v3.0 12
Findings during the assessment can be interpreted as a non-compliance with
VCS criteria or a risk to the compliance.
2.6 Internal Quality Control
The final assessment report underwent a technical review by a qualified independent
technical reviewer before submitting to VCS approval. The technical review was
performed by a technical reviewer qualified in accordance with TÜV Rheinland’s
qualification scheme.
2.7 Other Changes
Certain modifications have been made to the methodology as a result of input from other
sources (e.g. DNV/VCS or stakeholder/pilot project discussions) during the assessment. The
team has reviewed also these refinements and concludes them to be appropriate. For
completeness sake, they include:
· Changing references for “internal leakage” to “PE adjustments for PEDy”
o to avoid confusion with leakage terminology referring to outside the project boundary
· Clarification regarding applicability conditions for EB-B
o confirms earlier implied criteria explicitly
· Refinements addressing updates to the EPA Target Finder tool made by US EPA
o clear, consistent updates given new tool’s formatting
3 ASSESSMENT FINDINGS
3.1 Applicability Conditions
Eligibility criteria for projects using this methodology are described separately for Campus-Wide
Module and LEED Certified Buildings Module. However common applicability conditions are
described in the methodology framework document.
The geographical scope of the proposed methodology is currently limited to the United States college
campus, consistent with the availability of relevant baseline information which has been confirmed.
Also the campus GHG/energy reduction reporting should be made through credible third party
programs eligible under the methodology, whose reporting protocols are credible for GHG project
crediting purposes. The methodology framework also specifies some special conditions to use this
methodology that preclude double counting and double claiming e.g. projects should have secured
rights of ownership; emission reduction from energy services supplied to customers should be
excluded. Discussions with stakeholders and experts (e.g. USGBC VP R&D) confirmed the
appropriate application of the EPA TF categories given the recent EPA updates to this tool.
Similarly specific applicability conditions to use the modules are given in the respective modules. As
updated, they clearly specify the conditions upon which the methodology/module can and cannot be

METHODOLOGY ELEMENT ASSESSMENT REPORT: VCS
Version 3
v3.0 13
applied. These applicability conditions are clear and comprehensive (see comments below relative to
4.1.17, 4,3,4, 4.3.5, 4.3.6 and observations 17, 18, 24, 25, 26, 28).
The applicability conditions require the identification of implementation of strategies which gave rise to
the project’s performance based upon an analysis of strategies adopted by leading proponents
(ACUPCC top college performers (those achieving the module benchmarks, within top 15%) and
LEED certified building requirements (1% of US buildings performing within top 14% on average)
which will be updated every five years to ensure these requirements remain current. As required for
methodologies using a performance method for determining additionality, the methodology thus
explicitly specifies technologies and/or measures with the requirement that a minimum of two such
measures have been adopted.
Whereas these specified technologies will be demonstrably proven technologies, their implementation
must be confirmed though not their individual contribution to the emission reductions. Due diligence
was applied in consideration of the module’s definition of the project starting date which was found to
be satisfactory. (See below boxes regarding “Activities / Technologies” and “Project Start date
Determination”, respectively.)
Activities/Technologies:
The VCS guidelines do not require to separately determining for each of the separately undertaken
activities deliver substantive reductions. Rather the requirement is that the substantive reductions are
to be achieved via the specifications of the Performance Benchmark (PB). VCS guidance requires
that activities be specifically identified: in the performance meth committee, it was clear that a “black
box” was not sufficient – activities need to be identified and implemented. But not a performance
analysis for each one. The stakeholder process is the means to determining these PB levels not
separate levels of technology performance:
“The objective of the expert consultation is to ensure that the level of the performance
benchmark metric provides both environmental integrity and sufficient financial incentive to
potential projects. ... The purpose of the expert consultation is to provide input on the appropriateness of the level of the performance benchmark metric."
Thus substantial performance improvement – which is assured by the performance metric itself –
does not require detailed descriptions of the activities or their separate performance.
The VCS guidance recognizes that a performance metric may not and need not even itemize the
individual contributions towards such performances from individual technologies (which would require
submetering in this case). " while a good understanding of the technologies or measures that
are available for improving performance in the sector improving performance in the sector is
useful, a detailed description of these is not necessarily required" Indeed, VCS provides that a
methodology can provide examples of activities rather than explicitly identifying required activities:
(note use of term “such as”) so that methodologies would provide "examples of such technologies
or measures where it is not possible to be explicit about the precise technologies or measures
that projects may actually implement" Since it is possible to just provide examples of potential
technologies, their performance cannot again be a prerequisite.
The onus is to identify technologies as implemented as the sole onus: "demonstrate that it has
implemented some form of technology and/or measure. Note that the project proponent’s

METHODOLOGY ELEMENT ASSESSMENT REPORT: VCS
Version 3
v3.0 14
motivation in implementing the technologies and/or measures is not a consideration. Rather, it
“just needs to be established that implementation has occurred." This methodology moves
beyond this level to require that several activities have been interview from among a list of those
demonstrated to have been adopted by campuses delivering at the PB performance level. (See App
5) (Note that, in this context (4.2), the module’s use of language “has been employed” is recognized
as clearly meaning that the activities have been implemented (per VCS discussion).)
The list of activities is inclusive (via an open list) since it is well recognized that EE performance
depends upon the compounding benefits that EE activities deliver. Since the EE benefits compound, it
would be inappropriate to exclude any of these activities as not contributing towards substantial
performance improvement achieved per the PB performance levels attained. Furthermore every
activity has been documented as implemented by colleges achieving substantial performance
improvements through an analysis of the outstanding campus performer’s Climate Action Plans and
the LEED buildings’ activities undertaken to reach high LEED performance levels. .
Project Start Date Determination:
The VVB’s have discretion to confirm (whether using performance or project methodologies) an
appropriate start date for projects. Since (in all these cases) the date is not one fixed entity (e.g.
spade breaks ground) but can cover a range over which projects are implemented (e.g. phase I, II, III
or as systems are deployed across a million homes (CFLs) or all campus buildings), VCS has already
tasked VVBs with confirming appropriate project start dates in all project validations. This same
discretion will therefore be applied in this methodology.
VCS defines project start date is “the date on which the project began generating GHG emission
reductions or removals”. The start dates used in the methodology is the commencement of an
ACUPCC GHG reporting period – which is the time when the project’s GHG emission reductions
begin. VVB’s consider this a sensible anchor point. This is particularly sensible for a performance
methodology since there will typically be more than one activity (per our applicability conditions) –
consistent with the purpose of a performance meth which is to establish BBAU performance without
reference to a single, exclusive technology. Thus since there will be activities each of which have
may a different implementation timeline, the beginning of the ACUPCC reporting period in which the
substantial GHG reductions arise is a sensible project start date.
This approach has several other benefits:
- it provides consistency with the ACUPCC public reporting, promoting transparency and integrity
- it is consistent with the basis upon which the PB metrics were derived – which was based on annual
change in emissions between AUPCCC reporting years
- as the date when GHG reductions are first visible it nonetheless enables some activity
implementation window to have begun such that reductions in project year 1 have comparable depth
as the PB metrics, in the analysis, have achieved
- since this is also the date from which project year 1 begins, it ensures that all the credits issues from
project start date onwards are additional. (Had some earlier date been randomly picked, there would
have not yet been any assurance of additionality at that point in time since the PB would not have

METHODOLOGY ELEMENT ASSESSMENT REPORT: VCS
Version 3
v3.0 15
been passed). Note again as above that additionality is not based on a project-based assessment but
upon when the project has passed the PB performance benchmarks.
- it is conservative: to the extent (as with other VCS projects) that there has been some gradual “pre-
implementation” of reductions, this will serve to make the baseline and ER’s more conservative
(smaller)
- stakeholders, whose role is to establish the PBs, supported this approach per VCS guidanceThe
module does not stipulate the ”first date” of the fiscal or calendar year of ACUPCC reporting because
a) in order to be consistent with ACUPCC guidance, which allows campuses to report 12 continuous
months’ GHG data which ACUPCC does not necessarily stipulate to be fiscal or calendar years; and
b) campuses may have good reasons to not put forward the beginning of a fiscal or calendar year as
the start of their project year 1 reporting (e.g., if they seek to meet a GHG goal specified for a
particular date which does not coincide with the beginning of their ACUPCC reporting schedule and
do not want to start selling credits prior to that date to avoid double counting).
Specifically, the applicability conditions for the LEED module relative to pathways
NC, EB-A and EB-B are well founded. The inclusion of the previously implied logic
regarding EB-B has now been referenced explicitly such that LEED EB projects
which would not have been eligible for LEED certification during the baseline period
select EB-A: those with LEED certifiable baselines select EB-B. The EB-A and EB-B
pathways are thus mutually exclusive. The upgrades in the references to the use of
the EPA TF tool are clear with comprehensive directions now provided in Appendix
2B relative to the building categories selected. (See observations17, 18, 24, 25, 26,
28)
The applicability conditions mentioned in the methodology and module are therefore
found to be appropriate for the methodology context.
Hence the team confirms that the applicability conditions of the methodology and frameworks are sufficient to establish whether the methodology could be applied to a proposed project activity.
3.2 Project Boundary
The project boundary requirements for the methodology are described in section 5 of the each module.
Campus-Wide Module:
As per this module, the project boundary and included sources, sinks and reservoirs are described on p. 17-21. The SSR are defined to be consistent with those used to report to the third party GHG reporting entity (e.g. ACUPCC, STARS etc). The campus module includes both stationary combustion and scope 2 electricity

METHODOLOGY ELEMENT ASSESSMENT REPORT: VCS
Version 3
v3.0 16
emissions1 in the project boundary but emission reductions can be claimed optionally in either scope1 and/or scope 2. A table outlining the separate scope 1 and scope 2 emission sources not included under the broad VCS scope 1 and scope 2 designation has been added to the project boundary section to ensure a clear link between AUCPCC/user terminology and the broader GHG scope 1 & 2 terms In the project boundary section the term “scope 1” has been retained; in the module, consistent with the project boundary delineations (focused on stationary combustion and scope 2 electricity reductions) and user requests, the ACUPCC used terminology (see footnote) has been used in other sections. Stationary 1 reductions, to be consistent with ACUPCC labelling, is now referenced as “stationary combustion” rather than “stationary 1 combustion”.
Regarding the gases to be included in the project boundary, CO2 emissions
from scope 1 stationary on-site energy generation/combustion systems and
the CO2 emissions related to scope 2 electricity consumption are mandatorily
to be included in the boundary for both in baseline and project condition. The
module also provides the option to consider CH4 and N2O emissions from
scope 1 stationary on-site energy generation/combustion systems and related
to scope 2 electricity consumption. This is consistent with the reporting
formats used by ACUPCC/STARS (See finding 19). The modules generally
refer to CO2e, campuses historical baseline and ER-calculation must be
consistent in the choice of whether or not to apply CH4 and N2O.
For clarity’s sake, the modules now refer to emissions in tons CO2e, since
projects opting for CO2 logically are subsumed under CO2e (with notes
added for clarity in the project boundary section)2. it is appropriate to give
projects the choice for reporting CO2 and CO2e since a) the differences for
energy-based projects is minimal (est’d at 0.1%) and ER is based on the
difference between BE and PE, which, provided that are calculated on a
consistent basis (both CO2 or both CO2e) is credible; b) there are CDM
1 For definitions of “stationary combustion” and “scope 2 electricity emissions”, please refer to the
ACUPCC "Instructions for Submitting a Greenhouse Gas Report" (see
http://rs.acupcc.org/instructions/ghg/ ). These definitions are correctly entered in the methodology
modules. For consistency with the reporting guidelines and actual reporting data, it is preferable to
apply these terms also in this context.
2 Where emissions in the campus module earlier referred to CO2, they now refer to CO2e. Since the
project boundary provides the option to report on CO2 only basis, CO2e is a satisfactory label (since
CH4 and N2O are not required to be included). A note has been made to this effect in the SSR table
in section 4 (e.g. if you’re reporting as CO2 rather than CO2e in this module then the emission
references to CO2e below will not include methane and N2O.)

METHODOLOGY ELEMENT ASSESSMENT REPORT: VCS
Version 3
v3.0 17
precedents in JI for this approach, which is acceptable in a VCS system for
performance methodologies which has a bottom up development process; c)
ACUPCC allows campuses to report CO2 or CO2e so reporting guidance and
provisions are consistent; d) ACUPCC reporting systems provide the needed
calculations for CO2 and CH4 N2O emissions such that the latter do not need
separate equations referenced (as agreed above for CO2) since module
builds on ACUPCC reporting. VVB monitoring will be made (as below)
against these reporting guidelines.
Both the emissions from stationary on-site combustion systems and the
emissions related to scope 2 electricity consumption need to be quantified
when applying test 1 of the additionality test, i.e. the campus’ annual average
change in the project’s total GHG emissions must be equal to or less than
zero as calculated over the additionality eligibility period. As a result, the
project boundary, which incorporates both stationary combustion and scope 2
electricity emissions as described, is appropriate even when projects can
elect to secure credits in either stationary 1 or scope 2 electricity reductions.
Provisions are nonetheless made for project adjustments via PEDy if
stationary combustion or scope 2 electricity reductions are selected
individually; this approach is therefore consistent with and sustains the project
boundary selected.
LEED Certified building Module:
As per this module the project boundary is the same as the boundary definition applicable in the LEED NC or EB certification. If the GHG reductions from energy generation systems are located within the project boundary but provide services beyond the project certified building then their GHG’s should be excluded from the project boundary. Similarly in the case where GHG from the installation of renewable energy systems within the LEED certified building project boundary, but its energy services or carbon reductions or renewable attributes have been sold to other third parties, then related GHG also should excluded from the project boundary. Both stationary combustion and scope 2 energy emissions are included in the project boundary, consistent with the LEED certification basis. The project boundary setting is therefore conservative and credible.
Regarding the gases to be included in the project boundary, all CO2, CH4 and N2O emissions from scope 1 stationary on-site energy generation/combustion systems and the CO2 emissions related to scope 2 energy consumption are mandatorily to be included in the boundary for both in baseline and project condition. The LEED module does not provides any optional gas to be considered in the project boundary. Since this is consistent with the CO2e reporting for GHG from the EPA Target Finder tool and LEED’s energy systems, the boundaries set are appropriate. (See finding 19)The project boundary for both the Campus-wide and LEED certified building Module includes the emissions that are targeted by the measures/technologies
METHODOLOGY ELEMENT ASSESSMENT REPORT: VCS
Version 3
v3.0 18
implemented on campus and that are within the control of a campus project proponent. Hence TUVR concludes the project boundary defined in the methodology is
appropriate, adequate and in compliance with the VCS Standard.
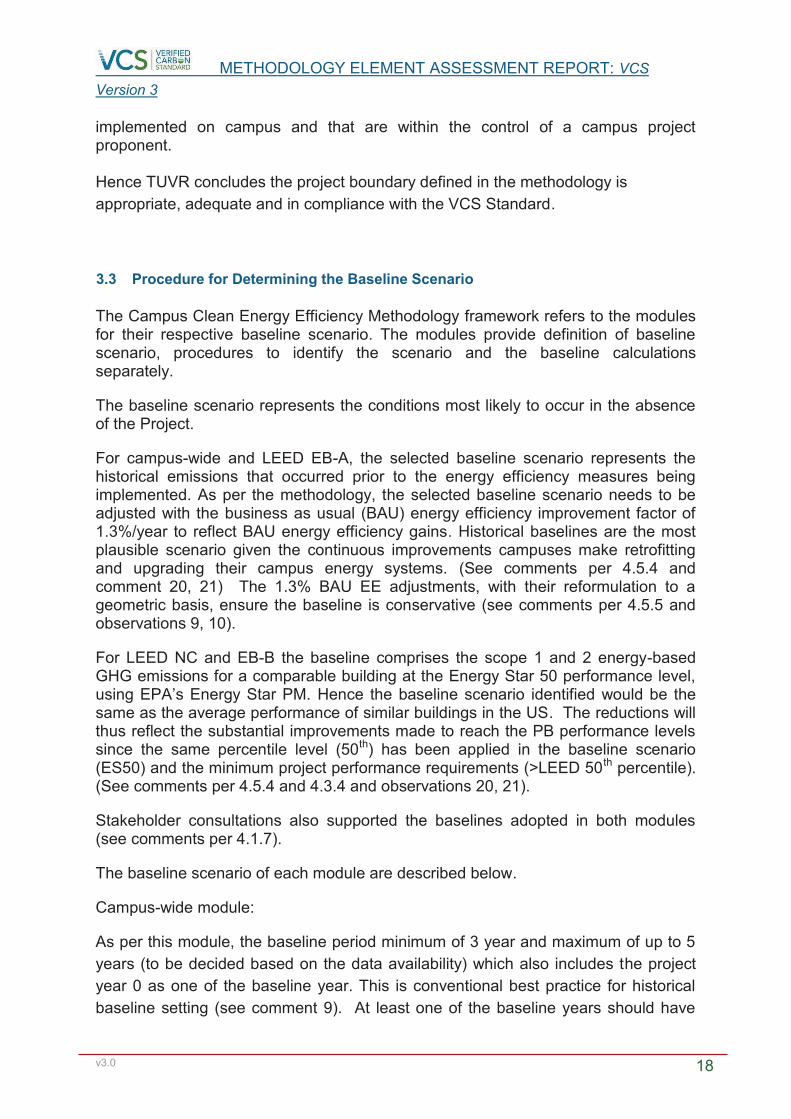
3.3 Procedure for Determining the Baseline Scenario
The Campus Clean Energy Efficiency Methodology framework refers to the modules for their respective baseline scenario. The modules provide definition of baseline scenario, procedures to identify the scenario and the baseline calculations separately.
The baseline scenario represents the conditions most likely to occur in the absence of the Project.
For campus-wide and LEED EB-A, the selected baseline scenario represents the historical emissions that occurred prior to the energy efficiency measures being implemented. As per the methodology, the selected baseline scenario needs to be adjusted with the business as usual (BAU) energy efficiency improvement factor of 1.3%/year to reflect BAU energy efficiency gains. Historical baselines are the most plausible scenario given the continuous improvements campuses make retrofitting and upgrading their campus energy systems. (See comments per 4.5.4 and comment 20, 21) The 1.3% BAU EE adjustments, with their reformulation to a geometric basis, ensure the baseline is conservative (see comments per 4.5.5 and observations 9, 10).
For LEED NC and EB-B the baseline comprises the scope 1 and 2 energy-based GHG emissions for a comparable building at the Energy Star 50 performance level, using EPA’s Energy Star PM. Hence the baseline scenario identified would be the same as the average performance of similar buildings in the US. The reductions will thus reflect the substantial improvements made to reach the PB performance levels since the same percentile level (50th) has been applied in the baseline scenario (ES50) and the minimum project performance requirements (>LEED 50th percentile). (See comments per 4.5.4 and 4.3.4 and observations 20, 21).
Stakeholder consultations also supported the baselines adopted in both modules (see comments per 4.1.7).
The baseline scenario of each module are described below.
Campus-wide module:
As per this module, the baseline period minimum of 3 year and maximum of up to 5
years (to be decided based on the data availability) which also includes the project
year 0 as one of the baseline year. This is conventional best practice for historical
baseline setting (see comment 9). At least one of the baseline years should have
METHODOLOGY ELEMENT ASSESSMENT REPORT: VCS
Version 3
v3.0 19
been reported via an ACUPCC/STARS or any credible third party GHG public
reporting period. The baseline year data should be in consistent with the
ACUPCC/STARS or any third party GHG public reporting data3. This supports the
integrity of the baseline by ensuring that it is established is based upon the same
transparent peer-reviewed data that the campuses report publicly. The selected
baseline period for stationary combustion reduction and scope 2 electricity
reductions do not need to be same if both the credits are sought separately: further
notations were applied to confirm that the campus-wide module is to be applied
separately for each source of credits sought. (See comment 6)
The module also provides (in appendix 3), the baseline adjustment calculation if the
campus area declines or increases by more than 5% during the baseline year. This
ensures that the baseline is developed on a conservative basis. (See comment 3)
LEED Certified Buildings Module:
For new construction (NC), the baseline comprises the scope 1 and 2 energy-based
GHG emissions for a comparable building at the Energy Star 50 (ES 50)
performance level, as determined by using EPA’s Portfolio Manager Target Finder
tool (which ensures comparable region, size, occupancy, weather and other salient
factors). Regulatory codes referenced are as defined in the LEED NC certification
system for the building’s region (as referenced in the module).
For Existing Building (EB-B) category, the baseline comprises the scope 1 and 2
energy-based GHG emissions for a comparable building at the Energy Star 50
performance level, as determined by using EPA’s Portfolio Manager (which ensures
comparable region, size, occupancy, weather and other salient factors).
As supported through the stakeholder consultation process, these baselines reflect
the conditions most likely to occur in the absence of the project. The use of the EPA
TF tool for CO2 calculation purposes ensures that appropriate baseline adjustments
are taken into account credibly.
3 Since the campus-wide baseline is based on historical emissions, it does not need justification under
4.5.6. Emissions will be verified under monitoring procedures by VVB’s as further incorporated in the
module for clarity. The eligibility of ACUPCC data to create the performance benchmarks is
referenced in Additionality section below and appendix A.

METHODOLOGY ELEMENT ASSESSMENT REPORT: VCS
Version 3
v3.0 20
For Existing building (EB-A) category, the baseline scenario comprises the project
building’s historical scope 1 and 2 energy based GHG emissions prior to project start
date. Similar to the campus module, best practices approaches are used to specify
the baseline: the EB-A will use a baseline averaged over at least three of the last five
years emissions based on the data availability. The CO2 emissions for the baseline
will be determined using EPA’s Portfolio Manager Target Finder tool on a repeat
basis (again ensuring comparable region, size, occupancy, weather and other
factors are considered). This baseline is follows the same requirements as the LEED
pilot credit-67 documentation (discussions with USGBC VP R&D confirmed that no
contiguous three year period was required (as used in pilot credit 67)): a s a result,
this EB route could draw upon historical baseline data which would not be available
for EB-B buildings. It is noted that consistency for the EB-A baseline with credit 67’s
approach does not imply that credit 67 is a required applicability condition as the
module’s reference in the Applicability Conditions section makes clear by its use of
the term “preferably” which does not confer a mandatory requirement. Similarly,
when the module references the option for higher education laboratories to use
EPA/DoE’s LAB 21 tool to establish the EUI’s for EB-A, this is given as an option
(not required): any use of such tool will be subject to VVB monitoring to ensure that it
has been used appropriately consistent with the LAB 21 reporting procedures (see
Monitoring section).
TUVR assessed that the defined baseline scenario and procedures and calculations are appropriate, adequate and in compliance with the VCS Standard. 3.4 Procedure for Demonstrating Additionality
The additionality eligibility tests are provided for each module separately. The modules provide two pre-tests which are to be conducted before the additionality test. The additionality test methods of each module are explained below:
3.4.1 Campus-wind module:
Pre-tests A & B:
The additionality pre-tests are provided whether stationary combustion and/or scope 2 electricity reductions are sought. The Regulatory Surplus test (renamed from the earlier “PreTest A”) is to ensure that the project was not mandated or required by local state or federal law or regulation and the pre-test B (now referenced as the “Square Foot Variance Test”) is to make corrections in the emission figures if the campus area declines or increases by more than 5% during the baseline period. These tests are appropriate and logically positioned. Performance Tests:

METHODOLOGY ELEMENT ASSESSMENT REPORT: VCS
Version 3
v3.0 21
Test 1 is to confirm that the project campus’ annual average percentage change in the project’s total GHG emissions comprising total stationary combustion plus scope 2 electricity based GHG emissions must be equal to or less than zero as calculated over the additionality eligibility period relative to project year 1 emissions. This test imposes further constraints and performance requirements upon a campus than Test 2 would achieve on a stand-alone basis, strengthening the beyond business as usual performance requirements; it is also consistent with the project boundary definition. The test 2E & 2S are to confirm that the campus’ annual average percentage reduction in stationary combustion GHG emissions and/or Scope 2 must be equal to or greater than their respective performance benchmark PBSc and PBEc respectively .
The additionality eligibility period can be selected between 1 to 5 years. The methodology stipulates that the additionality eligibility period should preferably be at least two years due to the averaging effect that a longer additionality eligibility period has, thus addressing possible weather effects (since the percent reduction per year in GHG emissions is calculated over longer periods of time). (Note that Eq 3 now includes S1TP in denominator for averaging purposes.) This is a cogent approach since (similar to the baseline calculations) longer periods over which the average percentage reduction is calculated are preferable (to take account of weather variances). However, if a single year comprises the additionality eligibility period, weather adjustments must be made to the emissions data: the performance test 1B, 2S-B and 2E-B are provided for this purpose. (See observations 3, 4,5,6,7,8,27,28) The flexibility provided in the selection of the additionality eligibility period is well suited to reflect the period of time over which beyond business as usual measures were selected and implemented by campuses; the additionality eligibility period selected must nonetheless be validated by VVB. This is consistent with the discussion of project start dates as referenced in section 3.1 above. There is a clear hierarchy for weather adjustment procedures, now reinforced for clarity in a table in this section of the module, such that establishing the additionality eligibility period does not facilitate gaming. This hierarchy logic establishes that: a) firstly, projects must assess (test 2A) PBS/PBE across a 2-5 year additionality eligibility period; here there is no adjustment of individual emission terms – rather weather fluctuations are addressed through averaging the % reduction projects achieve of the period; b) if test 2A fails, then project must test PBS/PBE in a 1 year additionality eligibility period, in which it is compulsory that weather adjusted terms must be used (per test 2B); c) since the Test 2B equations are of first order approximation only, if a project fails Test 2B, it is only fair that additionality can then be assessed via Appendix 6 regression analysis only for a one year additionality eligibility period: this is left to the last rung in the hierarchy due to its expense and complexity. Thus the hierarchy for establishing the additionality eligibility period is clear and unambiguous

METHODOLOGY ELEMENT ASSESSMENT REPORT: VCS
Version 3
v3.0 22
There thus are no inappropriate incentives towards selecting a shorter rather than
longer additionality eligibility periods: since the campus module performance tests
comprises not only Test 2 but also Test 1 (where absolute reductions in stationary
combustion plus scope 2 electricity emissions must be achieved relative to project
year 1), projects will only considered additional if both tests are passed. From
reviews of a dozen pilot projects, it is unusual for projects – even those delivering
at the top 15% of PBS/PBE reduction levels, to pass test 1 in every year; typically
projects are additional in only 1 or two out of the total 5 years in which additionality
can be evaluated. Furthermore, the way in which EE measures compound their
GHG reduction benefits does not result in a simple straight-line improvement in
reductions secured (as conceived in the simplified VCS “thought experiment”).
Thus, although it might at first be thought that, under a simple math model, there
would be an incentive towards shorter additionality eligibility periods, (due to the
number of years featuring in the denominator) (countering the instruction towards
selecting longer periods), the pilot projects confirm that eligible periods do not
follow this logic. Furthermore, the hierarchy instructing the selection of the
additionality eligibility period is clear and unambiguous so no gaming is possible:
longer periods must be selected if passed.
It should be noted that there is indeed equivalency between the weather adjustment approaches. The performance benchmarks assess whether the GHG reduction achieves a specified annual average percentage reduction: given the weather variance that arise, (say 6% between project year 1 and first year of additionality eligibility period), this would impact the project’s annual percent reduction with a similar variance. Thus, if such a variance arises over a single year’s additionality period, it would best be addressed through adjustment of emission terms since the variance could be beyond materiality thresholds. However, the averaging process that takes place in equations 3, 8 and 10, for eligibility periods of 2-5 years, reduces such a variance to 1% (for 5 years) and 3% (for 2 years), well below de minimis thresholds. Thus the approach taken for additionality eligibility periods of 2-5 years in length is sound. The assessment team has confirmed this also by investigating pilot case study reviews from fall 2012 for doctoral colleges. Analysis of the data (e.g. /P36/) indicates a variance within less than 5%, i.e. materiality thresholds for the normalized emissions from stationary combustion over a period of 11 years. Further evaluation of ACUPCC data /P37/ for periods of 2-6 years yields similar results. The assessment team therefore concludes that the duration of eligibility period (1 year vs. 2-5 years) is not having a material effect on the validity of results. Regarding the question as to whether other natural fluctuations could occur on campuses (e.g., changes in head-count) to enable campuses to qualify unduly against the performance benchmarks, the assessment team confirmed that these questions were given careful consideration (consistent with Appendix 5 and the stakeholder reviews) and integrated into the modules. In particular, whereas campuses are typically growing, in the instance when campuses might serve
METHODOLOGY ELEMENT ASSESSMENT REPORT: VCS
Version 3
v3.0 23
fewer students, this is addressed by means of the square foot variance procedures specified. It is recognized that the number of students served broadly correlates to the size of the campus. The module therefore addresses square foot variance, especially declines, via the Square Foot Variance Test and Appendix 3. Particularly careful consideration is given to circumstances in which campuses were able to deliver the same level of service per capita while decreasing physical footprint, since this is a particularly demanding sustainability goal that the most aggressive campuses set for themselves. Thus appendix 3 allows for campuses to not adjust for square foot declines if the services delivered to students (as measured in CO2 per capita) has remained constant or declined. Thus other material fluctuations have been carefully integrated into the module algorithms. Other factors that could possibly cause material fluctuations are not considered plausible. The module’s application of the EPA TF tool has been updated to reflect changes EPA made in the July 2013 update publication of its tool. The categories that LEED buildings use has been reviewed and endorsed by LEED’s expert R&D group. The use of the “office” category for “higher education” buildings and laboratories was considered by LEED experts as the most appropriate category to use: for laboratories this is especially conservative, since typical EUI’s can range at >400 BTU/ft2 whereas the office category designation (of 200 BTU/ft2) creates a very conservative baseline. Clarifications have been also made to ensure that it is clear that a) the EB-A baseline does not need to have three contiguous years’ data, following discussions with USGBC; b) use of the GBIG portion is optional and its use does not affect project eligibility (the tool merely allows LEED projects to group more easily to facilitate credit sales for very small projects); c) use of LAB 21 to derive higher ed labs’ EUI for EB-A is optional, not required; d) while the PB has been design to be consistent with LEED’s credit 67, a project’s use of credit 67 for EB-A not required by is only optional; e) the source of the regulatory code for NC is found in the LEED certification documents. The application of the EB-A performance benchmark (20% improvement in a single year) was, according to records /P11/, supported by LEED’s expert R&D group; this is consistent with EPA’s definition of the percentage improvements for which they award an Energy Star Partner designation; regardless, this performance benchmark also reflects the consensus stakeholder agreement regarding the appropriate performance benchmark for the EB-A category which, consistent with VCS requirements regarding how to establish a performance benchmark, is determinative. Modules have also now included provisions such that the project performance corresponding to the meeting the “at minimum” eligibility threshold in year 1 to pass the Performance Benchmark testing have now been specified for project years 2 through 10 and projects are required to meet this level each year in order for credits to be issued in that year. To be clear: this does not require that the PB be met every year repeatedly (e.g. 20% improvement also occur between year 1 and 2; 2 and 3 etc). But that the at-minimum level of performance required to pass the PB (e.g. 20% improvement in EUI over project year 0 performance) then form the on-going performance threshold needed for crediting in each subsequent year. It should be noted that for Test 1 (equation 3), the PE adjustments in section 8

METHODOLOGY ELEMENT ASSESSMENT REPORT: VCS
Version 3
v3.0 24
sustain the at-minimum requirements that Test 1 initiated in project year one. The intent for this is obviously to avoid displacement between stationary combustion and scope 2 electricity emissions. The performance tests were established using credible, applicable data sources (ACUPCC), segmented by Carnegie category (well stratified), with performance curve analysis that demonstrated, using a well argued logic, that the resulting campus performances would be comparable to the 85th percentile level of performance among an already “elite” group of campuses (ACUPCC members); in ways that were endorsed through the stakeholder consultation process and several pilot project applications. The ACUPCC data is a satisfactory secondary source under VCS 4.5.6 guidance given ACUPCC’s independent status and group peer-review processes (see Appendix A). It should be noted, however, regarding the monitoring of campus data for ER calculation purposes (which data relates to campus reports/certification documents that apply to ACUPCC): the modules’ monitoring plan have now included provisions to ensure that projects supply requested primary data documentation if needed to enable VVB to assure that the data entered into the calculators reflects accurate submissions consistent with ACUPCC reporting guidance (and consistent with standard VVB validation best practices). Thus, the monitoring plan under data sources now provides, via example, further details on the primary data to be collected by campuses and used as input to the ACUPCC calculation tool. Furthermore, the module references specific GHG reporting programs (i.e., ACUPCC, STARS and the Climate Registry) which meet the requirements under 4.1.7 of the VCS Standard specifying that, if a standard (and its default factors by incorporation) are to be used for project GHG reporting purposes, they must have been established consistent with 4.5.6. This implies that the standards and their default factors must have been peer reviewed when they were established, however, it does not mean that all GHG data reported in all circumstances using these standards must as well have been peer reviewed (which obviously no standard could possibly control by itself). In the context of a project under this module, reported data will be validated by the VVBs. ACUPCC, STARS and the Climate Registry developed their standards through rigorous peer review processes. Should projects seek to use another credible third party GHG reporting program, the VVB will need to ensure that it meets 4.1.7 (as now referenced in the module), consistent with the above logic. The performance tests are therefore well founded; refinements in the module text have nonetheless been applied to ensure that the application of this approach is clear. 3.4.2 LEED Certified building module:
Pre-tests A: The Regulatory Surplus Test : The Regulatory Surplus Test is provided to ensure that the project was not mandated or required by local state or federal law or regulation.

METHODOLOGY ELEMENT ASSESSMENT REPORT: VCS
Version 3
v3.0 25
Performance Tests: A separate performance tests are provided for all NC, EB-A and EB-B to ensure that the project achieve expected level of performance. The performance tests were established using credible, applicable data sources (LEED), segmented by category (well stratified) across both LEED building type (NC, EB), building sectors (higher ed, labs and k-12 schools) and applicable EPA TF sectors; with performance curve analysis that demonstrated, using a well argued logic, that the resulting building performances would be comparable to an 86th percentile level nationally (the LEED average); with extensive expert input from USGBC; in ways that were endorsed through the stakeholder consultation process and several demonstration project applications.
The basis for the EB-A 20% improvement as BBAU is derived from the US EPA Energy Star program which confirms that a very small portion of schools/colleges achieve more than a 20% improvement in EUI in a single year (circa 3% -- see Module Appendix 5). All such references, performance graphs etc are given in Appendix 5.
USGBC’s LEED data is also satisfactory (establishing PB’s in LEED module) since it is also an independent secondary source whose data is third party audited. The EPA Energy Star data (which is referenced in the LEED module’s Appendix 5) for EB-A’s 20% improvement is satisfactory since it is an independent secondary source provided by a government agency. All sources for establishing PB’s thus meet requirements under 4.5.6 VCS guidance. It should be noted, however, regarding the monitoring of campus data for ER calculation purposes (which data relates to campus reports/certification documents that apply to LEED/EPA ES): the modules’ monitoring plan have now included provisions to ensure that projects supply requested primary data documentation if needed to enable VVB to assure that the data entered into the calculators reflects accurate submissions consistent with LEED/EPA TF reporting guidance (and consistent with standard VVB validation best practices). This documentation is not needed for LEED data that has already undergone third party LEED certification; although any EPA TF data not sourced from the LEED certification would also need such supporting documentation.. Thus, the monitoring plan under data sources now provides further details on the primary data to be collected by campuses and used as input to the ACUPCC calculation tool. There is no need include all parameters, but some examples will be provided. For LEED, information in the LEED certification are the primary data Modules have also now included provisions such that the project performance
corresponding to the meeting the “at minimum” eligibility threshold in year 1 to
pass the PB testing have been specified and projects are required to meet this
level each year in order for credits to be issued in that year. To be clear: this does

METHODOLOGY ELEMENT ASSESSMENT REPORT: VCS
Version 3
v3.0 26
not require that the PB be met every year repeatedly (e.g. 20% improvement also
occur between year 1 and 2; 2 and 3 etc). But that the at-minimum level of
performance required to pass the PB (e.g. 20% improvement in EUI over project
year 0 performance) then form the on-going performance threshold needed for
crediting in each subsequent year.
As per TUVR assessment result, all the additionality tests provided ensure that
only the project which are business as usual (BAU) will be considered as
additional under this methodology. All performance benchmarks were developed
on a stratified basis; using credible sources of historical data from which to derive
their performance benchmarks (from ACUPCC/LEED); using transparent analysis
via performance curves for each sector (see Appendix 5); establishing credible
performance requirements comparable to the 85th percentile achievements for the
sector (as referenced by UNFCCC); based upon expert input and in ways
supported by the stakeholder consultation process (see Appendices 4 and 5).
(See comments per 4.1.14, 4.1.17, 4.1.18, 4.5.5, 4,5,6 and observations 3,
4,5,6,7,8, 27, 28)
Hence TUVR concludes additionality demonstrations provided in the methodology
are appropriate, adequate and in compliance with the VCS rules.
It should be noted that, since the stakeholder consultation process is central to the
establishment of the performance benchmarks and baselines, that TUVR’s review
of the series of white papers used to develop the same; other stakeholder
supporting materials; Chevrolet’s Environmental Advisory board, USGBC and
ACUPCC contributions; and the detailed description of the stakeholder process
itself found in Appendix 5 confirm stakeholders’ contributions and support for the
methodology’s approach and PB’s adopted.
3.5 Baseline Emissions
The baseline emission calculation methods are provided in separately in the respective module.
For campus-wide and LEED EB-A, baseline emissions (BE) are determined based
on historical emissions of the specific campus or LEED certified building (average
annual emissions determined based on actual emissions during the 3-5 years prior
to project year 1). For NC and EB-B buildings in Campus Clean Energy Efficiency
LEED Certified Buildings Module the baseline calculations use the CO2 emissions
from ENERGY STAR 50 rated comparable buildings.

METHODOLOGY ELEMENT ASSESSMENT REPORT: VCS
Version 3
v3.0 27
Considering the business as usual (BAU) improvement in US campus, the baseline emissions are for both modules adjusted by a business as usual (BAU) energy efficiency improvement factor of 1.3%/year to reflect BAU energy efficiency gains. Refinements to these calculations have now been made to discount the baseline on a geometrically compounding basis. (See comments per 4.5.5 and observations 9, 10, 31)
Baseline emissions calculations method in campus module consist of the stationary combustion emissions and scope 2 electricity-based emissions consistent with the source of credits sought and credible third party reporting via ACUPCC/STARs. For the LEED module, baseline emissions are calculated using the EPA PM tool using specific building information including square footage, occupancy, computers, and percent of the building heated/cooled. Both emission calculation approaches are appropriate for project crediting purposes.
Both the baseline emission calculation methods provide clear and transparent equations for the calculation the baseline emission with conservative assumptions and adjustments for variances which are verified and found to be correct. (See comments per 4.5.5, 4.1.18)
Hence TUVR assessed that the calculation of baseline emissions are appropriate, adequate and in compliance with the VCS Standard
3.6 Project Emissions
The project emission calculation methods for each module are provided separately.
For campus module, the project emissions calculation method provided for both stationary combustion emissions and scope 2 electricity-based emissions. For the LEED module, project emissions are calculated using the EPA PM tool using specific building information including energy data and square footage, occupancy, computers, and percent of the building heated/cooled.
For campus-wide, projects may select stationary combustion and/or scope 2 electricity reductions for crediting purposes, depending upon where the campus has achieved beyond business as usual performance. This approach is cogent since performance methodologies are design to not be overly prescriptive regarding how emission reductions are achieved but rather ensure that a beyond business as usual level of GHG reduction performance has been achieved. Given this flexibility, the methodology nonetheless puts in place provisions to ensure that estimated reductions are conservative. Thus should emissions increase between stationary combustion emissions and scope 2 electricity-based emissions as a result of Adjustment Technologies, the project emissions are adjusted via PEDy The revised language applied to address these emission adjustments is sound and avoid potential confusion with project leakage; furthermore, the threshold under pathway b) has now been further constrained to 5%, consistent with WRI de minimis parameters. Changes in terminology (removing references to “internal leakage”) have been made to avoid confusion with project leakage. Thus, should stationary combustion emission technologies (Adjustment Technologies) result in increases in scope 2 electricity-based emissions (or vica versa), the project emissions are now

METHODOLOGY ELEMENT ASSESSMENT REPORT: VCS
Version 3
v3.0 28
adjusted by using conservative adjustment factors ( PEDy ) and appropriate terminology and calculation methods. (See observations 11, 12, 13, 14)
With regard to square foot adjustments during the project period, thus impacting PE
calculations, the module has a clear, well founded approach to all square foot
adjustments. Namely that adjustments for sq ft take place via Appendix 3 during the
baseline period (whether sq ft is declining or growing more than 5%). During the
project period, declining sq ft is addressed via PSQFT term in section 8 equation 1.
Currently sq ft growth during the project period is not incorporated since it is clear
that this is conservative: any sq ft increases would increase PE, thus reducing ER.
However, it is also recognized that, given the application of performance benchmark
parameters in project years 2- 10, the module will make sq ft adjustments made
during the project period for PB testing in project years 2 – 10 in order to not unduly
penalize campuses for growing when they are seeking to confirm that the “at
minimum” PB thresholds required to be additional in year 1 have continued to be met
in subsequent years.
With regard to the provisions for “new site” area adjustments in section 4, project
boundary, the specific conditions, stated in the module, under which these “new site”
adjustments are allowable; some textual refinements are now included for clarity to
make the applicability conditions at the beginning of these paragraphs.
The project emission calculation methods therefore provide clear and transparent equations for the calculation the project emission with conservative assumptions and adjustment mechanisms which are verified and found to be correct. (See comments per 4.1.18 and observations 11, 12, 13, 14)
TUVR assessed that the procedures and calculations for the determination of project emissions are appropriate, adequate and in compliance with the VCS Standard.
3.7 Leakage
The measures implemented under this methodology are not expected to result in
leakage in terms of changes of anthropogenic emissions by GHG sources that occur
outside the project boundary. (See comment 22.) Hence the leakage is considered
as de minimis for this methodology.
TUVR concludes that the procedures and calculations for the determination of the net GHG emissions reductions are appropriate, adequate and in compliance with the VCS Standard.

METHODOLOGY ELEMENT ASSESSMENT REPORT: VCS
Version 3
v3.0 29
3.8 Quantification of Net GHG Emission Reductions and/or Removals
Calculation method of emissions reductions provided in the methodology is verified and found to be correct, conservative and appropriate for the methodology context. For square foot declines during the project period, an adjustment calculation has been provided that is found to be credible. (See comment 25) The revised formula for Equation 1 (addressing PEDy) is also satisfactory.
Hence TUVR concludes that the emission reduction calculation provided in the methodology is appropriate, adequate and in compliance with the VCS Standard. TUVR concludes that the procedures and calculations for the determination of the net GHG emissions reductions are appropriate, adequate and in compliance with the VCS Standard.
3.9 Monitoring
All parameters required to monitor the data needed to determine the baseline and to monitor
the emission reductions are listed in the methodology, together with appropriate instructions for
measurement and QA/QC procedures.
The strength of the monitoring systems is reinforced by the fact that it builds upon the sound
foundations of project data which have already been public reported, peer reviewed (for
ACUPCC) and (for LEED) undergone third party certification. Data quality assurance
procedures thus benefit from these supporting reporting frameworks.
Refinements in the monitoring parameters and systems (e.g. adding precision alongside
confidence levels) were made. (See comment 16, 32)
Provisions have been entered into the module (in the monitoring section)
reflecting the fact that, relative to the parameters involved in ACUPCC reporting
re data inputs, the VVB would:
a) review the project’s data entries to ensure that the reporting procedures
followed by campus in making the ACUPCC CO2 calculations are consistent
with those required under ACUPCC reporting guidelines
b) have access to supporting documentation for review that the VVB can
inspect relative to the input data used to make the ACUPCC CO2 calculations
(e.g. fuel inputs, emission factors, contextual data) to ensure that the
information entered into calculator conforms to the ACUPCC guidance
The module’s monitoring section now provides further clarity by also giveing
examples of the parameters that ACUPCC reporting typically relies upon:
these parameters are not, however, given their own “parameter boxes” within

METHODOLOGY ELEMENT ASSESSMENT REPORT: VCS
Version 3
v3.0 30
the module because this would i) duplicate AUCPCC system ii) risk becoming
out of date with AUCPCC definitions iii) has already been specified by
ACUPCC.
In campus wide parameters boxes for those variables already specified,
references have been made in order to a) confirm the source of the data (e.g.
for BE or PEy via ACUPCC reports) would be the CO2 results from ACUPCC
calculations; b) any associated inputs that ACUPCC would require to
calculate these emissions would again need to be available for review by
VVB’s based on suitable primary documentation that campuses would supply
(see above), consistent with ACUPCC guidance
For the LEED module: references have been made in order to specify
whether data is to be sourced a) from LEED certification docs or b) EPATF
results or c) (optionally for EB_A) LAB 21. If b) or c), module refinements
now make clear (per monitoring section) that the project results would need to
have available the primary documentation that campuses relied upon for this
data input, consistent with EPATF/LAB 21 definitions. If the relevant data
comprises energy calculations for project years subsequent to year 1, module
refinements again make clear that they will be calculated on a comparable
basis to that used for the original LEED certification energy calculations (thus
docking year 1 energy data to subsequent years, calculated on a comparable
basis). Since the module will rely on LEED’s calculation protocols, against
which the VVB’s will make assessments to ensure proper calculations have
been made, there does not need to be a reference back to define again all the
LEED parameters for energy calculations again. In the monitoring section, for
any contextual data (e.g. occupancy, sq ft) which did not feature in the original
LEED documentation, the VVB would expect to see primary data
documentation consistent with EPA TF/LAB 21 definitions to ensure that data
entered is appropriate.
The monitoring section for the LEED module now also makes clear the source of
the data to be used via via new refinements as follows:
1. The module clearly indicates whether/when the energy inputs are from metered/estimated or LEED certification document sources
2. Any occupancy or contextual terms referenced rely upon definitions used by EPA TF in their tool – and thus again are subject to VVB review to ensure that primary documentation would be available relative to those terms to ensure data was entered accordingly (noting that for some of these terms, the parameters could have been referenced in the LEED certification docs)

METHODOLOGY ELEMENT ASSESSMENT REPORT: VCS
Version 3
v3.0 31
3. In reliance upon the EPA TF definitions and protocols (or for EB-A higher ed labs, optionally the LAB 21 EUI calculations), the module has not created new parameter boxes for these contextual terms. VVB review practices will be referenced as above
The Assessment team therefore concludes that the methodology procedures
for project monitoring are appropriate, adequate and in compliance with the
VCS Standard.
3.10 Data and Parameters
The specification for monitored and not monitored data and parameters were found to be appropriate, adequate and in compliance with the VCS rules. Consistent with the refinements referenced in the Monitoring section above, further clarifications have been made in applicable parameter boxes in the modules regarding the sources of data needed consistent with the VVB verification procedures referenced in 3.9 Data and parameters to be used for additionality and baseline determination are consistent with those necessary for the respective reporting / certification schemes. Campus-wide data is public and subject to peer-review scrutiny. With respect to the LEED module, they are also independently verified by independent 3rd party assessment. Similarly, parameters required for monitoring and ER calculation are complete and can reliably be determined.
Minor refinements in the module texts now provided for clarity have also been reflected in the data parameter descriptions provided in section 9. The VCS data requirements relating to performance methodologies are also satisfactory (see comments in 4.5.6).
TUVR concludes that the methodology adheres to the VCS project principles and are appropriate, adequate and in compliance with the VCS Standard.
3.11 Use of Tools/Modules
Since the methodology is applicable for two different contexts ie, applied campus-wide to all campus buildings and applied individually to LEED certified buildings, the methodological requirements are described separately in the following two modules.
· Campus Clean Energy Efficiency Campus-Wide Module · Campus Clean Energy Efficiency LEED Certified Buildings Module
The modules references are correctly made in the methodology framework sections and found to be easily traceable.

METHODOLOGY ELEMENT ASSESSMENT REPORT: VCS
Version 3
v3.0 32
TUVR assessed that the defined applicability conditions of both the modules are appropriate, adequate and in compliance with the VCS Standard.
3.12 Adherence to the Project Principles of the VCS Program
The methodology satisfies VCS principles of relevance, completeness, consistency, accuracy,
transparency and conservativeness, In particular with respect to conservativeness of ER
calculations, adjustment factors have been made on several fronts. Transparency relating to
the establishment and analysis supporting the performance benchmarks is sound. Relevance is
established via the current limitation of the geographical scope to only the US which ensures
that sufficient data for a conservative baseline determination is made. Completeness of
procedures, alongside consistent, accurate algorithms will also ensure that application of the
methodology will result in emission reductions that are real.
TUVR concludes that the methodology adheres to the VCS project principles and are
appropriate, adequate and in compliance with the VCS Standard.
3.13 Relationship to Approved or Pending Methodologies
There are no pending methodologies that would serve the same purpose.
3.14 Stakeholder Comments
No stakeholder comments were received through the VCS public stakeholder process which closed on 21-May-2013.
4 RESOLUTION OF CORRECTIVE ACTION REQUESTS AND CLARIFICATION
REQUESTS
Please refer Appendix A for the resolution corrective action request (CAR) and clarification request (CL).
5 ASSESSMENT CONCLUSION
The assessment was performed on the basis of VCS criteria for methodology
development. The methodology was prepared based on the requirements of the
· VCS Standard V.3.3, 4 October 2012
· Validation and verification standard, version 3.3, 4 October
2012
· VCS Program Guide V. 3.4, 4 October 2012
· VCS Program Definitions V. 3.4, 4 October 2012,
· VCS Guidance for Standardized Methods V. 3.2, 4 October
2012, and
· VCS Methodology Approval Process V3.4, 4 October 2012
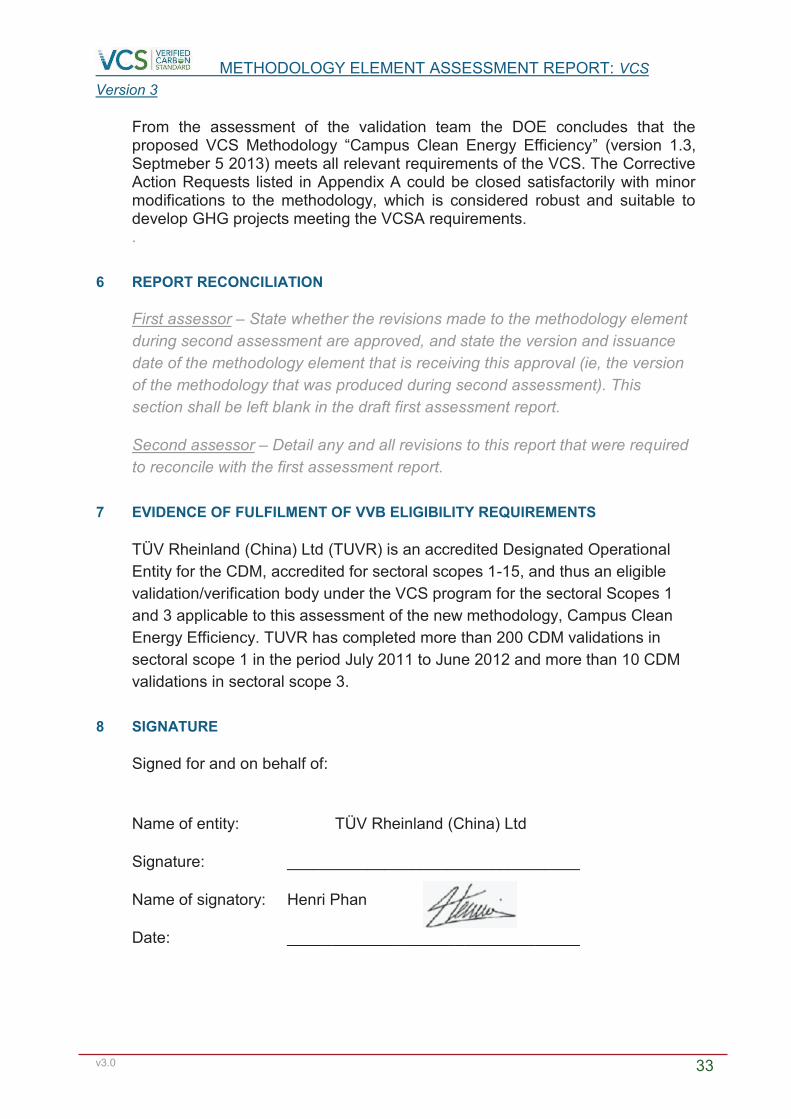
METHODOLOGY ELEMENT ASSESSMENT REPORT: VCS
Version 3
v3.0 33
From the assessment of the validation team the DOE concludes that the proposed VCS Methodology “Campus Clean Energy Efficiency” (version 1.3, Septmeber 5 2013) meets all relevant requirements of the VCS. The Corrective Action Requests listed in Appendix A could be closed satisfactorily with minor modifications to the methodology, which is considered robust and suitable to develop GHG projects meeting the VCSA requirements. .
6 REPORT RECONCILIATION
First assessor – State whether the revisions made to the methodology element
during second assessment are approved, and state the version and issuance
date of the methodology element that is receiving this approval (ie, the version
of the methodology that was produced during second assessment). This
section shall be left blank in the draft first assessment report.
Second assessor – Detail any and all revisions to this report that were required
to reconcile with the first assessment report.
7 EVIDENCE OF FULFILMENT OF VVB ELIGIBILITY REQUIREMENTS
TÜV Rheinland (China) Ltd (TUVR) is an accredited Designated Operational
Entity for the CDM, accredited for sectoral scopes 1-15, and thus an eligible
validation/verification body under the VCS program for the sectoral Scopes 1
and 3 applicable to this assessment of the new methodology, Campus Clean
Energy Efficiency. TUVR has completed more than 200 CDM validations in
sectoral scope 1 in the period July 2011 to June 2012 and more than 10 CDM
validations in sectoral scope 3.
8 SIGNATURE
Signed for and on behalf of:
Name of entity: TÜV Rheinland (China) Ltd
Signature: _________________________________
Name of signatory: Henri Phan
Date: _________________________________

METHODOLOGY ELEMENT ASSESSMENT REPORT: VCS Version 3
v3.0 34
Appendix-A
No. CAR CL
Observation (CAR/CL) Summary of project owner
response Validation team conclusion
1. 01 Section 2:
The percentage of annual average
change of Baccalaureate and Masters
in scope-2 electricity PBSc is not
consistent with the values mentioned in
the methodology framework document
Editorial error has been corrected in
Section 2 of Campus-wide Module
Closed:
Amendment has been
confirmed
2. 02 Section 6:
It is mentioned that for estimating
baseline for the square foot variation
cases, the approach mentioned in
VM0018 is followed. Kindly check
whether it is correct or not.
Neither 008 or 0018 address sq ft
variances. However, at
stakeholders’ recommendations,
we follow WRI GHG Protocol for
campuses which change from year
to year either > 5%/yr or <0%/year.
The earlier footnote is no longer
applicable (since it references new
vs existing areas which was used in
an earlier version of Appendix 3 but
has now been updated). So the
footnote has also now been deleted
to be consistent.
Closed:
The footnote has been removed
now.
3. 03 Section 7:
In the pre-test B, it is mentioned that
the square foot declines during the
project period, adjustments will be
Per footnote 15, growth >5%/year
during project period is
conservatively set aside (and no
adjustments made) since Co2
Closed:
Argument is accepted

METHODOLOGY ELEMENT ASSESSMENT REPORT: VCS Version 3
v3.0 35
made to emission reduction
calculations. Clarify the approach to be
followed if the square foot increase
during project period.
reductions will still be conservative
based on calculations as they
stand. Only sq ft growth >5%
during baseline period is addressed
to make sure that the baseline is
set up appropriately. Setting the
baseline adjustment threshold at
5%/year is conservative also since
GHG reductions of up to 5% could
arise but not be counted if sq ft was
growing this fast.
For declines in square footage,
however, where credits could
erroneously be earned as a result
of reduction in campus size, this
consideration is addressed during
both baseline period and the project
period.
4. 04 Section 7:
In the performance benchmark tests,
specify the project year to which the
additionality eligibility period emission
will be compared.
Project year 1
The text has been amended to
provide this clarity
Closed:
Amendment has been
confirmed
5. 05 Section 7: Over the periods covered, Closed:

METHODOLOGY ELEMENT ASSESSMENT REPORT: VCS Version 3
v3.0 36
Clarify how the equation provided for
Pre-test B (equation 2B) is appropriate
to address the annual average
percentage change.
differences in simple and geometric
percent changes are minimal. WRI
specifies 5% as their de minimis
threshold without requiring its
application on simple or geometric
basis. So it is appropriate to use the
arithmetic algorithm here. It is also
consistent with the arithmetic
algorithm we use to derive the PB’s
(See below)
Argument is accepted.
6. 06 Section 7:
The emission reduction calculation
baseline year for the stat 1 and scope
2-electricity can be different. Hence
two different notation is used (ie, for
stat 1 (S1 TP) & scope 2 (E2TP)).
However for the additionality baseline
years a common notation is used (ie,
B) in equation 2.B
Please clarify the additionality baseline
year for both stat 1 and scope 2-
electricity should be same for any
project case.
Stationary combustion and scope 2
reductions are treated as separate
projects. There is no obligation to
bring both through for certification.
Activities undertaken on campus to
reduce Stationary combustion on
site generation emissions may well
follow a different
timelines/sequence than those for
EE in scope 2 electricity emissions.
There is no a priori reason to
therefore constrain baseline or
eligibility periods to be the same.
The additionality eligibility period
reflects the timeline under which
Closed:
Argument is accepted. Also
clarification is included in the
methodology.

METHODOLOGY ELEMENT ASSESSMENT REPORT: VCS Version 3
v3.0 37
aggressive GHG were delivered in
recent years. The baseline needs
to reflect a longer-term threshold
from which reductions were
achieved.
Thus if one were to compare the
Stationary combustion project and
a scope 2 electricity project, arising
on the same campus, there would
be no reason why the baseline
period (B) for each would need to
be the same (provided is met the 3-
5 year period requirements);
similarly the additionality eligibility
period for each (S1TP and E2TP)
need also not be the same.
We consider that the module will be
applied twice if both Stationary
combustion and scope 2 electricity
credits are sought. So we did not
introduce the complexity of two
notations for the baseline period B.
We have however included a
footnote for clarity here and a
comment baseline section too so
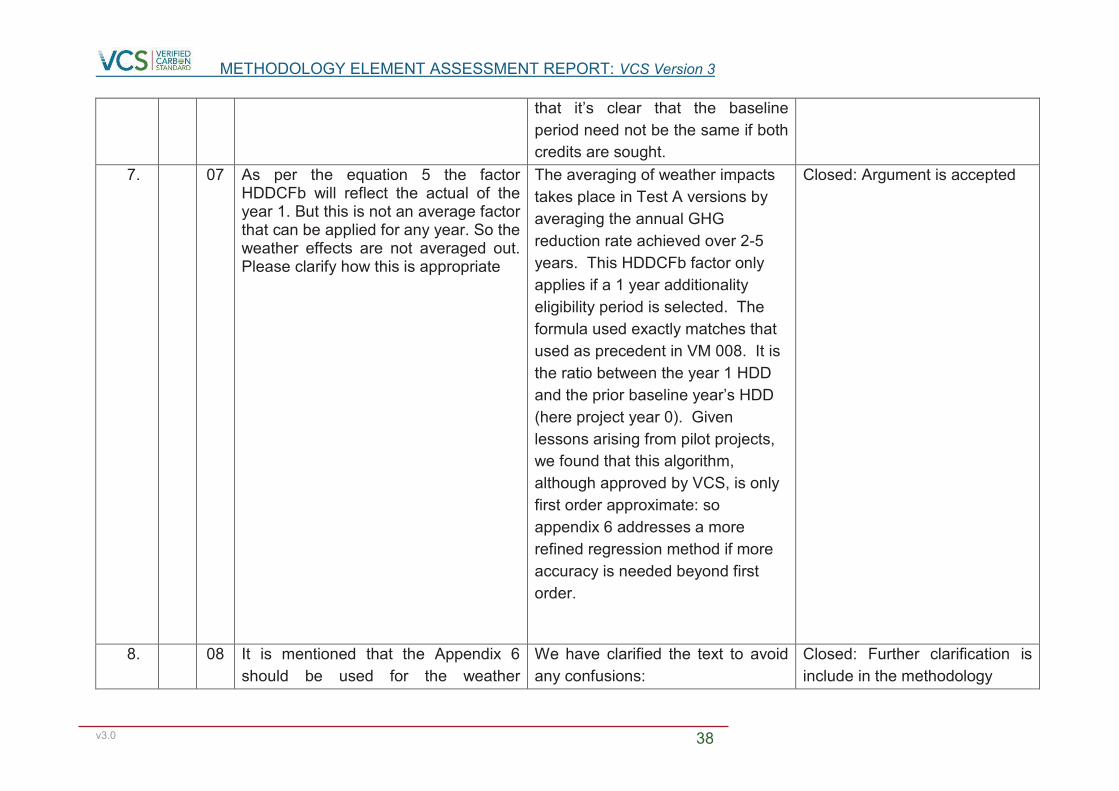
METHODOLOGY ELEMENT ASSESSMENT REPORT: VCS Version 3
v3.0 38
that it’s clear that the baseline
period need not be the same if both
credits are sought.
7. 07 As per the equation 5 the factor HDDCFb will reflect the actual of the year 1. But this is not an average factor that can be applied for any year. So the weather effects are not averaged out. Please clarify how this is appropriate
The averaging of weather impacts
takes place in Test A versions by
averaging the annual GHG
reduction rate achieved over 2-5
years. This HDDCFb factor only
applies if a 1 year additionality
eligibility period is selected. The
formula used exactly matches that
used as precedent in VM 008. It is
the ratio between the year 1 HDD
and the prior baseline year’s HDD
(here project year 0). Given
lessons arising from pilot projects,
we found that this algorithm,
although approved by VCS, is only
first order approximate: so
appendix 6 addresses a more
refined regression method if more
accuracy is needed beyond first
order.
Closed: Argument is accepted
8. 08 It is mentioned that the Appendix 6
should be used for the weather
We have clarified the text to avoid
any confusions:
Closed: Further clarification is
include in the methodology

METHODOLOGY ELEMENT ASSESSMENT REPORT: VCS Version 3
v3.0 39
adjustments if the Test 1B is not
passed.
The Test 1.B just provides weather
calculation adjustment when the
additionality eligibility year is 0. It does
not produce any pass or fail results.
So please explain how this sentence is
applicable.
Tests 1B provides a (simpler but) first order set of emissions figures which are then used to conduct additionality eligibility testing for incorporating weather adjustments; if the first order adjusted emissions figures do not result in Test 1B being passed, an alternative set of algorithms are provided in Appendix 6, based on regression analyses which are more fine-tuned, are used to establish weather adjusted emissions figures which may be substituted and used to qualify under Tests 1B.
This means that if the Test-1A based on the weather adjusted Eb=1 & Fb=1 (calculated in Test 1.B) fails, we cannot directly confirm the project is non –additional. So appendix 6 should be used to recalculate the adjusted Eb=1 & Fb=1 and these adjusted factors again used in test 1.B. In this case only after using Appendix 6, we can able to confirm if the project is non-additional.

METHODOLOGY ELEMENT ASSESSMENT REPORT: VCS Version 3
v3.0 40
We have included this further
clarification as a footnote for VVB’s
9. 09 Section 8.1.1:
As per foot note 5 in section 2, around
5% emission reduction is possible in
many colleges in the baseline condition
itself. Even 1.3% reduction in emission
is considered as BAU
However as per equation 12, the
baseline emissions are averaged out
for the emission reduction calculation.
So please clarify how considering the
average emission baseline year is
conservative.
The baseline is indeed conservative
already given that up to 5%
reductions could arise via sq ft
expansions without credits being
allowed – particularly when the
1.3% discount for BAU EE gains is
nonetheless applied. However the
averaging of historical baselines is
a very standard practice; cherry
picking one year over another risks
introducing other variances and
doesn’t accomplish the weather
averaging and other benefits that
the current approach secures. All
stakeholder supported this
conventional approach for historical
baselines
Closed: Argument is accepted
considering the common
approach.
10. 10 Section 8.1.1:
Equation 13 mentions the following
formula for calculation of baseline
emission for any year. BEy =BE*(1+0.013*(y-1))
The emission reduction of 1.3% every
The equation has been updated in
this campus module and the LEED
module.
Closed: Amendment has been
confirmed

METHODOLOGY ELEMENT ASSESSMENT REPORT: VCS Version 3
v3.0 41
year compared to previous year will
form as geometric progression (not
arithmetic progression). Hence the
equation is not appropriate.
11. 11 Section 8.3.1:
As per option b, if the size of the
resulting scope 2 emission increases
because Stationary combustion
leakage activities and these increases
are less than 10%, the leakage will be
considered as zero.
The 10% threshold for these leakage
is a considerable emission. Please
clarify how this can be neglected?
Note 2013-09: Due to deliberations
between VCS and the Methodology
developer, the term “Leakage” is
unfortunate in this context and
therefore the methodology assumes
the term “Adjustment Technology”
instead.
Firstly, the terminology for internal
leakage has now been changed:
these adjustments are now
referenced as PEDy
The threshold for de minimis
emissions has now been adjusted
to 5%, which is the WRI GHG
default factor for de minimis
considerations.
Closed: Amendment has been
confirmed
12. 12 Section 8.3.1:
Please clarify if the leakage emissions
is more than 10% also, option c) or d)
can be selected?
Firstly, the terminology for internal
leakage has now been changed:
these adjustments are now
referenced as PEDy
Closed: Argument is accepted
METHODOLOGY ELEMENT ASSESSMENT REPORT: VCS Version 3
v3.0 42
Option c) and d) can only be
selected if the Stationary
combustion technology is not
expected to generate increases in
net electricity based emissions of
more than 10%, per the equation:
this is the case for Stationary
combustion technologies except
CHP and geothermal, which are
precluded from pursuing c) and d).
Indeed, if the adjustment is more
than 10% of the (BEy – PEy) then
the c) test will fail.
For all technologies, unless you
pass a) or b) (where there would be
no PEDyadjustments since qualified
under the other scope for credits or
incremental emissions are
considered by VVB as de minimis)
then projects must select an
approach from c) d) e) or f) . If the
net emissions are higher (for CHP
or geothermal) then projects cannot
apply c) or d) avenues: these

METHODOLOGY ELEMENT ASSESSMENT REPORT: VCS Version 3
v3.0 43
routes are precluded. Projects
must pick e) or f). For these
technologies f) is hard to pass due
to its constraints; so they will
default to measuring the actual
emissions for PEDy which is
e). This is the pathway which has
already been proven to be
applicable for pilot projects in
geothermal.
13. 13 Section 8.3.1:
As per equation 15, the emission for
every year in the crediting period
needs to be calculated. After
calculation if the leakage emissions
are less than 10% then PEDy leakage
should be considered as zero.
If the leakage emissions are monitored
every year during the crediting period,
the why cannot we use the same
lPEDyeakage in the emission reduction
calculation?
Again, the terminology for internal
leakage has now been changed:
these adjustments are now
referenced as PEDy
This point relates to a concern re
the expense and complexity of
monitoring for actual incremental
scope 2 electricity
emissions. Routes c) and d) do not
require actual electricity emissions
increases (as an example for stat 1
PEDy) to be calculated in detail. If
reasonable estimates can be made
and it’s clear that the increment is
within the 10% threshold then the
Closed: Argument is accepted
METHODOLOGY ELEMENT ASSESSMENT REPORT: VCS Version 3
v3.0 44
formula allows you to calculate
PEDy in terms of BE and PE figures
which projects already have
determined in the earlier GHG
calculations. Thus the only time
you’d need to calculate net
electricity emission increases with
considerable complexity as a basis
to adjust your credits would be
under e) and projects will have to
do this if they can’t show that
PEDy is within the 10% threshold
(e.g. for CHP and geothermal).
14. 14 The equation 16 is
DEp = y £ Eb = 1 - Ep = 1
p=1
y
å
If the condition fulfils then the leakage
is zero.
As per this equation, the leakage
emission equivalent to year 1 scope 2
electricity emission reduction will be
neglected during the crediting period.
This seems to be very high.
Again, the terminology for internal
leakage has now been changed:
these adjustments are now
referenced as PEDy
The concern here is that a year of
emission reductions will be
claimed. However, Eq 16 relates to
scope 2 electricity emissions (and
differences which they generate
between project year 1 and the first
baseline year) – not differences
during the same period in the stat 1
Closed: Argument is accepted

METHODOLOGY ELEMENT ASSESSMENT REPORT: VCS Version 3
v3.0 45
credits.
Rather, the question being raised in
the PEDy calculations is whether
there have been enough reductions
in scope 2 electricity during an
equivalent baseline period (in
scope 2 emissions, not stat 1 where
credits are sought) to offset any
increase as electricity consumption
goes up as the new Stationary
combustion generation Adjustment
technology is applied. So if the
electricity savings have been large
enough (ie declining steadily during
the baseline period years) such that
the increase in scope 2 electricity
emissions due to the stat 1 techs
during project year are STILL
SMALLER taken cumulatively than
the reductions achieved in scope 2
over the baseline period, then we
can set aside the PEDy as zero.
This implies that to set aside the
the increase in scope 2 emissions a
campus must have delivered an
absolute reduction over a 5-15 year

METHODOLOGY ELEMENT ASSESSMENT REPORT: VCS Version 3
v3.0 46
period – a considerable (and rare)
feat, particularly given a) the rate of
campus sq ft expansion during the
project period which cannot be
taken into account for ER
calculation purposes (implying that
a 5% reduction in GHG/year arising
from sq ft expansions is not
credited); and b) the very long time
period over which ABOSLUTE
reductions in scope 2 electricity
CO2 emissions would need to have
been secured and sustained.
For example, let us say that a
campus installed Stationary
combustion technologies to earn
ERy in Stationary combustion
credits. During its first baseline
year, it had emissions of scope 2
electricity based CO2 emissions of
100k tons; 5 years later in project
year 1, its electricity based
emissions were 90k tons. If the
increase in electricity-based CO2
emissions due to the Stationary
combustion technologies were 500

METHODOLOGY ELEMENT ASSESSMENT REPORT: VCS Version 3
v3.0 47
tons CO2 per year, the cumulative
total by project year 10 would be 5k
tons, bringing scope 2 electricity
emissions in project year 10 to 95k
tons. However it is clear that this
5k ton increase would still be less
than the 10k tons decrease
achieved in scope 2 electricity
emissions during the baseline
period; that is the total CO2
emissions due to electricity
consumption in project year 10 (95k
tons) would still be less in
ABSOLUTE terms than the
equivalent emissions in the first
baseline year (100k tons), 15 years
previously. Under such
circumstances, it is reasonable to
set the PEDy CO2 adjustments for
Stationary combustion technology’s
electricity consumption to zero.
15. 15 Section 8.4:
In the equation 26, square foot
variation adjustment factor is
calculated as below
If Eq 26 is triggered for project
years y compared to y-1, then for
subsequent project years after
project year y, that is for project
Closed: Argument is accepted

METHODOLOGY ELEMENT ASSESSMENT REPORT: VCS Version 3
v3.0 48
PSQFTD y =1+ SQPE y - SQPE y-1( )/SQPE y-1
Please clarify how this equation is
appropriate for the variation with
respect to any project as the square
foot is compared with previous year but
not with the baseline year.
year y+n, you need to use the
second algorithm per Eq 27 ...
which adjusts the CO2 credits in a
similar way but indexed to the
original square footage in year y-1
until the campus sq ft total recovers
to the same size as it was in project
year y-1
16. 16 Section 9.3:
In the sampling requirements mention
both confidence level and precision
level required.
Project levels have been set at 90%
confidence, 10% precision levels in
both modules
Closed: Amendment has been
confirmed
LEED certified Building Module
17. 17 The usage of terminologies, language,
framing of sentence shall be made
more transparent for easy interpretation
and easy audit by VVB’s.
Example: Under applicability, the
selection criterion for Carbon reductions
and ES performance levels are not very
clear. For example it is mentioned that
Carbon reductions and ES performance
levels preferably integrated to LEED
See edits already made in both
modules
The reference to “preferably
integrated into GIBG portal” has
been addressed via the earlier
comments; this is a new
information web portal that USGBC
is building to help projects report
their data/reductions to potential
purchasers in order to aggregate
Closed: Amendment has been
confirmed
METHODOLOGY ELEMENT ASSESSMENT REPORT: VCS Version 3
v3.0 49
GBIG integrated program. So as per
VVB’s understanding this is optional
and not mandatory. Please clarify. In
addition, it is mentioned in the same
line that the other salient EPA PM
performance factors will be considered
in the determination of emission and ES
performance based eligibility factor.
Eligibility condition is not very clear on
what is the other salient EPA PM
performance factor. Please clarify.
projects. This does NOT affect
project eligibility or performance or
validation or verification. The use
of this portal is therefore entirely
discretionary and relates to ease of
sale for credits.
Other “salient PM performance
factors’ have been addressed in
the edits made for specificity and
clarity in the LEED module.
18. 18 The applicability mentioned for Module
II, EB-B mention only about exclusion
of US higher education campus
laboratories. No explanation is provided
for what has been included to qualify
applicability. Also please clarify the
difference between Campus laboratory
of EB-A and EB-B.
As addressed in the LEED module
comments, the eligibility for EB-B
includes (per the first statement) all
higher ed buildings and k-12
schools (but not labs per the
exclusion).
Further specificity regarding
building types and the
corresponding EPA TF categories
to be used was nonetheless
provided in the upgrades relating to
the revision to the EPA TF tool as
Closed: Argument is accepted

METHODOLOGY ELEMENT ASSESSMENT REPORT: VCS Version 3
v3.0 50
generated July 2013.
Further specificity relative to the
EB-B applicability condition
requiring projects to have been
eligible for LEED certification
during their baseline (the
complement to EB-A applicability
condition) has also been added.
Campus labs (per appendix 5) are
eligible for EB-A because this
relies upon a 20% improvement in
EUI within a single year and
measurements for this can be
credibly established from LEED
documents and EPA TF energy
inputs. However the PB for EB-B
is an Energy Star score, (>ES 86)
which requires regression-based
analytics in the EPA TF tool and
this level of data analysis is not
available for labs. (This is also
referenced in footnotes in this
section now as part of the July
2013 updates for EPA TF)

METHODOLOGY ELEMENT ASSESSMENT REPORT: VCS Version 3
v3.0 51
19. 19 Justification/explanation about the
Source and Sink for the following GHG
gases CH4 and N2O are not very clearly
explained in the project boundary
section. The query is related to any
emission related to N2O and CH4 from
Stationary combustion Scope 2 etc not
related to CO2 conversion. What will be
the source and sink for CH4 and N2O.
Please clarify.
These considerations are
addressed in the footnotes
provided in both modules; these
gas impacts are very small and
arise as a result of the energy
generation systems; they are
therefore included/excluded at
project’s discretion to enable them
to be consistent with their public
reporting to ACUPCC/STARS for
campus-wide projects. They are
included in LEED module since
EPA TF reports in terms of CO2e.
Closed: Argument is accepted
20. 20 The selection of most plausible
baseline scenario and alternative
scenario is not mentioned clearly in the
methodology. In addition it is unclear
1. In a performance methodology,
the baseline is already selected
and prescribed on a justified basis.
There is therefore a confusion here
Closed: Argument is accepted

METHODOLOGY ELEMENT ASSESSMENT REPORT: VCS Version 3
v3.0 52
that USGBC/EPA/LEED/ES is
mandated by the US government in the
given time scale. Please clarify.
re performance vs project
requirements. The baselines
specified in the modules result
from the stakeholder consultation
process which examined
alternatives through a series of
white papers and supported the
baselines adopted as credible and
appropriate.
2. The USGBC/EPA/LEED is not
mandated by the US gov’t. There
is no mandatory action involved
that the US gov’t requires here.
21. 21 There is no explanation provided in the
methodology about “the project activity
wouldn’t have occurred in the absence
of the intervention of the carbon
market” or the probability of such
scenarios.
There is a confusion regarding the
approach that a performance
methodology requires: this is
essentially a financial additionality
assessment consideration for
project-based methodologies
rather than performance
methodologies.
Nonetheless in these modules, in
appendix 5, the carbon revenue
contribution to the incremental
Closed: Argument is accepted

METHODOLOGY ELEMENT ASSESSMENT REPORT: VCS Version 3
v3.0 53
capital has been calculated,
consistent with a project approach,
to ensure its salience. A 5-25%
return on capital is typically
achieved by projects (per general
analysis and pilot project results)
representing a significant incentive.
This analysis goes beyond what
the performance methodology
requires.
22. 22 Though it is stated the BAU has been
accounted in baseline emissions
calculation, the indirect emission
related to project activity by transfer
and usage of technology and
equipment, indirect increase of
emissions shall be analysed and
exclusion of such emissions shall be
explained. In addition, the lifecycle
emissions are not considered in the
methodology for leakage purpose.
Two sources of leakage were
discussed and set aside as not
material.
1. Reductions in fossil fuel
emissions (as represented in stat 1
combustion and scope 2 electricity
emissions) that take place on
campus sites (and for scope 2
electricity at utility site) will
commensurately reduce any
up/downstream related emissions
associated with this fossil fuel
energy consumption’s delivery
Closed: Argument is accepted

METHODOLOGY ELEMENT ASSESSMENT REPORT: VCS Version 3
v3.0 54
beyond these boundaries (e.g. in
pipelines). Thus setting this aside
these impacts (which are further
reductions) is conservative.
2. Re equipment transfers for
energy based technologies on
campuses:
a) Re Stationary combustion:
systems on campuses are
typically very old (boilers aka
50-70 years) sustained through
maintenance budgets and
lacking capital allocation to
update. When these systems
are finally upgrade, if they are
not held on campus for back up
emergency purposes
(whereupon their emissions
would still be included in the
campus stat 1 emissions), they
are not re-used due to age,
inaccessible locations and
operational expense compared
to more efficient equipment
available after so many
METHODOLOGY ELEMENT ASSESSMENT REPORT: VCS Version 3
v3.0 55
decades for other users to
purchase.
b) Re scope 2 electricity
equipment: reuse of this EE
equipment is rare, again due to the
very high deferred maintenance
levels typical on campuses (which
results in very old systems that are
unattractive). Capital expenditure
costs per item are also low so
recovery costs (for labor etc)
represent a significant barrier to
reuse. If reuse occurs, it will only
be cost effective for the new
owners if the energy operating
costs associated with displacement
of their even older equipment are
positive – and thus further energy
savings will have been secured.
These further energy savings are
not included in project credits to be
conservative; rather they are
actually subtracted out under the
BAU 1.3% discounting of the
baseline applied.
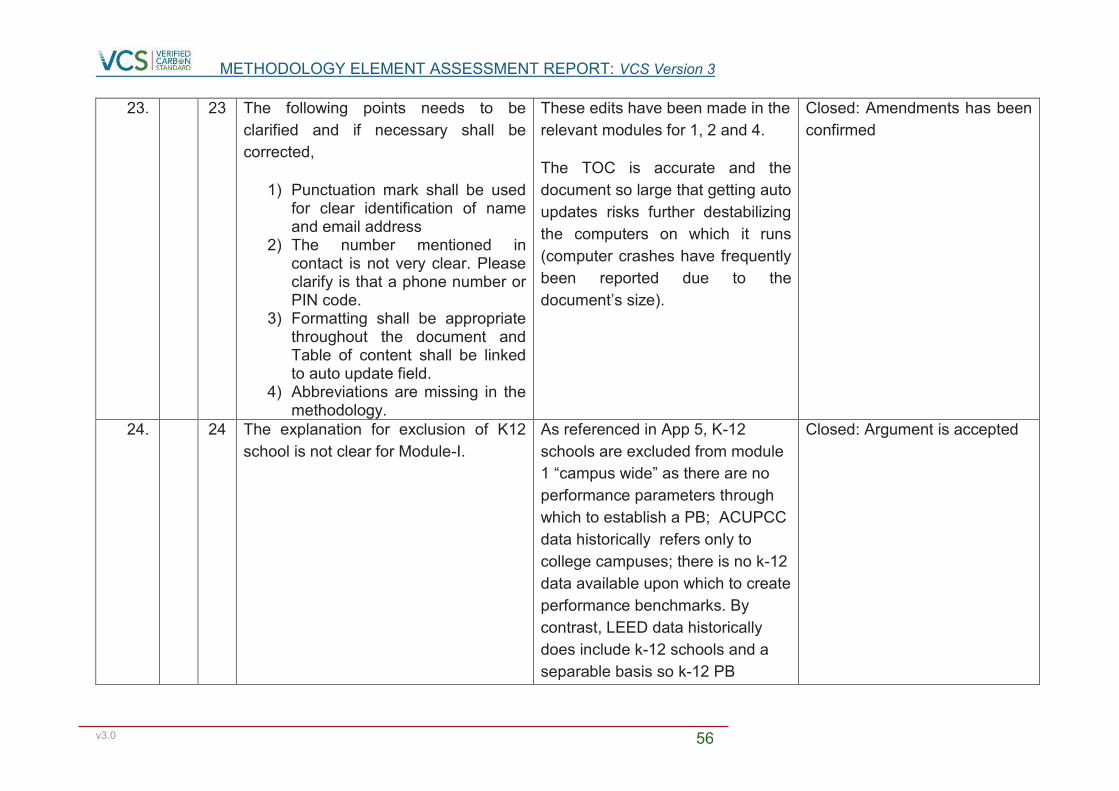
METHODOLOGY ELEMENT ASSESSMENT REPORT: VCS Version 3
v3.0 56
23. 23 The following points needs to be
clarified and if necessary shall be
corrected,
1) Punctuation mark shall be used for clear identification of name and email address
2) The number mentioned in contact is not very clear. Please clarify is that a phone number or PIN code.
3) Formatting shall be appropriate throughout the document and Table of content shall be linked to auto update field.
4) Abbreviations are missing in the methodology.
These edits have been made in the
relevant modules for 1, 2 and 4.
The TOC is accurate and the
document so large that getting auto
updates risks further destabilizing
the computers on which it runs
(computer crashes have frequently
been reported due to the
document’s size).
Closed: Amendments has been
confirmed
24. 24 The explanation for exclusion of K12
school is not clear for Module-I.
As referenced in App 5, K-12
schools are excluded from module
1 “campus wide” as there are no
performance parameters through
which to establish a PB; ACUPCC
data historically refers only to
college campuses; there is no k-12
data available upon which to create
performance benchmarks. By
contrast, LEED data historically
does include k-12 schools and a
separable basis so k-12 PB
Closed: Argument is accepted

METHODOLOGY ELEMENT ASSESSMENT REPORT: VCS Version 3
v3.0 57
elements can be included.
25. 25 It can be clarified with example of some
of the technology and strategy under
section 4.2, page 16.
There are comprehensive details
for these eligible strategy steps in
Appendix 2B (based on LEED
certification procedures and typical
campus-wide strategies
undertaken by leading campuses).
Furthermore, there will be excel
templates and PDD templates for
project developers to use which will
assist their completion of these
tasks.
Closed: Argument is accepted
26. 26 It is unclear, how EPA PM calculations
are again is matched to the LEED
project segmentation. Please clarify.
As provided in the comments and
module updates for EPA TF tool’s
July 2013 updates, the module
provides explicit instructions to
map the LEED building type onto
the EPA building categories.
Closed: Argument is accepted
27. 27 Under performance Benchmark
calculation: the following shall be
clarified,
In the relevant modules, re #:
1. The text has been deleted
from the chart – as reflected
Closed: Amendments has been
confirmed

METHODOLOGY ELEMENT ASSESSMENT REPORT: VCS Version 3
v3.0 58
1) It is mentioned in applicability
that campus laboratories are
excluded. However the
performance bench mark
mentioned here seems to be
contradicting with the
applicability conditions.
2) %EUI increase over code will
consider values which are
greater than or equal to % or
only % increase values?
3) For PBnc, it is mention for Higher
ed Lab the percentage between
26-8. Please clarify the same.
in earlier module changes
2. The project % increase in
EUI over code will be
compared to the % increase
in EUI over code achieved
by LEED buildings at the
50th percentile level of
achievement
3. Per earlier edits, 26% is now
entered
28. 28 It is unclear under EB-B Performance
TEST, the explanation provided for
Occupancy.
EB-B includes provisions for
occupancy because the PB
requirement is that the building
achieve and ES 86 performance
level. And the LEED building’s
performance level under ES
adjusts for occupancy levels when
the data is entered into EPA TF.
Edits in the EPA TF data sections,
Closed: Amendments has been
confirmed

METHODOLOGY ELEMENT ASSESSMENT REPORT: VCS Version 3
v3.0 59
have also been made for clarity.
29. 29 The following website shall be updated
throughout the methodology,
https://www.energystar.gov/index.cfm?f
useaction=target_finder
The web references have been
updated throughout both modules
to reflect internet changes.
Closed: Amendments has been
confirmed
30. 30 The following explanation shall be
clarified under For NC and EB-B,
“note that the automatic calculation of
the GHG reductions which are made
within the EPA PM, while estimating
PE, will not be the same as the
resulting GHG reductions as calculated
through this module since the ES 50
building (in the PE calculations) will use
the same fuel mix as the design
building (the LEED certified building)
which is not the correct fuel mix
assumption to use for this module.”
The notes provided indicate the
specific details as intended.
Closed: Amendments has been
confirmed
31. 31 Equation 35 shall be rechecked. Equation 35 was rechecked and
amended to reflect a geometric
progression.
Closed: Amendments has been
confirmed

METHODOLOGY ELEMENT ASSESSMENT REPORT: VCS Version 3
v3.0 60
32. 32 Methodology shall provide procedures
on measurement, type of equipment,
whether sampling is involved or 100%
data is monitored etc, quality of
assurance in the methodology.
As in earlier revisions, requested
details have now been provided.
Furthermore, the modules are clear
on their monitoring/measurement
expectations: measurements will
follow same protocols used for
ACUPCC /STARS and LEED.
Since these represent the best
practice reporting/monitoring
procedures for campuses and
campus-LEED certified buildings,
they are incorporated by reference.
EPA TF then calculates CO2
emissions from energy LEED
outputs on a standardized basis.
The modules thus draw upon the
practices from these other third
party, often certified, publicly
transparent systems (see Appendix
5). From this point, the monitoring
for VVBs relates to ensuring that
these systems have been used
(and data is consistent with public
reporting).
Closed: Amendments has been
confirmed

METHODOLOGY ELEMENT ASSESSMENT REPORT: VCS
Version 3
v3.0 61
Appendix-B
Assessment of specific requirements pertaining to Performance Benchmark Methodologies
A Campus Clean Energy Efficiency Campus-Wide Module
VCS methodology requirement
Compliance status Evaluation
4.1.14 In case the
level of the
performance
benchmark metric for
determining
additionality and for
the crediting baseline
are different, how is
this difference
justified?
Not applicable For campus-wide, historical baselines
are used so the question of
comparability between performance
benchmarks for baselines and
additionality assessment does not arise;
project baselines are used. Therefore
the requirement is not applicable.
4.1.17 The
methodology shall
provide a description
and analysis of the
current distribution of
performance within
the sector as such
performance relates to
the applicability of the
methodology or each
performance
benchmark.
Fulfilled Performance distributions including
appropriate stratification are analyzed
within ACUPCC reporting scheme,
segmented by Carnegie code.
Applicability of the PBs are sound,
establishing requirements at the 85th
percentile level of performance drawn
from a population that is already very
progressive (ACUPCC members with
active GHG reduction goals) compared
to most US campuses.
4.1.17 The
methodology shall
also provide an
overview of the
technologies and/or
Fulfilled Whereas in this context a list of
technologies would be inappropriate
(because being prescriptive, inflexible,
precluding alternatives), an indicative
list of technologies is made available by

METHODOLOGY ELEMENT ASSESSMENT REPORT: VCS
Version 3
v3.0 62
measures available for
improving
performance within
the sector, though an
exhaustive list is not
required recognizing
that performance
methods may be
somewhat agnostic
with respect to the
technologies and/or
measures
implemented by
projects.
ACUPCC as derived from action plans
of those campuses performing better
than benchmark level.
A minimum of two different categories
of strategies shall be adopted as well.
4.1.17 The
methodology shall
discuss and evaluate
the tradeoff between
false negatives and
false positives and
shall describe
objectively and
transparently the
evidence used
(including reference to
primary and
secondary data
sources), experts
consulted,
assumptions made,
and analysis
(including numerical
analysis) and process
undertaken in
determining the
selected level(s) of the
performance
benchmark metric
(noting that expert
consultation is a key
Fulfilled By applying the 85% percentile for each
identified campus type, false negatives
are precluded (i.e., target is realistically
achievable) while conservative with
respect to not allowing for BAU
measures to apply for emission
reductions.
Stakeholder consultation is
documented, covered the performance
benchmark metric.
Robustness of the module vs.
increase/decrease of campus size
(square area) also proven.
False trade offs were addressed via
a) Careful stratification; the
module avoided using overly
generalized additionality
benchmarks by stipulating
PBs for each Carnegie code
category of campus. Thus,
instances of false positives
and negatives were

METHODOLOGY ELEMENT ASSESSMENT REPORT: VCS
Version 3
v3.0 63
part of this process, as
set out below). The
selected level(s) shall
not systematically
overestimate GHG
emission reductions or
removals.
minimized since there were
salient differences in the PB’s
arising for each Carnegie
category.
b) Well designed metrics: The
module avoided using metrics
such as CO2/sq ft whose
outcomes essentially
reflected the (regionally
arbitrary) performance of the
campus’ local electric utility’s
CO2/kWh in ways that would
be introduced a significant
false negative/positive
problem (see App 5 analysis).
c) Adjustments for sq ft
variances: Particularly careful
attention was paid to potential
false positive/negative
outcomes relative in
situations where campuses
square footage was either
declining or expanding too
rapidly: adjustments to both
baseline and additionality
metrics must be calculated
per Appendix 3 to avoid
qualifying false positives
(additionality) or over
crediting (baseline
adjustments required).
d) Conservative PE adjustments
: attention was paid to the
potential for over crediting in
(typically rare) situations in
which activities reducing one
GHG SSR (e.g. stat 1’s)
could increase SSR’s in other
domains (e.g. scope 2)
via yPED .

METHODOLOGY ELEMENT ASSESSMENT REPORT: VCS
Version 3
v3.0 64
e) Weather based adjustments:
addressed via averaging
historical baseline emissions
and via more rigorous
approaches for additionality
testing adjustments than has
been applied to earlier VCS
methodologies (e.g. 0008)
(e.g. Appendix 6)
f) Approach to establish PBs:
stakeholder discussions
reviewed whether PB should
be fixed at the 85th percentile
of ACUPCC performance or
anchored upon the qualified
campuses’ average
performance. The selection
of the latter avoids the
scenarios in which a campus
which was in the top 50% of
its peers would either be or
not be eligible because, for
this particular Carnegie
category, the 85th percentile
did not match the average
qualified campus
performance levels. Thus
false positives and negatives
were again minimized.
4.1.17 The process of
determining the
level(s) of the
performance
benchmark metric
shall include and be
informed by an expert
Fulfilled Several rounds of stakeholder
consultations as documented by
references /P32/
Relevant stakeholders have been
invited to contribute their views.
Particularly detailed inputs were
provided by Chevrolet Environmental

METHODOLOGY ELEMENT ASSESSMENT REPORT: VCS
Version 3
v3.0 65
consultation process,
undertaken by the
methodology
developer
Advisory Board. (see below)
Feedback was considered and
incorporated in the methodology /
module development, as evident from
earlier versions and the series of white
papers developed during 2011/12.
4.1.17 The
methodology
developer shall ensure
that a representative
group of experts
participates in the
consultation,
including, but not
limited to,
representation from
industry,
environmental non-
governmental
organizations, and
government or other
regulatory bodies.
Fulfilled Participant lists include i.a. following
groups:
Industry: GM/Chevrolet, Campuses (as
‘operators’),
Environmental non-governmental
organizations: Climate Group, CECS,
Government or other regulatory bodies:
EPA staff
The number of individuals consulted
demonstrates representative
consultation across these groups.
4.1.17 A report on the
expert consultation
process and outcome
shall be prepared and
submitted to the
VCSA when the
methodology is
submitted under the
methodology approval
process.
Fulfilled Reference:
Stakeholder Consultation Report
(i.e., Appendix 4 of the Module)
4.1.18 Where there is
heterogeneity of
performance
(measured in terms of
the performance
Fulfilled Stratification distinctions constitute
multiple benchmarks for each Carnegie
class by source of carbon credits
sought.

METHODOLOGY ELEMENT ASSESSMENT REPORT: VCS
Version 3
v3.0 66
benchmark metric)
that may be
practicably achieved
by individual projects,
multiple benchmarks
or correction factors
may be required.
· technologies and/or measures which may be implemented at both greenfield and brownfield sites
· larger and smaller scale project activities
· Any other circumstances related to the baseline scenario or project activity, such as plant age, raw material quality and climatic circumstances, that lead to heterogeneity of performance
Adjustments for changes in size are
conservatively incorporated during
project and baseline periods. Other
adjustments also include weather
adjustments (e.g. Appendix 6) and
reflect correction factors for BAU EE
gains (1.3% discounts to the baseline).
4.3.4 Where the
methodology uses a
performance method
for determining
additionality, the
applicability conditions
shall ensure that the
project implements
technologies and/or
measures that cause
substantial
performance
improvement relative
to the crediting
baseline and what is
Fulfilled Applicability conditions include
ACUPCC ”leading best practice”
measures, at least two of which need to
be implemented for passing eligibility
test. Update of those technologies after
5 years ensures the module remaining
consistent with technical development.

METHODOLOGY ELEMENT ASSESSMENT REPORT: VCS
Version 3
v3.0 67
achievable within the
sector, and the
methodology shall
explicitly specify such
technologies and/or
measures (or
examples thereof).
4.3.5 The applicability
conditions shall
establish the scope of
validity of the
methodology, and
where multiple
benchmarks are
established, each
performance
benchmark, including
the geographic scope.
In establishing the
scope of validity of the
methodology or each
performance
benchmark, the
methodology shall
clearly demonstrate
that there is similarity
across the sub-areas
of the geographic
scope in factors such
as socio-economic
conditions, climatic
conditions, energy
prices, raw material
availability and
electricity grid
emission factors, as
such factors relate to
the baseline scenario
and additionality,
noting that variation is
Fulfilled Geographical scope limited to USA,
therefore socio-economic conditions
considered homogenous. Correlation to
climatic conditions is addressed via
additionality testing on weather
adjusted basis if the additionality
eligibility period is only one year long
(via test 2S-B and 2E-B and appendix
6). The module also established
performance metrics in ways that
addressed electricity grid emission
factors (see Appendix 5).
Furthermore, the segregation by
campus type as reporting to ACUPCC
meets the requirement since these
were the only stratifications that
ACUPCC itself established for
campuses their GHG emissions and
variances between segments (for PB
purposes) was nonetheless modest.

METHODOLOGY ELEMENT ASSESSMENT REPORT: VCS
Version 3
v3.0 68
permitted where
correction factors
address such variation
as set out in Section
4.1.18.
It may be necessary to
stratify and establish
multiple performance
benchmarks, or to limit
the applicability of the
methodology, to
comply with this
requirement
4.3.6 The applicability
of the methodology or
a performance
benchmark shall be
limited to the
geographic area for
which data are
available, or it shall be
demonstrated that
data from one
geographic area are
representative of
another or that it is
conservative to apply
data from one
geographic area to
another.
Fulfilled Geographical scope limited to USA
where data from campuses reporting to
ACUPCC is available.
4.5.4 The
methodology shall
identify alternative
baseline scenarios
and determine either
the most plausible
baseline scenario or
an aggregate baseline
scenario for the
project activity.
Fulfilled Baseline scenarios is demonstrably the
campus’ individual historical
performance; adjusted for annual
improvements as statistically
determined, respectively for fast-
growing campuses. Historical
baselines are the most plausible
scenario given the continuous
improvements campuses make
retrofitting and upgrading their campus

METHODOLOGY ELEMENT ASSESSMENT REPORT: VCS
Version 3
v3.0 69
Aggregate baseline
scenarios shall be
determined by
combining likely
scenarios on a
probabilistisc (ie,
likelihood) basis.
energy systems.
4.5.5 The
performance
benchmark shall be
established based
upon available
technologies and/or
current practices, and
trends, within the
sector. Where the
analysis of trends
shows a clear trend of
improvement in the
baseline scenario over
time, the performance
benchmark shall take
account of the trend.
This means that
where the
performance
benchmark does not
use a dataset that is
updated at least
annually, an
autonomous
improvement factor
shall be used that
provides a
performance
benchmark that
tightens annually.
Fulfilled Benchmark definition based on ‘current
practices/trends’ as periodically
updated (every 5 years) so that current
best practice performance is applied.
The PB data set will also be updated
every 5 years, with interim reviews
posted every 2-3 years.
Furthermore, as an autonomous
improvement factor, the BAU 1.3%
energy efficiency gains are nonetheless
deducted from the baseline to
conservatively adjust for US average
energy efficiency gains.
4.5.6 Appropriate data
sources for developing
performance methods
Fulfilled
Performance benchmark based on
ACUPCC reporting data (ie, publicly

METHODOLOGY ELEMENT ASSESSMENT REPORT: VCS
Version 3
v3.0 70
include economic and
engineering analyses
and models, peer-
reviewed scientific
literature, case
studies, empirical
data, and common
practice data.
available, peer reviewed empirical data)
covering geographical scope (US)
extensively and allowing adequate
stratification. Transparency and periodic
updating are given with the selected
approach.
Data sources are primary, peer-
reviewed, public and (for LEED) third
party certified. Representing the largest
and longest data bases available in the
US for campus wide and individual
building performance, they are robust
data sources. Furthermore, this data,
which informs the PB levels
established, will be updated
continuously by LEED and ACUPCC
via further member reporting, while
every 5 years it will be accessed again
to refine PB performance
requirements. The resulting PB
analyses have been made public in
Appendix 5 under custody
arrangements that comply with VCS
requirements.

METHODOLOGY ELEMENT ASSESSMENT REPORT: VCS
Version 3
v3.0 71
B) Campus Clean Energy Efficiency LEED Certified Buildings Module
VCS methodology requirement
Compliance status Evaluation
4.1.14 In case the
level of the
performance
benchmark metric for
determining
additionality and for
the crediting baseline
are different, how is
this difference
justified?
Not applicable Performance benchmark for determining
additionality and crediting baseline are
identical for each EB-A and EB-B/NC,
resp.:
For EB-A, historical (project) baselines
are used so the question of
comparability between performance
benchmarks for baselines and
additionality assessment does not arise.
. Therefore the requirement is not
applicable.
For LEED NC and EB-B, the
performance benchmark determining
additionality and crediting baseline are
identical, both referencing the 50th
percentile performance levels:
· for additionality, based on LEED’s
50th percentile performance level
(to determine beyond business as
usual performance levels)
· for the baseline, EPA’s national
50th percentile performance level.
This approach captures the substantial
improvement delivered by the buildings
while keeping the baseline and
additionality metrics comparable.
4.1.17 The
methodology shall
provide a description
and analysis of the
current distribution of
performance within
the sector as such
Fulfilled Statistical data provided by USGBC and
EPA Energy Star, resp.
Analyzed in terms of normal distribution
for each EB-A,EB-B and NC, resp.
Performance Benchmarks selected are
conservatively establishing a
performance level (at LEED average

METHODOLOGY ELEMENT ASSESSMENT REPORT: VCS
Version 3
v3.0 72
performance relates
to the applicability of
the methodology or
each performance
benchmark.
levels) comparable to the top 14% of
buildings on national basis.
4.1.17 The
methodology shall
also provide an
overview of the
technologies and/or
measures available
for improving
performance within
the sector, though an
exhaustive list is not
required recognizing
that performance
methods may be
somewhat agnostic
with respect to the
technologies and/or
measures
implemented by
projects.
Fulfilled USGBC has provided an overview of
technologies and measures relative to
each building’s certification status
outlining the achievements to which the
certified building can attest. These
measures are consistent with the
relevant LEED certification building
measures for energy and GHG’s.
Description of these measures is
contained in section 4.2 and Appendix
2B in the module.
Application of min. 2 different measures
required;
4.1.17 The
methodology shall
discuss and evaluate
the tradeoff between
false negatives and
false positives and
shall describe
objectively and
transparently the
evidence used
(including reference to
primary and
secondary data
sources), experts
consulted,
assumptions made,
Fulfilled
By applying the 85% percentile for each
identified campus type, false negatives
are precluded (i.e., target is realistically
achievable) while conservative with
respect to not allowing for BAU
measures to apply for emission
reductions.
Stakeholder consultation is documented,
covered the performance benchmark
metric.
Robustness of the module vs.
increase/decrease of campus size
(square area) also proven.

METHODOLOGY ELEMENT ASSESSMENT REPORT: VCS
Version 3
v3.0 73
and analysis
(including numerical
analysis) and process
undertaken in
determining the
selected level(s) of
the performance
benchmark metric
(noting that expert
consultation is a key
part of this process,
as set out below). The
selected level(s) shall
not systematically
overestimate GHG
emission reductions
or removals.
False trade offs were addressed via
a) Careful stratification; the
module avoided using overly
generalized additionality
benchmarks by stipulating
PBs for each distinct LEED
certification and sector. Thus,
instances of false positives
and negatives were minimized
since there were salient
differences in the PB’s arising
for each category.
b) Adjustments for sq ft, weather,
occupancy and other
variances achieved via the
application of the EPA TF tool
c) Sound stakeholder
consultation process to
establish PBs
d) Pilot project pressure testing
to provide further input and
refinements to the module’s
parameters
4.1.17 The process of
determining the
level(s) of the
performance
benchmark metric
shall include and be
informed by an expert
consultation process,
undertaken by the
methodology
Fulfilled
Several rounds of stakeholder
consultations as documented by
references /P32/
Relevant stakeholders have been invited
to contribute their views. Particularly
detailed inputs were provided by
Chevrolet Environmental Advisory Board
and USGBC. (see below)
Feedback was considered and
incorporated in the methodology /

METHODOLOGY ELEMENT ASSESSMENT REPORT: VCS
Version 3
v3.0 74
developer module development, as evident from
earlier versions and the series of white
papers developed during 2011/12.
4.1.17 The
methodology
developer shall
ensure that a
representative group
of experts participates
in the consultation,
including, but not
limited to,
representation from
industry,
environmental non-
governmental
organizations, and
government or other
regulatory bodies.
Fulfilled
Participant lists include i.a. following
groups:
Industry: GM/Chevrolet, Campuses (as
‘operators’),
Environmental non-governmental
organizations: Climate Group, CECS,
Government or other regulatory bodies:
EPA staff
The number of individuals consulted
demonstrates representative
consultation across these groups.
4.1.17 A report on the
expert consultation
process and outcome
shall be prepared and
submitted to the
VCSA when the
methodology is
submitted under the
methodology approval
process.
Fulfilled Reference:
Stakeholder Consultation Report
(i.e., Appendix 4 of the Module)
4.1.18 Where there is
heterogeneity of
performance
(measured in terms of
the performance
benchmark metric)
that may be
practicably achieved
Fulfilled
Stratification distinctions constitute
multiple benchmarks for each LEED
category (NC/EB-A/EB-B) and sector
(higher ed, higher ed lab, k-12 school).
Main distinctions: New-Built vs. Existing
Building, reasonable since existing
buildings leaving less choice for design
and improvement potentials.

METHODOLOGY ELEMENT ASSESSMENT REPORT: VCS
Version 3
v3.0 75
by individual projects,
multiple benchmarks
or correction factors
may be required.
· technologies and/or measures which may be implemented at both greenfield and brownfield sites
· larger and smaller scale project activities
· Any other circumstances related to the baseline scenario or project activity, such as plant age, raw material quality and climatic circumstances, that lead to heterogeneity of performance
Further stratification by type of school
(school / campus / campus lab building)
as having according metrics. Further
distinctions demonstrated to be
negligible within USGBC’s own
stakeholder consultation.
Adjustments for changes in size are
conservatively incorporated during
project and baseline periods. Other
adjustments also include weather
adjustments (e.g. Appendix 6) and
reflect correction factors for BAU EE
gains (1.3% discounts to the baseline).
Well stratified, tailored results
addressing specific circumstances
material to the baseline and crediting
are therefore ensured.
4.3.4 Where the
methodology uses a
performance method
for determining
additionality, the
applicability conditions
shall ensure that the
project implements
technologies and/or
measures that cause
substantial
performance
improvement relative
to the crediting
baseline and what is
achievable within the
sector, and the
Fulfilled Applicability conditions include
application of at least 2 ”best practice”
measures as having been implemented
and proven in LEED-certified buildings.
Application of this criterion is transparent
and best practice repertoire will remain
periodically updated (5-year interval).
Further explicit specification of eligible
technologies within the module itself
would be counterproductive
(prescriptive, inflexible).

METHODOLOGY ELEMENT ASSESSMENT REPORT: VCS
Version 3
v3.0 76
methodology shall
explicitly specify such
technologies and/or
measures (or
examples thereof).
4.3.5 The applicability
conditions shall
establish the scope of
validity of the
methodology, and
where multiple
benchmarks are
established, each
performance
benchmark, including
the geographic scope.
In establishing the
scope of validity of the
methodology or each
performance
benchmark, the
methodology shall
clearly demonstrate
that there is similarity
across the sub-areas
of the geographic
scope in factors such
as socio-economic
conditions, climatic
conditions, energy
prices, raw material
availability and
electricity grid
emission factors, as
such factors relate to
the baseline scenario
and additionality,
noting that variation is
permitted where
correction factors
Fulfilled
Geographical scope limited to USA,
therefore socio-economic conditions
considered homogenous. Correlation to
climatic conditions is addressed via EPA
TF tool, alongside any changes in
square footage or occupancy shifts.
The module also established
performance metrics in ways that
addressed electricity grid emission
factors (see Appendix 5).
Furthermore, the segregation by
buildings type based on LEED
certification scheme and according
performance data meets the
requirement since each has separate
distinct performance benchmarks.
Whereas USGBC concluded that a
further stratification would be not
required to refine the statistical data, it is
for the methodology module adequate to
follow a consistent approach.

METHODOLOGY ELEMENT ASSESSMENT REPORT: VCS
Version 3
v3.0 77
address such
variation as set out in
Section 4.1.18.
It may be necessary
to stratify and
establish multiple
performance
benchmarks, or to
limit the applicability
of the methodology, to
comply with this
requirement
4.3.6 The applicability
of the methodology or
a performance
benchmark shall be
limited to the
geographic area for
which data are
available, or it shall be
demonstrated that
data from one
geographic area are
representative of
another or that it is
conservative to apply
data from one
geographic area to
another.
Fulfilled Geographical scope limited to USA
where data from USGBC / LEED is
available.
Further consideration of regional
differences is given in terms of regional
fuel mix for electricity generation.
Consistent with information from
USGBC a further regional stratification
would not be justified.
4.5.4 The
methodology shall
identify alternative
baseline scenarios
and determine either
the most plausible
baseline scenario or
an aggregate baseline
scenario for the
project activity.
Aggregate baseline
Fulfilled Baseline scenarios distinguished by
project type:
EB-A: Historical baseline is the most
plausible scenario given the continuous
improvements and retrofitting efforts;
this is also consistent with USGBC
approach.
NC/EB-B: all potential alternative
‘baseline scenarios’ are covered within
the statistical approach and datasets.

METHODOLOGY ELEMENT ASSESSMENT REPORT: VCS
Version 3
v3.0 78
scenarios shall be
determined by
combining likely
scenarios on a
probabilistic (ie,
likelihood) basis.
Application of 50th percentile criterion
characterizes the more stringent ones.
The reductions will thus reflect the
substantial improvements made to reach
the PB performance levels since the
same percentile level (50th) has been
applied in the baseline scenario (ES50)
and the minimum project performance
requirements (>LEED 50th percentile).
4.5.5 The
performance
benchmark shall be
established based
upon available
technologies and/or
current practices, and
trends, within the
sector. Where the
analysis of trends
shows a clear trend of
improvement in the
baseline scenario
over time, the
performance
benchmark shall take
account of the trend.
This means that
where the
performance
benchmark does not
use a dataset that is
updated at least
annually, an
autonomous
improvement factor
Fulfilled
Benchmark definition based on ‘current
practices/trends’ as updated annually
based upon published certification
requirements by USGBC, so that current
best practice performance can applied.
Publication of updated datasets for this
module will take place every 2-3 years
(beyond VCS requirements) is thus
ensured alongside VCS’s PB updates
every 5 years.

METHODOLOGY ELEMENT ASSESSMENT REPORT: VCS
Version 3
v3.0 79
shall be used that
provides a
performance
benchmark that
tightens annually.
4.5.6 Appropriate data
sources for
developing
performance methods
include economic and
engineering analyses
and models, peer-
reviewed scientific
literature, case
studies, empirical
data, and common
practice data.
Fulfilled Performance benchmark based on
EPAs Energy Star program statistics
and USGBC reporting data (i.e., publicly
available, empirical data confirmed by
independent 3rd party assessment)
respectively, covering geographical
scope (US) extensively and allowing
adequate stratification. Transparency
and periodic updating are given with the
selected approach.
Data sources are primary, peer-
reviewed, public and (for LEED) third
party certified. Representing the largest
and longest data bases available in the
US for campus wide and individual
building performance, they are robust
data sources. Furthermore, this data,
which informs the PB levels established,
will be updated continuously by LEED
and ACUPCC via further member
reporting, while every 5 years it will be
accessed again to refine PB
performance requirements. The
resulting PB analyses have been made
public in Appendix 5 under custody
arrangements that comply with VCS
requirements.

METHODOLOGY ELEMENT ASSESSMENT REPORT: VCS
Version 3
v3.0 80
Appendix-C
This addendum validates how the CCEE Campus-wide module meets requirements of the
VCS Standard 4.5.6.
The CCEE Campus-wide module refers to data collected and published under the ACUPCC
reporting scheme. This data is used to create the performance benchmarks (not the
baselines which are historical). Since the ACUPCC data comprises reports submitted by
campuses, it constitutes by definition a secondary source. ACUPCC is an independent non
profit organizations, recognized for the integrity of its reporting systems by the US EPA.
Furthermore, as outlined below, the ACUPCC data is also subject to a series of group peer-
review processes based on reporting systems well aligned towards accurate reporting,
Consequently the requirements of VCS Standard Section 4.5.6(2) apply:
2) Data collected from secondary sources shall be available from a recognized,
credible source and must be reviewed for publication by an appropriately qualified,
independent organization or appropriate peer review group, or be published by a
government agency.
General:
The ACUPCC reporting requirements are clearly specified under its reporting guidelines
http://rs.acupcc.org/instructions/ghg/
These requirements
- reference the use of the CACP calculator or custom tool, which if used must a) be justified and b) variances to the CACP tool be referenced;
- emission coefficients must be described, esp. if not using the CACP tool defaults which are considered as satisfactory;
- GWP, de minimis thresholds and other elements are clearly included in the instructions as requiring references and justification; CACP defaults are acceptable;
- The stationary combustion and scope 2 electricity emissions have specific separate reporting instructions which define them and reference both CAR and the CACP reporting system (and where they are found in the CACP tool) -- both of which are acceptable;
- Note that square footage is also an ACUPCC reporting parameter with supporting instructions as are HDD and CDD.
Regarding ACUPCC and reporting campuses being “a recognized, credible source”:

METHODOLOGY ELEMENT ASSESSMENT REPORT: VCS
Version 3
v3.0 81
ACUPCC is
- an independent organization, separate from the reporting campuses; - professionally staffed; publishing public accountable reports - is subject to oversight of an independent board representing diverse - http://www.presidentsclimatecommitment.org/about/governance
The US EPA, a government agency also expressly endorsed ACUPCC as a credible
secondary source and supports ACUPCC:
- ACUPCC received the EPA Environmental Merit and Lifetime Achievement awards in 2013: this provides a government agency endorsement of the ACUPCC reporting program.
- http://www.presidentsclimatecommitment.org/
A broad range of other partners also endorse ACUPCC spanning the nation’s leading
independent NGO’s and higher education associations
(see http://www.presidentsclimatecommitment.org/resources/partners-endorsers ).
The credibility of the ACUPCC data as the foundation for the performance metrics is further
supported as the stakeholder consultation process which did not object to use the reported
data or suggest to include additional verification mechanisms. The stakeholder consultation
process’ purpose is centrally focused on ensuring that credible levels of performance are set
for the performance benchmarks, obviously set in the context of the data from which they are
derived.
Integrity of reported data
The data set used to develop the ACUPCC metrics is substantial (>150 campuses per
category), such that any unspotted variances would be statistically immaterial. The
development of the performance benchmark metrics nonetheless excludes the very few
potential outliers to be conservative. The reporting required by campuses is not complex or
subject to likely error: it's based on kwh and fuel inputs with emission factors. The
calculations are undertaken automatically with the CACP tool based on these inputs based
on credible default emission factors; all inputs and factors can be double-checked by VVBs
using the CACP calculator (and thus are easily verifiable). Custom reporting tools are
permitted by ACUPCC but, as part of their reporting requirements, must describe and justify
variances to the CACP tool; transparency is thus assured for VVB’s.
The integrity of the reporting is also seen via the performance curves themselves which
a) form performance curves across narrow comparable bands;
b) have PBs which do not exhibit widely different figures;

METHODOLOGY ELEMENT ASSESSMENT REPORT: VCS
Version 3
v3.0 82
c) have performance curves that are completely consistent with the historical behavior for
GHG reductions for each sector (e.g. BACC colleges have are larger portion of campuses
achieving stat 1 + scope 2 total absolute reductions -- and as a group they pioneered the
GHG reduction goals the earliest).
Some campuses have voluntarily undertaken third party audits and their data are not
outliers; other reporting campuses have results which are well aligned along the same
performance curve.
Incentives to report in a credible, accurate fashion are also very strong: campuses review
their ACUPCC reports with sustainability committees before publication which involves
review from senior expert faculty; University Presidents sign onto AUCPCC personally AND
ARE THUS ACCOUNTABLE PROFESSIONALLY (in financial markets this would trigger
accountability under the Sarbanes Oxley regulations); the university’s reputation is on the
line and a GHG report will not be made in ways that put such valuable reputational (and
revenue) equity at risk
Finally, there is no incentive towards overstatement of emissions (to inflate baselines) since
ACUPCC reporting is designed to drive towards campuses' GHG reduction goals.
Correct reporting is essential for ACUPCC and its signatories as errors or misleading
statements would directly affect the institutions’ reputation:
“accountability for meeting the terms of the Commitment comes through the public reporting.
If an ACUPCC institution is “not in good standing” because they miss a reporting deadline
this will be highlighted in the ACUPCC Reporting System, and that institution’s stakeholders
– the students, faculty, staff, alumni, administrators, trustees, etc. – will take the necessary
steps to get the institution back on track and in good standing. Institutions of higher
education take commitments – even voluntary ones – very seriously, and because so their
credibility and reputation rely on their integrity on following through on such promises, this
mechanism of accountability through public reporting is more powerful than the self-imposed
threat of fines or regulation.”
(Source: http://www.presidentsclimatecommitment.org/about/faqs)
Data review and Peer review processes
ACUPCC undertakes its own analysis of the data reported each year to promote peer-to-
peer review through annual reports, case study reviews, synthesis of sector-wide data,
benchmark setting averages through for campuses’ individual comparison, etc.
(for details see e.g.
http://www.presidentsclimatecommitment.org/reporting/annual-report

METHODOLOGY ELEMENT ASSESSMENT REPORT: VCS
Version 3
v3.0 83
http://rs.acupcc.org/stats/
Support in reporting and review of data is granted by involvement of an expert organization “Second Nature”, serving as supporting organization to ACUPCC. http://www.presidentsclimatecommitment.org/about/contact
All reports are publicly available and subject to peer review by all university peers, NGO’s,
experts, public and ACUPCC itself. Every single one of the public reports from over 600
universities is public; most campuses have multiple reports registered, not only for emissions
annually but for their CAP also (see: http://rs.acupcc.org/ ).
The purpose of publication is clearly stated, i.e., to hold campuses “accountable by publicly
reporting on their progress.”
Also, “(ACUPCC) Signatories are part of a learning community, where they share best-
practices, resources and success stories, and have a meaningful voice in improving
standards and protocols in the space.”
ACUPCC operates a system by which questions regarding campuses’ GHG reports can be
logged and sent directly to ACUPCC. According to interview information, a dedicated staff
member reviews any inquiries and forwards them to the campus concerned. The campus’
responses to these questions are then returned to ACUPCC and sent back to the person
asking the question. Leading universities have themselves received several questions
through this system. Thus there is an active peer-to-peer review process which ACUPCC
facilitates on a campus-to-campus basis.
ACUPCC has also convened a 20 person peer-to-peer council to actively support this peer
review process for ACUPCC members’ GHG accounting and climate reporting (see
http://www.presidentsclimatecommitment.org/il-support-committee ). The Implementation
Liaison (IL) Support Committee has been convened to provide peer-to-peer support to
individuals responsible for implementing the ACUPCC at signatory institutions. Members
serving have required experience, including specifically (listed first) GHG accounting and
CAPs, such that they:
- “Have demonstrated successful implementation efforts toward fulfilling the ACUPCC, including but not limited to the following areas:
o GHG Accounting
o Climate Action Planning
o Sustainability Action Planning

METHODOLOGY ELEMENT ASSESSMENT REPORT: VCS
Version 3
v3.0 84
o Developing Institutional Capacity
o Developing Climate and Sustainability Curriculum
o Transportation Planning
o Green Building
sharing of experience, information, and expertise.
- Their role is to actively “Develop relationships with individuals responsible for implementing the ACUPCC.”
- http://www.presidentsclimatecommitment.org/files/documents/acupcc-il-support-committee.pdf
- ACUPCC”s Presidential Fellows (a second separate group) also share a similar role providing expert faculty consultation
- Presidential Fellows work directly with ACUPCC signatory presidents and their teams to assist them in fulfilling their commitments.
- http://www.presidentsclimatecommitment.org/presidentialfellows The fact that ACUPCC has set up a committee to liaise in this way demonstates its
institutional commitment to the peer-review process.
ACUPCC also organizes, facilitates and affiliates with regional networks of campuses (e.g.
BIG 10, IVY LEAGUE, PAC 10, PAC 12, SE Conference) where peer-to-peer reviews take
place during in person meetings held on an annual or more frequent basis.
(e.g., Midwestern campus group meeting set up by ACUPCC at AASHE conference this
year)
It should be noted that Universities are strongly committed to such peer review processes.
The AASHE 2013 conference, for example, was just held in Nashville brought together more
than 1700 attendees. The major focus of the organization is its STARS reporting tool:
workshops on this topic, particularly with the recent 2.0 updates, were a strong focus.
University institutions do not make any reporting commitment lightly; their cultures are ones
that prize excellence, intellectual integrity and peer-to-peer exchange (the basis of all
academic endeavor with published papers). ACUPCC reporting is no different.
Any university GHG report will itself have undergone peer scrutiny via the university’s
sustainability committee before publication. These committees comprise the nation’s leading
faculty and academics in this domain, alongside sustainability, senior administration and
expert personnel.
ACUPCC and its signatories recognize the power of the public reporting and its peer review
transparency:

METHODOLOGY ELEMENT ASSESSMENT REPORT: VCS
Version 3
v3.0 85
- “accountability for meeting the terms of the Commitment comes through the public reporting. If an ACUPCC institution is “not in good standing” because they miss a reporting deadline this will be highlighted in the ACUPCC Reporting System, and that institution’s stakeholders – the students, faculty, staff, alumni, administrators, trustees, etc. – will take the necessary steps to get the institution back on track and in good standing. Institutions of higher education take commitments – even voluntary ones – very seriously, and because so their credibility and reputation rely on their integrity on following through on such promises, this mechanism of accountability through public reporting is more powerful than the self-imposed threat of fines or regulation.”
- o0o -