methodology for choosing test parameters to evaluate ... roberte.berger nicholasj.calvano...
TRANSCRIPT

NAT L INST. OF STAND 4 TECH R.I.C.
Referertcems m^ Publi -^cations
AlllDM 3bllD7
IVIBSIR 7E-1547
Methodology for Choosing TestParameters to EvaluateProtective Headgear
Robert E. Berger
Nicholas J. Calvano
Product Safety Technology Division
Center for Consumer Product Technology
November 1978
100
.U56
EPARTMENT OF COMMERCE
lAL BUREAU OF STANDARDS
78-1547
I /ng


Pis'Ksnal Burai #f %UxiC££<^^
MAY 1 i »fl
NBSIR 78-1547
METHODOLOGY FOR CHOOSING TESTPARAMETERS TO EVALUATEPROTECTIVE HEADGEAR
Robert E. Berger
Nicholas J. Calvano
Product Safety Technology Division
Center for Consumer Product Technology
November 1978
U.S. DEPARTMENT OF COMMERCE, Juanita M. Kreps, Secretary
Dr, Sidney Harman, Under Secretary
Jordan J. Baruch, Assistant Secretary for Science and TechnologyNATIONAL BUREAU OF STANDARDS, Ernest Ambler, Director
'UlUA' ,r ^ u \ .['.'Ovli
;

(» iMrl IWtlil
T83T fl0tY5«4«€lp<t3M
JAMOJTAKI'
’

Table of Contents
I. INTRODUCTION 1
A. Head Injury and Tolerance 1
B. Test Methods 2C. Methodology in Developing Test Methods 3
II. APPROACH 5
A. A Set of Test Parameters 5B. Choice of Helmets 5
C. Limiting Averages 6
D. Determination of Effect of Changing Parameters 6
III. MATERIALS AND METHODS 8
A. Materials 8
B. Methods 9
IV. RESULTS 11
A. Summary of Data 11
B. Effect of Changing Test Parameters 11
V. DISCUSSION
A. Effect of Changing ParametersB. Test Methods 17
C. Relation of this Work to Previous Studies 20
VI. SUMMARY 23
REFERENCES 24
APPENDIX 26


List of Tables and Figures
Table 1.
Table 2.
Table 3.
Table 4.
Table 5.
Table 6.
Table 7.
Table 8.
Table 9.
Table 10.
Table 11.
Table 12.
Figure 1.
Figure 2.
Figure 3.
Figure 4.
Figure 5.
Figure 6.
Figure 7.
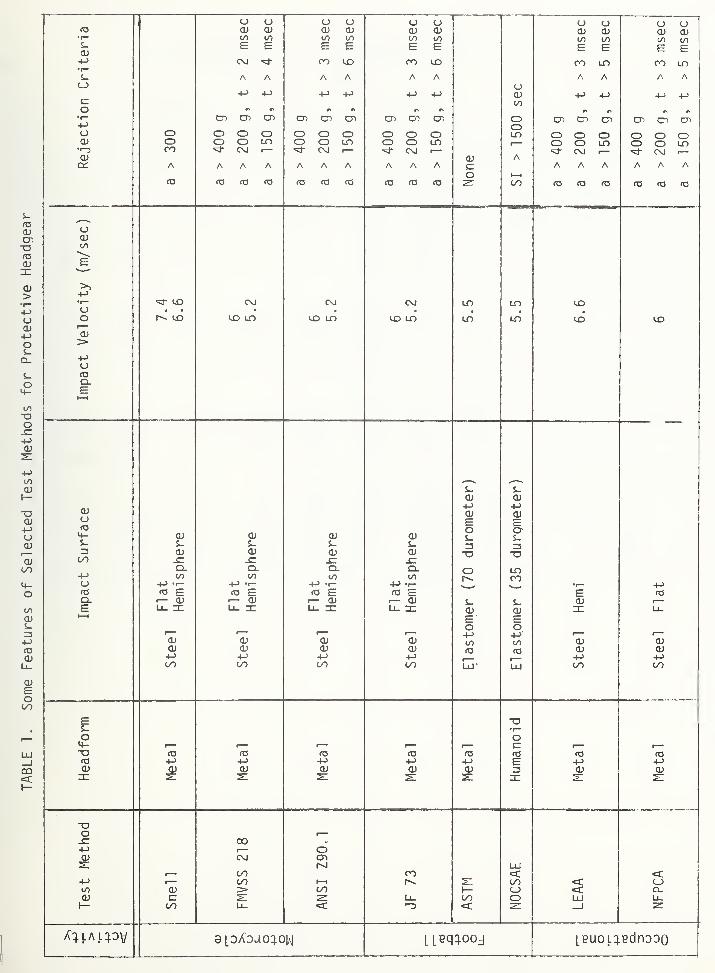
Some Features of Selected Test Methods for Protective Headgear
Limiting Average Data for Top Impacts, V = Vj^ = 4.5 m/sec
Limiting Average Data for Back Impacts, V = Vj^ = 4.5 m/sec
Limiting Average Data for V = = 5 m/s
Regression and Correlation Coefficients for A_ vs. SI
\,ax= CiSI - 4
Effect of Changing Input Parameters - Summary of TestConditions
Regression and Correlation Coefficients for Effect of ChangingHead form
Regression and Correlation Coefficients for Effect of ChangingImpact Surface
Regression and Correlation Coefficients for Effect of ChangingVelocity
Relation Between Early Impacts and Limiting Average
Comparison Data Between NOCSAE and ASTM Recommended TestMethods
Comparison of Metal Headform with "Soft" Headform (Metal
Headform Coated with Resilient Material) for MotorcycleHelmets, from Sourthwest Research Institute
Schematic of Focus for this Report
Wayne State University Tolerance Curve
Relationship Between HIC and SI
Limiting Average
Order of Tests on Soft and Hard Surfaces
Helmet Energy Absorbing Systems
Metal and Humanoid Headforms

Figure
Figure
Figure
Figure
Figure
Figure
Figure
Figure
Figure
8. Force-Disp)lacement Curves for Hard and Soft Test Surfaces
9. Metal Headform on Monorail
10. Ball/Socket In Metal Headfonn
11-12 Typical Curves for Humanoid ar»d Metal Headform
13-14 Fit of Power Law and Straight Line Curves to Data Points
15. SI vs. - Top Impacts
16. SI vs. - Back Impacts
17. Metal vs. Humanoid Headform - Hard and Soft Surfaces - TopImpacts
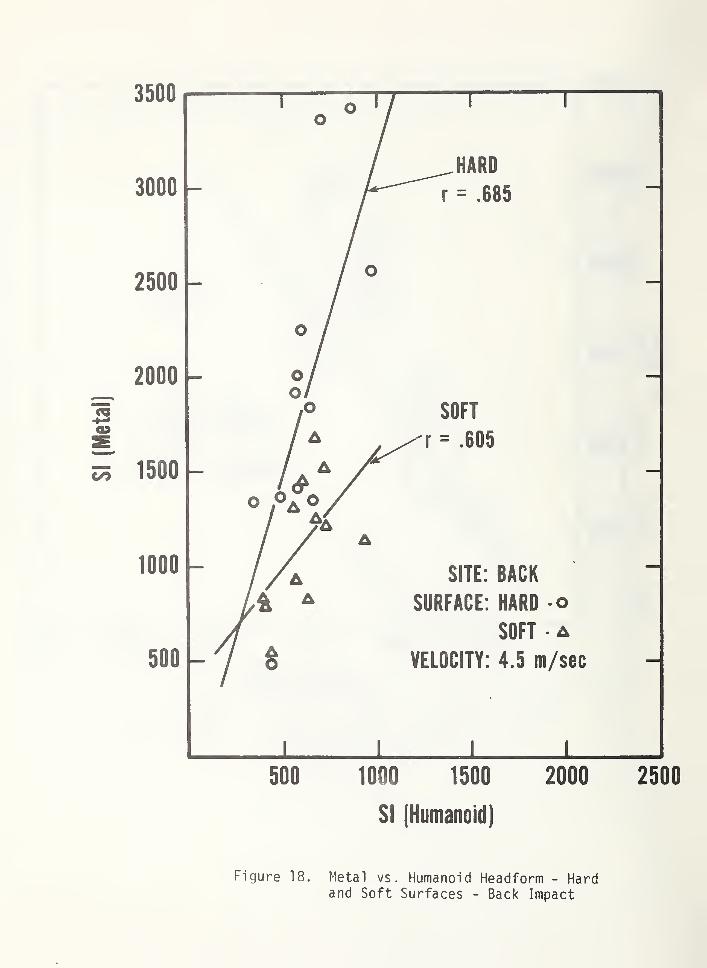
18. Metal vs. Humanoid Headform - Hard and Soft Surfaces - BackImpact
Figure 19.
Figure 20,
Figure 21
.
Figure 22.
Figure 23.
Figure 24.
Figure 25,
Figure 26.
Figure 27.
Figure 28.
Figure 29.
Figure 30.
Figure 18 and 19 combined
Hard vs. Soft Surfaces - Top Impact
Hard vs. Soft Surfaces - Back Impact
Hard vs. Soft Surfaces - Top and Back Impacts at High Velocity
Low vs. High Velocity - Metal Headfonn - Top Impact
Low vs. High Velocity - Metal Headform - Back Impact
Metal Headform/Soft Surface vs. Humanoid Headfonn/Hard Surface
Force vs. Displacenent Curves for Helmeted Headforms
Humanoid Headform Rotation
Schematic Representation of Headform Rotation
Sensitivity of Test Method
HIC/Metal vs. HIC Humanoid
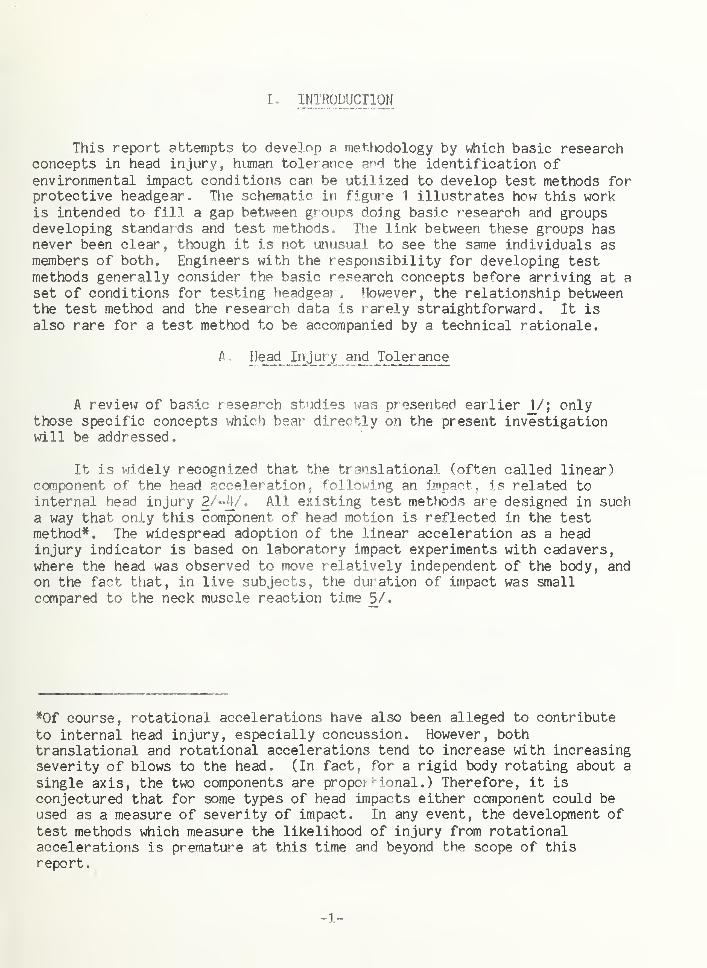
I, INTRODUCTION
This report attempts to develop a methodology by v^ich basic researchconcepts in head injury, human tolerance and the identification ofenvironmental impact conditions can be utilized to develop test methods forprotective headgear. The schematic in figure 1 illustrates how this workis intended to fill a gap between groups doing basic research and groupsdeveloping standards and test methods. The link between these groups hasnever been clear, t^^ough it is not unusual to see the same individuals asmanbers of both. Engineers with the responsibility for developing testmethods generally consider the basic research concepts before arriving at a
set of conditions for testing headgear . However, the relationship betweenthe test method and the research data is rarely straightforward. It is
also rare for a test method to be accompanied by a technical rationale.
^ Tolerance
A review of basic research studies was presented earlier \/\ onlythose specific concepts which bear directly on the present investigationwill be addressed.
It is widely recognized that the translational (often called linear)component of the head acceleration, following an impact, l<; related tointernal head injury 2/-V. All existing test methods are designed in sucha way that only this ccxnponent of head motion is reflected in the testmethod*. The widespread adoption of the linear acceleration as a headinjury indicator is based on laboratory impact experiments with cadavers,
where the head was observed to move relatively independent of the body, andon the fact that, in live subjects, the duration of impact was small
compared to the neck muscle reaction time 5/.
*0f course, rotational accelerations have also been alleged to contribute
to internal head injury, especially concussion. However, bothtranslational and rotational accelerations tend to increase with increasingseverity of blows to the head. (In fact, for a rigid body rotating about a
single axis, the two components are proportional.) Therefore, it is
conjectured that for some types of head impacts either component could beused as a measure of severity of impact. In any event, the development of
test methods which measure the likelihood of injury from rotationalaccelerations is premature at this time and beyond the scope of thisreport.
- 1 -

In the early sixties, Wayne State University (WSU) developed a humantolerance curve which relates concussive injury to linear headacceleration and duration of impact (figure 2). This curve was based ondata obtained from studies with cadavers and sub-human primates. While theshortcomings of this tolerance curve have been rigorously discussed 7/ -
9/, it remains the most widely accepted compendium of concussion tolerance.Using the Wayne State University Tolerance Curve, Gadd developed theSeverity Index, which is expressed mathematically as:
SI= ^
a^*^ dt
where a is the linear acceleration of the head, expressed as a multiple ofthe gravitational acceleration, and T is the duration of impact. Accordingto Hodgson 10/:
"Gadd derived a critical value of 1000 (the units for SI are seconds,though they are rarely mentioned) as being the threshold of danger tolife. . . He recognized that the Severity Index may be a function ofcontact area. . . Later on, Gadd suggested a critical value of SIequal to 1500. . .for distributed impact" 11/.
Another injury index, the head injury criterion, HIC, has been shownto be better related to the Wayne State data 12/. HIC was defined as
r
HIC =
2.5
adt (t2”t^
)
where t^ and t^ are those specific times during the duration of impact for
VNdiich the above expression is a maximum. As shown in figure 3, with datataken from several sources, HIC is well correlated to SI. According toHodgson, "the two are closely related for football helmet laboratory test
impacts, with the severity index being typically 15-187o higher than HIC"
5/,
B. Test Methods
There are many different standards and methods for testing protectiveheadgear in the United States. All were developed to provide some
measurable system for determining the suitability of a helmet for a
particular job. Table 1 lists the various helmet standards and testmethods currently available in this country.
-2

Some United States helmet standards make use of the WSU tolerancecurve in setting rejection criteria, others do not. The helmet standardthat makes maximum use of the biomedical information contained in the WSUcurve is the NOCSAE (National Operating Committee on Standards for AthleticEquipment) standard for football helmets 5/. This standard was developedby Voigt Hodgson of Wayne State University under the sponsorship of NOCSAE.It utilizes an instrumented resilient headform which responds to impacts ina manner similar to human heads. The NOCSAE test method requires arelatively soft impact surface and uses a rejection criterion of SI > 1500.Round robin tests have indicated that the NOCSAE test method does not meetreproducibility requirements which are normally demanded of standards 13/.Independent of reproducibility, there are other limitations which arediscussed later.
Probably the best known standard for helmets in this country is theANSI Z90 motorcycle helmet standard 14/. The only similarity between theZ90 and NOCSAE standards is the fact that both require dropping aninstrumented helmeted headform in guided free fall and measuring theresponse of the headform during impact. The Z90 method requires a metalheadform and a solid steel impact surface. To pass the Z90 test, a helmetmust attenuate sufficient impact energy to limit the headform accelerationto 400 g. The impulse duration is also limited by the Z90 standard.
Recently, the American Society for Testing Materials (ASTM) adopted a
test method for football helmets which utilizes the metal headform andinstrumentation of ANSI Z90 15/. Although performance criteria have notyet been established, laboratory tests 16/ have indicated that the ASTMmethod may rank football helmets differently than the NOCSAE method.Indeed, helmets may pass one test and fail the other. This could be ofgreat concern to manufacturers who design their helmets to meet a standardor to consumers \4ho are anxious to purchase helmets that meet a recognizedstandard.
C. Methodology in Developing Test Methods
The above discrepancy arises because no methodology exists for
guiding test method development. A properly utilized methodology would
give some degree of assurance to test method developers, and to producersand users, that the method correctly identifies inferior headgear. Withoutthis assurance, each test method can only be regarded as one means ofranking helmets under a given set of impact conditions. In effect, thetest methods are not now correlatable to absolute measures of effectiveness(i.e., to a ranking which corresponds to real life impact conditions).
The basic task in bridging the gap between "real life" and the testmethod is to identify the effect of changing impact parameters (refer to
figure 1). That is, we might consider any real life impact situation as a
fixed set of impact conditions (which depend upon the activity; actually,
- 3-

there may be several sets of conditions for an activity). Thecorresponding test method is some other set of impact conditions which mustbe different from the real life set (e.g., human subjects cannot be used totest headgear - such a test would not be reproducible, anyway). Thedifference between the real life situation and the test method can then beregarded as a change in one or more impact parameters. The effect of thesechanges must be determined if the relationship between the real lifesituation and the test method is to be understood.
The main purpose of this report is to experimentally identify, in somelimited cases, the effect of changing the most important test parameters.These include the following "input" parameters: the "head," or headformwhich holds the helmet, the impact surface with which the helmet makescontact, and the relative velocity between the helmet and impact surface.In addition, the "output" response, which determines the likelihood of headinjury (and, therefore, the adequacy of the protective headgear), isanother parameter which may differ among real life and various testmethods. Table 1 illustrates the variety of test parameters which are usedin existing protective headgear standards.
A systematic examination of the effect of changing test parameters wasbegun previously by mathematically modelling the components of the system:headform, helmet, impact surface _]_/• The results of this report, then,
can also be used for verification or modification of the model withexperimental data. Thus, if the predictions of the model can be shown to
agree with the experimental results for the limited parameter variations ofthe present study, it gives credence to its use under more generalconditions. Then the model becomes a tool for incorporating the basicresearch studies into a proper set of test parameters. As the state-of-the-art changes, modifications to the test method could be accomplishedrapidly, without time consuming experimental programs. This re-examinationof the model, in light of the experimental data, is beyond the scope ofthis report, but will be the subject of a future paper.
Among the questions that this report seeks to address are thefollowing: What liberties may be taken in choosing a set of inputparameters for a test method? How does one choose pass/fail levels for the
test method output parameter which correspond to the injury tolerancelevel in real life? Can one determine in advance how sensitive the test
method is in identifying inferior headgear?
- 4 -

II. APPROACH
A. A Set of Test Parameters
Sets of test parameters were constructed by assigning values to eachof five parameters: headform, impact surface, velocity, helmet impactsite, and response (the output parameter). Each parameter could assumeeither of two values, as described below (with short-hand notation forreferring to these values, also shown):
Headform*: Humanoid or Resilient (R), Metal (M)
Impact Surface*: Soft (S), Hard (H)
Velocity*: 4.5 m/sec (Vj^), 5 m/sec (V^^)
Helmet Impact Site: Top (T), Back (B)
Response: Severity Index (SI), Peak Acceleration (a )max
The effect of changing the value of a single test parameter can be examinedby changing from one of the above values of that parameter to the otherwhile the values of all other parameters are fixed. Note that the effectof changing a single test parameter can be repeatedly examined for any
canbination of values of the other parameters. The choices of values for
the above parameters were limited so that the total amount of data wouldnot become unwieldy.
Any set of test parameters can be considered to be a set whichsimulates real life conditions, with one constraint: the humanoid headformmust be a member of the set. This headform was specifically designed to
reproduce the acceleration response of cadaver heads and thus representsour best laboratory simulation of a human head. Since all of the valuesfor the other parameters can occur in the real life injury environment, anymay be members of a set which is said to simulate a possible real life
condition.
B. Choice of Helmets
To examine the effects of changing the input parameters, twelvedifferent helmets with various types of energy absorbing systems were used.
Football helmets were selected rather than other types of headgear becausethey are designed to take repeated impacts of relatively high levels onthe top, front, sides and back v/ithout a substantial change in the
properties of their energy absorbing systems. Also, a variety of designsare available in football helmets that are not found in other helmets.
*Values to be described in more detail in chapter III.
- 5 -

including webbing suspension, foamed plastic padding, pneumatic, and
hydraulic systems.
C. Limiting Averages
To determine the effect of changing test parameters, some point ofcomparison must be established. With all test conditions held constant,the acceleration response of a new helmet is typically larger on the seconddrop than on the first. Those helmets with crushabDe foam liners (usuallyfor vehicular use) will yield increasing acceleration responses on eachsuccessive drop until the liner has "bottomed." However, helmets withresilient liners, such as football helmets, are designed to recover aftereach impact.
Preliminary impact tests with football helmets showed that the energyabsorption properties diminished after the first impact and continued todecrease for several impacts thereafter. Eventually the system leveled off(the number of impacts before the leveling off point varied with helmet)and the acceleration response became essentially constant. This effect is
illustrated in figure 4. The average values of SI and a^^^ were taken fromthe impacts beyond the leveling off point (see figure 4). These averagesare hereafter referred to as "limiting averages."
There was concern that the limiting averages for any given set of testparameters might be affected by earlier impacts with other sets ofparameters, especially if a "soft" configuration follows a "hard" one. Toinvestigate this possibility, impact tests were conducted on severalhelmets, with conditions changed from "soft" to "hard" and back to "soft"(see figure 5). It was observed that the limiting averages for the "soft"set of test parameters were the same whether or not the tests were precededby the hard configuration.
D. Determination of Effect of Changing Parameters
Since differences in helmet design and materials may affect results,the effect of changing parameters must be determined by some averagingprocess which encompasses a large variety of helmets.
The effect of changing test parameters is determined by exhibitingtwelve pairs of limiting averages (one pair for each helmet) on a graphwhere the designated output variable for one set of test parameters is
plotted as a function of the designated output variable for the other set
(see sketch below; the i^ helmet is characterized by the pair (h^^ k.)).
-6 -

Cdou_
CVJ=*:
UJ 1—__1 UJCOca:
1—
1
cdcd UJ
1—> UJ
s;1— <rD cdCl. C1— D-
k
.
1
(h., k.)^ •
• •
h.1
OUTPUT VARIABLE h FOR
PARAMETER SET #1
The higher the degree of association between the output variables(characterized by the correlation coefficient), the more distinguishablethe effect of changing test method paraneters becomes. The effect of suchchanges can then be expressed analytically by statistically fitting a curvethrough the twelve pairs of limiting average data points.
-7 -

III. MATERIALS AND METHODS
Ao Materials
1
.
Helmets
Twelve models of football helmets were purchased from fourmanufacturers about four months before testing began. The helmets areidentified by a two letter code. The first letter of the code - A, B, C orD - indicates the manufacturer. The second letter denotes the type ofhelmet as follows:
F - Fully padded
P - Padded with top webbing suspension
T - Padded with top padded suspension
C - Fully padded with foamed plastic in segregated cells
H - Hydraulic
S - Webbing suspension
The various helmet designs are shown in figure 6.
2. Head forms
Metal. The metal headform is constructed of magnesium alloy KIIA in
accordance with ANSI Z90.1 21/. (See figure 7.)
Humanoid . The humanoid headform (see figure 7) is constructed of
various materials which represent skin, skull and brain and was designed to
simulate the response of human heads to impacts. This was accomplished bymatching its mechanical impedance to the impedance of cadaver heads 5/.
The headform was designed and built by Wayne State University 17/.
3. Impact Surfaces
Two impact surfaces were used in this study - "soft" and "hard." Eachwas cylindrical in shape, 15 cm (6 in) in diameter. The thickness of the
pads were: hard, 1.9 cm; soft, 2.1 cm. Static force vs. displacementcurves are shown in figure 8 for the two surfaces when loaded by the top ofthe metal headform. These curves can be represented by the followingequations:
Soft: F = 4,902
Hard: F = 43,579
-8 -

where d is the displacement in cm, and F is the force in newtons. It isseen that the hard surface is an order of magnitude more difficult tocompress then the soft surface. The Shore hardness was also measured:hard, 85; soft, 50.
The above force/displacement relations were used to compare thesesurfaces to artificial impact surfaces which are used or proposed in someexisting helmet test methods. The "hard" surface was somewhat moredifficult to canpress than those surfaces used in actual test methods;similarly, the "soft" surface was easier to compress. Therefore, it wasthought that the "hard" and "soft" surfaces could be used to represent a
broad range of impact surfaces.
B. Methods
1 . Drop Apparatus
The headforms are mounted on a vertical rod which guides them duringfree fall (monorail drop apparatus, figure 9). This permits reproduciblelocation of impact sites on the helmet.
The headforms ride on the rail by their attachment to separate"followers" (see figure 7). The ball and socket arrangement, which is usedwith the metal headform, allows impacts to be delivered to any site of a
helmeted headform (see figure 10). The pin connections of the humanoidheadform to its follower restrict the number of possible impact sites tosix, of which only the top and back sites were used in this study.
A velocity meter measures the velocity immediately before impact.
The impact velocities reported in the previous chapter were chosen onthe basis of preliminary experiments. The lower velocity, V.
,was chosen
to be high enough to insure some severity index responses which approachedor exceeded the injurious level of 1500. This was satisfied for V. = 4.5
m/sec. The higher velocity, V„, was chosen so that the severity indexresponses would be significantly larger than those obtained using Vj^. Only
a small velocity change was required, = 5.0 m/sec.
2. Instrumentation
The metal (Z90) headform was equipped with a piezoelectric linear
accelerometer located at the center of mass of the headform.
The humanoid headform was equipped with a piezoresistive triaxialaccelerometer Vyriiich measures the acceleration in three orthogonaldirections (a
,a
,a ).
X y z
The primary readout system was a Severity Index Analyzer developed at
Wayne State University. When used with the triaxial accelerometer, the SI
- 9 -

2 2 2 2analyzer computes the resultant acceleration (a = a + a + a ) andgives a digital readout of the Severity Index and peak acc^leratfon.
A storage oscilloscope, which displays a trace of the acceleration-time curve, was used simultaneously as a check on the digital readoutproduced by the SI analyzer.
3. Procedure
Top and back impact sites on each helmet were marked with the helmetpositioned on the humanoid headform. indicator as shown in figure 11.
When the helmet was tested with the metal headform, the helmeted headformwas adjusted to insure that the same impact location on the helmet wasstruck.
For a fixed set of input parameters (headform, velocity, impactsurface, and position) each helmet was impacted repeatedly until themeasured headform outputs (SI and a ) leveled off. In no case was a
helmet impacted less than five timeS?^
After obtaining data for all twelve test helmets, the set of inputparameters was changed and the *est procedure repeated. Headforms andhelmets were positioned carefully to ensure that impact sites on thehelmets remained the same.
- 10 -

IV. RESULTS
A. Summary of Data
For each of the combinations of test method parameters, the limitingaverages for severity index and maximum acceleration are shown in tables 2,
3 and 4. Several examples of typical oscilloscope traces are shown in
figures 11 and 12 for top and back impacts, respectively.
B. Effect of Changing Test Parameters
1 . Choice of Curves for Representing Data
As explained in section II. D, the effect of changing a test methodparameter is determined by fitting a curve through twelve limiting averagedata points. For example, the effect of changing headforms might bedetermined by a plot of SI (metal) vs. SI (humanoid) with values of allother parameters fixed. In general, the degree of association between thevariables will depend upon the type of curve chosen to represent therelationship. Two possibilities were considered:
1 . y = C^x + C2
straight line
^22. y = C^x power law
where x and y are output variables from sets of data corresponding to
different sets of test method parameters, and C^ and C2
are coefficientsdetermined by a least-squares fit of the twelve pairs of data points (x.
,
Yi).
Both types of curves were fitted to the data for several typicalexamples, two of which are shown in figures 13 and 14. Figure 13 is an
example with a high degree of association: all input test methodparameters were held fixed to examine the effect of changing the outputparameter from SI to a . Each data point on this figure (and on thefigures to follow) represents a pair of limiting averages for one of the
twelve helmets (from tables 1, 2, or 3) as described in section II. D. It
is seen that, within the range of the data, both curves are equally capableof representing this effect, and that the corresponding correlationcoefficients are nearly equal. Figure 14 examines the effect of changingheadforms for back impacts. Here there is a relatively low degree ofassociation of the data points with either curve. Again the curves nearlycoincide in the range of interest and the correlation coefficients arenearly equal. Since both types of curves appear to be equally applicablefor our purposes, for simplicity, the straight line least squares fit and
-11-

associated correlation coefficients are used to examine the effect of
changes in test method parameters*.
2. Output Parameters
In general, it is possible that the effect of changing one or moreinput parameters (headform, impact surface, velocity) may depend on whichoutput parameter (SI, is chosen to characterize the response.However, it was observea that
,for any fixed set of input test method
parameters, the correlation between SI and was very high. Theregression and correlation coefficients are su^arized in table 5, andcomposite scattergrams for the top and back impact sites are exhibited in
figures 15 and 16. Because of the high degree of association between thesetwo output parameters, we consider that either is appropriate for assessingthe effect of changes in input test method parameters. Since the severityindex, SI, has been more widely advocated as being related to thelikelihood for internal head injury, it is used in the rest of the figuresof this report.
3. Input Parameters
The effects of changing various input parameters are shown in figures17-24, and a summary of the conditions examined is presented in table 6.
The regression coefficients (slope, intercept) and correlation coefficientsfor all combinations of output parameters are shown in tables 7, 8 and 9.
Note that, in examining the effect of any change in input test methodparameters, the correlation coefficient is nearly independent of the choiceof output parameters used to characterize the effect.
Headform . The effect of changing headforms is illustrated in figures
17 and 18 for top and back impacts, respectively. It is noted that thecorrelation coefficients for the back site are much less than those for the
top site. By superimposing figures 17 and 18 (see figure 19) it is seenthat for either impact surface, the effect of changing headforms alsoappears to depend upon the impact site; that is, when the impact surface is
fixed, the difference between the SI response for humanoid and metalheadforms is exaggerated for the back impact site.
Impact Surface . The effect of changing impact surfaces is shown in
figures 20 and 21 for top and rear impacts, respectively. For the topimpact site, the regression lines which describe this effect are similarfor the two headforms. (For back impacts, the difference in the two
regression lines is attributed to the fact that the lines were fitted overseparate ranges of data; i.e., for the total range, the true relationshipis probably not linear.) If the data from figures 20 and 21 aresuperimposed, it appears as though the same line fits the data for the twoimpact sites. For this effect, for the humanoid headform, the correlationcoefficients are again less for the back site than for the top site.
*It is also noted that the rank correlation coefficients (as described in
C. Lipson and N. Sheth, Statistical Design and Analysis of Engineering
Experiments, p. 377, McGraw-Hill Book Co., New York, 1973) were nearly the
same as those computed for linear regression.
-12 -

In figure 22, the effect of changing impact surfaces is shown for thehigher velocity impacts (metal headform only). Again the effect isapparently independent of impact site.
Velocity . The effect of changing the impact velocity is shown in
figures 23 and 24, for top and back impacts, respectively (metal headformonly). Two points are noteworthy. First, the severity index issubstantially higher for the higher impact velocity, although thevelocities are only slightly higher. Secondly, the correlations are muchlower for the back impact site than for the top.
4. Mixed Parameters
In figure 25, an example is shown where two input test parameters,headform and impact surface, were changed simultaneously. The effect ofthis change appears to depend on impact site, but the correlationcoefficients for the two sites are similar.
-13-

V. DISCUSSION
A. Effect of Changing Test Parameters
Test methods are not expected to exactly duplicate real lifesituations. For protective headgear, a set of test parameters (headform,impact surface, velocity) is chosen for the purpose o^^ providing a
consistent laboratory evaluation of helmets. Usually this set is differentfrom that which would have been chosen if the only goal of the test methodwere simulation. For example, a metal headform may be preferable to a
humanoid surrogate because of increased reproducibility - an essentialfeature of any test methods Also, the velocity may differ from real lifebecause of laboratory restrictions. Whatever the changes and reasons, it
is essential that the chosen set of test parameters be traceable to thereal life impact situation. Otherwise, the ranking and/or evaluation ofhelmets will be specific only to the particular set of test parameters, andthe relationship to the likelihood of injury reduction will be unknown.
When a parameter is changed from its real life value (or simulationvalue) to a test method value, an identifiable relationship will exist onlywhen the correlation is sufficiently high. Then the test method can beconsidered suitable for use in determining which products are likely toprotect against injury*. If the correlation is too low, the test method is
invalid - it bears no relationship to the real life impact/injurysituation. The major purpose of this work is to begin to identify theserelationships for the three test parameters for protective headgear: the
headform, the impact surface, and the velocity.
1 . Impact Surface
The effect of changing impact surfaces was the easiest to identify(figures 20 to 22). The effect was essentially independent of whichheadform was used or which impact site was selected; that is, the samecurve appears to describe all cases. Correlations were consistently highin all cases. Since the characteristics of the impact surfaces can be
quantified (as described in section III. A. 3), predictions of the behaviorof other impact surfaces are possible. These predictions can be made byusing mathematical models such as the one described in reference 1
.
2. Velocity
The effect of changing impact velocities is also not difficult to
identify, at least for the top impact site (figure 23). For the back site,poor correlations seem to obliterate any distinguishable effect.
For football helmets, the stopping distance is the distance betweenthe head (or headform) and the outer shell of the helmet. This distance is
usually smaller at the back impact site than the top. The more severe the
impact, the greater the displacement of the shell toward the head. At some
*The ability of the test method to make this determination is called thesensitivity which, of course, depends on the correlation. Tnis will be
discussed in detail in section V.B.2.
-14 -

displacement, there is a dramatic change in characteristics of the energyabsorbing system, an effect which is illustrated by the static forcedisplacement curves of figure 26. Essentially, the helmet liner hassuddenly become more rigid. Since this effect is sensitive to material anddesign, its onset and magnitude will be different for different helmets,and, therefore, is expected to contribute to lower correlations. At a
given helmet impact site, as the velocity is increased, some helmets beginto perform in this "increased rigidity" range, and there is a possibilityof poor correlations between velocities. Because of the smaller stoppingdistance, this effect is first noticed at the back site.
It also appears that, for the football helmets used in this study, thepoor correlations are associated with values of SI which are beyond theusually accepted tolerance values. It is felt that our understanding ofthe effect of increasing impact velocities is incomplete and should be thesubject of a future study.
3. Headform
As expected, the effect of changing headforms leads to the worstcorrelations. This is because those features of the metal headform whichmake it reproducible (rigidity, simplicity) and, therefore, desirable areso much different from the real life surrogate, the humanoid headform. Tofurther complicate the identification of this effect, it was found that thecorrelation was worse, and the regression lines different, for the backsite and the top. Why should the effect of changing headforms depend so
strongly on impact site? Could these differences be accounted for solelyby the differences in headform geometry and resiliency at the two sites?
One other observation appeared to be related to these questions: it
was observed that for back impacts with the humanoid headform, there waslittle or no rebound (in the top position, the rebound was canparable to
that found at either site with the metal headform) . That is, the change in
velocity was smaller than if a rebound had occurred. Since velocity change
is related to acceleration, it is conjectured that some mechanism causedthe humanoid headform to decelerate more gradually in the back positionthan it would have if it had rebounded. It would follow that thismechanism was, therefore, absorbing energy that would have otherwise beenavailable for deforming the helmet liner and impact surface. (The noise-
like occurrence at the tail end of the oscilloscope traces (see figure 12),
may also be related to this energy absorbing mechanism.) It is expectedthat part of this energy would have been returned by the elastic componentsas kinetic energy in rebound.
Therefore, high speed motion picture studies of the impacts of both
headforms at both sites has recently begun. This work is both preliminaryand qualitative, and a more detailed analysis will follow as the subject ofa future paper. One observation is strikingly clear: when the humanoidheadform impacts at the back position, there is a definite bending thatoccurs in the vicinity of the neck region (see figure 27).
-15 -

This phenomenon is thought to be due to the vertical misalignment ofthe headform center of gravity (c.g.) and the impact point when thehumanoid headform is impacted at the back. In the top impact position,these two points fall on the same vertical line (in fact, the top positionis the only impact position for which there is no offset) 18/. For theback position, the offset is about five centimeters 18/. Because of thisoffset, there is a tendency for the drop system to rotate (see figure 28).
A similar phenomenon was reported by Henderson 18/ in his study of theNOCSAE football helmet test system. Using a guide wire apparatus, it wasfound that these c.g. offsets led to a rotation of the entire dropassembly, headform plus carriage, with an accompanying bending of the guidewires. It was suggested then that these difficulties "may be overcanethrough the use of a drop guide system which is not sensitive to c.g. andimpact center misalignment. . . (which) would result by the combination ofthe NOCSAE (humanoid) headform with the monorail concept." 18/
We now find that this is not the case. With the monorail drop system,the same result (undesirable energy absorption) follows from the same cause(c.g. offsets); only the mechanism of energy absorption changes. With themonorail
,the entire carriage system is prevented from rotating by the
bearings on the rail. For this system, energy is absorbed by bending in
the neck area. As pointed out by Henderson, "This results in a reductionof the force or acceleration." 18/
The corresponding values of severity index, SI, are also reduced bythe action of this neck-bending mechanism. Furthermore, it is suspectedthat as the measured acceleration increases, so does the absorbed energy.Therefore, in correcting for this effect, the severity index should beincreased over the recorded values when the humanoid headform is impactedat the back impact site. In terms of figure 17, the regression curves forback impacts would shift toward those established for top impacts. Thatis, we believe that the effect of changing headforms is not as stronglydependent on impact site as was first suspected. Rather, this dependenceis more an artifact of the humanoid headform mounting system. Therefore,in identifying the effect of changing headforms, we suggest that theregression curves for the top position be regarded as more representative.
In addition, the neck bending effect is probably the cause of therelatively poor correlation coefficients for the back impact site as
compared to the top site. That is, the energy absorption effect is alsolikely to be dependent on helmet design and would therefore introduce widerexcursions in the data than would have occurred otherwise.
These findings thus present another criticism of the use of humanoidheadforms in test methods to evaluate protective headgear. For all impactsites except the top, the acceleration response will be lower than if noneck bending had occurred.
-16-

In response to these charges, advocates of such systems have arguedthat human necks may also absorb energy in the real life situation. Thesearguments must be rejected on two counts:
1. If neck bending is considered to have an important effect in thereal life situation, then the bending characteristics of testmethod necks must be demonstrated to correspond to those of humannecks. The "necks" of humanoid headforms which are used orproposed in test methods, especially the NOCSAE head form used inthis study, have not met this criterion. Rather, these neckswere designed to provide a means for securing the head form to thedrop assembly.
2. According to Hodgson, the concept of the dropped headform testpresupposes that, in the real life situation "the head movesindependent of the body" (emphasis ours) and that the "impactwill undoubtedly be over before the neck muscle reaction time."
It follows then that neck reactions are particularlyundesirable in a test method which records the linearacceleration response.
B. Test Methods
1 . Choosing Test Parameters and Using the Relationships
To Identify Suitable Pass/Fail Levels
We will now illustrate how the relationships developed in this studycan be used to choose a set of test parameters, and associated pass/failvalues. For this illustration, we will consider developing a test methodto evaluate football helmets.
Velocity . In choosing test parameters the first step is to identifytypical impact velocities in the injury situation. As head injuries havebeen observed in football games when players are upended and strike theplaying surface, the ensuing impact velocity may be reasonable forrepresenting a real life injury situation. Other modes of impact have alsobeen identified (e.g., helmet to helmet, helmet to knee, etc.). Therelationship between these latter modes and the dropped headform testmethod is less straightforward, and has been investigated by mathematicalmodelling V
.
In order to continue with this illustration and to make use of therelationships already developed in this report, we will assume that thevelocity, Vj^, is a representative impact velocity to a massive surface.
Headform . As discussed earlier, metal headforms are presentlyconsidered to be more reliable and reproducible than humanoid headforms
- 17 -

(section I.B). Yet the humanoid headform is considered to be a bettersimulant of real heads. We would therefore use a graph like those shown on17 or 18 to infer a value for SI for use with the metal headform whichcorresponds to the critical value with the humanoid headform, 1500 (section
1.
A.). Because of the neck bending problems associated with the humanoidheadform at the back site (section V.A.3), we will use the relationshipsdeveloped for the top (figure 17). Therefore, for the purposes of thisillustration, the least squares line of figure 17 will be used to suggest a
value of severity index which can be used with metal headforms in a testmethod. In particular, it is seen that when the SI with the humanoidheadform is 1500, the corresponding value of SI with metal headforms isapproximately 1800.
Impact Surface . Lastly, the impact surface in the real life situationmust be quantified (e.g., by the methods described in chapter III). If a
similarly resilient impact surface can be fabricated for use in a testmethod, no further adjustments to the pass/fail value of the test methodresponse parameter are required. If the test method impact surface is
softer (or harder) than the real life surface, the pass/fail level for the
test method response parameter must be adjusted downward (or upward).
For example, if the hard impact surface of this study werecharacteristic of the real life surface and the soft surfaces were used in
the test method, it is seen from figure 20 that the hard surface pass/faillevel of 1800 would correspond to a soft surface pass/fail level ofapproximately 1200. One could have obtained this same result directly fromfigure 25, where the effect of changing two parameters is illustrated. It
is seen that when the severity index for the humanoid headform/hard surfaceis 1500, the severity index for metal/soft is 1200.
2. Sensitivity of a Test Method
Having chosen pass/fail levels on the basis of linear regressioncurves, where correlation coefficients are on the order of 0.8 to 0.9, it
is now required that we evaluate the usefulness of the test method. Thatis, how much correlation is enough? In the absence of perfect correlation,there is always a possibility that products which offer an adequate degreeof protection may fail the test, while inferior products may pass.However, with higher correlation coefficients, fewer products are expectedto be so misclassified.
It is possible to calculate a sensitivity for a given test method.
That is, given that a product is considered to be inadequate, and based onthe data collected in this report, the sensitivity is the probability thatthe test method will correctly identify it as inadequate.
We will calculate this probability for two hypothetical examples, bothof which were alluded to in the previous section, and both of which utilizethe metal headform in the test method:
-18-

Example 1. Let us assume, for the purpose of this example, that thesoft impact surface, described in this report, is comparable tosurfaces in the field (in football, this may be valid if artificialturf or a muddy field is considered to be a representativeimpact/injury surface). Then the data of figure 17 are used in thecalculations.
Example 2 . We assume that the hard impact surface is considered to betypical of the field (say for hard frozen fields), but that it isdesirable to use the soft impact surface in the test method. Then thedata of figure 25 (for top impacts) is used in the calculations.
For both of these examples, it is assumed that the borderline injury levelin the real life simulation (humanoid headform) is SIpn = 1500. Thepass/fail level for the helmets in the test method is^therefore SI’pp =
1800 for example 1 and SI’-p = 1200 for example 2 (where primes refer to SIvalues measured in the test method; also refer to sketch below).
oo
ccUJ[
—
UJz:<oc<o.
oos:H”LU
toU)V"
REAL LIFE SIMULATION PARAMETER, SI
Unknown helmets subjected to the test method can theoretically becharacterized by the SI value that would result if the helmet were testedunder conditions of the real life simulation. If such a test werepossible, the helmet would be labelled inadequate if SI were greater than
SI^p. In fact, as SI increases above SI^^, the helmet would be consideredeven more inadequate. However,, such a test is not possible; instead, the
helmets are subjected to the test method, where helmets are rejected if SI*
is greater than SI’^p. For any value SI* greater than SIpp^, (refer to
above sketch), it is possible to calculate the fraction or all helmets withSI greater than SI* which we expect to be correctly identified by the testmethod. We call this fraction the sensitivity. That is, of all helmets
for which SI > SI* > SI^j^, we calculate the fraction for which SI* >
-19-

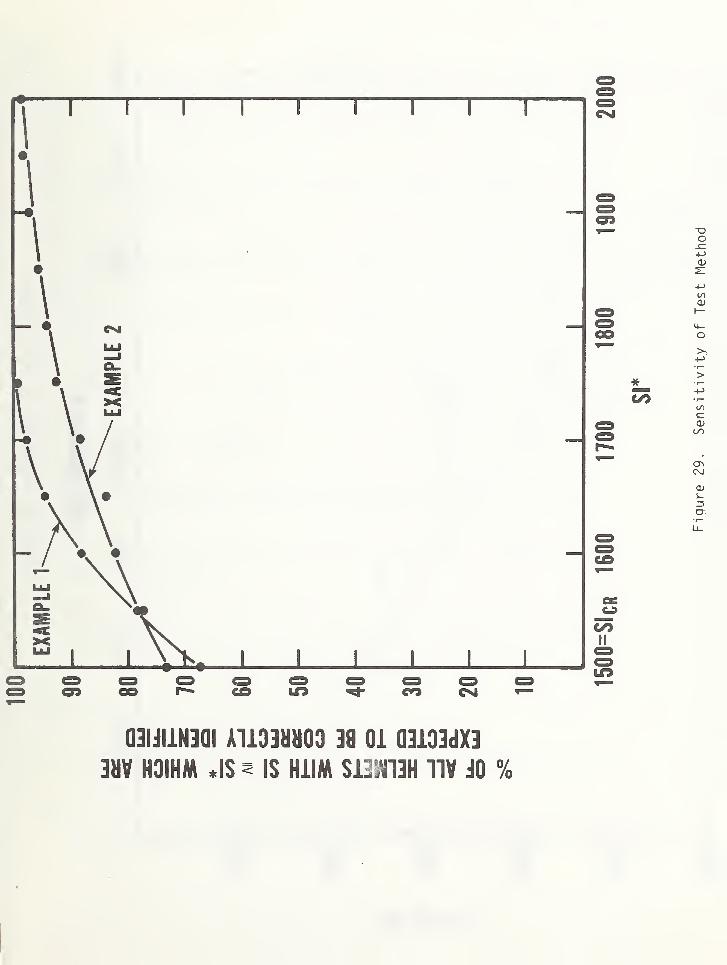
Details of this calculation are shown in the Appendix, and the results
are shown in figure 29. It is seen that, for example 1, we can expect a
correct identification of 68% of helmets with SI 1500; 88% of all helmetswith SI 1600; 98% of all helmets with SI 1700; etc. For example 2,
these percentages are nearly as high.
3. Test Method Output Parameters
The results indicate that, for the range of football helmets tested,the correlation between the maximum acceleration and the severity index wasvery high ( .95). In addition, the relationship between a and SI seemedto be the same regardless of headform or impact position (rigures 15 and
16), despite the fact that the oscilloscope traces for top and rear impactswere decidedly different. For the purpose of a test method responseparameter, it appears that the maximum acceleration should be considered tobe a reasonable substitute for the severity index, though the latter ismore often advocated in the biomechanical literature. For the two examplesdiscussed in the previous section it is noted that SI'^^j^ = 1800 correspondsto = 260 g (example 1) and and SI’^p = 1200 corresponds to a^^^ = 200
fnaX On ulaXg-
Regardless of what is used as a output parameter, the limiting averageconcept used throughout this report may not be practical in most footballhelmet test method situations. Only a few impacts per site would bepreferred. Therefore, it is desirable to know if information obtained froma few impacts can be used to reflect the limiting average and if, for a
range of helmets, a suitable correlation exists. To determine this effect,impact tests were conducted on a virgin site, the top, of twelve footballhelmets that were previously tested at the back site. The data for the
first three impacts and the limiting average are summarized in table 10.
The correlations between each of the first three impacts and the limitingaverage, and between the average of the first three impacts and. thelimiting average, are shown. These correlation coefficients increase withthe number of impacts and are already very high by the second impact; theaverage of the first three impacts also correlates very well with thelimiting average. It is, therefore, concluded that useful information can
indeed be obtained with a few impacts at each site.
C. Relation of This Work to Previous Studies
There are a few examples where other investigators have studied theeffect of changing one or more test parameters in impact testing ofprotective headgear.
Andrews 16/ tested eleven football helmets according to proceduresdescribed in two different test methods: one promulgated by ASTM (F429-75)and the other by NOCSAE (section I.B). The most obvious differencesbetween these test methods are in the headform (NOCSAE uses the samehumanoid headfonn as in this study; ASTM the same metal headform) and in
-20-

the hardness of the impact surface (Shore durometer: ASTM, 70; NOCSAE,35). Other differences from the present study should also be noted: 1)
The ASTM test method required a cone-shaped (pointed upward),rather than
flat, impact surface; this change has the effect of softening the impact aswell as introducing a source of variability, depending on whether or notthe impact point coincides with the tip of the cone. 2) The helmetsreceived only two impacts with the NOCSAE procedure and three with ASTM(the order of administering the test methods was not reported). 3) A guidewire system, rather than a monorail was used in all tests. 4) The severityindex was measured only in the NOCSAE configuration, as the ASTM proceduredid not require this measurement.
Andrews’ data is summarized in table 11 for the top and back impactpositions. Correlation coefficients were computed from these data and arealso reported in table 11. Despite the many differences between that studyand the present one, some general results were similar. There wasexcellent correlation between the severity index and the maximumacceleration when input test parameters were held fixed. Regarding thedifferences between the top and rear sites, relatively high correlations atthe top site and poor correlations at the back were calculated. Again, itis suspected, as described in section V.A.3, that the vertical misalignmentof the center of gravity and the impact point, when the humanoid headformwas impacted at the rear, was largely responsible for these poorcorrelations at the back site.
In another study, the Southwest Research Institute developed a "soft"headform by coating a metal headform with resilient material 19/. Fourteenmodels of motorcycle helmets were impact tested using both the softheadform and the usual metal headform. The data for back impacts aresummarized in table 12; each data point is the mean of results of thesecond impact on four helmets of the same model (For each helmet model, a
separate group of four helmets were used with each headform*.) The head
injury criterion, HIC, was reported in this study. The data of table 12
are plotted in figure 30, where it is seen that the correlation coefficientbetween the HIC values for the soft and metal headforms is high (.92).
This should not be unexpected, even for back impacts, because the softheadform used in this study maintains its c.g. in vertical alignment withthe impact point.
The evidence in this and other studies continues to suggest that test
procedures using metal headforms correlate sufficiently well to those using
humanoid headforms, and so, in view of their superior reproducibility and
lack of c.g. offset problems, metal headforms should not be avoided in testmethods for protective headgear. Nevertheless, criticism of the use ofmetal headforms is widespread 5/, and it is interesting to inspect the
data which are used to support these criticisms. Scmetimes only a few
selected data points are extracted from a larger collection to supportthese arguments. For example, in a recent article 204 the data from only
three of the fourteen types of motorcycle helmets in the SWRI study 19/
were reported (and then only two helmets of each type). The limited data
*The limiting average concept is not applicable for motorcycle helmetssince they are designed to protect against a single impact and may thensustain permanent damage. A point of comparison must be obtained byaveraging the results of several helmets.
-21-

were chosen to illustrate the point that there may be occasions when pairsof helmets are ranked in reverse order by two different procedures. But asdiscussed above, the larger collection of data suggest that the correlationbetween the two head form is satisfactory.
Occasional reversals in the order of helmet performance is anacceptable trade-off for a reproducible, reliable test method. We contend,as described in section V.B.2, that if the overall correlation is
sufficiently high, then the test method is useful in identifyingpotentially inadequate products. If it can be shown that a significantfraction of these inadequate products will be removed from the marketplaceby a well conceived test method, the users of these products will be betterprotected
.
-22-

VI. SUMMARY
The concept of using limiting averages for a range of helmets wasestablished as a viable means of comparing one impact situation withanother. It was demonstrated that the limiting averages correlated wellwith results obtained from two or three impacts.
For any set of test parameters, the maximum acceleration was shown to
correlate very well with the severity index.
The humanoid headform displayed some deficiencies that had not beenreported previously. At all but the top impact sites, verticalmisalignment of the center of gravity and the impact point causes lowerheadform response.
The effects of changing test parameters was identified in somelimiting cases:
The correlation between headforms (for the top impact site, theonly impact site where the humanoid headform performs reliably)
appears to be sufficiently high to justify the use of metalheadforms in test methods - at least until such time as acceptablehuman simulations are available.
The correlation between impact surfaces is very high.
The correlation between velocities appear to degrade underconditions which lead to high acceleration responses. This effectwas noticed for back impacts (where the stopping distance was
small) at the higher velocity and requires more study.
A procedure has been presented for determining pass/fail values of
test method output parameters, and for estimating the value of a testmethod by calculating its sensitivity.
-23-

%fb'i[1 i
>„^li*B ' ; '^*iS ^ ‘^Iji *3siB» p
. . . .
i5..B^li' aiaall'a •
'
."^ J&'f im,'
*_ . .
'
- _'i' - ...‘ ->'*».«'**.•• J-^\L... Ar.j *, . • A ^'.fc •
' V4 •......'T- I
'
9*'!;?? ?J3 tXJ:lM '.**'
0^' ''^‘
. ^ -vv^ .'.W. -
;
.,: ,'.:,
.. .
• W-‘ sff‘
’ .1 -•>'
'
.,
'^' '^^t.-
'^jk'
'f.> x0y.isv ---:.^ ,
,p->'rvtf be
>^’
t. , :iS^«*-'S^>.'i' i'
s?^k- ..^' ir' *.x„C* 5 V t .J
TABLE
1.
Some
Features
of
Selected
Test
Methods
for
Protective
Headgear
(-> C_) CJ CJ o a 0 a 0CO cu cu cu cu cu cu cu QJ CD•r— 1/) lo to to to to to to LOS-O)
E E E E E E E E ECVI CD CD oo CD 00 LO CO
•p—
i_ A A A A A A A A Ao 0-(-> +-> +-> +-> +J -M CU 4-) 4-> 4-J
c: too «N •N rv r> rc
CT> O D) CD C7) CJ> CD CD CD 0 CD CD CD CD CD4-> 0CJ o O O O o o o O O O LO 0 0 0 0 0O) o o o Ln O O CD O O LO 1
— 0 0 LO 0 0•r-5 ro ^ CNJ 1 CM 1
— CM r— CM r— ^ CMO) cu Acc: A AAA AAA A A A c A A A A A
o KH03 a a a a a a fO fO ca CO 03 CD <T3 CD (D
^
^
(ja;to
>>+->
•r— IX) C\J CM CM LO LO CDu « * « • • • •
o to CD CD CD LD CD LO LO LO CD CD
0)>+->
oCOCL.
E1—
•
s- i-cu cu+-> +J
<L> cu cuO E E(0 o Cr4- CD CU CU CUS- S- S- S- S- Z3 23
<u CU cu cu *o "Oin x: SI
CL Q. CL CL o LO-M to to to to COa +J -I- +-) •!- +-> T- +J -1- •P“ 4->
fO fO E <o E TCI E CO E E 03Q. 1— <v r— CU 1— cu I— (U s. s_ QJ r—E U- -JZ Li_ zn u_ zn Li- nz cu cu zn Lu—
*
E' Eo 0+-> 4->' r~^
CL) cu cu cu to to QJ QJCU cu cu cu rd (0 QJ CU+J +-> +-) -(-> 4-> 4->
U1 LO U~) CO LU' LlI C/) CO
E 0S- •r-
o 04- r~ r— c r—-a <13 CO fO CO CD CD rO <T3
CO +J 4-) 4J +j E 4-> 4-J
OJ cu CU CU cu cu C5 QJ QJn: s: 2: s: s: zc 2: 2:
-oo
00 «
+-> P—
“
ocu CM CD
CM LU1— C/) CO < <C
+-> tn l-H 2: Ul =C C_)
to cu > C/) 1
—
C_) =C D-OJ c s: ZEl u_ CO 0 LU u_1— t/0 U- c cC 2^ _J
A':^LALg^\/ 0[oA'ouog.ow LLeqTOOj LeuoLgednoDO
UQJCO
LO
A
cn
oLO

TABLE 2. Limiting Average Data for Top Impacts,V = V|^ = 4.5 m/sec
Headform Humanoidi
Metal
Impact Surface Hard Soft Hard Soft
Output SI A SI A SI A SI A
“i AP. 665 125 601 124 557 104 542 105
AP-1 925 158 730 137 690 130 700 122
AT-1 1540 227 975 166 1210 184 960 154
BC-1 1380 208 990 164 1425 230 865 153
h- BP-1 1650 217 1250 180 2776 298 1630 224
LU BT-1 545 114 520 no 750 122 570 108
_J
LU CH-1 680 132 660 130 965 151 760 130zn
CP-1 465 120 455 118 690 132 500 115
CS-1 1190 188 910 172 1950 275 1270 208
DC-1 860 140 855 145 945 145 675 130
DH-1 480 114 390 105 500 103 420 98
DS-1 950 175 741 152 850 150 700 136

TABLE 3. Limiting Average Data for Back Impacts,V = V|^ = 4.5 m/sec
Headform Humanoid Metal
Impact Surface Hard Soft Hard Soft
Output SI A SI A SI A SI A
AF-2 575 137 574 137 1924 278 927 158
i
AP-2 980 196 723 149 2562 300 1513 220
AT-
2
652 150 670 148 1841 268 1247 194
BC-2 493 119 411 108 1374 237 795 157
1—BP-2 865 169 672 134 3423 359 1677 233
LiJ BT-2 589 132 632 139 1417 238 882 14721
_1
UJ CH-2 439 111 428 109 491 108 543 116
CP-2 601 131 548 125 2254 289 1317 205
CS-2 683 150 603 124 2109 256 1457 191
DC-2 763 150 932 163 1358 229 1143 182
DH-2 358 100 394 104 1347 220 830 153
DS-21
714 147 727 141 3377 330 1221 190j
i

TABLE 4. Limiting Average Data forV = = 5 m/s
Higher VelocityTop
(Helmet Series 1)
Back
(Helmet Series 2)
Metal Metal
Hard Soft Hard Soft
Helmet SI A SI A SI A SI A
AF 1126 158 990 147 2710 324 1771 235
AP 1848 261 1315 188 3837 353 2476 270
AT 2971 345 1808 225 2675 318 2018 250
BC 2782 329 1390 196 3534 358 1985 246
1— BP 4119 436 3256 332 4327 409 3095 307
UJ BT 1062 154 1058 149 3701 365 3203 3252:
_j
0UJ CH H E L M E T B R 0 K E 704 122 881n;
CP 993 156 761 157 3268 339 2115 2591
CS 2599 308 1806 229 4442 372 2419 266,
!
DC 1269 170 1327 188 1949 259 1592 2ial
DH 700 132 690 1261
3250 347 2452j
283
DS 1597 200 1085 179:
4735 391
1
2878 273

TABLE 5. Regression and Correlation Coefficients forAmax
vs. SI Amax
C^SI + C,
Values of Input Parameters
^2 CorrelationCoeff i ci ent
Headfo rm Surface Velocity Site
R H T .100 66 .98
R S \ T .096 70 .96
M H \ T .095 64 .97
M S \ T .112 51 .97
R1
H \ B .145 48 .97
R S \ B .112 63 .96
M H \ B .070 123 .94
M S \ B .095 72 .89
M H T .094 61 .95
1
M S''h
T .078 83 .98
1
M H''h
B .063 124 .95
1
M
I
S''h
B .068 104 .96
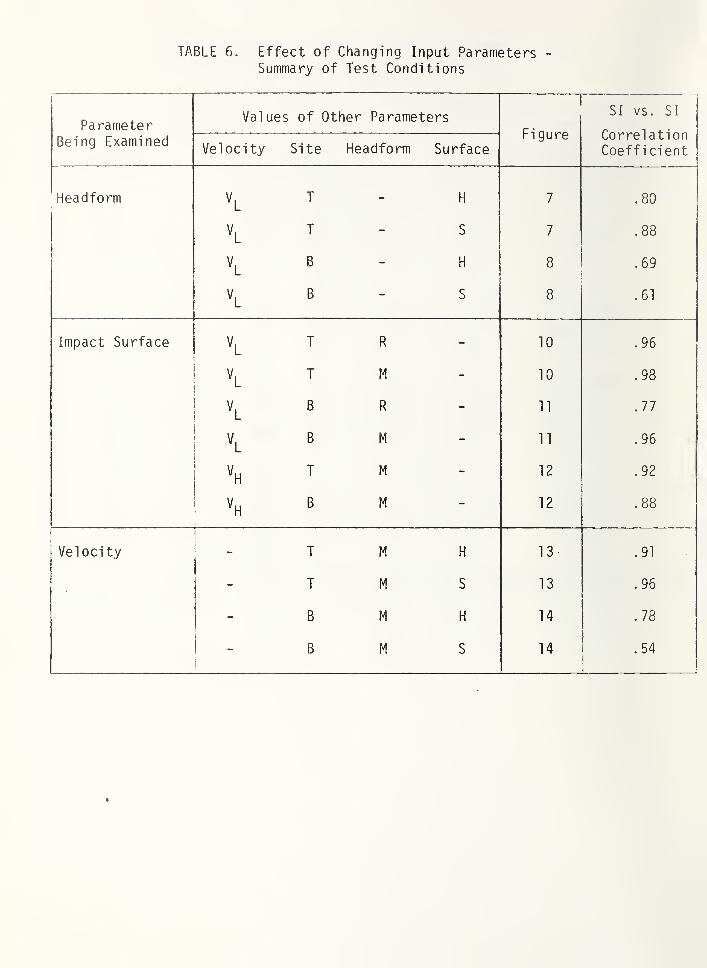
TABLE 6. Effect of Changing Input Parameters -
Summary of Test Conditions
ParameterVal ues of Other Parameters
~1
Fi gure
SI vs. SI
CorrelationCoefficient
Being ExaminedVelocity Site Headform Surface
Headform T - H 7 .80
\ T - S 7 .88
1
i B - H 8 .69
\ B - S 8 .61
Impact Surface \ T R - 10 .96
\ T M - 10 .98
\ B R - 11 .77
\ B M - 11 .96
''hT M - 12 .92
''h.
B M - 12 .88
Velocity T M H 13- .91
- T M S 13 .96
- B M H 14 .78
!_ B M S 14 .54
J

TABLE 7. Regression and Correlation Coefficientsfor Effect of Changing Headform
Output Parameter Output ParameterFor Metal For HumanoidHeadform Headform
Values of OtherInput Parameters Output Parameters
RegressionCoefficients
CorrelationCoefficient
Surface Velocity Site Metal Humanoid "2
H T SI SI 1 .30 -118 .80
Amax
Amax
1 .24 -30 .80
SI Amax
11.7 -758 .74
/\
maxSI .13 45 .82
S \ T SI SI 1.23 -128 .88
Amax
Amax
1.41 -59 .90
SI Amax
12.0 -905 .76
Amax
SI .14 37 .89
H \ B SI SI 3.37 -212 .69
maxAmax
1.59 35 .65
SI\iax
22 -1144 .66
maxSI .250 99 .68
S \ 6 SI SI 1.23 374 .61
Amax max
.91 59 .49
SI^nax
9.26 -91 .50
Amax
SI .118 107 .57

TABLE 8. Regression and Correlation Coefficients forEffect of Changing Impact Surface
Output Parameter Output ParameterFor Soft For Hard
Impact Surface Impact Surface
Values of OtherInput Parameters Output Parameters
RegressionCoefficients
CorrelationCoefficient
Headform Velocity Site Soft Hard '^2
M V|_=4.5 T SI SI .512 232 .98
Amax
Amax
.59 40.2 .97
SI Amax
5.0 -53.8 .94
Amax
SI .05 76.1 .84
R Vl T SI SI .584 205 .96
Amax
Amax
.56 51.9 .93
SI Amax
5.39 -106 .90
\iaxSI .058 87.4 .95
M V|_ B SI SI .352 490 .96
^TiaxAmax
.450 61.9 .85
SI Amax
4.32 7.8 .81
Amax
SI .032 115 .82
R Vl B SI SI .683 170 .77
Amax
Amax
.510 59.8 .72
SI Amax
4.25 9.28 .71
1
i
Amax
SI .077 82.0 .74

TABLE 8. Continued
Values of OtherInput Parameters Output Parameters
RegressionCoefficients
CorrelationCoefficient
Headform Velocity Site Soft Hard '^2
M V(^=5.0 T SI SI .615 229 .92
Amax
Amax
.510 69.4 .91
SI Amax
6.09 -161.5 .86
Amax
SI .018 97.5 .93
M V, B SI SI .511 573 .88
fl
maxAmax
.562 70.7 .91
SI Amax
7.65 -281 .87
fl
maxSI .034 144 .82


TABLE 9. Regression and Correlation Coefficients forEffect of Changing Velocity
Output Parameter = r Output ParameterFor V|_ For
Values of Other Regression Correl ati on
Input Parameters Output Parameters Coefficients Coeffi cient
leadform Surface Site \ ''h
M H T SI SI .589 -7 .91
\iaxAmax
.60 27 .80
SI Amax
6.02 -328 .87
Amax
SI .057 60.1 .80
M S T SI SI .490 113 .96
amax
amax
.68 10.5 .96
SI^nax
6.25 -400 .97
Amax
SI .052 68.2 .93
M H B SI SI .592 25 .78
amax
Amax
.707 26 .84
SI amax
7.3 -546 .64
amax
SI .044 116 .79
i
M S B SI SI .259 546 .54
amax
Amax
.351 89.0 .49
SI Amax
1.60 734 .22
Amax
SI .025 122.4 .49
1

TABLE 10. Relation Between Early Impactsand Limitinq Average
A. Data (Metal Headform, Soft Impact Surface, Velocity V^)
1st Drop 2nd Drop 3rd DropAverage of1st 3 Drops
LimitingAverage
Helmet SI, '2 S's n SI !
AF-2 652 661 670 661 671
AP-2 502 744 795 680 790 !
1
AT-2 645 886 977 836 1099
BC-2 514 662 662 613 7511
j
BP-2 1043 1299 1308 1217 1421
BT-2 515 559 574 549 571
CH-2 596 671 670 646 693
1
CP-2 481 487 488 485 503
CS-2 697 741 759 732 787:
DC-
2
714 848 888 817 873
DH-2 492 466 477 478 478
DS-2 491 567 568 542 568
B. Regression and Correlation Coefficients
y = c:-|X +
3
y X ^1 "2 Correlation Coefficient
SI^ SI .52 213 .87
SI^ SI .82 85 .98
SI3
SI .87 72 .99
\
SI SI .74 123 .98

TABLE 11. Comparison Data Between NOCSAE and ASTMRecommended Test Methods
A. Data, from Ref. 1_6/
Si te Top Back^ !
Test Method NOCSAE ASTM NOCSAE ASTM
Output SI., AN maxN ^maxA
ST A^^N maxN ^maxA
All 704 113 134 796 138 120
C33 783 120 102 757 132 190
DIO 1116 168 184 1017 174 192
G501 743 118 148 919 152 152
G402 638 117 146 701 135 290
HIO 742 139 126 1009 152 224
Hll 703 126 116 963 147 238
CIO 638 116 104 810 139 320
Cll 686 120 108 822 140 320
G20 906 144 212 525 116 290
G21 1094 166 208 541 105 252
B. Regression and Correlation Coefficients
y = c^x + C2
Site y X C-j C2
Correlation Coefficient
''maxN43 .94
\axN 5'n
-1°’ 57 .93
^°P ''maxA5'n
-5 .79
''maxA350 -.36

TABLE 12. Comparison of Metal Headform with "Soft" Headform(Metal Headform Coated with Resilient Material)for Motorcycle Helmets, from Southwest ResearchInstitute
HIC, Metal HIC, "Soft"
Mean* Std. Deviation Mean* Std. Deviation
A 2143 173 2430 115
B 2095 166 2395 197
C 2840 71 3064 339
I
D 2111 43 2130 103
1
E 2160 88 2525 211
f— F 2468 154 2726 379
UJ
s: G 1259 121 1376 40
_j
LlJ H 2372 235 2354 138
in
I 2232 22 2832 132
J 2445 73 2391 73
K 2900 93 3240 86
L 2938 156 3832 251
i M 2363 101 2661 214
N 2763 158 3303 218
*Average of four helmets, 2nd impact on each, back impact site.
HlC(metal) = .68 HlC(soft) + 556
correlation coefficient = .92


(OQZOo111
(O
S111
SI-
B ‘NOI1VU31330V 30VU3AV Figure
2.
Wayne
State
University
Tolerance
Curve

LT3
oo
inure
3.
Relationship
Between
HIT
and

c/>
Figure
4.
Limiting
Average

Figure
5.
Order
of
Tests
on
Soft
and
Hard
Surfaces

Hydraul icFully padded with foamed nlastic
in segregated cells
Mebbing suspension Padded with top webbing suspension
Figure 6

I'letal headform withfol 1 ower
Humanoid headform withfol 1 ower
Figure 7. Metal and flumanoid Headforms

3 6
DISPLACEMENT (mm|
Figure 8. Force - Displacement Curves
Hard and Soft Test surfaces

Figure 9. Metal Headform on Monorail

Figure 10. Ball/Socket In Metal Headform

HUMANOID HEADFORM
50 g/div
METAL HEADFORM
60 g/div
Figure 11. Typical Curves for Humanoid and Metal Headform

HUMANOID HEADFORM METAL HEADFORM
50 g/div 60 g/div
Figure 12. Typical Curves for Humanoid and Metal Headform

max
SI
Fiqure 13. Fit of Power Law and Straight Line Curves to Data
Poi nts

1750
1500
1250
1000
750
500
250
250 500 750 1000 1250 1500
SI (Humanoid)
Figure 14. Fit of Power Law and Straight Line Curves to Data Points

1 1 1 "T 1
•
ua>CO
E ^_J
LU • ^
2^10 o— O Lk.• 1— ^ Q
ili S 1 o c>
« CO 3® 3
0 UJ
s
• oHARI
son
• ^ Bovjuns
—
A0®
1 1 1 _i 1
CD €3 C3 cs C3yro LO m
CO CSI CNi
xeuig
CO
CO
t
LO>
LO
OJ
cr
Top
Impacts

C3 C3f-fV: m O ir> CD LID
CO CM CS4
xem0
1000
1500
2000
2500
3000
3500

500 1000 1500 2000 2500 3000
SI (Humanoid)
Figure 17. Metal vs. Humanoid Headform - Hard and SoftSurfaces - Top Impacts
3500
3000
2500
2000
1500
1000
500
Figure 18. Metal vs. Humanoid Headform - Hardand Soft Surfaces - Back Impact

2000
1750
1500
1250
1000
750
500
250
500 750 1000
SI [Humanoid]
1250 1500
Figure 19. Figure 18 and 19 combined

2500
ur>CM
oo
in
luos) IS
Figure
20.
Hard
vs.
Soft
Surfaces
-
Top
Impact

2500
(WOS) IS
Figure
21.
Hard
vs.
Soft
Surfaces
-
Back
Impact

mCO CO
mCM CM
uo LTD
luosi IS
Hard
vs.
Soft
Surfaces
-
Top
and
Back
Impacts
at
High
Velocity

3000ir>CNJ
m inCNI
(aas/m g-fr) is
Metal
Headform
-
Top
Impact

Metal
Headform
-
Back
Impact

2000
LTD
CO
CO
(uos/m) IS
Figure
25.
Metal
Headform/Soft
Surface
vs.
Humanoid
Headform/Hard
Surface

20,000
(Nl imi
Figure
26.
Force
vs.
Displacement
Curves
for
Helmeted
Headforms

Es-
o4-T3
CM IT3
dJCU rcs-
3 •o Ccn '1
—
o•r“ o • 1
—
u_ c •4->
fO fO
E +->
13 OZC QC

nz 1
f
1 1 O i
A A(a) (b)
Case 1. (a) Beam impacts at c.g. (b) Rebound will be up.
Case 2. (a) Offset between c.g. and impact point, (bj Tendency
for beam to rotate. Whatever energy goes into rotation
is not available for rebound.
Figure 28. Schematic Representation of Headform Rotation
aSIJIlNBQI A1l3]lill03 38 01 Q3i33dX3
38V H3IHM JS ^ IS HUM Si]m3H 11V 30 %
Sensitivity
of
Test
Method

3000
(ml 3IH
Figure
30.
HIC/Metal
vs.
HIC
Humanoid

REFERENCES
a-
1. Berger, R.E., Considerations in Developing Test Methods for ProtectiveHeadgear, National Bureau of Standards Report, NBSIR76-1107, August1976.
2. Gurdjian, E.S., Recent Advances in the Study of the Mechanism ofImpact Injury of the Head - A Summary of Clinical Neurosurgery, Vol.
19 pp. 1-42 (1972).
3. McElhaney, J.H., Stalnaker, R.L. and Roberts, V.L.,Biomechanical
Aspects of Head Injury, in Human Impact Response, Proc. of G.M.Symposium, Plenum Publishing Corp. (1972).
4. Advani, S.H. and Owings, R.P., Evaluation of Head Injury Criteria,Automotive Engineering, p-11. Society of Automotive Engineers, NewYork (1974).
5. Hodgson, V.R., National Operating Committee on Standards for AthleticEquipment Football Helmet Certification Program, Medicine and Sciencein Sports, 7 (3) PP. 225-232 (1975).
6. Gurdjian, E.S., Lissner, H.R., and Patrick, L.M., "Protection of theHead and Neck in Sports," JAMA, Vol. 182, pp. 509-512 (1962).
7. Newman, J.A., On the Use of the Head Injury Criterion (HIC) in
Protective Headgear Evaluation, Proceedings of the 19th Stapp CarCrash Conference, Society of Automotive Engineers, New York (1975).
8. Fan, W.R.S., "Internal Head Injury Assessment," Proceedings of 15thStapp Car Crash Conference, Society of Automotive Engineers, New York,
pp. 645-665 (1971).
9. Slattenschek, A., and Tauffkirchen, W., "Critical Evaluation ofAssessment Methods for Head Impact Applied in Appraisal of BrainInjury Hazard, in Particular in Head Impact on Windshields,"International Automobile Safety Conference Compendium, Society ofAutomotive Engineers, New York, Paper 700426, p. 30 (1970).
10. Hodgson, V.R. and Thomas, L.M., Head Injury Tolerance, in Aircraft
Crashworthiness, K. Saczalski, ed. (1975).
11. Gadd, C.W., "Report to SAE Performance Criteria Subcommittee, "Vehicle
Research Department, CM Research Laboratories, GM Technical Center,
Warren, Mich. 48090 (March 8, 1972).
12. Versace, J., "A Review of the Severity Index Proceedings of 15th StappCar Crash Conference, Society of Automotive Engineers, Mew York, pp.
771-796 (1971).

13. Andrews, L.M.,Football Helmet Tests: Round Robin Using NOCSAE
Recommended Test Method, National Bureau of Standards letter report tothe Consumer Product Safety Commission (March 3, 1976).
14. Specifications for Protective Headgear for Vehicular Users, AmericanNational Standard ANSI Z90. 1-1971, American National StandardsInstitute, Inc. New York (1971); and Supplement ANSI Z90.1a (1973).
15. Standard Method of Test for Shock Attenuation Characteristics ofProtective Headgear for Football, ASTM F429-75, American Society for
Testing and Materials, Philadelphia (1975).
16. Andrews, L.M., Football Helmet Tests: Comparison of Data Using BothNOCSAE and ASTM Recommended Test Methods, National Bureau of Standardsletter report to the Consumer Product Safety Commission (March 3,
1976).
17. V.R., Hodgson, M.W. Mason, and L.M. Thomas, "Head Model for Impact,"Paper 720969, Proceedings of 16th Stapp Car Crash Conference, P-45,New York, Society of Automotive Engineers, Inc. (1972).
18. Henderson, G.,Correlation Anomalies Between Helmet Drop-Test Systems,
paper presented at Technical Meeting, Safety Helmet Council ofAmerica, Los Angeles, California (November 1, 1974).
19. Dunham, T.D., Astteford, W.J., Sissung, M.A., Nazy, A., and Yeakley,L.M.
,Safety Helmet Performance Investigation, Volume I, Department of
Transportation, National Highway Traffic Safety Administration, Repx>rt
No. DOT HS-801429 (November 197^).
20. Saczalski, K.J., States, J.D., Wagar, I.J., and Richardson, E.Q.,A
Critical Assessment of the Use of Non-Human Responding Surrogates for
Safety System Evaluation, Proceedings of 20th Stapp Car CrashConference, Society of Automotive Engineers, New York (1976).
21. Hodgson, V.R., Personal ccxnmunication, 1976.

APPENDIX - Sensitivity of a Test Method
Consider a population of products which potentially pose the risk ofinjury. Suppose that a sample of these products is subjected to twodifferent tests: 1) a real life simulation for which the response, x, ofthe product is a measure of the injury potential, and 2) a more practicaltest method where, in general, some other response, y, is measured. Eachproduct so tested can theoretically be represented by a pair of responses(x^, y^) and a regression line,
y = a + bx + e
can be computed (see sketch below), e stands for the error between thepredicted y value of the regression line and the actual y values ofproducts which are assumed to be distributed about the line with standarddeviation S^. We further assume that the injury threshold, x^, is known.Then a test method threshold can also be calculated:
= a +
s-O)+->
O)EfOs-<oQ_
oO-»->
d)
«/)
<U
Real Life Simulation Parameter
The sensitivity, p, is the probability that the test method indicates
injury when the simulation indicates injury:
p(x) = ProbCy > y X > xp
= Prob(a + bx + e > a + bx. X > xp
= Prob(b(x - X ) +e>0 jx-x>0)O I o
= ProbCe > - bd|
d > 0)

where d = x - x . That, is, for all products with injury potential x, it is
assumed that there is a distribution of y values centered at y = a + bx.
The sensitivity is the area under the curve below.
e
Using normalizing transformation, z = e/S,we calculate the probability
that z > -bd/S^, where S is related to the correlation coefficient, r, and
the distribution of y values by
= s/1 - r2)
1/2
A normal distribution is assumedexpressed mathematically as
p(x) =
for e, and the sensitivity can be
Obviously, the sensitivity calculated above has meaning only for fixed
values of X > X . It is also possible to calculate a more generalsensitivity P(xj which covers a range of x values greater than x . For
this purpose we assume that the x values are normally distributed withstandard deviation S .
A
f(x)
Then f(x)dx is the percentage of products with x values between x and x +
dx:

A . « ’
,,1/ :;of ;• v' .1 .> rA j:
; 3 -•
> u:< ' U'. I Hi H ! HjjH .f j
it-; 1 („,ifl. ,'iUi<li,lO I !
\
i
i "oVl iniU J. ! ' . .ioi'i .0!I
1
rHAUjAVi OT aA^T-)i^A:-:AM dHlAUUli.i Ai! VAU,!
^•AjaGAAi! .'v; i A,<!
:
] i4 bi'h i'l!-'''
I
h
; - i 3 MW *'? ci 3 M r Vj A ^
' A* -A
.J Q ,MOli
rbonsM A iu,q:.)i to -qyT .£{ i
'
i.'Vt « > ‘ >'>lV-
IThe general sensitivity, P(x*), is the proportion of all, products with-x >6fHir.:6i'
i
X*, where x*;,,^ foJ" which y > y^. That is, of all products whose injury^
I"potentral exc'eedS iX*-./: P(x*) is the percentage that is correctly, identified
,
in the test method. Mathematically, this may be expressed as
oO
If-. . viVji’!, J i iiP ^^viniv'i i-ii so '(’.eni, :y;; -- .-1 - u hv-u
< ••• :rt U jii;;-. a.
p(x*) =
,9 -)sTiu 2 i'feqi-tr •'•OO. oofev tofciqin‘r ,tir<otbS‘}H)
.beibuJa 9'taw (xsbr^'''•^ff^T'dx
amsdaya pnrd'ioads sa .'«0|VJ i'
c’^'S : ddiluV ’0 c .) .-'-at '! 0 Adi
Di) i v-'\j
‘
m> r o (a 1 i
,
i'h x<'a pnrl rtA'y'tCt'Sx x'-Av-w)
J
broHEmbd bnc- ftsk-^ii noswlAd i{Of-3fi^5;Tioo bm;-?: wod;- aj »
•
i as-a -jfAv;
I
no bad 0 sqm r o*^9W adeiiirsrt nAdw anol’J’fifeTjOd 'looq dud aJDf-qmr .;!.!•• ^Lntrtt.'b •'in'vo .••..•fi-iM'-
. vlr‘iAV..;X G:H w > AvV; rvA.AM .r'-'
nor
in': ,v;(iiu lri ja-t(4?4!vit» ,; ’innv
l .vi; ;i...'•
vrac! t> .';'.-a.i!u h'.'w^ 'i.-jjt u-.iO ei'.'i''. i'- Tj'it-:a
.hodJbsfl J?9.J : .1 oftqnif ; i'smi sd ; 'f s&gbsefi ;;inc 'bnyrl ; x“''in :
i'..••iW;.
I X-K)A9 -iO OW .f% i ?;aA.O YT1^0;>-K|
liUiT?I
I
U'H’nn^^A i.’nn i
7.HroTlT>uj"‘K;; ‘£\
>S0A0;"1HI)I
I
I
1
y
!
i
1
J
]
. 1
..J
Tioini .Sill,j
S
1
1
^ ,.t
J'lO.cJti'. i
j
. {V\^ aM i;.i' . I? . -lo V .‘Mi
i‘(j i,.:: . i***- Hiuirf-n '-'V ;• > ’
.a'i ’«•* '
i i'
s'Ot3i-hi'»;-hil 5 u r!'.'h ^ .•' ui'-' J r i.
''
<^
i:''
•.'? Hi {;« h ;

NBS-I14A (REV. 7-73)
U.S. DEPT. OF COMM.BIBLIOGRAPHIC DATA
SHEET
1. PUHLK A'l ION OR REPORT NO. 2. Gov’t Accession
NBSIR78-1547 ^o.3. Recipient’s Accession No.
4. TITLE AND SUBTITLE
METHODOLOGY FOR CHOOSING TEST PARAMETERS TO EVALUATE
PROTECTIVE HEADGEAR
5. Publication Date
November 1978
6. Performing Organization (iode
763
7. AU'mOR(S)R.E. Berger and N.J. Calvano
8. Performing Organ. Report No.
9. PEREORMING ORGANIZATION NAME AND ADDRESS
NATIONAL BUREAU OF STANDARDSDEPARTMENT OF COMMERCEWASHINGTON, D.C. 20234
10. Project /Task/Work Unit No.
7630143
11. Contract/Grant No.
12. Sponsoring Organization Name and Complete Address (Street, City, State, ZIP)
National Bureau of Standards
Department of CommerceWashington, D.C. 20234
13. Type of Report & PeriodCovered
Interim14. Sponsoring Agency Code
15. SUPPLEMENTARY NOTES
16. ABSTRACT (A 200-word or less factual summary of most significant information. If document includes a significant
bibliography or literature survey, mention it here.)
The effects of changing test variables (headform, impact velocity, impact surface,impact site) on output parameters (peak acceleration, severity index) were studied.Twelve football helmets representing six different types of energy absorbing systemswere used in the test. Results show good correlation between metal and humanoidheadforms during top impacts but poor correlations when helmets were impacted on
the back. Correlation between impact surfaces was high. Peak accelerationcorrelated well with severity index.
17. KEY WORDS (six to twelve entries; alphabetical order; capitalize only the first letter of the first key word unless a proper
name; separated by semicolons
)
Head injury; headform; headgear; helmet; impact; test method.
18. AVAILABILITY Unlimited 19. SECURITY CLASS(THIS REPORT)
21. NO. OF PAGES
[T2 For Official Distribution. Do Not Release to NTISUNCLASSIFIED
78
13”' Order From Sup. of Doc., U.S. Government Printing OfficeWashington. D.C. 20402. SD Cat. No. CU
20. SECURITY CLASS(THIS PAGE)
22. Price
1
' Order From National Technical Information Service (NTIS)Springfield, Virginia 22151 UNCLASSIFIED
$6.00
USCOMM-DC 29042-P74

