methodology for ph measurement in high alkali cementitious
TRANSCRIPT

1
Methodology for pH measurement in high alkali cementitious systems 1
2
Brian Traynor a, Hugo Uvegi a, Elsa Olivetti a, Barbara Lothenbach b, Rupert J. Myers c,d,* 3
4
a Department of Materials Science and Engineering, Massachusetts Institute of Technology, 5
77 Massachusetts Avenue, Cambridge, Massachusetts, 01239, United States 6
b EMPA, Laboratory for Concrete & Construction Chemistry, CH-8600 Dübendorf, 7
Switzerland 8
c School of Engineering, University of Edinburgh, Edinburgh, EH9 3FB, UK 9
d Current address: Department of Civil and Environmental Engineering, Imperial College 10
London, Skempton Building, London, SW7 2AZ, UK 11
12
* Corresponding author. Email: [email protected] 13
Keywords: pH, alkalis, pore solution 14
15
Abstract 16
17
A methodology for calibrating pH meters in highly alkaline solutions such as those relevant 18
to cementitious systems is presented. This methodology uses an extended form of the Debye-19
Hückel equation to generate a calibration curve of pH vs. the measured electrochemical 20
potential (mV) based on a series of aqueous alkali hydroxide solutions of known 21
concentrations. This methodology is compared with the ‘built-in’ process of calibration based 22
upon pH 4, 7, and 10 standard solutions. The built-in calibration process underestimates the 23
real pH values by up to 0.3 log units, which is attributed to the alkali error. A spreadsheet for 24
determining the calibration curve and its application to pH meter readings is provided as 25

2
Supporting Information. The implications of improperly calibrated pH meters on interpreting 26
solution chemistry in cementitious systems are discussed. 27
28
1. Introduction 29
30
Measurement of pH is a quick, simple and cost-effective technique that is fundamental to 31
analytical chemistry and widely used in cement science. Fresh Portland cement concrete 32
typically has a pH > 13 [1]. Maintaining such a high pH is essential to ensure passivation of 33
steel in reinforced concrete, thereby preventing structural deterioration [2,3]. The pH of the 34
activator solution in an alkali-activated material plays a critical role in precursor dissolution 35
[4,5], and high pH solutions (> 13) are typically employed for this purpose [6]. In both 36
Portland cement and alkali-activated material systems, the formation of reaction products has 37
also been shown to depend on pH [7–10]. 38
39
Calibration of a pH meter is necessary for accurate pH measurements. pH meters are 40
typically calibrated using standard solutions with pH values of 4, 7, and 10 – a process we 41
refer to here as the ‘built-in’ pH meter calibration. Saturated aqueous Ca(OH)2 solution may 42
be used as a pH 12.45 standard (at 25°C) [11]. However, these pH values are below the pH 43
range of most cementitious systems; therefore, using the built-in calibration in cementitious 44
systems will likely lead to systematic pH measurement errors. Through appropriate selection 45
of solutions of known concentration, pH meters can be accurately calibrated to higher pH. 46
Although versions of this methodology have been used for years in analyses of cementitious 47
systems [1,12–17], it has been poorly explicitly disseminated and there has been relatively 48
little uptake of it among the broader cement science community. This communication is 49
intended to clarify this methodology to the cement science community at large. As such, a pH 50
3
calculator for NaOH and KOH solutions as a function of temperature and concentration is 51
included in the Supporting Information and the relevant physical chemistry concepts 52
underpinning these calculations are discussed here. 53
54
2. Background 55
56
Table 1. Nomenclature of terms 57
𝑎𝑎𝑖𝑖 Activity of ion 𝑖𝑖
𝑏𝑏𝑖𝑖 Molality (mol kg–1)
𝑏𝑏0 Standard molality, defined as 1 mol kg–1
𝛾𝛾𝑖𝑖 Activity coefficient of ion 𝑖𝑖
𝑧𝑧𝑖𝑖 Charge on ion 𝑖𝑖
𝐼𝐼 Ionic strength, = 12∑ 𝑏𝑏𝑖𝑖𝑧𝑧𝑖𝑖2𝑖𝑖 (mol kg–1)
�̇�𝑎 Distance of closest approach parameter of interacting ions in
Debye-Hückel equation (Å)
𝑏𝑏𝛾𝛾 Semi-empirical parameter in extended Debye-Hückel
equation (kg mol–1)
𝐴𝐴𝛾𝛾 Electrostatic parameter in Debye-Hückel equation (kg1/2
mol–1/2)
𝐵𝐵𝛾𝛾 Electrostatic parameter in Debye-Hückel equation (kg1/2
mol–1/2 Å–1)
𝑥𝑥𝑗𝑗𝑗𝑗 Amount of water, parameter in Debye-Hückel equation
(mol)
𝑋𝑋𝑗𝑗 Total amount of all species in the aqueous phase, parameter
in Debye-Hückel equation (mol)
𝑀𝑀𝑖𝑖 Molarity (mol L–1)
58
2.1. Activity of non-ideal solutions 59
60

4
We begin the description of our methodology to calibrate pH meters by expressing the acidity 61
of a solution using pH values (Eq.(1)): 62
63
pH = −log10(𝑎𝑎𝐻𝐻+) = −log10 �𝛾𝛾𝐻𝐻+𝑏𝑏𝐻𝐻+𝑏𝑏0� (1) 64
65
where 𝑎𝑎𝐻𝐻+ is the activity of aqueous H+, 𝑏𝑏𝐻𝐻+ is the molality of aqueous H+ (mol kg–1, i.e., 66
mol of aqueous H+ per kg of solvent), 𝑏𝑏0 is the standard molality which is defined as 1 mol 67
kg–1 (included to make the activity dimensionless), and 𝛾𝛾𝐻𝐻+ is the activity coefficient of 68
aqueous H+. Activity is a measure of the effective concentration of an ion in solution, 69
accounting for non-idealities that arise in real solutions. Molality is the preferred 70
thermodynamic expression for concentration due to its independence of temperature and 71
pressure, unlike molarity (mol L–1). 72
73
Deviations between activity and concentration arise from electrostatic interactions among 74
ions in aqueous ionic solutions. Long range inter-ionic coulombic attractions affect ion 75
activity predominantly at low concentrations, whereas short-range ion-ion and water-ion 76
solvation interactions have additional effects at higher concentrations. Short-range ion-ion 77
interactions (ion association) decrease ion activity through formation of ion-ion pairs, 78
reducing the effective number of ions in solution. Water-ion solvation interactions (ion 79
hydration) increase activity by effectively reducing the amount of solvent. In highly dilute 80
aqueous environments, the difference between concentration and activity is negligible. 81
82
Debye-Hückel (DH) theory [18] was developed to calculate the mean activity coefficients of 83
ions as a function of the concentration of ions in aqueous ionic solutions. DH theory as 84
originally developed is applicable to dilute aqueous ionic solutions, in which short range 85
5
interactions are ignored by assuming a structureless solvent, and where the primary 86
interactions between ions are long-range Coulombic forces. The theory results in the Debye-87
Hückel equation (Eq. (2)), which we define here using molalities: 88
89
log10𝛾𝛾𝑖𝑖 = −𝐴𝐴𝛾𝛾𝑧𝑧𝑖𝑖2√𝐼𝐼
1+�̇�𝑎𝐵𝐵𝛾𝛾√𝐼𝐼+ log10
𝑥𝑥𝑗𝑗𝑗𝑗𝑋𝑋𝑗𝑗
(2) 90
91
where 𝑧𝑧𝑖𝑖 is the charge of ion i in solution, �̇�𝑎 (Å) is the average distance of closest approach of 92
two ions of opposite charge, 𝐼𝐼 (mol kg–1) is the ionic strength (defined in Table 1), and 𝐴𝐴𝛾𝛾 93
(kg1/2 mol–1/2) and 𝐵𝐵𝛾𝛾 (kg1/2 mol–1/2 Å–1) are parameters dependent on the temperature, 94
density, and relative permittivity of the solvent (see Supporting Information). The average 95
distance of closest approach, �̇�𝑎, does not in reality represent the sum of the ionic radii of the 96
two ions, and in practice is adjusted to provide a best fit for the aqueous ionic solution of 97
interest [19]. The second term in Eq. (2) contains the amount of water, 𝑥𝑥𝑗𝑗𝑗𝑗 (mol), and the 98
total amount of species in the aqueous phase, 𝑋𝑋𝑗𝑗 (mol) and changes the units of 𝛾𝛾𝑖𝑖 from 99
molar fraction to molal fraction, aligning with our definition of activity. A more detailed 100
derivation and explanation of this equation and related terms may be found in Wright [20]. 101
The ionic strength is a measure of the molality of fully dissociated ions in solution, noting 102
that only in very dilute solutions can salts be assumed to be completely dissociated. Eq. (2) is 103
accurate in solutions up to moderate ionic strength, 𝐼𝐼 ≤ 0.1 mol kg–1 [21]. 104
105
Versions of the Debye-Hückel equation with an extended term have been used by researchers 106
to extend the range of ionic strengths over which Debye-Hückel theory is valid. Helgeson 107
extended the DH equation with a linear term [19]; 108
109

6
log10𝛾𝛾𝑖𝑖 = −𝐴𝐴𝛾𝛾𝑧𝑧𝑖𝑖2√𝐼𝐼
1+�̇�𝑎𝐵𝐵𝛾𝛾√𝐼𝐼+ 𝑏𝑏𝛾𝛾𝐼𝐼 + log10
𝑥𝑥𝑗𝑗𝑗𝑗𝑋𝑋𝑗𝑗
(3) 110
111
where 𝑏𝑏𝛾𝛾 (kg mol–1) is a semi-empirical parameter, known as the extended term. In his 112
model, a common distance of closest approach was assumed by Helgeson for all ions in a 113
given aqueous ionic solution – values of �̇�𝑎 were calculated for various solutions, with �̇�𝑎 114
taking a common value for all ions in that solution. This assumption makes the Helgeson 115
extension to the DH equation more accurate in solutions in which the primary salt 116
concentration exceeds that of other aqueous ions. Additionally, the effects of short-range 117
water-ion solvation interactions are captured by the extended term, 𝑏𝑏𝛾𝛾 (kg mol–1). Helgeson 118
described the solvation of an ion in solution using the Born equation [22], as corrected by 119
Bjerrum [23], to calculate values of 𝑏𝑏𝛾𝛾 for various aqueous ionic solutions. The applicability 120
of the Helgeson form of the Debye-Hückel (H-DH) equation at high ionic strengths depends 121
on the aqueous ionic solution of interest. For aqueous NaOH and KOH solutions, the H-DH 122
equation is accurate up to ionic strengths of 4.5 mol kg–1, determined by Helgeson as the 123
range of validity for the extended term, 𝑏𝑏𝛾𝛾, through comparison of activity coefficients 124
reported in the literature to those computed using the H-DH equation [19]. Two other notable 125
forms of the extended DH equation are the Davies’ equation and the Truesdell-Jones equation 126
– these are discussed in the Supporting Information and are applicable at moderate to high 127
ionic strengths, (I < 0.1 mol kg–1, and I < 1 mol kg–1, respectively) [26,27]. 128
129
The Pitzer equations are suitable for high ionic strengths and mixed ion aqueous ionic 130
solutions (I > 1 mol kg–1) [28,29]; however, they require specific interaction parameters 131
between aqueous species to be defined, which are numerous in cementitious systems (Ca2+, 132
CaOH+, SiO(OH)3–, SiO2(OH)2
2–, etc.). Therefore, the Pitzer equations are less pragmatic for 133
7
application in cementitious systems than the extended forms of the DH equation and are not 134
discussed further here. 135
136
2.2. pH measurement with a glass combination electrode 137
138
While activity cannot be directly measured, electrochemical potential can. pH is most 139
commonly determined indirectly through measurement of an electrochemical potential using 140
a pH meter, which typically consists of a glass combination electrode and a meter. The 141
electrochemical potential of standard solutions with precisely known pH can be measured 142
using a glass combination electrode, and a calibration curve of pH vs. electrochemical 143
potential is generated by the meter. This built-in calibration curve is used to convert 144
electrochemical potentials measured by the glass combination electrode in an analyte to pH. 145
The electrochemical potential measured by the glass combination electrode, 𝐸𝐸𝑇𝑇 , may be 146
written as (Eq. (4)): 147
148
𝐸𝐸𝑇𝑇 = 𝜀𝜀 + 𝐸𝐸(𝑎𝑎𝐻𝐻+) (4) 149
150
where 𝜀𝜀 (mV) is an electrochemical potential due to a combination of smaller potentials that 151
are artifacts of the design of the glass combination electrode, (see Supporting Information), 152
and 𝐸𝐸(𝑎𝑎𝐻𝐻+) (mV) is an electrochemical potential that is a function of solution pH. While Eq. 153
(4) is similar to the Nernst equation (𝐸𝐸 = 𝐸𝐸0 − 2.303 𝑅𝑅𝑇𝑇𝐹𝐹𝑝𝑝𝑝𝑝), Eq. (4) is more appropriate in 154
this context as the measured electrochemical potential, 𝐸𝐸𝑇𝑇, is not a linear function over the 155
entire pH scale, as is implied by the Nernst equation. Despite this non-linearity, calibrations 156
performed relating 𝐸𝐸(𝑎𝑎𝐻𝐻+) to pH are generally assumed to be linear. This is valid over most 157

8
of the pH range, but not for highly acidic or alkaline solutions, where linearity between 158
electrochemical potential and pH is lost. 159
160
The Ag/AgCl glass combination electrode with ion selective membrane is the most common 161
type of electrode used in pH meters. The potential of interest in this paper is the gel layer 162
potential, 𝐸𝐸(𝑎𝑎𝐻𝐻+), which occurs at the ion selective membrane of the glass combination 163
electrode. It arises due to the difference between H+ activity in the external analyte electrolyte 164
and the inner buffer electrolyte. The glass membrane is a silicate glass with ion inclusions, 165
typically Ca2+, Na+, and Li+, but the exact glass composition depends on the analyte ions 166
towards which the membrane is designed to be selective [30,31]. The gel layer potential, 167
which is generated across the glass membrane when in contact with the analyte, arises 168
through formation of a charged hydrated gel layer produced on either side of the glass 169
membrane [32,33]. 170
171
Although the gel layer potential, 𝐸𝐸(𝑎𝑎𝐻𝐻+), is designed to change only as a function of analyte 172
H+ ion activity (over a wide range of H+ activities and analyte chemistries), no glass 173
membrane is ever wholly selective to one specific ion [34]. In highly alkaline solutions the 174
hydrated gel layer has a negative structural charge and is charge-balanced significantly by 175
aqueous alkali metal complexes (e.g., Na+) in addition to H+, as described by Baucke [35]. 176
Cheng described the gel layer potential as a capacitor, in which the surface charge density, 177
caused by adsorbed ions (e.g., H+, OH–, Na+), yields a potential across the glass membrane 178
[36]. In any case, the presence of positively charged alkali ions in the gel layer artificially 179
lowers the measured pH as alkali ions, rather than H+ ions, contribute to the gel layer 180
potential. This phenomenon is known as the alkali error [37–39]. It arises when measuring 181
pH of highly alkaline aqueous solutions; the effect is relatively weak in the case of K+, 182

9
moderate for Na+, and strong for Li+. Standard solutions of pH 4, 7, and 10 are thus 183
insufficient to calibrate a pH meter for measurement of highly alkaline aqueous solutions. 184
Calibrating a pH meter with solutions of similar chemistry and ionic strength to the analyte is 185
a means of providing a valid calibration curve by mitigating the systematic errors discussed 186
above, including the alkali error [40]. 187
188
In the context of cement science, the observed discrepancies between measured and actual pH 189
can significantly alter interpretation of experimental results. As discussed in the introduction, 190
the evolution of a (solid/liquid) cementitious system depends on the OH– concentration in its 191
aqueous phase. Dissolution rates of a wide range of minerals and cement hydration products 192
have shown strong dependences on pH, with small differences in pH potentially 193
corresponding to large changes in rates of dissolution [41–46]. Similarly, the rates and 194
distributions of reaction products vary with pH [4,7]. For example, pH affects silicate 195
speciation in aqueous alkali silicate solutions [47], and the relative stabilities of calcium 196
(alkali) (alumino)silicate hydrate (C-(N-)A-S-H) and portlandite [48], and zeolites and alkali 197
aluminosilicate (hydrate) gel [7,49–51]. We draw attention to the fact that misinterpretation 198
of pore solution chemistry of a cementitious system can lead to mis-characterization of its 199
solid phases due to the intrinsic link between solid and liquid phases (e.g., equilibrium 200
phenomena), which is relevant to systems involving pure solid phases, binders, mortar, and 201
concrete. Aqueous solutions of NaOH and KOH are of interest in cementitious systems due 202
to their use in AAMs and the relatively high concentrations of these alkali metals (K 203
especially) in hydrated Portland cement. 204
205
The H-DH equation allows calculation of the activity of OH–, and hence pH, up to ionic 206
strengths of 4.5 mol kg–1 for single component aqueous systems [19] or 1-3 mol kg–1 in 207

10
multi-component cementitious systems [48]. For solutions of known molarity, a calibration 208
curve can be constructed through the electrochemical response of the pH meter in solution 209
and the pH determined using the H-DH equation for each solution. By accounting for the 210
alkali error in this way, the pH of an analyte can be accurately determined. We demonstrate 211
the use of this methodology in the following sections of this paper. 212
213
3. Experimental procedures 214
215
3.1. NaOH and KOH standards, and LiOH solutions 216
217
NaOH and KOH standards were prepared with the following concentrations: 0.0001 M (mol 218
L–1), 0.0005 M, 0.001 M, 0.005 M, 0.01 M, 0.05 M, 0.1 M, 0.2 M, 0.5 M, 1 M, 2 M, and 3 M. 219
NaOH and KOH standards were made by diluting commercial solutions of 3 (±0.005) M 220
NaOH (BDH Chemicals) and 8 (±0.005) M KOH (Ricca), respectively. Dilutions were 221
performed by transferring quantities of Na(K)OH commercial solution into volumetric flasks 222
and filling to their marks with high purity water (18.2 MΩ cm, Millipore). The as-ordered 223
Na(K)OH commercial solutions were stored in high-density polyethylene (HDPE) bottles. 224
All prepared solutions were stored in clean HDPE bottles upon preparation. 225
226
LiOH solutions (concentrations of 0.0001 M (mol L–1), 0.0005 M, 0.001 M, 0.005 M, 0.01 227
M, 0.05 M, 0.1 M, 0.2 M, 0.5 M, 1 M, 2 M, and 3 M) were prepared by addition of 228
appropriate quantities of reagent grade lithium hydroxide monohydrate flakes (> 98%, Alfa 229
Aesar) to a 500 mL volumetric flask and filling to the mark with high purity water (18.2 MΩ 230
cm, Millipore) once flakes had completely dissolved. Calibrations used freshly prepared 231
solutions to mitigate effects of carbonation of alkalis. The use of analytical grade salts in the 232

11
case of LiOH can lead to higher deviations (±2%) from the target concentrations than the use 233
of standard solutions in the cases of KOH and NaOH. This has been taken into account in the 234
calculated uncertainties of pH values reported here, resulting in a deviation of <0.001 pH 235
units for the LiOH solutions. 236
237
3.2. pH measurements 238
239
A typical pH meter offers the possibility to read out i) the pH values directly based on the 240
built-in calibration using pH 4, 7, and 10 standard solutions (‘built-in calibration’) or ii) the 241
mV electrochemical potential (mV). All pH measurements were performed with a Thermo 242
Orion Ag/AgCl combination triode stored in KCl solution with Automatic Thermal 243
Correction probe at 22°C. Between measurement of each analyte, the pH meter was rinsed 244
using water purified by reverse osmosis (18 MΩ cm) (Millipore) and gently dabbed dry using 245
delicate wipes (Kimtech). Approximately 10 mL of prepared aqueous Na(K)OH solution was 246
transferred to a 15 mL polypropylene (PP) centrifuge tube. The solution was gently agitated 247
for a few seconds, and the electrochemical potential was recorded after 2 minutes (when the 248
reading had stabilized). Samples were not stirred during pH measurements [52]. The main 249
sources of error in this study were the accuracy of the pH meter and glass combination 250
electrode in measuring the electrochemical potential (±0.2 mV), and the error in the built-in 251
calibration slope recorded (±0.5 %). Errors in the calculated pH values are based on the 252
standard deviation of recorded temperatures (±0.5 °C) during measurement of the pH of 253
solutions. Error propagation calculations are included in the Supporting Information. 254
255
3.3. Fitted calibration curve calculations 256
257

12
The pH of the solution was calculated from the solution concentrations using the H-DH 258
equation for aqueous NaOH and KOH solutions and known equilibrium constants for 259
Na(K)OH dissociation at the measurement (laboratory) temperature (22°C) from [53]. The 260
calculated pH values were then plotted against the measured electrochemical potentials of 261
prepared Na(K)OH solutions using the pH meter, and the data fitted using a calibration curve 262
(‘fitted calibration’). The use of NaOH or KOH solutions for the fitted calibration directly 263
takes into account the alkali error, as the same alkali error occurs both during the calibration 264
and the measurement accounting for the systematic error. Electrochemical potentials of 265
analytes are also measured using electrochemical potential (mV) readings from the pH meter, 266
and the fitted calibration curve is used to convert the readings to pH. We provide a 267
spreadsheet for the determination of this calibration curve and application to pH meter 268
readings of sample solutions as Supporting Information. 269
270
3.4. Preparation of alkali-activated biomass ash samples 271
272
Application of this methodology to a real cementitious system is also demonstrated here. 273
Alkali-activated biomass ash experiments were prepared using 0.5 and 1 molal aqueous 274
NaOH solutions (ACS Reagent grade water, RICCA Chemical Company; NaOH ≥97%, 275
Sigma Aldrich) as activators at a constant liquid/solid ratio of 25 (i.e. 2 g of solid in 50 mL of 276
solution). Solids consisted of highly siliceous biomass ash (sourced from Silverton Pulp & 277
Papers Pvt. Ltd. In Muzzafarnagar, Uttar Pradesh, India) and Ca(OH)2 (≥98%, Macron Fine 278
Chemicals), mixed at a ratio of 1.75 g ash : 0.25 g Ca(OH)2. The composition of the biomass 279
ash, determined by X-ray fluorescence and loss on ignition tests, showed siliceous ash (61 280
mass% SiO2) with high unburnt carbon (26 mass%). The phase composition (determined by 281
X-ray diffraction) showed a primarily amorphous ash (90 mass%) with presence of quartz, 282

13
albite, cristobalite, sylvite and arcanite. The materials and conditions of reaction were chosen 283
to mimic a masonry product previously developed in [54]. Samples were mixed continuously 284
in a tube rotator (FisherbrandTM Multi-Purpose Tube Rotator, Fisher Scientific) to ages of 3 285
and 28 days to explore dissolution and reaction kinetics. 286
287
4. pH meter calibration 288
289
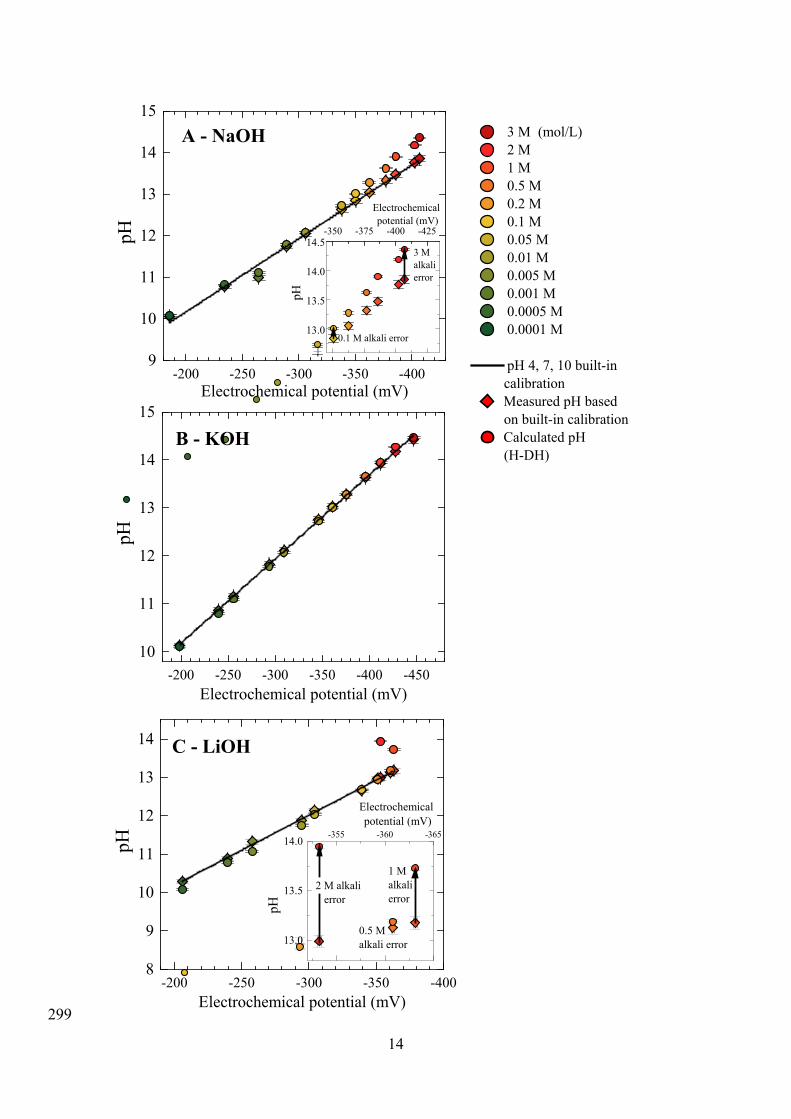
The linear calibration curve fittings for prepared aqueous NaOH and KOH solutions are 290
respectively shown in Figure 1 (A) and (B). The alkali error associated with measuring the 291
pH of LiOH solutions is also demonstrated (Figure 1 (C)). The pH is calculated using the H-292
DH equation (Eq. (3)) and methodology presented here and in the Supporting Information. 293
The measured built-in pH is based on an extrapolated calibration curve using pH 4, 7, and 10 294
standard solutions. The divergence at high pH (Figure 1A, inset) demonstrates the alkali error 295
and the need to apply the methodology presented here when measuring highly alkaline 296
solutions, i.e., in analysis of cementitious systems. 297
298
14
-200 -250 -300 -350 -4009
10
11
12
13
14
15
-200 -250 -300 -350 -400 -45010
11
12
13
14
15
-200 -250 -300 -350 -4008
9
10
11
12
13
14
pH
Electrochemical potential (mV)
A - NaOHpH
Electrochemical potential (mV)
B - KOH
3 M (mol/L) 2 M 1 M 0.5 M 0.2 M 0.1 M 0.05 M 0.01 M 0.005 M 0.001 M 0.0005 M 0.0001 M
pH 4, 7, 10 built-in calibration
Measured pH based on built-in calibration
Calculated pH (H-DH)
-350 -375 -400 -425
13.0
13.5
14.0
14.53 M alkali error
Electrochemical potential (mV)
pH
0.1 M alkali error
pH
Electrochemical potential (mV)
C - LiOH
-355 -360 -365
13.0
13.5
14.0
0.5 M alkali error
1 M alkali error
Electrochemical potential (mV)
pH
2 M alkali error
299
15
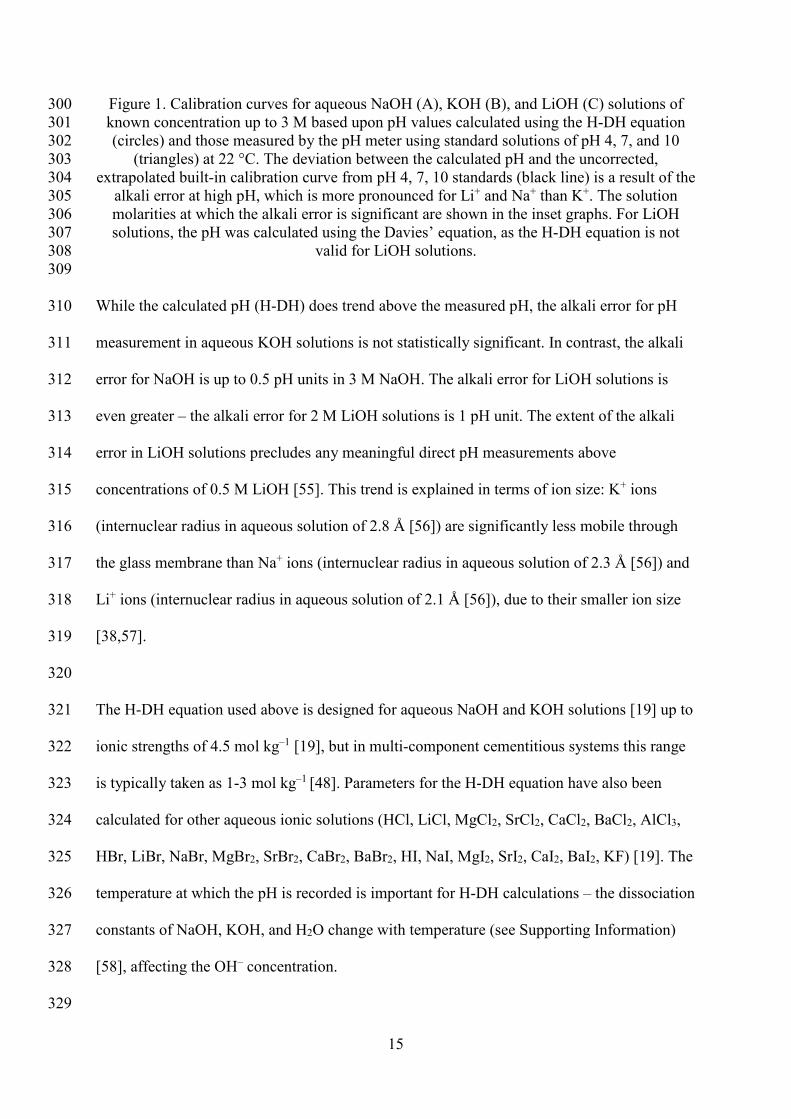
Figure 1. Calibration curves for aqueous NaOH (A), KOH (B), and LiOH (C) solutions of 300 known concentration up to 3 M based upon pH values calculated using the H-DH equation 301 (circles) and those measured by the pH meter using standard solutions of pH 4, 7, and 10 302
(triangles) at 22 °C. The deviation between the calculated pH and the uncorrected, 303 extrapolated built-in calibration curve from pH 4, 7, 10 standards (black line) is a result of the 304
alkali error at high pH, which is more pronounced for Li+ and Na+ than K+. The solution 305 molarities at which the alkali error is significant are shown in the inset graphs. For LiOH 306 solutions, the pH was calculated using the Davies’ equation, as the H-DH equation is not 307
valid for LiOH solutions. 308 309
While the calculated pH (H-DH) does trend above the measured pH, the alkali error for pH 310
measurement in aqueous KOH solutions is not statistically significant. In contrast, the alkali 311
error for NaOH is up to 0.5 pH units in 3 M NaOH. The alkali error for LiOH solutions is 312
even greater – the alkali error for 2 M LiOH solutions is 1 pH unit. The extent of the alkali 313
error in LiOH solutions precludes any meaningful direct pH measurements above 314
concentrations of 0.5 M LiOH [55]. This trend is explained in terms of ion size: K+ ions 315
(internuclear radius in aqueous solution of 2.8 Å [56]) are significantly less mobile through 316
the glass membrane than Na+ ions (internuclear radius in aqueous solution of 2.3 Å [56]) and 317
Li+ ions (internuclear radius in aqueous solution of 2.1 Å [56]), due to their smaller ion size 318
[38,57]. 319
320
The H-DH equation used above is designed for aqueous NaOH and KOH solutions [19] up to 321
ionic strengths of 4.5 mol kg–1 [19], but in multi-component cementitious systems this range 322
is typically taken as 1-3 mol kg–1 [48]. Parameters for the H-DH equation have also been 323
calculated for other aqueous ionic solutions (HCl, LiCl, MgCl2, SrCl2, CaCl2, BaCl2, AlCl3, 324
HBr, LiBr, NaBr, MgBr2, SrBr2, CaBr2, BaBr2, HI, NaI, MgI2, SrI2, CaI2, BaI2, KF) [19]. The 325
temperature at which the pH is recorded is important for H-DH calculations – the dissociation 326
constants of NaOH, KOH, and H2O change with temperature (see Supporting Information) 327
[58], affecting the OH– concentration. 328
329
16
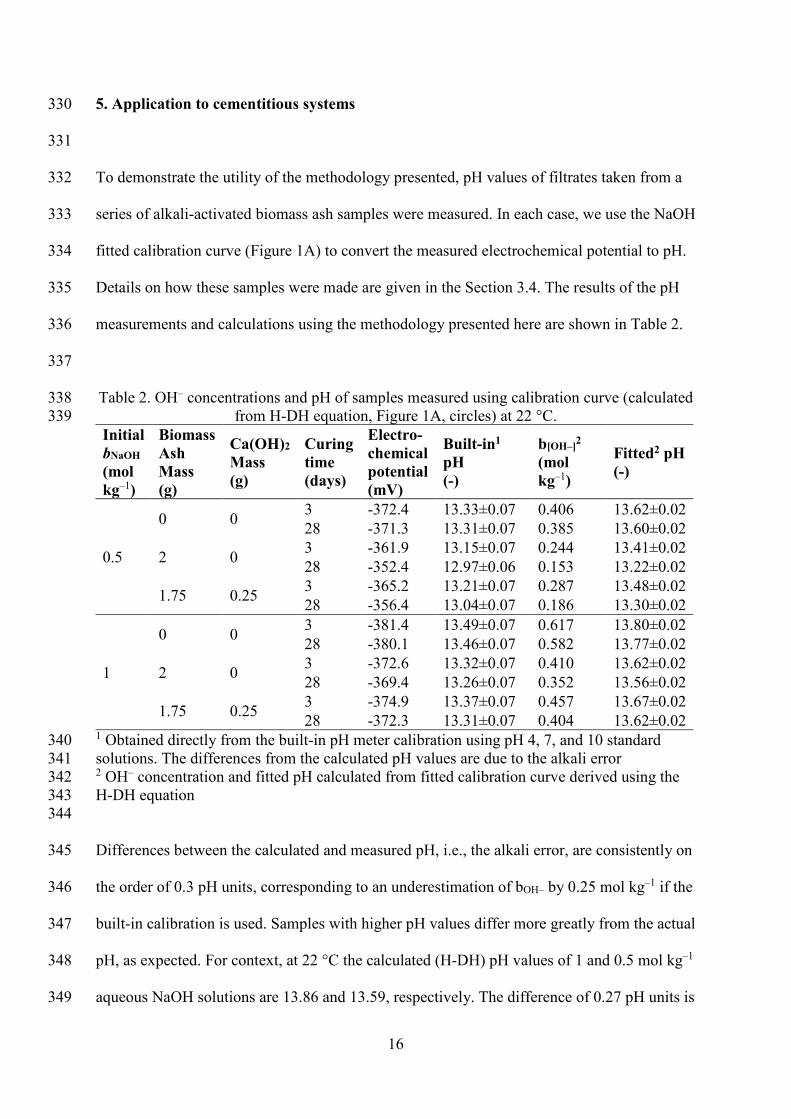
5. Application to cementitious systems 330
331
To demonstrate the utility of the methodology presented, pH values of filtrates taken from a 332
series of alkali-activated biomass ash samples were measured. In each case, we use the NaOH 333
fitted calibration curve (Figure 1A) to convert the measured electrochemical potential to pH. 334
Details on how these samples were made are given in the Section 3.4. The results of the pH 335
measurements and calculations using the methodology presented here are shown in Table 2. 336
337
Table 2. OH– concentrations and pH of samples measured using calibration curve (calculated 338 from H-DH equation, Figure 1A, circles) at 22 °C. 339
Initial bNaOH (mol kg–1)
Biomass Ash Mass (g)
Ca(OH)2 Mass (g)
Curing time (days)
Electro-chemical potential (mV)
Built-in1 pH (-)
b[OH–]2 (mol kg–1)
Fitted2 pH (-)
0.5
0 0 3 -372.4 13.33±0.07 0.406 13.62±0.02 28 -371.3 13.31±0.07 0.385 13.60±0.02
2 0 3 -361.9 13.15±0.07 0.244 13.41±0.02 28 -352.4 12.97±0.06 0.153 13.22±0.02
1.75 0.25 3 -365.2 13.21±0.07 0.287 13.48±0.02 28 -356.4 13.04±0.07 0.186 13.30±0.02
1
0 0 3 -381.4 13.49±0.07 0.617 13.80±0.02 28 -380.1 13.46±0.07 0.582 13.77±0.02
2 0 3 -372.6 13.32±0.07 0.410 13.62±0.02 28 -369.4 13.26±0.07 0.352 13.56±0.02
1.75 0.25 3 -374.9 13.37±0.07 0.457 13.67±0.02 28 -372.3 13.31±0.07 0.404 13.62±0.02
1 Obtained directly from the built-in pH meter calibration using pH 4, 7, and 10 standard 340 solutions. The differences from the calculated pH values are due to the alkali error 341 2 OH– concentration and fitted pH calculated from fitted calibration curve derived using the 342 H-DH equation 343 344
Differences between the calculated and measured pH, i.e., the alkali error, are consistently on 345
the order of 0.3 pH units, corresponding to an underestimation of bOH– by 0.25 mol kg–1 if the 346
built-in calibration is used. Samples with higher pH values differ more greatly from the actual 347
pH, as expected. For context, at 22 °C the calculated (H-DH) pH values of 1 and 0.5 mol kg–1 348
aqueous NaOH solutions are 13.86 and 13.59, respectively. The difference of 0.27 pH units is 349

17
similar to the discrepancy caused by the alkali error (0.3 pH units), demonstrating the effect 350
of this phenomenon in analysis of cementitious systems. 351
352
6. Conclusions 353
354
A methodology for calibrating pH meters in solutions of high alkali content (pH >13) has 355
been presented. The Helgeson extension to the Debye-Hückel (H-DH) equation was used to 356
calculate the pH of aqueous ionic solutions of known molarity. The H-DH equation was 357
chosen because of its practicality and accuracy at high ionic strengths (approaching 4.5 mol 358
kg–1). We provide a spreadsheet for the determination of this calibration curve and 359
application to pH meter readings of sample solutions as Supporting Information. The value of 360
this methodology was demonstrated for a binder consisting of biomass ash, Ca(OH)2 and 361
aqueous NaOH activator. The discrepancies, caused by the alkali error, between the actual, 362
fitted pH (calculated using the H-DH) and the measured pH (based on the built-in pH 4, 7, 10 363
standards calibration) were highlighted. The built-in calibration underestimated the real pH 364
values by up to 0.3 pH units in aqueous NaOH solution, which illustrates the importance of a 365
properly calibrated pH meter to prevent erroneous interpretations of the pH of cementitious 366
systems. Discrepancies between built-in calibration and real, fitted pH values were more 367
pronounced for aqueous LiOH solutions compared to aqueous NaOH solutions, but less so 368
for aqueous KOH solutions. 369
370
7. Supporting information 371
372
Two files are provided as supporting information: (1) a document containing additional 373
descriptions of (S1) other forms of the extended Debye-Hückel equation, (S2) 374

18
electrochemical potentials in glass combination electrodes, and (S3) the error analysis 375
performed here; and (2) a spreadsheet embedded with calculations and a step-by-step 376
procedure to use the method described here, to measure pH in high alkali cementitious 377
systems. 378
379
8. Acknowledgments 380
381
We would like to acknowledge the financial support for this research through the 382
Environmental Solutions Initiative at Massachusetts Institute of Technology (MIT), 383
Cambridge. We also acknowledge support from NSF CAREER #1751925. Funding provided 384
by the Scottish Research Partnership in Engineering Grant #PECRE1718/02 is gratefully 385
acknowledged. The research leading to this publication benefitted from EPSRC funding 386
under grant No. EP/R010161/1 and from support from the UKCRIC Coordination Node, 387
EPSRC grant number EP/R017727/1, which funds UKCRIC’s ongoing coordination. 388
389
9. Conflicts of interest 390
391
The authors declare no conflicts of interest. 392
393
10. References 394
395
[1] B. Lothenbach, F. Winnefeld, Thermodynamic modelling of the hydration of Portland 396
cement, Cem. Concr. Res. 36 (2006) 209–226. doi:10.1016/j.cemconres.2005.03.001. 397
[2] A.M. Vaysburd, P.H. Emmons, Corrosion inhibitors and other protective systems in 398
concrete repair: Concepts or misconcepts, Cem. Concr. Compos. 26 (2004) 255–263. 399

19
doi:10.1016/S0958-9465(03)00044-1. 400
[3] C.L. Page, K.W.J. Treadaway, Aspects of the electrochemistry of steel in concrete, 401
Nature. 297 (1982) 109–115. 402
[4] S. Song, H.M. Jennings, Pore solution chemistry of alkali-activated ground granulated 403
blast-furnace slag, Cem. Concr. Res. 29 (1999) 159–170. doi:10.1016/S0008-404
8846(98)00212-9. 405
[5] S. Goto, K. Akawaza, M. Daimon, Solubility of silica-alumina gels in different pH 406
solutions, Cem. Concr. Res. 22 (1992) 1216–1223. 407
[6] J.L. Provis, S.A. Bernal, RILEM State of the Art Report, 2014. doi:10.1007/978-94-408
007-7672-2_5. 409
[7] C.K. Yip, G.C. Lukey, J.S.J. Van Deventer, The coexistence of geopolymeric gel and 410
calcium silicate hydrate at the early stage of alkaline activation, Cem. Concr. Res. 35 411
(2005) 1688–1697. doi:10.1016/j.cemconres.2004.10.042. 412
[8] J.G.S. Van Jaarsveld, J.S.J. Van Deventer, Effect of the alkali metal activator on the 413
properties of fly ash-based geopolymers, Ind. Eng. Chem. Res. 38 (1999) 3932–3941. 414
doi:10.1021/ie980804b. 415
[9] B. Mota, T. Matschei, K. Scrivener, Impact of NaOH and Na2SO4 on the kinetics and 416
microstructural development of white cement hydration, Cem. Concr. Res. 108 (2018) 417
172–185. doi:10.1016/j.cemconres.2018.03.017. 418
[10] E. L’Hôpital, B. Lothenbach, K. Scrivener, D.A. Kulik, Alkali uptake in calcium 419
alumina silicate hydrate (C-A-S-H), Cem. Concr. Res. 85 (2016) 122–136. 420
doi:10.1016/j.cemconres.2016.03.009. 421
[11] R.G. Bates, V.E. Bower, E.R. Smith, Calcium hydroxide as a highly alkaline pH 422
standard, J. Res. Natl. Bur. Stand. (1934). 56 (1956) 305–312. 423
doi:10.6028/jres.056.040. 424

20
[12] R.J. Myers, E. L’Hôpital, J.L. Provis, B. Lothenbach, Effect of temperature and 425
aluminium on calcium (alumino)silicate hydrate chemistry under equilibrium 426
conditions, Cem. Concr. Res. 68 (2015) 83–93. doi:10.1016/j.cemconres.2014.10.015. 427
[13] D.E. MacPhee, K. Luke, F.P. Glasser, E.E. Lachowski, Solubility and aging of calcium 428
silicate hydrates in alkaline solutions at 25°C, J. Am. Ceram. Soc. 72 (1989) 646–654. 429
[14] D. Rothstein, J.J. Thomas, B.J. Christensen, H.M. Jennings, Solubility behavior of Ca-, 430
S-, Al-, and Si-bearing solid phases in Portland cement pore solutions as a function of 431
hydration time, Cem. Concr. Res. 32 (2002) 1663–1671. 432
[15] A. Kumar, S. Bishnoi, K.L. Scrivener, Modelling early age hydration kinetics of alite, 433
Cem. Concr. Res. 42 (2012) 903–918. doi:10.1016/j.cemconres.2012.03.003. 434
[16] Gartner, F.J. Tang, S.J. Weiss, Saturation factors for calcium hydroxide and calcium 435
sulfates in fresh Portland cement pastes, J. Am. Ceram. Soc. 68 (1985) 667–673. 436
doi:10.1111/j.1151-2916.1985.tb10122.x. 437
[17] G. Plusquellec, M.R. Geiker, J. Lindgård, J. Duchesne, B. Fournier, K. De Weerdt, 438
Determination of the pH and the free alkali metal content in the pore solution of 439
concrete: Review and experimental comparison, Cem. Concr. Res. 96 (2017) 13–26. 440
doi:10.1016/j.cemconres.2017.03.002. 441
[18] P. Debye, E. Huckel, Zur Theorie der Elektrolyte, Z. Phys. 24 (1923) 185–206. 442
[19] H.C. Helgeson, D.H. Kirkham, G.C. Flowers, Theoretical prediction of the 443
thermodynamic behavior of-aqueous electrolytes at high pressures and temperatures: 444
IV. Calculation of activity coefficients, osmotic coefficients, and apparent molal and 445
standard and relative partial molal properties to 600C, Am. J. Sci. 281 (1981) 1249–446
1516. 447
[20] M. Robson Wright, Chapter 10: Concepts and Theory of Non-Ideality, in: An Introd. 448
to Aqueous Electrolyte Solut., Wiley, 2007: pp. 349–420. 449
21
[21] J.F. Zemaitis, D.M. Clark, M. Rafal, N.C. Scrivner, Handbook of Aqueous Electrolyte 450
Thermodynamics, 1986. 451
[22] M. Born, Volumen und hydratationswärme der ionen, Zeitschrift Für Phys. 1 (1920) 452
45–48. 453
[23] N. Bjerrum, Neuere Anschauungen über Elektrolyte, Berichte Der Dtsch. Chem. 454
Gesellschaft. 62 (1929) 1091–1103. 455
[24] I. Grenthe, A. V. Plyasunov, K. Spahiu, Chapter IX: Estimations of Medium Effects on 456
Thermodynamic Data, 1997. 457
[25] M. Wang, Y. Zhang, M. Muhammed, Critical evaluation of thermodynamics of 458
complex formation of metal ions in aqueous solutions I. A description of evaluation 459
methods, Hydrometallurgy. 45 (1997) 21–36. 460
[26] C.W. Davies, Ion Association, Butterworth and Co, 1962. 461
[27] A.H. Truesdell, B.F. Jones, WATEQ: A computer program for calculating chemical 462
equilibria of natural waters, Jour. Res. US Geol. Surv. 2 (1974) 233–248. 463
[28] K.S. Pitzer, Thermodynamics of electrolytes. I. Theoretical basis and general 464
equations, J. Phys. Chem. 77 (1973) 268–277. doi:10.1021/j100621a026. 465
[29] R.P. Buck, S. Rondini, A.K. Covington, F.G.K. Baucke, C.M.A. Brett, M.J.T. Milton, 466
T. Mussini, R. Naumann, K.W. Pratt, P. Spitzer, G.S. Wilson, Measurement of pH: 467
Definition, Standards, and Procedures (IUPAC Recommendations 2002 ), Pure Appl. 468
Chem. 74 (2002) 2169–2200. 469
[30] A.K. Covington, Chapter 5: Glass Electrodes, in: Ion Sel. Electrode Methodol. Vol 1, 470
CRC Press, 1979: pp. 77–84. 471
[31] G. Eisenman, Chapter 3: The dependence of glass-electrode on composition, in: Glas. 472
Electrodes Hydrog. Other Cations, New York, 1967: pp. 51–100. 473
[32] M. Cremer, Uber die ursache der elektromotorischen eigenschaften der gewebe 474

22
zugleich ein beitrag zur lehre von den polyphasischen elektrolytketten, Z Biol. 47 475
(1906) 562–608. 476
[33] D.A. Skoog, D.M. West, Fundamentals of Analytical Chemistry, 3rd ed., 1976. 477
[34] B.P. Nicolsky, M.M. Shultz, A.A. Belijustin, A.A. Lev, Chapter 6: Ion exchange 478
theory of the glass electrodes, in: G. Eisenman (Ed.), Glas. Electrodes Hydrog. Other 479
Cations, 1967: pp. 174–222. 480
[35] F.G.K. Baucke, The modern understanding of the glass electrode response, Fresenius. 481
J. Anal. Chem. 349 (1994) 582–596. doi:10.1007/BF00323462. 482
[36] K.L. Cheng, Capacitor theory for nonfaradaic potentiometry, Microchem. J. 42 (1990) 483
5–24. 484
[37] R.G. Bates, Determination of pH, in: 2nd ed., Wiley, New York, 1973: p. 365. 485
[38] K. Oláh, On the theory of the alkaline error of the glass electrode, Period. Polytech. 486
Chem. Eng. 4 (1960) 141–156. 487
[39] B.P. Nicolsky, Theory of the glass electrode. I., Zh Fis Khim. 10 (1937) 495. 488
[40] A.D. Wiesner, L.E. Katz, C. Chen, The impact of ionic strength and background 489
electrolyte on pH measurements in metal ion adsorption experiments, J. Colloid 490
Interface Sci. 301 (2006) 329–332. doi:10.1016/j.jcis.2006.05.011. 491
[41] J. Schott, O.S. Pokrovsky, E.H. Oelkers, The link between mineral 492
dissolution/precipitation kinetics and solution chemistry, Rev. Mineral. Geochemistry. 493
70 (2009) 207–258. doi:10.2138/rmg.2009.70.6. 494
[42] P. V. Brady, J. V. Walther, Controls on silicate dissolution rates in neutral and basic 495
pH solutions at 25°C, Geochim. Cosmochim. Acta. 53 (1989) 2823–2830. 496
doi:10.1016/0016-7037(89)90160-9. 497
[43] E.H. Oelkers, J. Schott, J.L. Devidal, The effect of aluminum, pH, and chemical 498
affinity on the rates of aluminosilicate dissolution reactions, Geochim. Cosmochim. 499
23
Acta. 58 (1994) 2011–2024. doi:10.1016/0016-7037(94)90281-X. 500
[44] I. Baur, P. Keller, D. Mavrocordatos, B. Wehrli, C.A. Johnson, Dissolution-501
precipitation behaviour of ettringite, monosulfate, and calcium silicate hydrate, Cem. 502
Concr. Res. 34 (2004) 341–348. doi:10.1016/j.cemconres.2003.08.016. 503
[45] A. Gabrisová, J. Havlica, S. Sahu, Stability of calcium sulphoaluminate hydrates in 504
water solutions with various pH values, Cem. Concr. Res. 21 (1991) 1023–1027. 505
doi:10.1016/0008-8846(91)90062-M. 506
[46] P. Juilland, E. Gallucci, R. Flatt, K. Scrivener, Dissolution theory applied to the 507
induction period in alite hydration, Cem. Concr. Res. 40 (2010) 831–844. 508
doi:10.1016/j.cemconres.2010.01.012. 509
[47] J.L. Provis, P. Duxson, G.C. Lukey, F. Separovic, W.M. Kriven, J.S.J. Van Deventer, 510
Modeling speciation in highly concentrated alkaline silicate solutions, Ind. Eng. Chem. 511
Res. 44 (2005) 8899–8908. doi:10.1021/ie050700i. 512
[48] R.J. Myers, S.A. Bernal, J.L. Provis, A thermodynamic model for C-(N-)A-S-H gel: 513
CNASH-ss. Derivation and validation, Cem. Concr. Res. 66 (2014) 27–47. 514
doi:10.1016/j.cemconres.2014.07.005. 515
[49] H. Matsuyama, J.F. Young, Effects of pH on precipitation of quasi-crystalline calcium 516
silicate hydrate in aqueous solution, Adv. Cem. Res. 12 (2000) 29–33. 517
doi:10.1680/adcr.2000.12.1.29. 518
[50] I. García Lodeiro, D.E. Macphee, A. Palomo, A. Fernández-Jiménez, Effect of alkalis 519
on fresh C–S–H gels. FTIR analysis, Cem. Concr. Res. 39 (2009) 147–153. 520
doi:10.1016/j.cemconres.2009.01.003. 521
[51] B. Lothenbach, E. Bernard, U. Mäder, Zeolite formation in the presence of cement 522
hydrates and albite, Phys. Chem. Earth. 99 (2017) 77–94. 523
doi:10.1016/j.pce.2017.02.006. 524

24
[52] K.L. Cheng, D.M. Zhu, On calibration of pH meters, Sensors. 5 (2005) 209–219. 525
doi:10.3390/s5040209. 526
[53] T. Thoenen, W. Hummel, U.R. Berner, E. Curti, The PSI/Nagra Chemical 527
Thermodynamic Database 12/07, Villigen PSI, Switzerland, 2014. 528
[54] T. Poinot, M.E. Laracy, C. Aponte, H.M. Jennings, J.A. Ochsendorf, E.A. Olivetti, 529
Beneficial use of boiler ash in alkali-activated bricks, Resour. Conserv. Recycl. 128 530
(2018) 1–10. doi:10.1016/j.resconrec.2017.09.013. 531
[55] S. Licht, pH measurement in concentrated alkaline solutions, Anal. Chem. 57 (1985) 532
514–519. doi:10.1021/ac50001a045. 533
[56] Y. Marcus, Ionic radii in aqueous solutions, J. Solution Chem. 12 (1983) 271–275. 534
doi:10.1007/BF00646201. 535
[57] M. Dole, B.Z. Wiener, The theory of the glass electrode. IV. Temperature studies of 536
the glass electrode error, Trans. Electrochem. Soc. 72 (1937) 107–127. 537
[58] G.M. Anderson, D.A. Crerar, Thermodynamics in Geochemistry, Oxford University 538
Press, 1993. 539
540