methodology to estimate energy savings in buildings within etsap-tiam
TRANSCRIPT
Methodology to estimate energy savings in buildings within ETSAP-TIAM
Cristian Cabrera [email protected]
Research Assistant
Energy Systems Analysis
Systems Analysis Division
DTU Management Engineering, Technical University of Denmark
Outline
1) Introduction
2) Objective
3) Methodology
4) Example
5) Discussion

DTU Management Engineering, Technical University of Denmark
Introduction
• Buildings account for about a third total global final energy demand and about 30% of global energy-related CO2 emissions (Ürge-Vorsatz, et al. 2012).
• The European Union, the United States, China and India combined account for more than 60% of the 2005 final building energy use (Ürge-Vorsatz, et al. 2012).
• More than 50% of the current global building stock will still be standing in 2050; in OECD countries, that figure is closer to 75% (IEA, 2013b). Therefore building retrofit might play an important role to reducing the future space heating and cooling demand.

DTU Management Engineering, Technical University of Denmark
Technical and political measures
Regional priorities in building sector. Red indicates immediate priority, while gold indicates second priority (IEA, 2013b).
The same measure could have a different impact on regions.

DTU Management Engineering, Technical University of Denmark
Building envelope components and function
The building envelope is critical to reducing heating and cooling loads, but this is onlyone of the functions it performs.
Building envelope components and function (IEA, 2013b).
It is the physical separator between the conditioned and unconditioned environment of a building including the resistance to air, water, heat, light, and noise.

DTU Management Engineering, Technical University of Denmark
Objective
Determination of technical energy savings potential and its contribution to mitigate green house gases (GHG) emissions in residential and commercial buildings due to retrofitting of building envelopes.
DTU Management Engineering, Technical University of Denmark
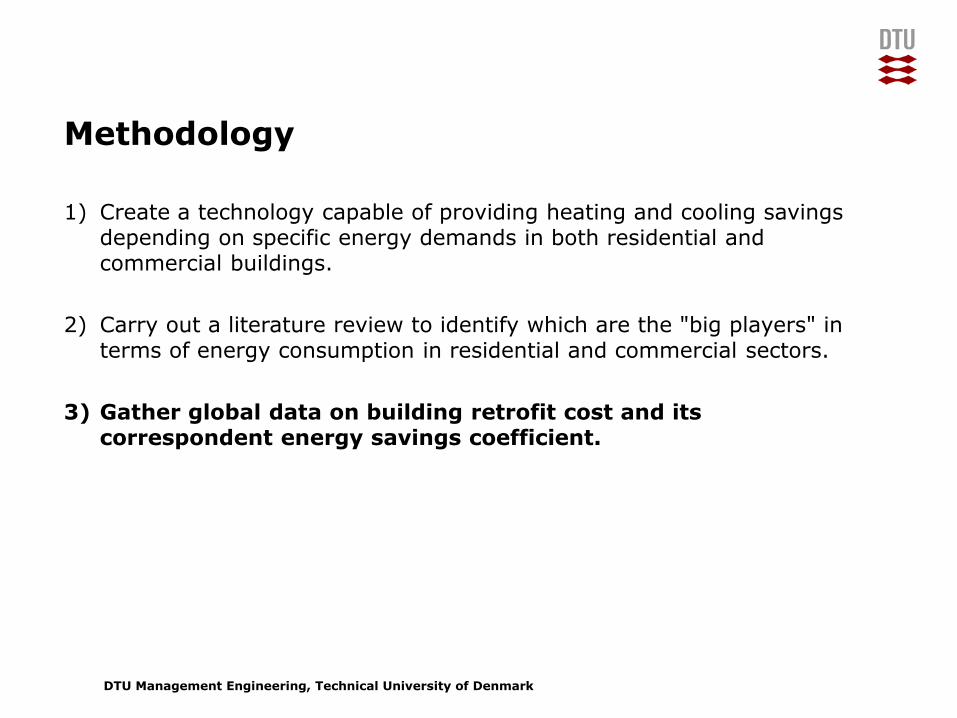
Methodology
1) Create a technology capable of providing heating and cooling savings depending on specific energy demands in both residential and commercial buildings.
2) Carry out a literature review to identify which are the "big players" in terms of energy consumption in residential and commercial sectors.
3) Gather global data on building retrofit cost and its correspondent energy savings coefficient.

DTU Management Engineering, Technical University of Denmark
Input data and equations formulated
Input data
𝑀𝐶𝑖 Energy savings measurecost in [$/m2], i=1…n
𝑆c Energy savings coefficient in [%]
𝑇𝑓𝑎 Total heated/cooled floor area in [million m2]
𝑇𝑒𝑐 Total annual space heating and cooling energy consumption in [PJ]
Equations
Retrofit cost:
𝑅𝑐 = 𝑖=1𝑛 𝑀𝐶𝑖 ∗ 𝑇𝑓𝑎 [1]
Total annual energy saved:
𝑇𝑒𝑠 = 𝑇𝑒𝑐 ∗ 𝑆𝑐 [2]
Total specific energy saving cost is:
Tsc =𝑅𝑐
𝑇𝑒𝑠[3]
Upper bound for annual energy savings in residential buildings:
𝑅𝐸𝑆𝐻𝑆 + 𝑅𝐸𝑆𝐶𝑆 ≤ 𝑇𝑒𝑠 = 𝑈𝑃𝐵𝑁𝐷 [4]
DTU Management Engineering, Technical University of Denmark
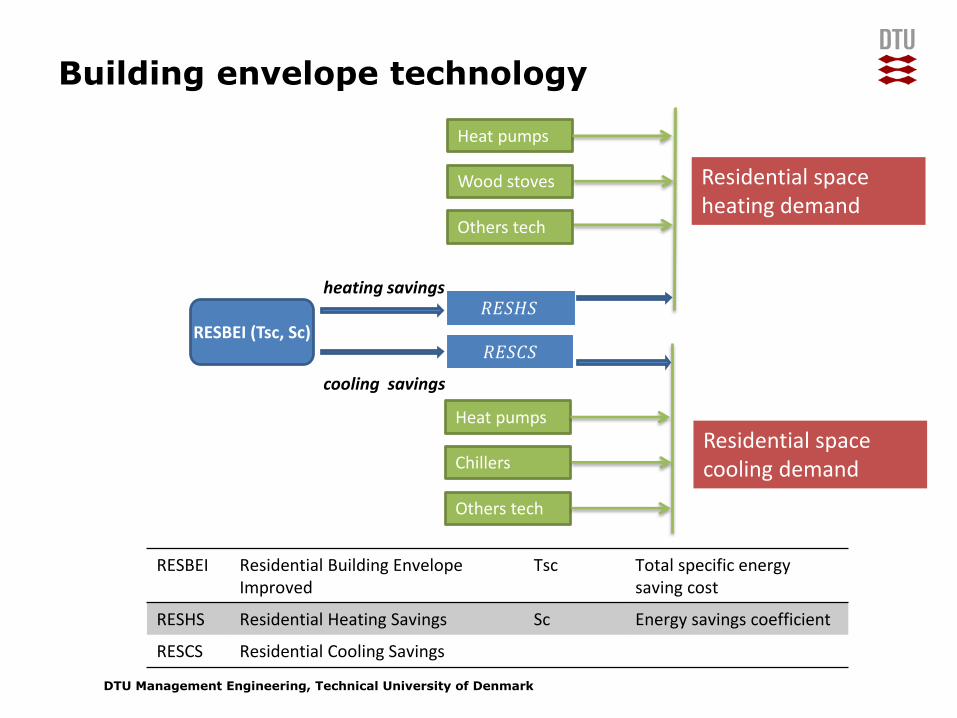
Building envelope technology
RESBEI Residential Building Envelope Improved
Tsc Total specific energy saving cost
RESHS Residential Heating Savings Sc Energy savings coefficient
RESCS Residential Cooling Savings
RESBEI (Tsc, Sc)
COMBEI
𝑅𝐸𝑆𝐻𝑆
𝑅𝐸𝑆𝐶𝑆
Heat pumps
Chillers
Others tech
Residential space heating demand
Residential space cooling demand
Heat pumps
Wood stoves
Others tech
heating savings
cooling savings
DTU Management Engineering, Technical University of Denmark
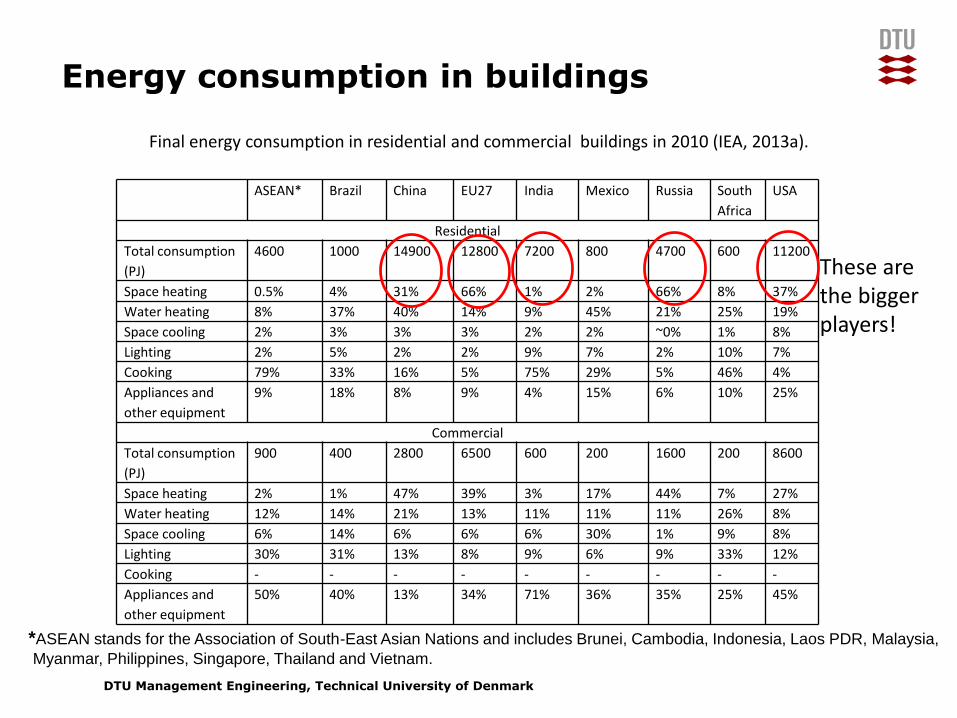
Energy consumption in buildings
ASEAN* Brazil China EU27 India Mexico Russia South
Africa
USA
Residential
Total consumption
(PJ)
4600 1000 14900 12800 7200 800 4700 600 11200
Space heating 0.5% 4% 31% 66% 1% 2% 66% 8% 37%
Water heating 8% 37% 40% 14% 9% 45% 21% 25% 19%
Space cooling 2% 3% 3% 3% 2% 2% ~0% 1% 8%
Lighting 2% 5% 2% 2% 9% 7% 2% 10% 7%
Cooking 79% 33% 16% 5% 75% 29% 5% 46% 4%
Appliances and
other equipment
9% 18% 8% 9% 4% 15% 6% 10% 25%
Commercial
Total consumption
(PJ)
900 400 2800 6500 600 200 1600 200 8600
Space heating 2% 1% 47% 39% 3% 17% 44% 7% 27%
Water heating 12% 14% 21% 13% 11% 11% 11% 26% 8%
Space cooling 6% 14% 6% 6% 6% 30% 1% 9% 8%
Lighting 30% 31% 13% 8% 9% 6% 9% 33% 12%
Cooking - - - - - - - - -
Appliances and
other equipment
50% 40% 13% 34% 71% 36% 35% 25% 45%
*ASEAN stands for the Association of South-East Asian Nations and includes Brunei, Cambodia, Indonesia, Laos PDR, Malaysia,
Myanmar, Philippines, Singapore, Thailand and Vietnam.
Final energy consumption in residential and commercial buildings in 2010 (IEA, 2013a).
These are the bigger players!

DTU Management Engineering, Technical University of Denmark
Energy savings in residential buildings example, China 2030
Residential energy consumption (PJ)
Heating savings (%)
Cooling savings (%)
Total savings (%)
16204 2.3 0.2 2.5
Multi family building (standard in Hangzhou city) UnitFloor area per household m2/house 88.75Specific annual energy consumption kWh/m2 112.8Energy savings coefficient % 50Measures (insulated walls, improved roof and ground floor, improved windows) $/m2 24.4
Building characteristics and renovation measures (Ouyang et al, 2008).
Energy savings in residential sector (preliminary results).
DTU Management Engineering, Technical University of Denmark
Discussion
• Global data gathering process is time consuming, it is hard to find "representative data" on building envelope retrofit costs and savings associated.
• Extremely aggregated building approach, can be good as a first approximation.
• The building retrofit measures implemented in Chinese buildings stock have a larger impact on reducing space heating than space cooling demand.
DTU Management Engineering, Technical University of Denmark
Thank you for your attention!